Comparisons of Sensor Position for Electrical Capacitance ...
8
Modern Applied Science; Vol. 10, No. 4; 2016 ISSN 1913-1844 E-ISSN 1913-1852 Published by Canadian Center of Science and Education 150 Comparisons of Sensor Position for Electrical Capacitance Volume Tomography (Ecvt) Irfana Kabir Ahmad 1 , Muhammad Mukhlisin 2 & Hassan Basri 1 1 Department of Civil and Structural Engineering, Universiti Kebangsaan Malaysia, Bangi, Selangor, Malaysia 2 Department of Civil Engineering, Polytechnic Negeri Semarang, Indonesia Correspondence: Irfana Kabir Ahmad Department of Civil and Structural Engineering, Universiti Kebangsaan Malaysia (UKM), Bangi, Selangor, Malaysia. E-mail: [email protected] Received: December 9, 2015 Accepted: December 18, 2015 Online Published: February 2, 2016 doi:10.5539/mas.v10n4p150 URL: http://dx.doi.org/10.5539/mas.v10n4p150 The research is financed by Strategic Action Plan 2011 UKM and Prototype Development Research Grant from Ministry of Higher Education, Malaysia. Abstract Tomography is a technique used to produce true reconstructed images from signal data. This data projection is measured capacitance by numerous sensors located on the surface of the object at different position. Sensitivity matrix with three-dimensional variation, especially in axial (z-axiz) direction are required for imaging a three-dimensional object to differentiate the depth along the sensor length so that the electrical field intensity can be distributed equally all over the three dimension space. In ECVT, when a dielectric material is introduced into the vessel, the variation in the electrical capacitance between all possible combinations of electrodes are measured. These changes are caused by diference in the permittivity of that material. From these capacitance measurements, an image based on the variation of the permittivity of the cross section contents can be obtained. In this study a numerical model using combine COMSOL MULTIPHYSICS v3.5 and MATLAB 2008a for imaging of an object was developed. Three different position of rectangular sensor: 1-sided sensor, 3-sided and U-shape sensor was designed and analyzed. 1-sided sensor displayed comparatively more uniform in both radial and axial direction in the comparisons of sensitivity distribution. Keywords: ECVT, 3-D volume imaging, 3-D sensitivity matrix, 3-D sensor capacitance 1. Introduction The development of industrial process tomography systems for measurement and control has been growth by the complex nature of industrial processes (Xie et al., 1992). In particular, Electrical Capacitance Tomography (ECT) systems have been the subject of recent research toward developing a safe, affordable, fast, and reliable industrial imaging tool (Cao et al., 2009; Wang et al., 2010). ECT has developed successfully after reconstruction of data into 3D from 2D, and currently 3D data reconstruction are able in the real time. This new method in the existing ECT system which is able to reconstruct 3D data not just by combining the 2D data but has a volumetric and real time namely ECVT have made capacitance tomography is the most promising technique for imaging purpose in the industry today. ECVT technology is based on developing nonlinear distributions of electric field lines to recreate a volume image of different materials in the imaging domain (Plaskowski & Beck 1988; Warsito et al., 2007). ECVT system are features like low profile and flexibility of capacitance sensors, increasing number of imaging frames per second, and quite low cost have surged the tomography technology to the top of the list of industrial imaging tools. The development of ECVT includes of sensor design, electronics hardware and image reconstructions. In this study, the main focusing of the research is on the position of the sensor capacitance. According to Wang et al. (2010), ECVT helps in other imaging technologies in term of real time 3D feature, applicability to complex geometries, reduce cost and low profile sensors and this 3D sensor information will be presented with different sensor formations, dimensions and positions. There are many research conducted on sensor design (Yang, 2010; Yang & Liu, 1999) the usage of external and internal electrodes, the number and length of electrode, various earthed screen, driven guard electrodes, the effect of temperature and pressure to the
Transcript of Comparisons of Sensor Position for Electrical Capacitance ...

Modern Applied Science; Vol. 10, No. 4; 2016 ISSN 1913-1844 E-ISSN 1913-1852
Published by Canadian Center of Science and Education
150
Comparisons of Sensor Position for Electrical Capacitance Volume Tomography (Ecvt)
Irfana Kabir Ahmad1, Muhammad Mukhlisin2 & Hassan Basri1 1 Department of Civil and Structural Engineering, Universiti Kebangsaan Malaysia, Bangi, Selangor, Malaysia 2 Department of Civil Engineering, Polytechnic Negeri Semarang, Indonesia Correspondence: Irfana Kabir Ahmad Department of Civil and Structural Engineering, Universiti Kebangsaan Malaysia (UKM), Bangi, Selangor, Malaysia. E-mail: [email protected] Received: December 9, 2015 Accepted: December 18, 2015 Online Published: February 2, 2016 doi:10.5539/mas.v10n4p150 URL: http://dx.doi.org/10.5539/mas.v10n4p150 The research is financed by Strategic Action Plan 2011 UKM and Prototype Development Research Grant from Ministry of Higher Education, Malaysia. Abstract Tomography is a technique used to produce true reconstructed images from signal data. This data projection is measured capacitance by numerous sensors located on the surface of the object at different position. Sensitivity matrix with three-dimensional variation, especially in axial (z-axiz) direction are required for imaging a three-dimensional object to differentiate the depth along the sensor length so that the electrical field intensity can be distributed equally all over the three dimension space. In ECVT, when a dielectric material is introduced into the vessel, the variation in the electrical capacitance between all possible combinations of electrodes are measured. These changes are caused by diference in the permittivity of that material. From these capacitance measurements, an image based on the variation of the permittivity of the cross section contents can be obtained. In this study a numerical model using combine COMSOL MULTIPHYSICS v3.5 and MATLAB 2008a for imaging of an object was developed. Three different position of rectangular sensor: 1-sided sensor, 3-sided and U-shape sensor was designed and analyzed. 1-sided sensor displayed comparatively more uniform in both radial and axial direction in the comparisons of sensitivity distribution. Keywords: ECVT, 3-D volume imaging, 3-D sensitivity matrix, 3-D sensor capacitance 1. Introduction The development of industrial process tomography systems for measurement and control has been growth by the complex nature of industrial processes (Xie et al., 1992). In particular, Electrical Capacitance Tomography (ECT) systems have been the subject of recent research toward developing a safe, affordable, fast, and reliable industrial imaging tool (Cao et al., 2009; Wang et al., 2010). ECT has developed successfully after reconstruction of data into 3D from 2D, and currently 3D data reconstruction are able in the real time. This new method in the existing ECT system which is able to reconstruct 3D data not just by combining the 2D data but has a volumetric and real time namely ECVT have made capacitance tomography is the most promising technique for imaging purpose in the industry today. ECVT technology is based on developing nonlinear distributions of electric field lines to recreate a volume image of different materials in the imaging domain (Plaskowski & Beck 1988; Warsito et al., 2007). ECVT system are features like low profile and flexibility of capacitance sensors, increasing number of imaging frames per second, and quite low cost have surged the tomography technology to the top of the list of industrial imaging tools. The development of ECVT includes of sensor design, electronics hardware and image reconstructions. In this study, the main focusing of the research is on the position of the sensor capacitance. According to Wang et al. (2010), ECVT helps in other imaging technologies in term of real time 3D feature, applicability to complex geometries, reduce cost and low profile sensors and this 3D sensor information will be presented with different sensor formations, dimensions and positions. There are many research conducted on sensor design (Yang, 2010; Yang & Liu, 1999) the usage of external and internal electrodes, the number and length of electrode, various earthed screen, driven guard electrodes, the effect of temperature and pressure to the

www.ccsenet.org/mas Modern Applied Science Vol. 10, No. 4; 2016
151
sensor, twin plane sensor and limitations in diameter. ECVT sensors mostly are circular but to suit for specific applications some of ECVT sensors in the different shape have been developed. For example in the power industry, reported by Yutani et al. (1983), square sensors have been developed because most of circulating fluidized beds are square rather than circular and this beds are used to clean coal combustion. Based on 3D volume imaging in capacitance tomography, the electric field distribution is to have variation in radial and axial direction and distribution of the electric field in the different direction will show how the sensor is able to performance. In ECVT, due to the soft field of the electrical field, the capacitance measurement that generates information simultaneously of the volumetric properties can be made by located the different geometry and position of the sensor. Research regarding geometry shape of sensors has been reported recently by Baidillah, M. R. et al. (2012). Four different geometry sensors which are hexagonal, rectangular, trapezoid and triangular were analyzed. The finding revealed by Baidillah, M. R. et al. (2012) indicated that hexagonal sensor gives relatively more uniform sensitivity dissimilarity in both the radial and axial directions in the comparisons of sensitivity distribution. However, to the best author’s knowledge, there is no study that tries to compare between different positions of the sensors. Therefore, this study aims to experimentally investigate by designed and analyzed the result of reconstruction image for three different position of rectangular sensor to get the most optimum position of the sensor that are able to obtain a homogeneous sensitivity in axial and radial axis. The purpose to conduct this research is to use the best sensor position to differentiate recyclable material such as plastics and papers. 2. Method In EVCT, substances act as a dielectric in a capacitor and capacitance is measured by using electrodes placed around the container. Such measurement is performed by means of a capacitance sensor (Baidillah et al., 2012; Huang, 1993) made up by an electrode array around the object being observed. ECVT system start with accumulating capacitance data from electrodes located around the wall outside the box and reconstructing image based on the measured capacitance data. Poison equation is used to calculated the capacitance which this equation can be written in three-dimensional space as; ∇. ( , , )∇ ( , , ) = −ρ( , , ), (1) Where ( , , )is the permittivity distributions in the direction of x, y and z axial; ( , , )is the electrical field distributions in the direction of x, y and z axial; ρ( , , )is the charge density in the direction of x, y and z axial. The measured capacitance of the th (i is number of sensor) pair between the source and the detector electrodes is obtained by integrating Equation (1); = ∆ ∮ ( , , )∇ ( , . ) , (2)
Where ∆ is the voltage difference between the electrode pair; is the surface area enclosing the detector electrode. Equation (2) relates the dielectric constant (permittivity) distribution, ( , , ) , to calculated capacitance . The image reconstruction process is an inverse problem involving the estimation of the permittivity distribution from the measured capacitance data. Since there is no analytical method for the non-linear inverse problem, linearization using the so-called sensitivity model, Equation (3) is commonly applied (Huang et al., 1989; Warsito et al., 2007). = , (3) Where S is the sensitivity matrix. The sensitivity is approximated by , = [ ( , , ) ∙ ( , , )]/ ∙ ≠ (4) where Si,j is the sensitivity of electrode pair i and j. Ei is the electric field distribution when only the electrode i-th is activated with a voltage Vi, and Ej is the electric field distribution when only the electrode j-th is activated with a voltage Vj. Image reconstruction algorithm is then employed to predict the G with a value of C and S are already known. The simple and commonly way is by using a back projection technique. = . (5) Effects of differences arrangement of sensor position can be analyzed from the sensitivity matrix. Experiments carried out by searching the 3D sensitivity matrix based on Equation 4. The three different sensor position were simulated to obtain the image reconstruction performance. ILBP (Iterative Linear Back Propagation) was used for reconstruction algorithm with the iterations number of 100.

www.ccsenet.org/mas Modern Applied Science Vol. 10, No. 4; 2016
152
In this study three various positions that are 1-sided plane, 3-sided planes and U-shape of electrode configuration (Figure 1) were analyzed. 1-sided plane is a planar sensor where all the electrodes are placed on a plane and 3-sided sensor is a box where each of 2 side box contain 8 electrode and the surface have 16 electrodes . U-shape sensor is a half-cylindrical vessel on it with the same number of electrode. The numbers of sensor used are 32 channels and all the sensors were designed in same geometric area which is 16cm2. The measurement of boxes also illustrated in Figure 1. The present study is based on simulation experiment that uses a finite element. COMSOL MULTIPHYSICS V3.5 and MATLAB 2008a is commercial software used for finite element model to obtain the best electric field distribution. Reconstructed images for each different position of sensor are provided to compare the ability of the sensor performance.
Shape Dimension (a) (a)1-Sided
Dimension Length(l) = 35cm Width(w) = 12cm Height(h) = 20cm
(b) (b)3-Sided Dimension Length(l) = 25cm Width(w) = 20cm Height(h) = 35cm
(c) U-shape
Dimension Diameter(D) = 23cm Height(h) = 32cm
Figure 1. Design of sensor with different location of sensor (a)1-Sided (b)3-Sided and (c) U-shape
3. Results and Discussion 3.1 Effect of Different Sensor Design ECVT system basically measures the change in capacitance value due to the existence of objects in the sensors. Because the number of electrodes used is 32, so the total measurement of the sensor is measuring 496. The number of measurement can be calculated using the following equation: = ( − 1)/2 (6) Where M is a vector of total measurements and N is the number of electrodes used. Figure 2 shows a model of the flow of the electric field of the sensor and its influence when there are objects in the sensors. The different position of 3D capacitance sensor causes variation of electric field distribution not only in radial direction but

www.ccsenet.org/mas Modern Applied Science Vol. 10, No. 4; 2016
153
also in the axial direction. Figure 2 demonstrated three different measurements data in the form of distribution of the electric field for the three dissimilar arrangements when electrode 1 is activated and its influence when there are objects in the sensors. In Figure 2a, 2c and 2e, there is no object in the sensor, whereas in Figure 2b, 2d and 2f are the object ball in the middle of the sensor with the permittivity 80. From this figure it shows clearly that there change in electric field distribution when electrode one is activated where the electric field will move from high potential to low potential. By looking at the sensor with an object in it, lines of force of the electric field of three different position sensor change due to the object in the middle of the sensor. This verified the influence of an object with a certain permittivity on the electric field of the sensor ECVT. Due to the object at the middle of the sensor, the total electrical load placed on the receiver electrodes will also change. This change of a parameter will measure as capacitance in ECVT system. Based on Figure 3 it can be seen roughly that the distribution of dielectric changes quite significantly from the two sensor arrangement. However the actual value can be obtain from the sensitivity matrix shown in Figure 3 which is calculated using Equation 4.
Figure 2. Electrical Field Distribution When Sensor 1 is activated (a) 1-sided sensor position without object (b)
1-sided sensor position with a ball as object (c) 3-sided sensor position without object (d) 3-sided sensor position with a ball as object (e) u-shape sensor position without object (f) u-shape sensor position with a ball as object
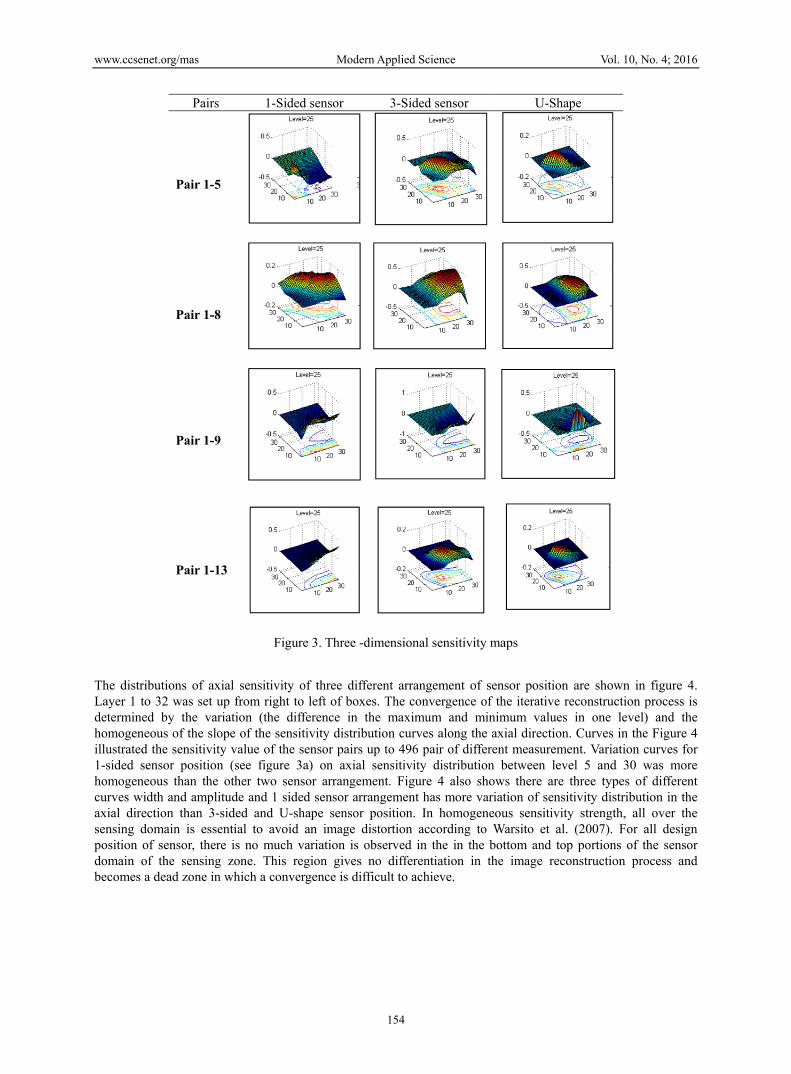
The sensitivity maps for the three different position of sensor are plotted in Figure 3, clearly shows in three dimensional spaces of normalized sensitivity distribution. Pair 1-5 means the measurement of sensitivity map between electrode number 1 and electrode number 5. From this figure can be seen that the three position of sensor has comparable axial and radial sensitivity variation in three dimensions. it is equal to have sensitivity strength all over the sensing domain in order to avoid an image distortion in the reconstruction result due to inequality in the sensitivity strength distribution. As seen in the figure 2, magnitude of the sensitivity almost same among the three different position of the sensor except for 3-sided sensor pair 1-8 and it does not affect significantly the image reconstruction process, but it relates largely to the signal to noise ratio (SNR) in the capacitance measurement. The three position sensor provide almost the same radial resolution all over the plane, nevertheless, the axial resolution slightly differs in every plane.
www.ccsenet.org/mas Modern Applied Science Vol. 10, No. 4; 2016
154
Pairs 1-Sided sensor 3-Sided sensor U-Shape Pair 1-5
Pair 1-8
Pair 1-9
Pair 1-13
Figure 3. Three -dimensional sensitivity maps
The distributions of axial sensitivity of three different arrangement of sensor position are shown in figure 4. Layer 1 to 32 was set up from right to left of boxes. The convergence of the iterative reconstruction process is determined by the variation (the difference in the maximum and minimum values in one level) and the homogeneous of the slope of the sensitivity distribution curves along the axial direction. Curves in the Figure 4 illustrated the sensitivity value of the sensor pairs up to 496 pair of different measurement. Variation curves for 1-sided sensor position (see figure 3a) on axial sensitivity distribution between level 5 and 30 was more homogeneous than the other two sensor arrangement. Figure 4 also shows there are three types of different curves width and amplitude and 1 sided sensor arrangement has more variation of sensitivity distribution in the axial direction than 3-sided and U-shape sensor position. In homogeneous sensitivity strength, all over the sensing domain is essential to avoid an image distortion according to Warsito et al. (2007). For all design position of sensor, there is no much variation is observed in the in the bottom and top portions of the sensor domain of the sensing zone. This region gives no differentiation in the image reconstruction process and becomes a dead zone in which a convergence is difficult to achieve.

www.ccsenet.org/mas Modern Applied Science Vol. 10, No. 4; 2016
155
(a) 1-Sided Sensor
(b) 3-Sided Sensor
(c) U-shape
Figure 4. Axial sensitivity distribution for 496 independent measurements. The dead zones are indicated by the dashed line

www.ccsenet.org/mas Modern Applied Science Vol. 10, No. 4; 2016
156
3.2 Reconstruction Image Figure 4 shows images of object ball in three different position of sensor. The color bar scale from 0 to 1 is indicated the value of normalized permittivity. The blue color is means that the medium is fully low-permittivity medium (i.e. air), and the red one is full of high-permittivity medium (i.e. water). The figure illustrated reconstruction image in 3D and 2D of a ball in the three different arrangement of sensor location. The capacitance’s value of a medium is dependent with the permittivity value. Therefore, different medium made the color distribution will be different too. By putting a ball, which is set has a high-permittivity as water in the box of the three sensor made changed of the air permittivity. The changing of air permittivity value formulates the capacitance and then so do the color image are changed. Comparing the three boxes in the Figure 1, 1-sided sensor was able to image an object similar to the simulation object and has better result than the 3-sided sensor position. However results obtain from U-shape also shows the better image especially in X-Z view but not in Y-Z view. Image reconstruction from 3-sided sensor arrangement slightly different from the simulation object.
Figure 5. Reconstruction result of a simulation sphere object
4. Conclusion The present study was designed to determine the effect of different position of sensors to variations of the electric field distribution to find the optimum 3d sensor capacitance. Three different position of rectangular sensor: 1-sided sensor, 3-sidedand U-shape sensor was studied and analyzed. The most obvious finding to emerge from this study is that 1-sided sensor shows comparatively more constant of sensitivity distribution in both radial and axial direction. Simulation of sphere also showed that 1-sided sensor position produced a better image than the other sensor location. As a conclusion 1-sided sensor will be fabricate to identified recycable
www.ccsenet.org/mas Modern Applied Science Vol. 10, No. 4; 2016
157
material such as plastics and papers in a waste stream. Acknowledgments The authors would like to thank UKM for sponsoring this work under Pelan Tindakan Strategik Project UKM-PTS-097-2010 and Prototype Research Grant Scheme PRGS/1/12/TK03/UKM/02/1. References Baidillah, M. R., Mukhlisin, M., & Taruno, W. P. (2012). Comparisons of sensor geometries for electrical
capacitance volume tomography. International journal of innovative computing, information and control, 9, 4447- 4457.
Cao, Z. L., & Wang, H. (2009). Image reconstruction technique of electrical capacitance tomography for low-contrast dielectric using Calderon’s method. Measurement Science and Technology, 20, 1-13. http://dx.doi.org/10.1088/0957-0233/20/10/104027
Geldart, D., Kelsey, J. R. (1972). Use of Capacitance Probes in Gas Fluidized-Beds. Powder Tech., 6, 45-50. http://dx.doi.org/10.3390/s100301890
Huang, S. M., Plaskowski, A., Xie, C. G., & Beck, M. S. (1989). Tomographic imaging of two-component flow using capacitance sensors. Journal of Physics E: Science, 173–177. http://dx.doi.org/10.1088/0022-3735/22/3/009
Huang, S. M., Xie, C. G., Salkeld, J. A., Plaskowski, A., Thorn, R., Williams, R. A., … Beck, M. S. (1992). Process Tomography for Identification. Design and Measurement in Industrial-Systems.Powder Tech., 69, 85-92. http://dx.doi.org/10.1016/0032-5910(92)85011-J
Plaskowski, A., & Beck, M. S. (1988). Process Tomography. Przem. Chem., 67, 104-106. http://dx.doi.org/10.1016/S0924-4247(97)80082-9
Wang, F., Marasdeh, Q., Fan, L. S., & Warsito, W. (2010). Electrical capacitance Volume Tomography. Design and applications, 10, 1890-1917. http://dx.doi.org/10.2528/PIERM15011412
Warsito, W. Q., & Liang, Sh. F. (2007). Velocity measurement of multi-phase flows based on Electrical Capacitance Volume Tomography. Sensor Journal, IEEE, 7, 525-535. http://dx.doi.org/10.1109/ICSENS.2007.4388577
Warsito, W., Marashdeh, Q., & Fan, L. S. (2007). Electrical Capacitance Volume Tomography (ECVT). IEEE Sens. J., 7, 525-535. http://dx.doi.org/10.1109/JSEN.2007.891952
Xie, C. G., Huang, S. M., Hoyle, B. S., Thorn, R., Lean, C., Snowden, D., & Beck, M. S. (1992). Electrical capacitance tomography for flow imaging system model for development of image reconstruction algorithms and design of primary sensor. IEE Proceedings G., 139, 89–98. http://dx.doi.org/10.1049/ip-g-2.1992.0015
Yang, W. Q., & Liu, S. (1999). Electrical capacitance tomography with a square sensor Electron. Lett., 35, 295–296. http://dx.doi.org/10.1109/TIM.2010.2045255
Yang, W. (2010). Design of electrical capacitance tomography sensors. Measurement Science and Technology, 21, 1-13. http://dx.doi.org/10.1109/ICSENS.2007.355515
Yutani, N., Ho, T. C., & Fan, L. T. (1983). Statistical Study of the Grid Zone Behavior in a Shallow Gas-Solid Fluidized-Bed Using a Mini-Capacitance. Probe. Chem. Eng. Sci., 38, 575-582. http://dx.doi.org/10.1016/0009-2509(83)80117-1
Copyrights Copyright for this article is retained by the author(s), with first publication rights granted to the journal. This is an open-access article distributed under the terms and conditions of the Creative Commons Attribution license (http://creativecommons.org/licenses/by/3.0/).