Comparison of traditional microscopy and digitized image...
18
1 Journal of Plankton Research March 2012, Volume 34, Issue 6, Pages 470-483 http://dx.doi.org/10.1093/plankt/fbs015 Copyright © The Author 2012. Published by Oxford University Press. All rights reserved. Archimer http://archimer.ifremer.fr This is a pre-copy-editing, author-produced PDF of an article accepted for publication in Journal of Plankton Research following peer review. The definitive publisher-authenticated version is available online at: http://dx.doi.org/10.1093/plankt/fbs015 Comparison of traditional microscopy and digitized image analysis to identify and delineate pelagic fish egg spatial distribution Stéphanie Lelièvre 1 , Elvire Antajan 2, * and Sandrine Vaz 1 1 IFREMER, Laboratoire Ressources Halieutiques, CENTRE MANCHE-MER DU NORD, BP 699, 62200 BOULOGNE SUR MER, FRANCE 2 IFREMER, Laboratoire Environnement Ressources, CENTRE MANCHE-MER DU NORD, BP 699, 62200 BOULOGNE SUR MER, FRANCE The first two authors contributed equally to this study. *: Corresponding author : Elvire Antajan, email address : [email protected] Abstract: One of the problems concerning studies of fish egg distribution is the weak spatial and temporal resolution due to the workload that examination of a large number of samples would demand. Recently, the development of a new laboratory imaging system, the ZooScan, capable of obtaining relatively good resolution images enables automated zooplankton identification using supervised learning algorithms. This new approach was applied to formalin-fixed fish egg samples collected during French winter IBTS (International Bottom Trawl Surveys) in the Eastern English Channel and the Southern North Sea. Fish egg spatial distributions of seven species based on the microscope and ZooScan identifications were compared. Abundance and distribution maps of winter-spawning areas of plaice, long rough dab, cod and whiting were similar for both methods. Low identification accuracy for small size eggs was due to microscope misidentification of standards used for the ZooScan learning (dab and flounder). The potential input of such a tool to quickly acquire valuable data on identification, enumeration, size frequency distribution of fish eggs and map spawning areas is of great interest for understanding and forecasting fisheries recruitment and will support ecosystem-based management. Keywords: fish eggs, ZooScan image analysis, supervised learning method, interpolated map
Transcript of Comparison of traditional microscopy and digitized image...

1
Journal of Plankton Research March 2012, Volume 34, Issue 6, Pages 470-483 http://dx.doi.org/10.1093/plankt/fbs015 Copyright © The Author 2012. Published by Oxford University Press. All rights reserved.
Archimer http://archimer.ifremer.fr
This is a pre-copy-editing, author-produced PDF of an article accepted for publication in Journal of Plankton Research following peer review. The definitive publisher-authenticated version is available online at: http://dx.doi.org/10.1093/plankt/fbs015
Comparison of traditional microscopy and digitized image analysis to identify and delineate pelagic fish egg spatial distribution
Stéphanie Lelièvre1, Elvire Antajan2, * and Sandrine Vaz1
1 IFREMER, Laboratoire Ressources Halieutiques, CENTRE MANCHE-MER DU NORD, BP 699, 62200 BOULOGNE SUR MER, FRANCE 2 IFREMER, Laboratoire Environnement Ressources, CENTRE MANCHE-MER DU NORD, BP 699, 62200 BOULOGNE SUR MER, FRANCE The first two authors contributed equally to this study. *: Corresponding author : Elvire Antajan, email address : [email protected]
Abstract:
One of the problems concerning studies of fish egg distribution is the weak spatial and temporal resolution due to the workload that examination of a large number of samples would demand. Recently, the development of a new laboratory imaging system, the ZooScan, capable of obtaining relatively good resolution images enables automated zooplankton identification using supervised learning algorithms. This new approach was applied to formalin-fixed fish egg samples collected during French winter IBTS (International Bottom Trawl Surveys) in the Eastern English Channel and the Southern North Sea. Fish egg spatial distributions of seven species based on the microscope and ZooScan identifications were compared. Abundance and distribution maps of winter-spawning areas of plaice, long rough dab, cod and whiting were similar for both methods. Low identification accuracy for small size eggs was due to microscope misidentification of standards used for the ZooScan learning (dab and flounder). The potential input of such a tool to quickly acquire valuable data on identification, enumeration, size frequency distribution of fish eggs and map spawning areas is of great interest for understanding and forecasting fisheries recruitment and will support ecosystem-based management.
Keywords: fish eggs, ZooScan image analysis, supervised learning method, interpolated map

2
1. Introduction The egg being a critical phase in the life cycle of fish, studying changes in abundance and distribution of fish eggs is essential to interpret fish stock evolution. In recognition of this, a scientific expert committee related to the Fifth International Conference on the Protection of the North Sea (ICES, 2003) recommended regular monitoring of spawning grounds of important commercial fish species as an ecosystem-based approach to fisheries management in the North Sea. One of the main problems confronting study of spawning grounds distribution is low sampling resolution, both spatial and temporal. Although it is widely recognized that small scale sampling would be relevant to increase the accuracy of spawning ground map, the work involved in fish egg sample analysis has made it impossible to sample at very high resolution in most programs. To some extent, the lack of sampling capability can be resolved using a Continuous Underway Fish Egg Sampler (CUFES) (Checkley et al., 1997; Zwolinski et al.; 2006, Petitgas et al., 2009; Lelièvre et al., 2010), but the analysis of such amount of samples by traditional microscope observations is still a very time consuming task. However, recent advances in digital plankton image processing and pattern recognition have made automated or semi-automated coarse taxonomic level identification possible (Benfield et al. 2007). The recently developed ZooScan integrated system produces measures of zooplankton abundance, biomass and size spectra for a variety of ecological studies (Grosjean et al., 2004; Schultes and Lopes, 2009; Gorsky et al., 2010). In this study, ZooScan device was used on formalin-fixed fish eggs samples collected by the CUFES during winter International Bottom Trawl Surveys (IBTS) of 2008 and 2009 in the Eastern Channel and the Southern North Sea. Distribution of eggs of seven fish species (dab, flounder, rocklings, whiting, cod, plaice and long-rough dab) identified with the ZooScan were compared to distribution of eggs identified by traditional microscopy method. The potential input of such tool to quickly acquire valuable data on identification, enumeration, and size frequency distribution of fish eggs and map spawning areas is discussed.
2. Material and method Data collection and conservation
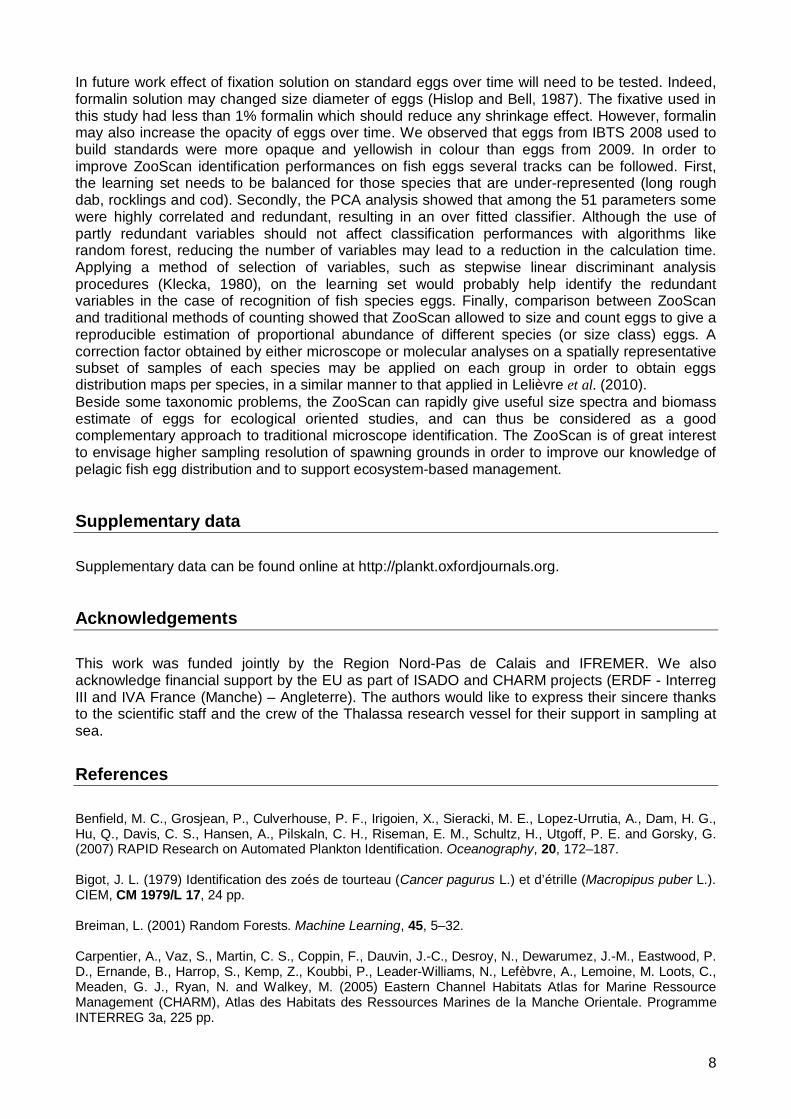
The data were collected during the French January-February International Bottom Trawl Surveys (IBTS) 2008 and 2009 on board the RV Thalassa (Fig. 1). Fish eggs were collected by the CUFES (Model C-100, Ocean Instruments Inc.). A full description of the CUFES has been provided elsewhere (Checkley et al., 1997; ICES, 2007). Essentially, seawater is continuously pumped at 5 m depth by a submersible, high volume pump mounted at the end of a pipe installed internally on the vessel, hardly edging from the hull and pumping perpendicularily to the current. To enhance the catching efficiency, a metallic scoop has been bolted on the side of the ship and is directed into the current. The flow rate continuously monitored with a flowmeter (Promag) was about 700 L. min-
1. The mesh size of the concentrator and collector was 500 μm. The samples were taken every 30 min. periods (which corresponds to approximately 21 m3 of seawater pumped), 24/24h along the vessel route, for a total of 1050 samples in 2008 and 1021 samples in 2009. Egg samples were preserved using the formalin solution described in Mastail and Battaglia (1978) modified by Bigot (1979). This solution improves the preservation of chromatophores and prevents yolk burst into the perivitellin space, which are key features for egg identification. Briefly, a solution of buthylhydroxyanisol (BHA) was made up by adding 8 g BHA to 500 mL monopropylen glycol and a solution of ethylenediaminetetraacetic acid (EDTA) was made by adding 20 g EDTA to 500 mL distilled water. Both solutions were added to two litres of commercial formalin (36%) and buffered to pH 7 with sodium glycerophosphate, while stirring. Then, 2 g ascorbic acid and distilled water were added up to 5 L to obtain a stock solution at 14.4% of formalin buffered at pH 7. Finally, the samples are preserved in sea water using 6% of the stock solution (which is enough when plankton account for ¼ of the sample volume). The resulting concentration of formalin in the sample is less than 1%.

3
Fish egg identification by microscopy Eggs were identified to species level under a binocular microscope according morphological criteria, mainly egg size (measured by a micrometer), the presence of an oil globule, and the pigmentation of the embryo in function of the stage development (Russell, 1976; Munk and Nielsen, 2005). The number of eggs counted in each sample was converted into number of eggs for a standard reference volume of 20 m3 (close to that filtered in 30min):
20×=VNNstd (1)
where: Nstd = Number of eggs per 20 m3, N = number of eggs counted, V = volume pumped (m3).
Sample digitisation with the ZooScan system CUFES samples were digitised using a ZooScan imaging system (Hydroptic-V2 model) together with dedicated image processing software ZooProcess and Plankton Identifier (Gorsky et al., 2010). Prior to digitisation of formalin fixed-samples, they were rinsed with tap water and subdivided, when necessary, using a Motoda splitter (Motoda, 1959). Samples were poured into the scanning cell (11 × 24 cm) and organisms were manually separated to minimize overlapping. Samples were scanned into a 2400 dpi, 16 bit grey digital image for archiving and then converted to an 8 bit image for processing. The final image was segmented at a default level of 243, thus keeping 243 grey levels for characterizing organisms. Objects having an equivalent circular diameter bigger than 0.3 mm were enumerated and 51 attributes (e.g., size, shape and grey-levels) were extracted from every object (see appendix 1 for a detailed description of attributes). A vignette of each object was extracted and associated measurements were saved in a text file called a PID file (Plankton Identifier file) for further identification process. After digitisation, sample was recovered and reconditioned to be archived.
Building and evaluating the classifier for automated identification Automated identification of fish eggs was made using supervised learning algorithms available in the Plankton Identifier free software (Gasparini, 2007). All supervised learning methods need a subset of objects already identified by an expert (learning set) to produce a classification model (classifier). Fish eggs identified under microscope from IBTS 2008 samples were sorted by species level and development stage to make a collection of fish eggs. These standards of eggs were scanned to obtain a learning set, i.e., a set of vignettes of sorted fish eggs together with their attributes. Two development stages were identified: stage A (early stages), without embryo, corresponding to stages IA and IB after Thompson and Riley (1981) and stage B (advanced stages) with an embryo, corresponding to stage II, III, IV and V after Thompson and Riley (1981). By default the classifier classifies all vignettes, including detritus, damaged eggs or other organisms (e.g., copepods, chaetognathes) that could have been collected with the CUFES. As we wanted to focus on fish eggs we created classes for damaged eggs per species and pooled detritus and other organisms in one class named ‘detritus’, in order to minimize bias during analysis. Only species having highest relative abundance and occurrence frequency were taken into account for building the learning set. The supervised learning method chosen to build the classifier was the Random Forest algorithm (Breiman, 2001) as it is known to give best results on zooplankton samples (Gorsky et al., 2010). The random forest method is well suited to situations involving a large number of variables to describe objects belonging to several predefined classes. This automatic method consist in choosing, at each step of an iterative process, a number of variables. Based on these variables, objects are divided into the predefined groups using a classification tree. Each node of the tree is characterized by a threshold value of a variable and each variable can be used many times in the construction of the tree. At the end of the process, a set of classification trees (forest) is obtained in which each element is associated to variables. In this forest, the tree giving the minimum number of misclassifications is selected. Such a criterion gives equal weight to all errors regardless of the class. The variables associated with this tree are then considered to be most efficient to classify objects. The performance of the classifier was

4
evaluated on an independent test set whose vignettes were not used at any time during the learning process.
Factorial analyses and classification
A Principal Component Analysis (PCA) followed by a Hierarchical Cluster Analysis (HCA) was performed on the learning set under R version 2.14 (R Development Core Team, 2005). Our objectives were to i) analyse linear interactions between the 51 ZooScan attributes, ii) identify clusters (subgroups of object in the learning set) and iii) characterise clusters with the ZooScan attributes and the identification classes that are highly representative of each cluster. The combination of PCA and cluster analysis is a common way to explore relationships among a large number of variables and to identify homogenous subgroups of instance in a population (Lebart et al. 2000). PCA describes the total inertia (or variability) of a multidimensional set of data, in a sample of fewer dimensions (or factors) that is the best summary of the information contained in the data. We computed the PCA using the 51 ZooScan attributes as continuous active variables and the identification classes as categorical supplementary (or illustrative) variable. The HCA was then performed based on the factorial coordinates supplied by the two first factors of the PCA and on the identification classes of the learning set used as pre-clusters to handle the very large dataset and to create the dendrogram from these pre-clusters. The type of HCA used here is an agglomerative clustering (based on Ward’s criterion), i.e. a procedure that successively groups the closest objects into clusters, which then are grouped into larger clusters of higher rank (Legendre and Legendre 1998).
Geostatistical analyses and interpolated map Spatial distribution of eggs were mapped using geostatistical analyses (Webster and Oliver, 2001). Geostatistics embody a suite of methods for analysing spatial data and allow the estimation of the values of a variable of interest at non-sampled locations from more or less sparse sample data points based on spatial auto-correlation between these points. The separation distance between points was calculated using longitude transformed into equivalent decimal degrees of latitude of the sampling location (2), which are of constant distance using a mercator-like projection formula.
( )180cos π×× latitudelongitude (2)
Also, abundances of the eggs were log-transformed (log (x + 1), with x the abundance of eggs for a standard volume of 20 m3), to be closer to normality. For each fish species egg and each year a variogram was calculated. The variogram is a model of the spatial auto-correlation pattern of the variable of interest that summarises how the variance of a variable changes as the distance and direction separating any two points varies. The distances between points were calculated using latitudes and corrected longitudes. In the presence of a local trend or drift, values of fish egg abundances were modelled by fitting a low-order polynomial (linear or quadratic) regression to the spatial coordinates using the least-square regression method. If the variance explained by the regression accounted for more than 20% of the total variance, the variogram was then calculated on the residuals. Four models (exponential, circular, spherical and pentaspherical) were statistically adjusted to the experimental variogram using the least-square regression to determine the nugget, sill and range parameters that characterise the shape of the variogram. The sill represents the maximum variance of the data. The range is the lag distance at which the sill is reached. It marks the limit of spatial correlation between points and describes the extent of the observed pattern. The nugget is the positive intercept of the variogram with the ordinate axis and depicts the variance between low-distance points. The model with the best visual and statistical adjustment (so, explaining the most variation) was retained as the variogram. The latter was used to estimate egg abundances on the knots of a regular grid by using the kriging interpolation method (Carpentier et al., 2005). The geostatistical analyses were made using GenStat software (GenStat Release 7.1, 2004)) on microscopic and ZooScan data obtained for each species. To compare the obtained maps, the

5
zonal relative error between microscopic and ZooScan identifications was calculated on each samples as follow:
zonalmaxµ
zµ
NNN
errorrelative−
= (3)
where, Nµ and Nz correspond to the number of eggs per 20 m3 according to microscope and ZooScan observations respectively. The absolute error was divided by the maximum abundance observed by microscope (Nµmax) in order to rescale the error as a function of the maximum permissible error, being the maximum difference that may occur between visual and zooscan identifications and to highlight areas where this error has the most impact on the evaluated abundance.
3. Results Fish eggs identified under microscope
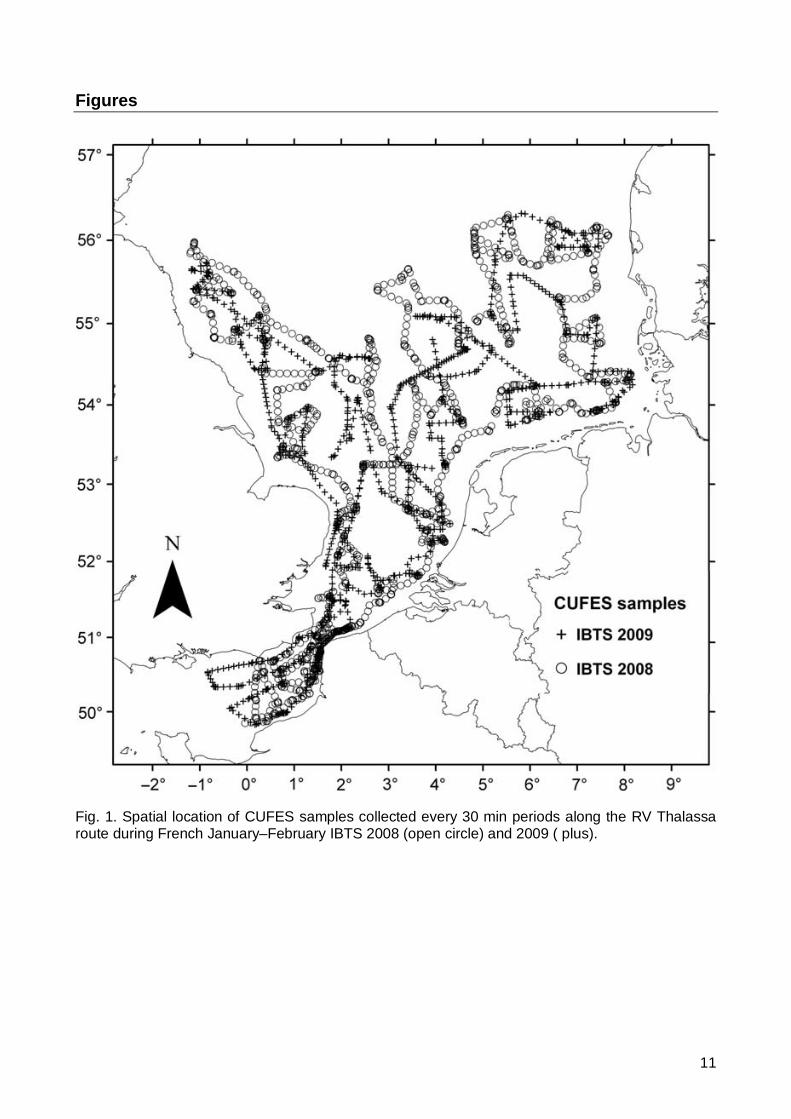
Table I lists the 16 fish species whose eggs were identified under microscope in 2008 and 2009 French IBTS with their relative abundance and frequency of occurrence. As it was difficult to accurately discriminate (using visual criteria) between the different rockling eggs (three species were identified by molecular analysis in the area, Lelièvre et al. 2010), they were pooled for mapping and making standard for ZooScan. The studied species belong to nine families, Pleuronectidae and Gadidae being the most represented. Unexpectedly, dab (Limanda limanda) and whiting (Merlangius merlangus) had the highest relative abundance and frequency of occurrence, whereas their spawning period is known to take place from March to June in the North Sea (Munk and Nielsen, 2005). In addition to dab and whiting, the following species were abundant enough to make standard for ZooScan analysis: plaice (Pleuronectes platessa), flounder (Platichthys flesus), cod (Gadus morhua), rocklings (Enchelyopus cimbrius, Ciliata mustela and C. septentrionalis), and long rough dab (Hippoglossoides platessoides).
Classifier performance Learning and test sets were composed respectively of 3276 and 2265 vignettes distributed into 21 classes (Fig. 2). The number of eggs into each class of the learning set was balanced, when possible, in order to avoid over learning of one class to another. For most of the species, 300 to 400 eggs were used, except for the long rough dab for which a bit less than 200 eggs were colleted in 2008. Best classifier performance on the test set was obtained when pooling the development stages A and B into one class in the learning set (Fig. 3). So in a first step fish eggs were identified per species without any distinction of development stages, and in a second step development stages were determined for each species separately. For the latter, classifiers allowing distinction between stage A and B was built for each species, their performance is shown in figure 4. The confusion matrix (Table II) gives an overview of performance obtained to correctly classify fish eggs from the independent test set without distinction of development stages (first step). Fish eggs of plaice, cod and whiting have a recall (rate of true positives) higher than 96% and a contamination (rate of false positive) lower than 8%. For the fish eggs of long rough dab the recall was of 86% due to the misidentification of few eggs with plaice eggs. The main confusion was observed between eggs of dab, flounder and rocklings with high contaminations (>30%) and low recalls (<80%). Damaged eggs were either well recognized or assigned into the species class to which they belonged (long rough dab, plaice, common sole). Otherwise they presented the same confusions as the species class to which they belonged (dad, flounder and rocklings). As expected fish eggs were distinguished from the detritus class with a very good accuracy (99%).
Factorial analysis and clustering on the learning set
The first two factorial axes of the PCA performed on the learning set explained ca. 65% of the total variability (inertia) in the data (Fig. 5). The position of the 51 ZooScan attributes is shown as

6
arrows along the factorial axes in the circle of correlation (Fig. 5 top), and the centroids of the identification classes (detritus and fish eggs) were simply projected into this factorial plane without participating in its computation (Fig. 5 bottom). The first factor (41.4% of the total inertia) was mainly defined by the opposition between parameters describing the circularity (circ., circexc., roundness) and grey level variability (Stdev., CV, Range) of objects on the negative side (r > 0.8) and parameters describing objects having low grey level (Mean, Mode, Median, Min, Histcum 1 and 2) and a low area compare to their perimeter or diameter (PerimAreaexc and FeretAreaexc) on the positive side (r <-0.8). So the first factor clearly opposed the detritus (such as fibres) to the fish eggs classes. The second factor (22.2% of the total inertia) was mainly defined by parameters of dimension (Perim., Major, Feret, Skelarea, Convexperim, Convexarea) and allows the distribution of fish eggs along the factorial axis according to their size. Thus, the big eggs of long rough dab and plaice are opposed to the smaller eggs of dab, flounder and rocklings along the second factor. The descriptors of the learning set objects used in the clustering were their factorial co-ordinates on the first two axes obtained in the PCA. As the additional amount of variability explained by the factorial axes decreased markedly after the first two factors, only the latter were used to identify clusters in the learning set through a HAC (Fig. 5B). Five clusters were identified. The first one corresponded to the detritus group. The second cluster, grouped together the small eggs of flounder, dab and rocklings with their corresponding damaged eggs. The third cluster, grouped together the eggs of whiting and sole. The forth cluster was intermediate to cod and the damaged eggs of whiting and sole. The last cluster corresponded to the eggs of plaice and long rough dab with their respective damaged eggs and the damaged eggs of cod. Interpolated maps
We compared distribution mapping of fish eggs for each species (all stages combined) identified under the microscope or with the ZooScan (Fig. 6). The distribution pattern of total egg abundance was similar comparing the maps based on microscope and ZooScan counting. Highest abundances were found in the eastern part of the North Sea, from French waters to the German Bight, in the English Channel, in front of the three French estuaries of Canche, Authie and Somme. The zonal relative error between microscope and ZooScan counting reached an average of 1±1%. As suspected from the confusion matrix, distribution mapping of dab, flounder and rockling eggs showed different patterns according to the method of identification. Abundance of dab eggs were lower with the ZooScan compared to microscope identifications, whereas for flounder and rocklings eggs it was the opposite. Mean relative errors for the latter was high, 12±2% and 20±40%, respectively. The same pattern of egg distribution was observed between microscope and ZooScan identification methods for cod and whiting with a mean relative error rate 3±4% and 2±3% respectively. Microscope and ZooScan identifications produced similar distribution patterns for plaice and long rough dab eggs. Both methods showed that long rough dab eggs were generally found in the north east of the study area whereas plaice eggs had a larger distribution in the North Sea and were also observed in the English Channel. The mean relative error was of 7±6% for plaice and of 2±3% for long rough dab.
4. Discussion The 16 fish species whose pelagic eggs were identified under microscope, from winter IBTS surveys in 2008 and 2009, can be divided into winter-spawning and spring-spawning species. Plaice, flounder, cod and long rough dab are winter-spawning species having highest spawning activity in February (van der Land, 1991). Eggs of dab and whiting were the most abundant and rocklings eggs were common as well, even though they are spring-spawning species having highest spawning activity in March-April. Past studies have already reported that these species may start to produce high egg abundances already in January (Desbrosses, 1943; van der Land, 1991). The other species identified under microscope were rare and their maximum spawning activity occurs normally later in spring. As we wanted to evaluate the ZooScan capacity to identify the main winter spawning areas in the Eastern English Channel and the Southern North Sea we decided to build the learning set only with the winter-spawning species and those with high

7
abundance and frequency. This may have induced minor contaminations leading to lower recognition performance when applying our classifier on the dataset. Indeed all types of object that were encountered in a sample could only be identified according to one of the categories available in the learning set (detritus group and seven fish species). But we assumed that the contamination by the other species was not significant due to their weak occurrence in the studied area in winter. The ZooScan system for plankton samples digitisation and dedicated softwares used in this study permitted a rather rapid analysis of the large number of samples collected underway by CUFES and to produce interpolated maps of the spawning grounds with high spatial resolution. CUFES samples were scanned one year later after microscope identification and few eggs may have been lost between each step of identification process (sieving, microscope sorting, and sample recovery). Moreover, ZooScan maps produced in this study did not include the damaged egg classes. These may have induced some differences of abundance between both enumeration methods. However, the similarity between maps of egg distribution (all species) obtained from microscope and ZooScan counting confirmed the validity of the ZooScan approach to have a quick estimate of egg abundance, distribution, and size spectra. A difficulty in automated plankton recognition and classification systems is the selection of the number of classes (Fernandes et al., 2009). We demonstrated that merging the development stages of fish eggs in only one class per species permitted to maximize the number of vignettes available per species and to improve the performance of good recognition of each species. In a second automatic identification step, two developmental stages (early and advanced) were determined for each species separately using dedicated learning sets, which minimized contamination risks. For the purpose of mapping spawning grounds, it is indeed preferable to identify early development stages. In the same line of thought, we chose to gather objects that were not eggs in only one class of detritus in the learning set. This allows limiting the number of vignettes to be sorted, since a class needs a minimum of 200 – 300 vignettes to be sufficiently represented in the learning set (Gorsky et al., 2010). Detritus (which also included other zooplankton taxa) were then very well distinguished from eggs, mainly on the basis of circularity parameters as shown by the PCA analysis. The factorial analysis and clustering on the learning set showed that fish eggs can be easily distinguished into small (dab, flounder and rocklings group), medium (whiting and cod group) and large (long rough dab and plaice groups) eggs based one size parameters and texture parameters. The supervised learning method used in this study, the Random Forest algorithm (Breiman, 2001), improved slightly the distinction between species, and permitted to get good recognition of long rough dab, plaice, whiting and cod eggs. For these species maps of abundance distribution patterns were comparable with both identification methods with a reasonable spatial relative error (<10%). The supervised learning method did not allow distinguishing species inside the dab, flounder and rocklings group of small eggs, giving low recalls (<80%) and high contaminations (>30%). It was demonstrated by Culverhouse et al. (2003) that in general, neither human nor machine can be expected to give highly accurate or repeatable labelling of specimens. Dab and flounder eggs, as well as cod and whiting eggs are difficult to distinguish under microscope, especially for the early stages (Taylor et al., 2002). In order to validate microscope identification of the standards used for building the learning set, molecular analyses were performed (Lelièvre et al., 2010). If 92.5% of standard dab eggs were correctly identified, only 63.8% of standard flounder eggs were, the remaining eggs (36.2%) being dab eggs. Similarly, 98% of standard cod eggs were correctly identified but only 71% of standard whiting eggs were, the remaining (29%) being of cod eggs. Then, distribution mapping of dab and cod eggs based on microscope identifications correctly illustrated spatial patterns but underestimated abundances in spawning areas, whereas abundances were overestimated for flounder and whiting eggs. This standard quality problem had serious consequences on ZooScan identification accuracy as the classifier was built including these misidentifications. A possible solution to ensure the identification quality of fish egg in standards would be to obtain eggs directly from fish spawns under experimental and aquaculture conditions. Identification of rockling eggs did not lead to confusion under microscope because of the presence of an oil globule. Unfortunately, according to the position of eggs on the scanning cell, the globule is not always visible, which makes this important egg feature not useful for image analysis. This explained why worst ZooScan identification results were obtained with this species that was confused with species of similar size class (dab and flounder).
8
In future work effect of fixation solution on standard eggs over time will need to be tested. Indeed, formalin solution may changed size diameter of eggs (Hislop and Bell, 1987). The fixative used in this study had less than 1% formalin which should reduce any shrinkage effect. However, formalin may also increase the opacity of eggs over time. We observed that eggs from IBTS 2008 used to build standards were more opaque and yellowish in colour than eggs from 2009. In order to improve ZooScan identification performances on fish eggs several tracks can be followed. First, the learning set needs to be balanced for those species that are under-represented (long rough dab, rocklings and cod). Secondly, the PCA analysis showed that among the 51 parameters some were highly correlated and redundant, resulting in an over fitted classifier. Although the use of partly redundant variables should not affect classification performances with algorithms like random forest, reducing the number of variables may lead to a reduction in the calculation time. Applying a method of selection of variables, such as stepwise linear discriminant analysis procedures (Klecka, 1980), on the learning set would probably help identify the redundant variables in the case of recognition of fish species eggs. Finally, comparison between ZooScan and traditional methods of counting showed that ZooScan allowed to size and count eggs to give a reproducible estimation of proportional abundance of different species (or size class) eggs. A correction factor obtained by either microscope or molecular analyses on a spatially representative subset of samples of each species may be applied on each group in order to obtain eggs distribution maps per species, in a similar manner to that applied in Lelièvre et al. (2010). Beside some taxonomic problems, the ZooScan can rapidly give useful size spectra and biomass estimate of eggs for ecological oriented studies, and can thus be considered as a good complementary approach to traditional microscope identification. The ZooScan is of great interest to envisage higher sampling resolution of spawning grounds in order to improve our knowledge of pelagic fish egg distribution and to support ecosystem-based management. Supplementary data Supplementary data can be found online at http://plankt.oxfordjournals.org. Acknowledgements This work was funded jointly by the Region Nord-Pas de Calais and IFREMER. We also acknowledge financial support by the EU as part of ISADO and CHARM projects (ERDF - Interreg III and IVA France (Manche) – Angleterre). The authors would like to express their sincere thanks to the scientific staff and the crew of the Thalassa research vessel for their support in sampling at sea.
References Benfield, M. C., Grosjean, P., Culverhouse, P. F., Irigoien, X., Sieracki, M. E., Lopez-Urrutia, A., Dam, H. G., Hu, Q., Davis, C. S., Hansen, A., Pilskaln, C. H., Riseman, E. M., Schultz, H., Utgoff, P. E. and Gorsky, G. (2007) RAPID Research on Automated Plankton Identification. Oceanography, 20, 172–187. Bigot, J. L. (1979) Identification des zoés de tourteau (Cancer pagurus L.) et d’étrille (Macropipus puber L.). CIEM, CM 1979/L 17, 24 pp. Breiman, L. (2001) Random Forests. Machine Learning, 45, 5–32. Carpentier, A., Vaz, S., Martin, C. S., Coppin, F., Dauvin, J.-C., Desroy, N., Dewarumez, J.-M., Eastwood, P. D., Ernande, B., Harrop, S., Kemp, Z., Koubbi, P., Leader-Williams, N., Lefèbvre, A., Lemoine, M. Loots, C., Meaden, G. J., Ryan, N. and Walkey, M. (2005) Eastern Channel Habitats Atlas for Marine Ressource Management (CHARM), Atlas des Habitats des Ressources Marines de la Manche Orientale. Programme INTERREG 3a, 225 pp.

9
Checkley, D. M., Jr, Ortner, P. B., Settle, L. R. and Cummings, S. R.(1997) A continuous, underway fish egg sampler, Fish. Oceanogr, 6, 58–73. Culverhouse, P. F., Wiliams, R., Reguera, B., Herry, V. and Gonzalez-Gill, S. (2003) Do experts make mistakes? A comparison of human and machine identification of dinoflagellates, Mar. Ecol. Prog. Ser., 247, 17–25. Desbrosses, P. (1943) Le merlan (Cadus merlangus L.) de la cote française de l'atlantique. Revue des Travaux de l'Institut des Pêches Maritimes, 13, 177–195. Fernandes J. A., Irigoien, X., Boyra, G., Lozano, J. A. and Inza, I. (2009) Optimizing the number of classes in automated zooplankton classification. J. Plankton Res., 31, 19–29. Gasparini, S. (2007) PLANKTON IDENTIFIER: a software for automatic recognition of planktonic organisms., http://www.obs-vlfr.fr/gaspari/Plankton_Identifier/index.php. GenStat Release 7.1 Copyright. (2004) Lawes Agricultural Trust (Rothamsted Experimental Station) In: Payne, R. W., Hardings, S. A, Maurray, D. A., Soutar, D. M., Baird, D. B., Welham, S. J., Kane, A. F., Gilmour, A. R., Thompson, R., Webster, R. and Tunnicliffe W. G. (eds), VSN International, Wilkinson House, Jordan Hill Road, Oxford, UK. Gorsky, G., Ohman, M. D., Picheral, M., Gasparini, S., Stemmann, L., Romagnan, J. B., Cawood, A., Pesant, S., Garcia-Comas, C. and Prejger F. (2010) Digital zooplankton image analysis using the ZooScan integrated system, J. Plankton Res., 32, 285–303. Grosjean, P., Picheral, M., Warembourg, C., and Gorsky, G. (2004). Enumeration, measurement, and identification of net zooplankton samples using the ZOOSCAN digital imaging system. ICES J. mar. Sci., 61, 518–525. Hislop, J.R.G. and Bell, M.A. (1987) Observations on the size, dry weight and energy content of the eggs of some demersal fish species from British marine waters. Journal of Fish Biology, 31: 1-20. ICES. (2003) Report of the Regional Ecosystem Study Group for the North Sea, 4–7 April 2003, Nantes, France. ICES, CM 2003/ACE:04, 30 pp.
ICES. (2007) Report of the Working Group on Acoustic and Egg Surveys for Sardine and Anchovy in ICES Areas VIII and IX (WGACEGG), 26–30 November 2007, Palma de Mallorca, Spain. ICES, CM 2007/LRC:16, 167 pp.
Klecka, W. R. (1980) Discriminant Analysis. Sage University Paper series on Quantitative Applications in the Social Sciences, Vol. 19, Beverly Hills, CA, 73 pp.
Lebart, L., Morineau, A. and Piron, M. (2000) Statistique exploratoire multidimensionnelle. Dunod, Paris. 439 pp.
Legendre, P. and Legendre, L. (1998) Numerical Ecology. 2nd English edition. Elsevier Science BV, Amsterdam, xv + 853 pp.
Lelièvre, S., Verrez-Bagnis, V., Jérôme, M. and Vaz, S. (2010) PCR-RFLP analyses of formalinfixed fish eggs for the mapping of spawning areas in the Eastern Channel and Southern North Sea. J. Plankton Res., 32, 1527–1539.
Mastail, M. and Battaglia, A. (1978) Amélioration de la conservation des pigments du zooplancton, CIEM, CM 1978/L 20, 5 pp. Motoda, S. (1959) Devices of simple plankton apparatus. Memoir, Faculty of Fisheries, Hokkaido University, 7, 73–94. Munk, P. and Nielsen, J. G. (2005) Egg and larvae of North Sea fishes. Biofolia, Denmark, 215 pp.

10
Petitgas, P., Goarant, A., Masse, J., Bourriau, P. (2009) Combining acoustic and CUFES data for the quality control of fish-stock survey estimates. ICES J. Mar. Sci., 66, 1–7. R Development Core Team (2005). R: A language and environment for statistical computing. R Foundation for Statistical Computing, Vienna, Austria. ISBN 3-900051-07-0, URL http://www.R-project.org. Russell, F. S. (1976) The Egg and planktonic stages of British marine fishes. Academic Press inc Ltd, London, 524 pp. Schultes, S. and Lopes, R. B. (2009) Laser optical plankton counter and ZooScan intercomparison in tropical and subtropical marine ecosystems. Limnol. Oceanogr. Methods, 7, 771–784. Taylor, M. I., Fox, C. J., Rico, I. and Rico, C. (2002) Species specific TaqMan probes for simultaneous identification of cod (Gadus morhua L.), haddock (Melanogrammus aeglefinus L.) and whiting (Merlangius merlangus L.). Mol. Ecol. Notes, 2, 599–601. Thompson, B. M., Riley, J. D. (1981) Egg and larval development studies in the North Sea cod (Gadus morhua L.). Rapports et Procès-Verbaux des Réunions du Conseil International pour l'Exploration de la Mer, 17: 553-559. van der Land, M. A. (1991) Distribution of flatfish eggs in the 1989 egg surveys in the south eastern North Sea, and mortality of plaice and sole eggs. Neth. J. Sea Res., 27, 277–286. Webster, R. and Oliver, M. A. (2001) Geostatistics for Environmental Scientists. Wiley, Chichester, 271 pp. Zwolinski J., Mason, E., Oliveira, P. B. and Stratoudakis, Y. (2006) Fine-scale distribution of sardine (Sardina pilchardus) eggs and adults during a spawning event. J. Sea Res., 56, 294–304.
11
Figures
Fig. 1. Spatial location of CUFES samples collected every 30 min periods along the RV Thalassa route during French January–February IBTS 2008 (open circle) and 2009 ( plus).

12
Fig. 2. Number of vignettes per class in the learning (black bars) and test (white bars) sets used for building and evaluating the classifier. StA, early stage eggs; StB, advanced stage eggs; d, damaged eggs, those of dab and flounder were pooled together.

13

14
Fig. 5. A representation in the first factorial plane of the PCA of the 51 ZooScan attributes of the learning set (top) and the identification class centroids (open circle) (bottom). The five cluster centroids identified by the Hierarchical Ascendant Clustering were also projected in this plane (black diamond) (bottom). The first (horizontal) and second (vertical) axes explained 41.4 and 22.2% variance, respectively.

15
Fig. 6. Fish eggs distribution of log-transformed data of each species from IBTS 2009, identified by the microscope (left), by ZooScan analyses (middle) during IBTS 2009 and relative error map (right)

16
Fig. 6. Continued
17
Tables

18


![Weekly Tallahasseean. (Tallahassee, Florida) 1901-12-06 [p ].ufdcimages.uflib.ufl.edu/UF/00/08/09/51/00074/00581.pdfMcKinley especially Tallahassee MrKelley Jackson-ville machinery](https://static.fdocuments.in/doc/165x107/5f4a83cf90769c22c4734ff6/weekly-tallahasseean-tallahassee-florida-1901-12-06-p-mckinley-especially.jpg)