COMPARISON OF THE PERFORMANCE OF …gadi.agric.za/Agric/Vol15No1_2015/BLUP Ram G Agric.pdfMicrosoft...
7
20 COMPARISON OF THE PERFORMANCE OF PROGENY FROM A MERINO SIRE EXTENSIVELY USED IN THE LATE 1980s AND TWO WIDELY USED MERINO SIRES IN 2012 W.J. Olivier 1# & J.J. Olivier 2 1 Grootfontein Agricultural Development Institute, Private Bag X529, Middelburg (EC), 5900 2 Elsenburg Directorate of Animal Science, Private Bag X1, Elsenburg, 7607 # E-mail: [email protected] INTRODUCTION Breed improvement through scientific breeding practices has been a challenge that traditional Merino breeders have to deal with since the 1950s. These challenges were embraced by leading Merino breeders through ingenious plans such as controlled tests, group breeding schemes, the Show for Measured Production, veld ram clubs and central progeny testing under natural conditions (Erasmus, 2005). Best Linear Unbiased Prediction (BLUP) technology was introduced in South Africa in 1985. The first analysis for Merino breeders was within flock estimation of estimated breeding values (EBV) that evolved into within-breed analysis in the late 1990s and early 2000s. This new technology was embraced by several of the leading Merino breeders and studs at that stage as they saw the potential of selecting replacement animals on EBV (De Lange, 2008). Erasmus (2002), as cited by Brynard (2008), said “SA Merino breeders know much about change in a changing world. Drastic changes to both their breeding objectives and breeding methods have led to a change in the Merino just short of a genetic miracle. Not all breeders, however, took up the challenge of change and for those who did, there are great challenges ahead.” BLUP is an indication of the genetic differences between animals as environmental influences are eliminated and both production and reproduction traits can be included simultaneously in the analysis of the National Dataset of a breed. A secondary advantage of estimating breeding values is that breed improvement can be evaluated over years and accurate comparisons between flocks and years can therefore be made. The aim of this project was to quantify the EBV’s of a ram used in the eighties to rams used in 2012 and to compare the production of their progeny in relation to their EBV’s for Merino sheep in South Africa. MATERIALS AND METHODS
Transcript of COMPARISON OF THE PERFORMANCE OF …gadi.agric.za/Agric/Vol15No1_2015/BLUP Ram G Agric.pdfMicrosoft...

20
COMPARISON OF THE PERFORMANCE OF PROGENY FROM A MERINO SIRE
EXTENSIVELY USED IN THE LATE 1980s AND TWO WIDELY USED MERINO
SIRES IN 2012
W.J. Olivier1#
& J.J. Olivier2
1Grootfontein Agricultural Development Institute, Private Bag X529, Middelburg (EC), 5900
2Elsenburg Directorate of Animal Science, Private Bag X1, Elsenburg, 7607
#E-mail: [email protected]
INTRODUCTION
Breed improvement through scientific breeding practices has been a challenge that traditional Merino
breeders have to deal with since the 1950s. These challenges were embraced by leading Merino breeders
through ingenious plans such as controlled tests, group breeding schemes, the Show for Measured
Production, veld ram clubs and central progeny testing under natural conditions (Erasmus, 2005).
Best Linear Unbiased Prediction (BLUP) technology was introduced in South Africa in 1985. The first
analysis for Merino breeders was within flock estimation of estimated breeding values (EBV) that evolved
into within-breed analysis in the late 1990s and early 2000s. This new technology was embraced by
several of the leading Merino breeders and studs at that stage as they saw the potential of selecting
replacement animals on EBV (De Lange, 2008). Erasmus (2002), as cited by Brynard (2008), said “SA
Merino breeders know much about change in a changing world. Drastic changes to both their breeding
objectives and breeding methods have led to a change in the Merino just short of a genetic miracle. Not all
breeders, however, took up the challenge of change and for those who did, there are great challenges
ahead.”
BLUP is an indication of the genetic differences between animals as environmental influences are
eliminated and both production and reproduction traits can be included simultaneously in the analysis of
the National Dataset of a breed. A secondary advantage of estimating breeding values is that breed
improvement can be evaluated over years and accurate comparisons between flocks and years can
therefore be made.
The aim of this project was to quantify the EBV’s of a ram used in the eighties to rams used in 2012
and to compare the production of their progeny in relation to their EBV’s for Merino sheep in South
Africa.
MATERIALS AND METHODS
21
This project was done on the farms of two Merino breeders that participate in the Merinoplan. Grand
View, the farm of Geoff Kingwill, is in the Murraysburg district (32°28’S, 24°9’E; elevation 1464 m) in
the Western Cape Province of South Africa and is located in the Karroid Merxmuellera Mountain
Sweetveld (Veld type 60; Acocks, 1988). Strydfontein, the farm of John Stretton, is in the Molteno
district (31°22’S, 26°16’E; elevation 1751 m) of the Eastern Cape Province of South Africa and is located
in the Stormberg Plato Sweetveld (Veld type 59; Acocks, 1988).
Three rams, namely Poena (2150-28-3; Stormberg Sheep Improvement Group), Jood (2323-08-0931;
Cradock fine wool Merino stud) and Sneller (801-08-7114; Komarsekraal) were selected as sires for this
project. Poena was born in 1984 and was one of the top sires of his time and was widely used in the
Merino industry. His estimated breeding values published in the Ramsem journal of 1985 were 7.04 kg,
0.39 kg, 0.28 µm and R33.70 for body weight (BW), clean fleece weight (CFW), fibre diameter (FD) and
economic value respectively. The corresponding EBVs (Table 1) for Poena obtained from the 2012
analysis (28/04/2012) were -3.78 kg, -0.08 kg, 0.65 µm and –R 18.60 for BW, CFW, FD and relative
economic value (REV) respectively. In 2012 Sneller and Jood were ranked second and third best sires on
the CMW National Sire Ranking (28/04/2012). Their EBVs for BW, CFW, FD and REV are summarised
in Table 1.
Table 1. Estimated breeding values of the sires obtained from a 2012 BLUP analysis (28/04/2012)
Name
(ID Number)
BW
(kg)
CFW
(kg)
FD
(µm)
SL
(mm)
TWW
(kg)
REV
(R)
Poena
(2150-28-3) -3.78 -0.08 0.65 -0.00 -1.79 -18.60
Sneller
(801-08-7114) 1.69 0.232 -1.90 5.95 2.97 39.49
Jood
(2323-08-0931) 7.06 0.106 -0.96 11.62 1.64 39.21
BW – Body weight; CFW – Clean fleece weight; FD – Fibre diameter; SL – Staple length; TWW – Total
weight of lamb weaned; REV – Relative economic value
A group of 130 stud ewes was selected at each locality. The ewes allocated to Sneller and Jood (50 ewes
per ram) were artificially inseminated with fresh semen during April 2012. The remaining 30 ewes were
laparoscopically inseminated with thawed frozen semen of Poena. The thawed frozen semen quality was
evaluated by the veterinarian responsible for the insemination and was found to be of good quality. The
number of ewes that lambed and the number of lambs weaned per ram for the two localities are
summarised in Table 2. The normal management practices and health programs followed in the respective
studs were also followed with the experimental ewes. The ewes were run as one flock, except during

22
lambing.
Table 2. The number of ewes that lambed and the number of lambs weaned per ram at each locality
Sire Number of ewes lambed Number of lambs weaned
Grand View
Poena 20 33
Jood 42 49
Sneller 40 59
Strydfontein
Poena 25 29
Jood 37 42
Sneller 43 50
The production data of the progeny were submitted and were subsequently included in the analysis of the
National Database for Merino sheep to estimate EBVs. The least square-means for body weight, clean
fleece weight, fibre diameter and staple length, as well as wool and conformation scores of the progeny
for each locality and the combined dataset was obtained with the PROC GLM procedure of SAS (SAS,
2009). These values were expressed the predicted values for the respective traits as an index. The
following formula was used:
Index = �LSMsire + �EBV2
�LSM
��100
where index is the value obtained for each sire for a specific trait, LSM is the least square-means for a
specific trait and EBV is the estimated breeding value of the sire for a specific trait.
RESULTS AND DISCUSSION
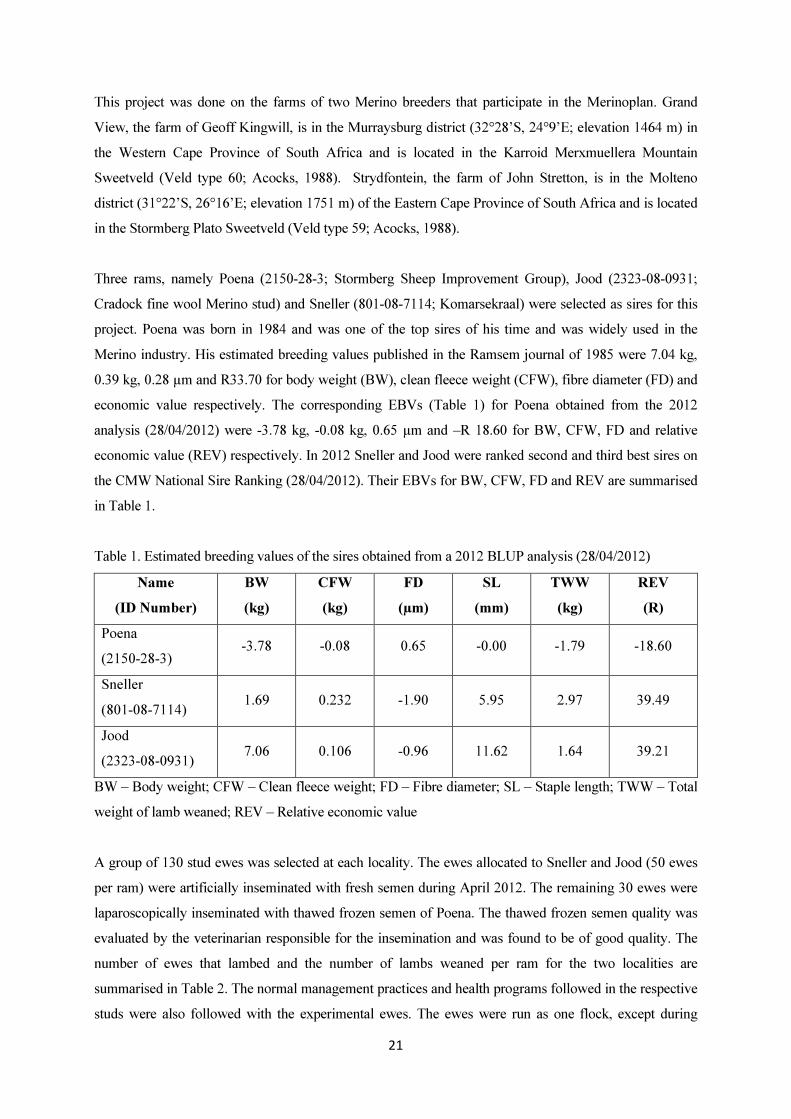
The predicted values (expressed as an index) of the progeny of the three sires for body weight, clean
fleece weight, fibre diameter, staple length, subjective wool score and subjective conformation score
are presented in Figures 1 to 6. It is evident from Figure 1 that the progeny of the two young rams
outperformed the progeny of Poena with regard to body weight at both localities and in the combined
dataset. The progeny of Jood was also heavier than that of Sneller, which corresponds with the
difference in EBVs of these two sires.
23
Figure 1. The average predicted values (expressed as an index) of the progeny of the three rams for
body weight
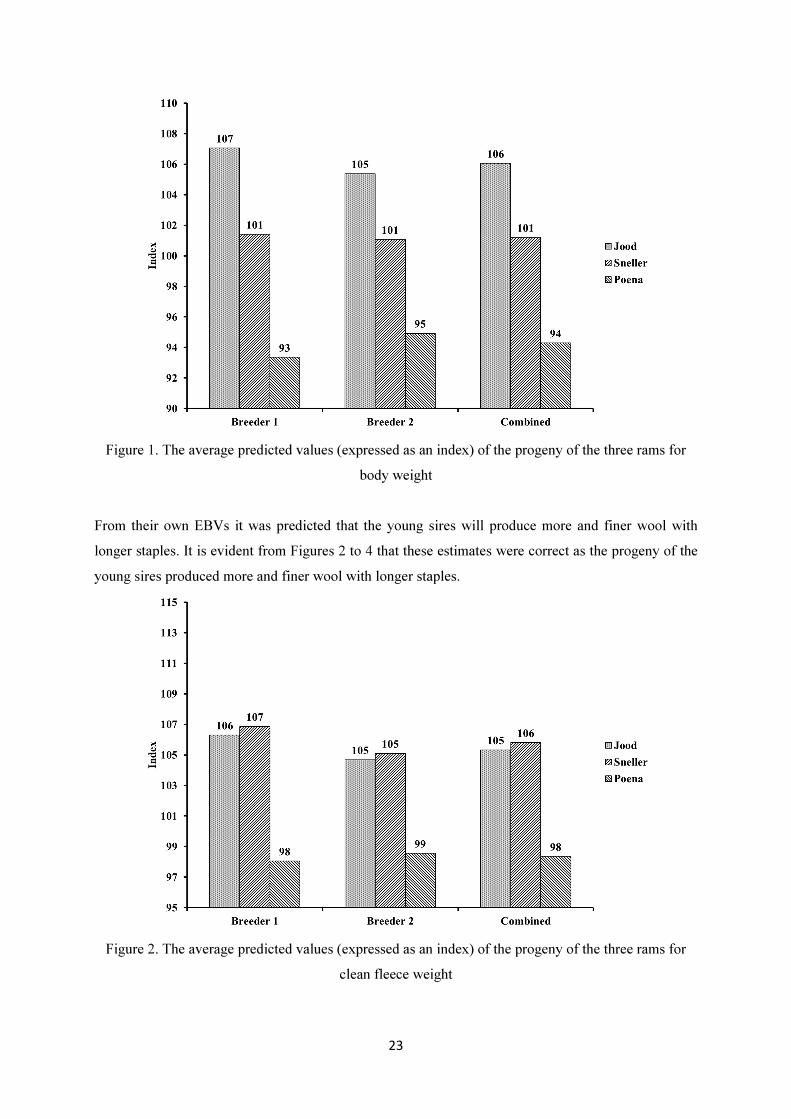
From their own EBVs it was predicted that the young sires will produce more and finer wool with
longer staples. It is evident from Figures 2 to 4 that these estimates were correct as the progeny of the
young sires produced more and finer wool with longer staples.
Figure 2. The average predicted values (expressed as an index) of the progeny of the three rams for
clean fleece weight

24
Figure 3. The average predicted values (expressed as an index) of the progeny of the three rams for
fibre diameter
Figure 4. The average predicted values (expressed as an index) of the progeny of the three rams for
staple length
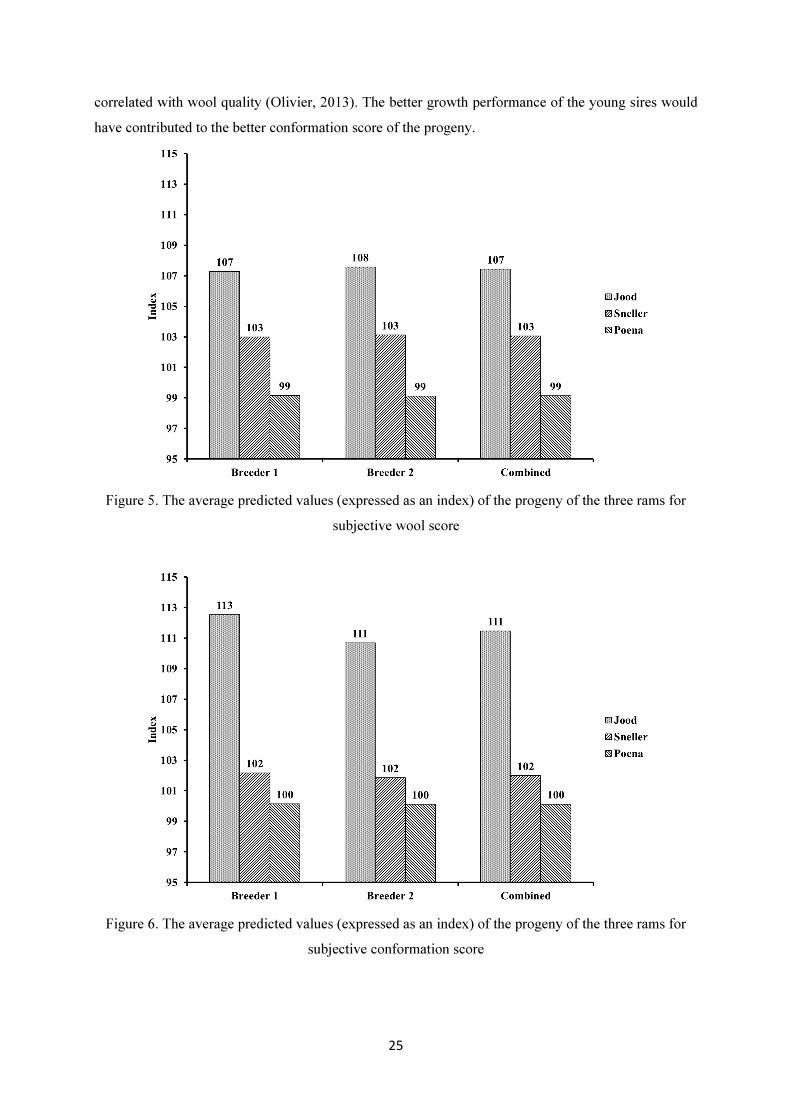
It is also evident from Figures 5 and 6 that the progeny of the young sires had better wool and
conformation scores compared to the progeny of Poena. This could partly be linked to the fact that the
progeny of the young sires produced finer wool with longer staples, as these traits are favourably
25
correlated with wool quality (Olivier, 2013). The better growth performance of the young sires would
have contributed to the better conformation score of the progeny.
Figure 5. The average predicted values (expressed as an index) of the progeny of the three rams for
subjective wool score
Figure 6. The average predicted values (expressed as an index) of the progeny of the three rams for
subjective conformation score

26
CONCLUSIONS
It is evident from the results of this study that the progeny of Poena were smaller, with less, coarser
and shorter wool compared to the progeny of the other two sires. Furthermore, it can be concluded that
the use of rams with accurate performance testing data had a positive influence on the production
potential of Merino sheep in South Africa. Therefore, it is advisable for breeders and commercial
producers to incorporate the use of estimated breeding values as a decision making tool to select the
sires and dams of the next generation.
REFERENCES
Acocks, J.P.H., 1988. Veld types of South Africa. 3rd Ed, Botanical Research Institute, Dept. of
Agriculture and Water Supply, Pretoria, South Africa. 88.
Brynard, B., 2008. Die waarde van BLUP vir die Merino stoetteler. Merino Focus, 69-70.
De Lange, A.O., 2008. BLUP twintig jaar later. Merino Focus 2008. 71-72.
Erasmus, G.J., 2005. Science and the South African Merino Breeder. Merino Focus, 39.
Olivier, W.J., 2013. The evaluation of a South African fine wool genetic resource flock. PhD thesis,
University of Stellenbosch.
SAS Institute Inc., 2009. SAS Online Doc® 9.2. Cary, NC, SAS Institute Inc.