
Comparison of Support Vector Machine and Decision Tree in ... · Universitas Pembangunan Panca Budi...
12
@IJRTER-2016, All Rights Reserved 140 Comparison of Support Vector Machine and Decision Tree in Predicting On- Time Graduation (Case Study : Universitas Pembangunan Panca Budi) Nova Mayasari Faculty of Computer Science,Universitas Pembangunan Panca Budi, Jl. Jend. Gatot Subroto Km. 4,5 Sei Sikambing, 20122, Medan, Sumatera Utara, Indonesia Abstract - Each university has a student who is going through a period of graduation. This is important in an educational institution as this will give a view to the public on the value of an educational institution. Graduation is a measure of college success in carrying out their teaching practice. Research to predict graduation with data mining techniques has been widely applied. This study did a comparison between Support Vector Machine and Decision Tree. The level of accuracy obtained between Support Vector Machine and Decision Tree to the student data is balanced. By doing this, the university can know the weaknesses of the students to reach graduation. Universities can fix errors that occur on the achievement of graduation to see the parameters that a weak point of the final grade. Keywords - Data mining, Decision Tree , SVM, C4.5 I. INTRODUCTION Technological developments resulted in almost all the activities in contact with technology, for example in the fields of industry, health and other sales, particularly in the field of higher education. The college is one of the perfect places to develop the technology. This is done at both state and private universities in Indonesia. Universitas Pembangunan Panca Budi (UNPAB) is one of the private universities that are under the guidance of Kopertis Region I Medan, North Sumatra. UNPAB academic activities have been using information technology to the field of academic administration, finance, student affairs, human resources area, library, computers and infrastructure of the laboratory. Use of Academic Information Systems began in 2010. Academic Information Systems, began in the registration process, financial processes, lecture to students doing the filing of the final project/thesis, process guidance and the process of passing the final exam to graduate from UNPAB. With the vast amount of data available to do the processing of such data by using data mining techniques. With the technique of data mining, data mining can be done to get new useful information by analyzing data already exists in the database. Universities need to make a prediction on students to minimize the level of students' academic failure; this can be done from the beginning of the student attends academic process is assisted by an academic supervisor who took control of the process of academic students through the values and personality of students. This study will compare two methods: Support Vector Machine (SVM) and Decision Tree with data mining techniques to look at the value of the accuracy of both techniques in the prediction on-time graduation by dividing the data into two, the test data and training data. SVM is a relatively new technique to predict. SVM used to perform many problems in daily life, e.g., financial problems, weather, and medical. Of some of the problems are resolved, it is evident in the implementation of SVM gives good results by providing a global solution optimal, whereas Decision Tree technique is the most popular method because it is easy to interpret. Decision Tree is a predictive model using a
Transcript of Comparison of Support Vector Machine and Decision Tree in ... · Universitas Pembangunan Panca Budi...

@IJRTER-2016, All Rights Reserved 140
Comparison of Support Vector Machine and Decision Tree in Predicting On-
Time Graduation
(Case Study : Universitas Pembangunan Panca Budi)
Nova Mayasari
Faculty of Computer Science,Universitas Pembangunan Panca Budi,
Jl. Jend. Gatot Subroto Km. 4,5 Sei Sikambing, 20122, Medan, Sumatera Utara, Indonesia
Abstract - Each university has a student who is going through a period of graduation. This is important
in an educational institution as this will give a view to the public on the value of an educational
institution. Graduation is a measure of college success in carrying out their teaching practice. Research
to predict graduation with data mining techniques has been widely applied. This study did a
comparison between Support Vector Machine and Decision Tree. The level of accuracy obtained
between Support Vector Machine and Decision Tree to the student data is balanced. By doing this, the
university can know the weaknesses of the students to reach graduation. Universities can fix errors that
occur on the achievement of graduation to see the parameters that a weak point of the final grade.
Keywords - Data mining, Decision Tree , SVM, C4.5
I. INTRODUCTION
Technological developments resulted in almost all the activities in contact with technology, for
example in the fields of industry, health and other sales, particularly in the field of higher education.
The college is one of the perfect places to develop the technology. This is done at both state and private
universities in Indonesia.
Universitas Pembangunan Panca Budi (UNPAB) is one of the private universities that are under the
guidance of Kopertis Region I Medan, North Sumatra. UNPAB academic activities have been using
information technology to the field of academic administration, finance, student affairs, human
resources area, library, computers and infrastructure of the laboratory. Use of Academic Information
Systems began in 2010. Academic Information Systems, began in the registration process, financial
processes, lecture to students doing the filing of the final project/thesis, process guidance and the
process of passing the final exam to graduate from UNPAB.
With the vast amount of data available to do the processing of such data by using data mining
techniques. With the technique of data mining, data mining can be done to get new useful information
by analyzing data already exists in the database. Universities need to make a prediction on students to
minimize the level of students' academic failure; this can be done from the beginning of the student
attends academic process is assisted by an academic supervisor who took control of the process of
academic students through the values and personality of students.
This study will compare two methods: Support Vector Machine (SVM) and Decision Tree with data
mining techniques to look at the value of the accuracy of both techniques in the prediction on-time
graduation by dividing the data into two, the test data and training data. SVM is a relatively new
technique to predict. SVM used to perform many problems in daily life, e.g., financial problems,
weather, and medical. Of some of the problems are resolved, it is evident in the implementation of
SVM gives good results by providing a global solution optimal, whereas Decision Tree technique is
the most popular method because it is easy to interpret. Decision Tree is a predictive model using a

International Journal of Recent Trends in Engineering & Research (IJRTER) Volume 02, Issue 12; December - 2016 [ISSN: 2455-1457]
@IJRTER-2016, All Rights Reserved 141
tree structure, which converts the data into decision trees with decision rules that are useful for backing
break down complex decision-making process becomes more simple so that in taking the decision will
be interpreting the solution of problems.
II. THEORIES
A. Data Mining.
Data Mining is a collection of techniques used as a subprocess of knowledge discovery in databases,
whose ultimate goal is to extract useful data from a particular set. Data Mining is a simple and
important tool used to extract information from large datasets. Data mining is a process that employs
one or more machine learning techniques to analyze and extract knowledge automatically [5][7]. Other
definitions include induction-based learning is the process of establishing a common definition of the
concept definition is done by observing specific examples of the concepts that will be studied. Data
mining is not specific to one type of media or data only, data mining can be widely applicable to all
types of repository information.
There are some factors that define data mining [4]:
1. Data mining is the process of digging an added value to the data collected in the past.
2. The object of data mining is that large amounts of data or complex.
3. The purpose of data mining is to find connections or patterns that may provide a useful
indication
B. Data Mining Operation
There are two kinds of data mining operation [10], such as:
1. Prediction
To answer the question of what and something that is dim or transparent. Operating forecasts are used
to validate the hypothesis, querying and reporting, multimedia analysis, OLAP (Online Analytic
Processing), as well as statistical analysis.
2. Discovery
It is transparent and to answer the question "why," the operation of the invention is used for exploratory
data analysis, predictive modeling, segmentation database, linkage analysis and detection of deviations.
The process steps in the use of data mining is the process of Knowledge Discovery in Databases can
be seen in the picture below.
Fig. 1 Data Mining Process

International Journal of Recent Trends in Engineering & Research (IJRTER) Volume 02, Issue 12; December - 2016 [ISSN: 2455-1457]
@IJRTER-2016, All Rights Reserved 142
From the figure above can be explained:
1. Data Selection
It creates a target data set, selecting a subset of data, or focuses on a subset of variables or data samples,
where the invention perform. Selection of data from the operational data set needs to be done before
the stage of extracting information in KDD starts. Data from the selection that will be used for data
mining process is stored in a file separate from operational databases.
2. Preprocessing/Cleaning
Preliminary processing and data cleansing are basic operations such as noise removal done. Before the
data mining process can be implemented, it needs cleaning process on the data to be the focus KDD.
The cleaning process may include removing duplicates the data, check data inconsistencies and correct
errors in the data, such as data or external information.
3. Transformation
It searches features that are useful to present the data depends on the objectives to be achieved
4. Data Mining
It selects the data mining task, a goal of KDD process instance classification, regression, clustering,
etc. The process of data mining is the process of searching for a pattern or interesting information in
the selected data by using techniques or methods. Selection of the appropriate method or algorithm is
largely based on the goals and overall KDD process
5. Interpretation/Evaluation
Translation patterns are generated from data mining. Pattern information generated from the data
mining process needs to be presented in a form easily understood by stakeholders.
C. Decision Tree
The tree is a data structure consisting of nodes and edges. Trees on a tree can be divided into three,
namely the root node, branch / internal nodes and leaf nodes. The decision tree is a simple
representation of a classification technique for a finite number of classes. Internal node and the root
node is marked with the name of the attribute; the edges are labeled by the possible attribute values
and a leaf node is marked with different classes. The decision tree is a classification model is one of
the most popular because they are easy to interpret, the results obtained more easily understood.
Trees are used to represent the decision and make the decision referred to the decision tree.
Classification or Regression models built by a decision tree using a tree structure. In a decision tree
data mining data. The process of the decision tree is to change the shape of the data (label) into the
tree model, change the model tree into a rule. The main benefit of using decision tree is its ability to
break down complex decision-making process becomes more simple so that decision-makers will be
interpreting the solution of problems. The decision tree is also useful to explore the data, find hidden
relationships between some candidates with the target variable input variables. The decision tree
concept is descibed in Figure 2.

International Journal of Recent Trends in Engineering & Research (IJRTER) Volume 02, Issue 12; December - 2016 [ISSN: 2455-1457]
@IJRTER-2016, All Rights Reserved 143
Fig. 2 Basic concept of Decision Tree
D. Support Vector Machine
Support Vector Machine is a technique to make predictions, both in the case of classification and
regression. SVM are in a class by Artificial Neural Network regarding functionality and condition
problems can be solved. Both are included in the class supervised learning [3][6]. Support Vector
Machine is a selection method that compares the standard parameter set of discrete values, called the
candidate set, and take the one that has the best classification accuracy. By changing the kernel function,
it can be possible to find hyperplane to determine the classification of non-linear by making hyperplane
lines that emerged through the data set. This determination is based on Gaussian radial basis and
tangents. Support Vector Machine is a learning system to classify data into two or more groups. The
following formula describes the SVM strategy.
𝑓(𝑥) = 𝑤. 𝑥 + 𝑏 (
1)
Fig. 3 Illustration of SVM to separate data linearly
Figure 3 illustrates the two classes can be separated by a pair of parallel field delimiter. Field first
barrier limiting first class while the second barrier limiting the field of the second class, to obtain:

International Journal of Recent Trends in Engineering & Research (IJRTER) Volume 02, Issue 12; December - 2016 [ISSN: 2455-1457]
@IJRTER-2016, All Rights Reserved 144
𝑥𝑖 . 𝑤 + 𝑏 ≥ 1 𝑓𝑜𝑟 𝑦𝑖 = 1 (
2)
𝑥𝑖 . 𝑤 + 𝑏 ≤ −1 𝑓𝑜𝑟 𝑦𝑖 = −1
(
3)
with xi is the data set, w is the weight vector that is perpendicular to the hyperplane (normal field), b
is the bias that determines the location of the function of separator about the origin, yi is the class label
of data.
III. RELATED WORKS
“Reducing False Positives In Intrusion Detection Systems Using Data-Mining Techniques Utilizing
Support Vector Machines, Decision Trees, And Naive Bayes For Off-Line Analysis”. This study makes
an intrusion monitoring system on the network or host to detect malicious activity that may cause harm
to the system using data mining techniques by combining Support Vector Machine (SVM), Decision
Tree and Naive Bayes. First, Support Vector Machine trained by binary classification added to the
dataset to determine whether the sample is offensive or normal traffic on the system, then the second
attack on the post through the decision tree for classification and third Naïve Bayes and Decision Tree
will leave a mark on every unclassified attack [2].
“Analysis of Genetic Relationships of M81 and B95-in Epstein-Barr Virus Comparison of M81 and
B95-8 by Using Apriori Algorithm, Decision Tree, and Support Vector Machine”. The study analyzed
the EBV DNA sequences using Apriori algorithm, Decision Tree, and Support Vector Machine to look
for reasons for the differences between the M81 and B95-8. The results of using Apriori algorithm,
Decision Tree, and Support Vector Machine show conclusively in both size, with BZLF1 and BRLF1,
two genes clearly correlated, have a list of the same genes, but different functions and properties.
BALF4 with Decision Tree explain the high degree of similarity in the sequencing while SVM proves
different functions. All trials showed a fairly high similarity adalanya of LMP genes, these genes are
very similar, so it can be considered as the same order on Decision Tree and Support Vector Machine
[3].
“Optimizing Parameters of Support Vector Machine Using Fast Messy Genetic Algorithm for Dispute
Classification”. This research obtains the best predictions to the existing problems by integrating
genetic algorithm with SVM. In a dispute trend prediction accuracy obtained GASVM (89.30%) and
C5.0 (83, 25%), both of these classifications are based classification best regression in predicting the
disputed project, even GASVM performance has the highest score overall (.871) rated of accuracy,
precision, sensitivity and AUC [6].
“Approximating Support Vector Machine with artificial neural Network for Fas Prediction”. This
research improves the performance of SVM in the test phase by using Hybrid Neural Network (HNN).
The main drawback of the SVM is at the training and testing phase [8].
“Prediction of Solubility of Ammonia in Liquid Electrolytes Using Least Square Support Vector
Machines”. This study predicts the solubility of ammonia in the ionic liquids using Least Square
Support Vector Machine model. SVM and LS-SVM models are based on statistical analysis of the
resulting ability to predict acceptable, but the LS-SVM produces output that is more accurate than
SVM in conducting assessments solubility of ammonia in Ionic Liquids [9].

International Journal of Recent Trends in Engineering & Research (IJRTER) Volume 02, Issue 12; December - 2016 [ISSN: 2455-1457]
@IJRTER-2016, All Rights Reserved 145
“Cervical Cancer Stage Prediction Using Decision Tree Approach of Machine Learning”. This study
identifies steps cervical cancer decision trees for Oncologist to detect cancer rates. The decision tree
based computerized program is helpful to determine the level of cancer [1].
IV. PROPOSED WORK
This section will explain the steps to be taken in doing this research; this study will compare methods
in data mining, methods of Support Vector Machine and Decision Tree in a timely prediction of
graduating students of Universitas Pembangunan Panca Budi (UNPAB). In this methodology, the
process begins with the stage of identification and formulation of the problem, data collection,
literature searches, followed by the preparation and selection of data (attribute) that will be used as a
variable to be tested, the data mining process, validation, conclusions, and suggestions. The flow
diagram steps of this research can be seen in the following figure.
Fig 4. Methodology
The data used is data that has been the active student and graduate student that is data 2010 to 2012
which will be compared with the data of students in 2013to 2014.
Some attributes that will be used such as:
Gender
Average value of the examination
GPA semester 1 to 4

International Journal of Recent Trends in Engineering & Research (IJRTER) Volume 02, Issue 12; December - 2016 [ISSN: 2455-1457]
@IJRTER-2016, All Rights Reserved 146
Data collection was performed at Universitas Pembangunan Panca Budi. It is obtained by meeting the
academic field in the university. The data obtained will be divided into training and test data. The test
is done by using Rapid Miner 7.3.
Fig 5. SVM and Decision Tree flowchart

International Journal of Recent Trends in Engineering & Research (IJRTER) Volume 02, Issue 12; December - 2016 [ISSN: 2455-1457]
@IJRTER-2016, All Rights Reserved 147
Figure 5 describes the flowchart of the system. The problem is identified first. The data collected is
processed and divided into the training and test data. The training data is trained to get the model of
achievement. The experimental data will be compared to the train data to obtain the evaluation
V. EVALUATION
This section contains explanations of the model used to find the value of the accuracy of Support
Vector Machine and Decision Tree for prediction of graduation. The initial step in this research is done
with the data collection process of students who have graduated or are still active from the class of
2010 to 2012. The data collected is 2700. This data will then be divided into two, training and test data.
The variables used are Gender and GPA semester 1 to 4. The next step is to process the data that has
been divided into training and test data into the software using a Support Vector Machine and method
Decision Tree method.
The following table shows several sample data used in the process of training and test. The data has
five attributes that will be used in the calculation of graduation (G = Gender, HSD = High School
Grade). Table 1 Academic grade
No Code G HSD SEM 1 SEM 2 SEM 3 SEM 4
1 20100744 M 17.75 3.50 4.00 4.00 3.75
2 20110765 F 21.00 3.65 4.00 3.68 3.92
3 20110833 F 23.00 3.65 4.00 3.64 3.55
4 20110794 F 24.00 3.45 4.00 3.50 3.91
5 20110768 F 35.10 3.75 4.00 3.46 3.78
6 20120323 F 35.94 4.00 4.00 3.87 3.86
7 20110774 F 50.00 3.50 4.00 3.62 3.65
8 20110943 M 51.95 3.70 4.00 3.45 3.91
9 20100738 F 30.00 3.65 3.96 4.00 4.00
10 20120371 F 29.56 3.40 3.92 3.30 3.45
11 20110381 F 34.00 3.62 3.92 3.29 3.50
12 20110790 F 34.00 3.35 3.92 3.29 3.78
13 20110745 F 43.00 3.60 3.92 3.29 3.39
14 20110823 F 46.00 3.50 3.92 3.54 3.39
15 20110255 M 47.00 3.90 3.92 4.00 3.86
16 20120319 F 47.52 3.85 3.92 3.57 3.59
17 20100503 M 70.43 3.40 3.92 3.54 4.00
18 20110916 M 40.00 3.28 3.91 3.80 3.65
19 20110814 F 41.00 3.20 3.91 3.08 3.14
20 20100362 M 47.05 3.68 3.91 4.00 3.77
21 20110817 F 48.00 3.40 3.91 3.42 3.91
22 20111008 F 50.00 3.70 3.91 3.85 3.50
23 20100762 F 92.85 3.80 3.91 3.71 3.92
24 20100762 F 92.85 3.80 3.91 3.71 3.92
25 20110764 F 23.00 3.65 3.90 3.50 3.92
26 20110653 F 38.00 3.35 3.90 3.71 3.48
27 20100521 F 50.95 3.65 3.90 3.79 4.00
28 20110681 M 23.00 3.62 3.88 3.69 4.00
29 20110345 M 28.00 3.57 3.88 3.79 3.78
30 20120351 F 31.84 3.65 3.88 3.65 3.45

International Journal of Recent Trends in Engineering & Research (IJRTER) Volume 02, Issue 12; December - 2016 [ISSN: 2455-1457]
@IJRTER-2016, All Rights Reserved 148
Data obtained from the student's academic university. The amount of data that is retrieved is 2500. The
data is divided into a training data consisting of 680 class of 2010, 849 of 2011 and 721 in 2012 and
test data generation consisting of 87 class of 2010, 96 of 2011 and 67 force in 2012. The condition of
the data obtained is still much that is not yet complete. Reprint of the Academic Portal will be made
especially in the GPA whose value does not appear. Data that has been divided for use in training and
testing phase. SVM training phase is to build the model while the testing phase is the stage of testing
the accuracy of the model.
A. Support Vector Machine
To process the data that has been divided into training data and test data, each operator must be
connected. Operators containing training data connected to the SVM models will be connected to apply
model. Operator containing test data is associated with the apply model also. Apply model is associated
with the operator to view the results of the performance accuracy. Performance Operator is connected
to the output connector.
If there is an error message on a Support Vector Machine, it can be seen in the column under the main
process. To resolve the error by right clicking on the red box still contained on SVM and selecting
"convert attributes to numerical." SVM can only read numerical data. After the convert, then the
process will increase.
After all the operators no sign of the error, it can be processed to see the value of accuracy. In
experiments using SVM, to find the value of accuracy will use some of the parameters that exist in the
SVM. With the value of accuracy is 39.88 % on performance vector for the confusion matrix valuee,
the value of "true" to graduate on-time is 0. The model shows from training data, and test data were
processed using SVM. Both figures are read as a prediction "not on-time."
Table 2. Confusion matrix model with parameter dot
Accuracy : 39.88 % +/- 7.72% (Micro :39.88%)
True On-Time True Not On-Time Class Precision
On-Time Prediction 708 1188 37.34 %
Not On-Time
Prediction 78 132 62.86 %
Class Recall (%) 90.08 % 10.00%
Table 2 shows there are 708 classified data pass on-time accordance with the SVM predictions and 78
on-time, 1188 predicted on-time, but the results are not on-time, and 132 predicted not on-time and
the results not on-time accordance with the predictions made by SVM. Selection of the next parameter
is to use polynomial parameters on SVM and accuracy values obtained are in Table 3.
Table 3. Confusion matrix model with parameter polynomial
Accuracy : 62.73 % +/- 0.25% (Micro :62.73%)
True On-Time True Not On-Time Class Precision
On-Time Prediction 1 0 100.00%
Not On-Time
Prediction 785 1320 62.71%
Class Recall (%) 0.13 % 100.00%

International Journal of Recent Trends in Engineering & Research (IJRTER) Volume 02, Issue 12; December - 2016 [ISSN: 2455-1457]
@IJRTER-2016, All Rights Reserved 149
Fig 5. Performance Vector with parameter dot
Fig 6. Performance Vector with parameter polynomial
B. Decision Tree
Tests to find the value of the same accuracy as on Support Vector Machine, only the operator who
originally SVM replaced by Decision Tree using gain_ratio as a parameter to the criterion. The results
of the use of the method Decision Tree with gain_ratio parameter values obtained accuracy of 46.80%,
which means the processing of student data for the prediction of graduation at Universitas
Pembangunan Panca Budi has the same accuracy. The Support Vector Machine and Decision Tree
values are 62.68% as seen in Table 4 and 57.78% as seen in Table 5.
Table 4 Confusion Matrix models with parameters gain_ratio
Accuracy : 62.68% +/- 0.23 % (Micro : 62.68%)
True On-Time True Not On-Time Class Precision
On-Time Prediction 0 0 0.00%
Not On-Time Prediction 786 1320 62.68%
Class Recall (%) 0.00% 100.00%
Table 5 Confusion Matrix models with parameters gini_index
Accuracy : 57.78% +/- 3.25 % (Micro : 57.79%)
True On-Time True Not On-Time Class Precision
On-Time Prediction 334 437 43.32%
Not On-Time Prediction 452 883 66.14%
Class Recall (%) 42.49% 66.89%
International Journal of Recent Trends in Engineering & Research (IJRTER) Volume 02, Issue 12; December - 2016 [ISSN: 2455-1457]
@IJRTER-2016, All Rights Reserved 150
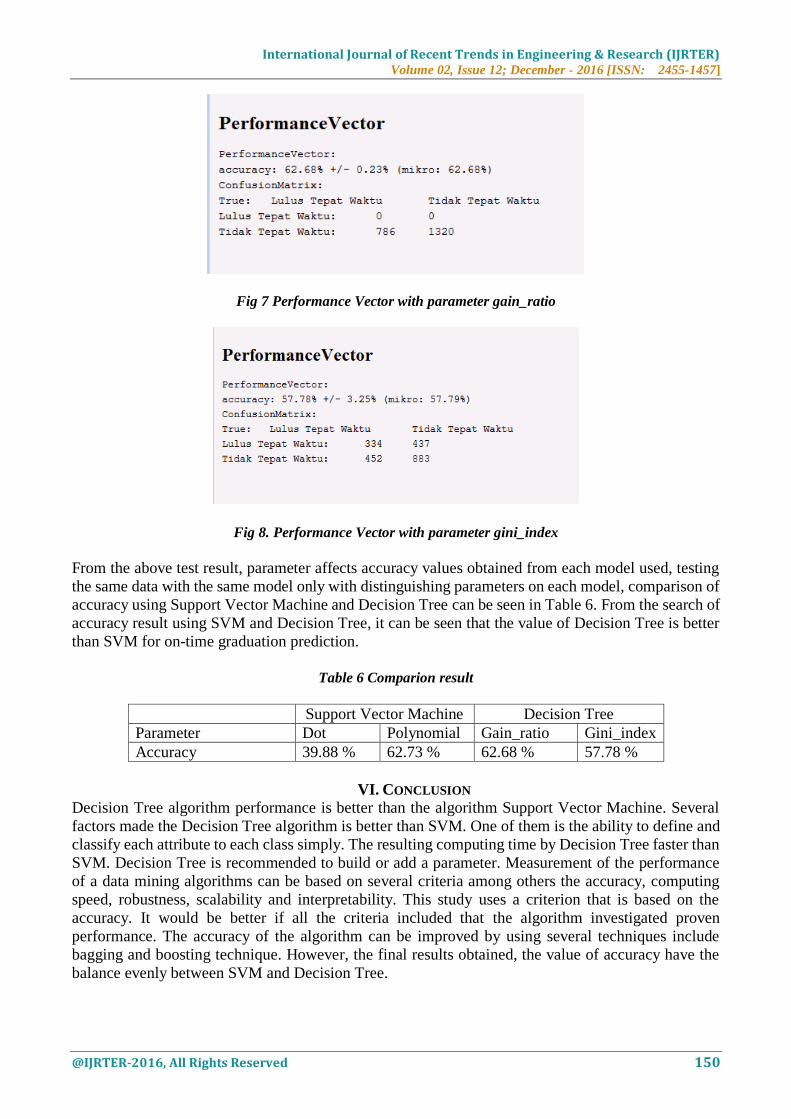
Fig 7 Performance Vector with parameter gain_ratio
Fig 8. Performance Vector with parameter gini_index
From the above test result, parameter affects accuracy values obtained from each model used, testing
the same data with the same model only with distinguishing parameters on each model, comparison of
accuracy using Support Vector Machine and Decision Tree can be seen in Table 6. From the search of
accuracy result using SVM and Decision Tree, it can be seen that the value of Decision Tree is better
than SVM for on-time graduation prediction.
Table 6 Comparion result
Support Vector Machine Decision Tree
Parameter Dot Polynomial Gain_ratio Gini_index
Accuracy 39.88 % 62.73 % 62.68 % 57.78 %
VI. CONCLUSION
Decision Tree algorithm performance is better than the algorithm Support Vector Machine. Several
factors made the Decision Tree algorithm is better than SVM. One of them is the ability to define and
classify each attribute to each class simply. The resulting computing time by Decision Tree faster than
SVM. Decision Tree is recommended to build or add a parameter. Measurement of the performance
of a data mining algorithms can be based on several criteria among others the accuracy, computing
speed, robustness, scalability and interpretability. This study uses a criterion that is based on the
accuracy. It would be better if all the criteria included that the algorithm investigated proven
performance. The accuracy of the algorithm can be improved by using several techniques include
bagging and boosting technique. However, the final results obtained, the value of accuracy have the
balance evenly between SVM and Decision Tree.

International Journal of Recent Trends in Engineering & Research (IJRTER) Volume 02, Issue 12; December - 2016 [ISSN: 2455-1457]
@IJRTER-2016, All Rights Reserved 151
REFERENCES 1. Sharma, “Cervical Cancer Stage Prediction Using Decision Tree Approach of Machine Learning,” International
Journal of Advanced Research in Computer and Communication Engineering, vol. 5, no. 4, 2016.
2. K. Goeschel, “Reducing False Positives In Intrusion Detection Systems Using Data-Mining Techniques Utilizing
Support Vector Machines, Decision Trees, And Naive Bayes For Off-Line Analysis,” IEEE, 2016.
3. S. Yoon, J. Kwon, J. Won, C. Ham dan T. Yoon, “Analysis of genetic relationship of M81 and B95-in Epstein-Barr
Virus: Comparison of M81 and B95-8 by Using Apriori Algorithm, Decision Tree, And Support Vector Machine,”
IEEE, 2015.
4. L. Marlina dan A. P. U. Siahaan, “Data Mining Classification Comparison (Naïve Bayes and C4.5 Algorithms),”
International Journal of Engineering Trends and Technology, vol. 37, no. 8, pp. 380 - 383, 2016.
5. T. Krishna, D. Vasumathi, “A Study of Mining Software Engineering Data and Software Testing,” Journal of
Emerging Trends in Computing and Information Sciences, vol. 2, no. 11, 2011.
6. J.-S. Chou, M.-Y. Cheng, Y.-W. Wu dan A.-D. Pham, “Optimizing Parameters of Support Vector Machine Using Fast
Messy Genetic Algorithm for Dispute Classification,” Expert Systems With Applications, vol. 41, 2014.
7. D. Tomar, S. Agarwal, “A survey on Data Mining approaches for Healthcare,” International Journal of Bio-Science
and Bio-Technology, vol. 5, no. 5, pp. 241-266, 2013.
8. S. Kang dan S. Cho, “Approximating Support Vector Machine With Artificial Neural Network for Fast Prediction,”
International Journal of Advanced Technology In Engineering And Science, vol. 41, pp. 4989-4995, 2014.
9. A. Baghban, M. Bahadori, A. S. Lemraski dan A. Bahadori, “Prediction of Solubility of Ammonia in Liquid
Electrolytes Using Least Square Support Vector Machines,” Ain Shams Engineering Journal, pp. 1-10, 2016.
10. W. Fitriani and A. P. U. Siahaan, "Comparison Between WEKA and Salford System in Data Mining Software,"
International Journal of Mobile Computing and Application, vol. 3, no. 4, pp. 1-4, 2016.