Comparison of Spatial Instantaneous ECG Vec- tors...
11
Comparison of Spatial Instantaneous ECG Vec- tors, Measured with the SVEC, with Mean Vectors Derived from Conventional ECG Leads By ERNST SIMONSON, M.D., OTTO H. SCHMTTT, P H D . AND RAPHAEL B. LEVIXE, PH.D. Two approaches to the analysis of spatial electrocardiographs vectors are currently being used: con- struction from the conventional ECG leads, and measurements from oscilloscopicrecordingsof spatial loops. There are seveml fundamental differences between the approaches, and there is no a priori certainty that equivalent or even similar phenomena are being investigated. This study presents a statistical comparison between mean spatial vectors, constructed from the conventional ECG, and instantaneous maximum spatial vectors, determined with the stereovector electro-cardiographic technic. T WO different approaches are in use for characterization of spatial ECG vectors: construction based on conventional ECG data, and direct oscilloscopic recording of spatial loops by means of the stereovector electrocardiograph (SVEC) or related methods. Both approaches assume the general validity of the dipole theory for interpretation of surface potentials. Because of well-known complicating factors, complete accord with simply interpreted dipole theory cannot be expected. It has been largely a matter of indi- vidual inteipretation whether the degree of agreement or of disagreement with the dipole theory was emphasized. This explains to some extent the large and controversial literature which has arisen on this issue. In a quantitative test utilizing a mirror pattern cancellation technic 1 " 3 we found that in an average normal person or patient about 90 per cent of the total potentials in any of numerous electrode loca- tions can be associated with a simple central dipole (vector), and only 10 per cent to residual From the Laboratory of Physiological Hygiene and the Department of Biophysics, University of Min- nesota, Minneapolis, Minn. This investigation was supported (in part) by research grants H-10 (C7) and H-513 (C2 and C3) from the National Heart Institute, of the National In- stitutes of Health, Public Health Service, and from the Minnesota Heart Association. Receivod for publication November 22, 1954. components including local patterns. These results, which are in good agreement with Schaefer's work, 4 justify the interpretation of surface potentials in terms of spatial vectors, as a working approximation. While there is a common basis for the two approaches, there are also important dif- ferences. Duchosal and Sulzer, 6 and Scherlis and coworkers 6 " 8 found good agreement be- tween scalar precordial ECG's actually re- corded and those constructed from spatial loop oscillograms. This agreement is, however, at best qualitative, since only contoure were compared. Polzer 9 and Schuhfried 10 found re- markably different contours and orientation for the oscilloscopically recorded spatial loops when they tried successively on the same patients five different, but presumably equiv- alent, systems of electrode placement as sug- gested by various authors. This experimental variation of patterns makes it obvious that we must not expect, except by rare chance, that the oscilloscopically recorded loops obtained with one lead system will correspond identically with the vectorial reconstructions built up from data obtained from different lead sets. At the present time there appeal's to be no clearly established superiority or inferiority of one or the other method of electrode place- ment presently in use for spatial loop recording. Perhaps the discrepancies between methods are 320 Circulation Rttearch, Volume 111, July I9SS by guest on May 13, 2018 http://circres.ahajournals.org/ Downloaded from
Transcript of Comparison of Spatial Instantaneous ECG Vec- tors...

Comparison of Spatial Instantaneous ECG Vec-tors, Measured with the SVEC, with MeanVectors Derived from Conventional ECGLeadsBy ERNST SIMONSON, M.D., OTTO H. SCHMTTT, P H D . AND RAPHAEL B. LEVIXE, P H . D .
Two approaches to the analysis of spatial electrocardiographs vectors are currently being used: con-struction from the conventional ECG leads, and measurements from oscilloscopic recordings of spatialloops. There are seveml fundamental differences between the approaches, and there is no a prioricertainty that equivalent or even similar phenomena are being investigated. This study presents astatistical comparison between mean spatial vectors, constructed from the conventional ECG, andinstantaneous maximum spatial vectors, determined with the stereovector electro-cardiographictechnic.
TWO different approaches are in use forcharacterization of spatial ECG vectors:construction based on conventional ECG
data, and direct oscilloscopic recording ofspatial loops by means of the stereovectorelectrocardiograph (SVEC) or related methods.Both approaches assume the general validityof the dipole theory for interpretation ofsurface potentials. Because of well-knowncomplicating factors, complete accord withsimply interpreted dipole theory cannot beexpected. I t has been largely a matter of indi-vidual inteipretation whether the degree ofagreement or of disagreement with the dipoletheory was emphasized. This explains to someextent the large and controversial literaturewhich has arisen on this issue. In a quantitativetest utilizing a mirror pattern cancellationtechnic1"3 we found that in an average normalperson or patient about 90 per cent of the totalpotentials in any of numerous electrode loca-tions can be associated with a simple centraldipole (vector), and only 10 per cent to residual
From the Laboratory of Physiological Hygiene andthe Department of Biophysics, University of Min-nesota, Minneapolis, Minn.
This investigation was supported (in part) byresearch grants H-10 (C7) and H-513 (C2 and C3) fromthe National Heart Institute, of the National In-stitutes of Health, Public Health Service, and fromthe Minnesota Heart Association.
Receivod for publication November 22, 1954.
components including local patterns. Theseresults, which are in good agreement withSchaefer's work,4 justify the interpretation ofsurface potentials in terms of spatial vectors,as a working approximation.
While there is a common basis for the twoapproaches, there are also important dif-ferences. Duchosal and Sulzer,6 and Scherlisand coworkers6"8 found good agreement be-tween scalar precordial ECG's actually re-corded and those constructed from spatialloop oscillograms. This agreement is, however,at best qualitative, since only contoure werecompared. Polzer9 and Schuhfried10 found re-markably different contours and orientationfor the oscilloscopically recorded spatial loopswhen they tried successively on the samepatients five different, but presumably equiv-alent, systems of electrode placement as sug-gested by various authors. This experimentalvariation of patterns makes it obvious thatwe must not expect, except by rare chance, thatthe oscilloscopically recorded loops obtainedwith one lead system will correspond identicallywith the vectorial reconstructions built upfrom data obtained from different lead sets.At the present time there appeal's to be noclearly established superiority or inferiorityof one or the other method of electrode place-ment presently in use for spatial loop recording.Perhaps the discrepancies between methods are
320 Circulation Rttearch, Volume 111, July I9SS
by guest on May 13, 2018
http://circres.ahajournals.org/D
ownloaded from

S1M0NS0N, SCHMITT AND LEVINE 321
not more obvious because only essentiallyqualitative interpretations have thus far beenundertaken. It appears, therefore, that thequestion of agreement between spatial vectorsconstructed from conventional leads and thosedetermined from oscilloscopic records is stillunsettled.
We are concerned in this study with cor-relations between spatial vector features ob-tainable using conventional leads and con-ventional equipment exclusively, and thoseobtained with our SVEC equipment utilizingthe partially orthogonalized lead systems whichwe have temporarily adopted on the basis ofpreliminary experiments. We must thereforeexpect differences due to the fundamentallydifferent vector components being measuredin addition to those resulting from the dif-ferent measures of vector amplitude andorientation used in the two systems. Any cor-relations which we find, must exist in spite ofthese recognized sources of difference. Thenature and degree of such correlations conse-quently are pertinent in any considerations asto the validity, practical applicability, andlimitations of spatial vector analysis. As abackground for the discussion of our results,a condensed description of the methods wehave used and their theoretical implicationswill be given in the following discussion.
Construction of a mean vector was attempted bythe pioneer workers Einthoven, De Wuart, andFahr,11 but, of course limited to the frontal plane.The authors were uware that the several phases ofthe QTtS and T loop are projected differently onthe different standard leads, depending upon thecontoui-s of the loops. The discrepancies are lessobvious for narrow loops, and increase as the loopwidens. The method becomes more meaningfulwhen instantaneous vectors are constructed fromsimultaneous leads, as shown by the same authors.While the contour of the loop can be constructedfrom a number of instantaneous vectoi-s, this hasrarely teen done. The development of high-speedoscilloscopic technique has actually eliminated theneed for these tedious and time consuming pro-cedures.
Only by elimination of all but a few vector com-ponents, which are taken as representative, is itpractically possible to accomplish useful vectoranalysis using conventional ECG data. This situa-tion is actually not drastically different for the
quantitative analysis of oscilloscopic records ofspatial loops, as will lie discussed later.
Einthoven, De Waart, and Fahr's "manifestpotential" is a mean frontal plane vector measurewhich seems to be fairly representative of the generaldirection and magnitude of the electrical equivalentdipole currents near the time of their maximum. Inview of the phase differences in the three standardleads, such a. "mean vector," however, docs notnecessarily exist at any one time. The inadequacy ofthe frontal plane leads in detecting sagittal electricalcurrent components was first shown by the use ofprecordial leads in anterior wall myocardial infarct,although at that time this was an empirical develop-ment without any attempt at analysis of spatialvectois. This demonstrated, however, the need forprecordial leads and the need to analyse spatialvectors instead of frontal plane vectors alone.Spatial vectors can be constructed from theirprojections on the frontal (standard leads) planeand the horizontal (precordial leads) plane. Grantdetermined a direction in the horizontal plane fromthe estimated null-point, which he defined AS thelocation of equiphasic or isoelectric potentials.While the T wave may give an essentially isoelectricprojection, this is never the ease for the entireQRS complex. The estimate of the null point fromequiphasic potentials is an approximation which isnot strictly valid, since the R and the S waves areprojections of differently oriented parts of thespatial loop. In using the precordially located equi-phasic potential for determining the direction of ahorizontal plane "mean vector" it is implicitlyassumed that the frontal plane mean vector and thehorizontal plane mean vector are isochronous andequivalent. This is not necessarily the case. Thedegree of equivalence or the discrepancy will dependon the contour of the loop and its spatial orientation,on the chest configuration, etc. A qualitative analysisof spatial vectors has been made from the distribu-tion of "null contours," that is, equiphasic potentials,on the surface of the chest." This approach requiresnumerous chest leads. In some similar work on earlyright ventricular preponderance14 we used at least36 such leads. Since this method requires so manyleads and is subject to the same lack of null syn-chrony, it is not practical for routine clinical use.
The prevalent use of bi-polar derivation for thestandard leads in combination with central-terminal-referred leads for the precordial components is alsonot unimportant. The Wilson terminal is, at best,only relatively neutral as a reference electrode forthe frontal plane leads, but is not adequate for theprecordial lead reference. It has been recognizedfor some time that the Wilson terminal is not"neutral," and more pertinent quantitative informa-tion has recently been obtained.15 The use of Vleads, therefore, must be expected to contribute tothe discrepancies in vectors determined from the
by guest on May 13, 2018
http://circres.ahajournals.org/D
ownloaded from

322 COM PAR [SOX OF TWO SPATIAL ECG VECTOR METHODS
standard and precordial V leads. A considerableamount of attention has been paid in recent yearsto these and other problems of lead geometry. Boththe model and theoretical approaches have beenused by such investigators as Frank," McFee andJohnston,17 and Burger and van Milaan.18
The analysis of spatial vectors from conventionalleads in Grant's work has been essentially qualitativeand limited to the general direction of mean spatialvectors. One might feel that any quantitative analy-sis is unwarranted in view of the approximate natureof a mean spatial vector, but adoption of this viewwould require one to forego the real advantages ofeven a semiquantitative distinction between normaland abnormal conditions and among variousabnormal conditions. In the present paper we shallattempt to resolve this question by comparing theresults of a new semiquantitative method of analysisfrom conventional lead data" with the correspond-ing quantities obtained from a direct instantaneousspatial vector recording method.20"21
METHOD I
Aiialysis of Spatial Vectors From Uie ConventionalECG. In this method the mean vector directionsare expressed in terms of the azimuth (H°) andelevation (V°) angles for both the QRS and the Tcomplexes. The magnitude (Mag.) of each complex isalso determined, and the angle between the vectors isseparately specified even though it is implicit inthe other data. These spatial vectors are geomet-rically constructed with the aid of a simple mechani-cal analyzer, I". The vector projections in the horizon-tal plane are found from the "null points" in pre-cordial leads. The vector projections in the frontalplane are found from the standard leads by meansof a modified Einthoven procedure. Taking magni-tude from Lead I, which is a distant lead commonto both planes, and obtaining azimuth and elevationfrom the projections, the spatial vector is easilyresynthesized.
Despite the approximate nature of this procedure,we expected that a significant differentiation betweennormals and abnormals would be passible within theexperimentally determined limits of variability.Actually a significant differentiation was found notonly between normals and abnormals, but alsobetween several normal variables such as bodyweight, age, exercise."'53 This demonstrates that theapproach, in spite of its limitations, is superior tothe conventional analysis of scalar ECG's whichignores all spatial characteristics.
METHOD II
SVEC Analysis of Instantaneous Spatial VectorTraces. It is the purpose of the SVEC method10'*1
to portray quantitatively, and measurably, on aset of two cathode ray tubes a three-dimensionalstereoscopic image of the electrocardiographicspatial vector trace for photographic recording or fordirect visual observation. This purpose is best accom-
plished through electronic computation of a set ofthree nominally orthogonal and normalized vectorheart components representing respectively the X orhorizontal, the Y or vertical, and the Z or sagittalcomponent from any three different electrocardio-graphic leads.
These orthogonalized components, howeverobtained, are run through a resolver which elec-tronically recomputes the voltage data so as toconvert it from a simple frontal view into thechest, to a mathematically exact equivalent viewtoward the heart center from any chosen azimuth asset on one dial and any chosen elevation as set onanother. Such a rotation of coordinates permitsbest possible viewing of any chosen feature of theSVEC complexes and permits exact determinationof the spatial orientation of any features throughalignment of those features with a prime visualcoordinate.
The stereoscopic picture as viewed on the cathoderay screen is built up electronically by optical super-position in the two eye fields of two different pat-terns which represent the respective pictures whichthe individual eyes would see if looking at a three-dimensional graph of the vector data. The computerchanges the relationship between the two cathoderay spots visible at each instant with reference to afixed illuminated graticule seen by both eyes so thatonly by perceiving the spot as being at one particularspatial position can the eyes rationalize the imagethey see. In this manner the entire vector trace isscanned out spatially, and through persistence ofvision is seen as a pattern of three space loopsrepresenting the principal ECG complexes. Fromthe resolver on, the SVEC computer presents elec-trically an accurate visual image of whatever three-dimensional vector voltage data is supplied to it,irrespective of the source of such data. However,the synthesis of the data for use in the computerfrom chest and other leads is not unambiguouslyrelated to the theory of potential distribution in thebody. The resulting picture will depend on the leadlocations and the weighing and adjusting processgoverned by the particular theoretical convictionsof the experimenter. We, therefore, think of theSVEC system as comprising two parts: first anaccurate spatial presentation system for whateverX, Y, Z, data is supplied to it, and second, a weigh-ing and normalizing system which supplies theseadjusted data from the raw lead voltages.
This latter process has been accomplished withvarying degrees of approximation by different in-vestigators. Some have made the very crude sup-position that electric vector components will befound along any lines parallel to the anatomical X,Y, Z, axes. Others have used the somewhat betterapproximation that dipole theory for a fluid spheremay safely be employed. Haixlly any have attemptedto normalize the components to correct for electricaldistance and body inhomogeneities.
At the present time we are well aware that a good
by guest on May 13, 2018
http://circres.ahajournals.org/D
ownloaded from

SIMONSOX, SCHM1TT AND LE 323
lend system with pio|>erly determinedcoefficients is possible and are actively seeking such alend set with the aid of plastic, torso models and afeedback coefficient synthesizer; but in order to getuseable d a ta over the past three years while suchexperiments have lieen developing, we have stand-ardized on an interim arrangement of leads whichwas empirically determined to approximate ortho-gonality and which is not severely d is tor ted. Herethe leads themselves are used as the heart vectorcomponents in a first approximation to the moreexact values which a properly designed weighingmill mixing computer will ultimately provide.
The present system utilizes the following bipolarleads: a trcmsverse lead with the electrodes about 2cm. forward of the loft and right midaxillar linesand at the level of the fourth intercostal space atthe sternum, the pair constituting the X lead; avertical lead with one electrode on the forehead andone on the left leg, the pair constituting the Y lead;and a sagittal lead with the chest electrode 2 cm.to the right of the sternum at the fifth intercostalspace, and the back electrode directly behind thechest electrode, the pair constituting the Z lead.Considering positive po ten tia l components on thepatient as those which make the left side, the head,or the chest electrode positive, these conventionsresult with normal right-handed presentation co-ordinates in respective deflections towai-d theobserver's right, upward, and toward the observerfor positive component changes. Thus the patternobtained with the resolver set at azimuth zero,elevation zero corresponds to the actual directionsand magnitudes of the heart's electric (positive)"vector" during the heart beat as visualized by theobserver having a frontal view of the subject. Bymeans of the resolving computer, the observer maychange his point of view with respect to the sub-ject's pattern without moving the electrodes. Onedial changes the azimuth view as if the observer'sposition were being rotated about a vertical axis inthe subject. Azimuth angles are indicated on acontinuously variable scale in the following manner:zero degrees, front; 90°, left side; 180°, back; and270°, right side. A second dial controls the observer'seffective elevation. Positive angles indicate a superiorview and negative angles an inferior view with re-spect to the level of the subject's heart. Elevationin readings range from —90° (feet view) throughzero degrees (level view) to +90° (head view).When the pattern is rotated so that the major axis(or, for that matter, any instantaneous axis) pointsdirectly toward the observer, the azimuth and eleva-tion dials then read the orientation angles in spacefor that axis. Thus no computation is required toobtain these values, which may l>e read to anaccuracy of about ±L degree and which may bere]) rod need by different observers with a probableerror of not over 4 degrees.
The QRS axis orientation is obtained by usingthe azimuth control to rotate the pattern from its
Fio. 1. Procedure of obtaining the maximum QRSvector with the SVEC technique. The left and rightcolumns show slightly clifTeront patterns for stereo-scopic presentation, (a) Frontal view of the QRS loop,(b) QRS loop is rotated to point straight down bymeans of the azimuth control, (c) QRS loop is rotat-ed to point towards the observer by means of theelevation control. This pattern shown the minimumextension of the spatial QRS loop, (d) Elevation isrotated +00 degrees. QRS loop SHOWN maximum ox-tension.
frontally viewed position to one in which the axisis straight down, in the viewer's field. The pattern isthen rotated by means of the elevation control untilthe axis is directed toward the observer. The orienta-tion angles a re now read from the azimuth and eleva-tion dials. The pattern is next rotated from thisminimum projection position through +90 degreesby means of the elevation control so that it is nowseen at its maximum projection. This flat pattern isphotographed, and the amplitude of the axis read offon the calibrated reticule in the field of the pattern.The procedure is then repeated for the T maximumaxis. Figure 1 a to d shows the sequence of patternsfor a typical wise in which the QRS major axis isbeing determined.
In the present study it is the spatial vector trace
by guest on May 13, 2018
http://circres.ahajournals.org/D
ownloaded from

324 COMPARISON" OF TWO SPATIAL ECG VECTOR METHODS
built up from the X, Y, Z, components describedwhich we are comparing with the equiphasic-null-derived vector of method I to determine whether aclose correlation exists and consequently whetherdata derived from the first type of measurement canbe interpreted as nearly equivalent to that obtainedby the more exact electronically computed data.This correlation is not only of theoretical interestbut is of practical interest for it determines whetherthe null obtained without elaborate instrumentationcan, with a little labor, be converted into data other-wise obtainable only with the SVEC computer orits equivalent.
Experimental Group. The SVEC and the conven-tional ECG were taken on 48 normal middle-agedmen between 50 and 60 years. This was done in1953 and repeated in 1954. All men were members ofa larger experimental group and have been underobservation in five consecutive years (194S-1953).In addition to a thorough clinical examination,numerous laboratory tests were applied includingresponse to various physiological stress situationsin the annual check-ups. No evidence of pathologywas found in any of these subjects, and all historieswere negative. The criteria for normal conditionstherefore were more rigid than is usually the case.
RESULTS
Different coordinate conventions were orig-inally used in the conventional ECG measure-ments19 (method I) from those adopted forthe SVEC measurements (method II). Conse-quently, for comparison of the two methods,the values of method I were recalculated andexpressed in terms of method II conventions.
The angle (dA°) between the maximum as
well as the mean spatial QRS and T vectorswas measured with the mechanical analyzerpreviously mentioned." Group mean valuesfor the axis orientation angles and magnitudesof the mean vector (method I) and maximumvector (method II) were calculated separatelyfor 1953 and 1954. Corresponding individualstandard deviations were also calculated. Therewas no significant time change in the groupmeans or in the standard deviations for any ofthe items. We then calculated the individualaverages for the two repeat determinationsin order to obtain a more reliable set of valuesfor each subject, and table 1 lists the means(M) and standard deviations (S.D.) of thesevalues. The differences between the SVECand ECG means (row 5) were statistically sig-nificant in all items (t values, row 6), but theywere comparatively small for the QRS azimuthand the T elevation angles. Even the largerdifferences of 16° each in QRS-elevation andin T-azimuth are relatively small as comparedto the large mean differences found betweennormal groups and groups of patients, asmeasured by either one of the methods. BothQRS and T elevation were more negative (i.e.point more downward) for the mean spatialvectors (method I) than for the maximumvectors (method II). It was expected that themean spatial vectors would be smaller thanthe corresponding SVEC maximum vectors,but it was somewhat surprising to find them
TABLE 1
Method
I (ECG)
II (SVEC)
DifT. I-II
MS.D.MS.D.
MtFr
11519.6
10616.7
+92.351.3S0.432
QRS
El.'
- 3 926.3
- 2 312.5
- 1 6(3.S2)4.430.S93
Mag. 0.1 mV
0.90.302.10.43
- 1 . 2(16.2)
1.900.610
Aii °
4S11.66411.9
- 1 66.761.060.779
T
El.°
- 3 314.9
- 2 67.5
- 7(2.SO)4.000.752
Mag. 0.1 mV
0.30.100.70.1S
-0 .4(11.5)
3.240.6SS
dA°
54IS.63919.2
+ 153.041.070.533
Means (M) and standard deviations (S.D.) of azimuth (Azi.), elevation (EL), magnitude (Mag) of the mean(method [, conventional ECG) and the maximum spatial QRS and T vectors (method II, SVEC), and the anglebetween both vectors (dA°) in 48 normal men. Average of two measurements (1953 and 1954). Statistical sig-nifioance of t for the differences between the means: P .01 ™ 2.64; P .05 = 1.99. Statistical significance of F forthe differences between the S.D., P .01 = 1.99; P .05 — 1.63. Statistical significance of correlation coefficient rfor P .01 - .368.
by guest on May 13, 2018
http://circres.ahajournals.org/D
ownloaded from
S1M0XSUX, SCHMITT AND LtiVIXE 325
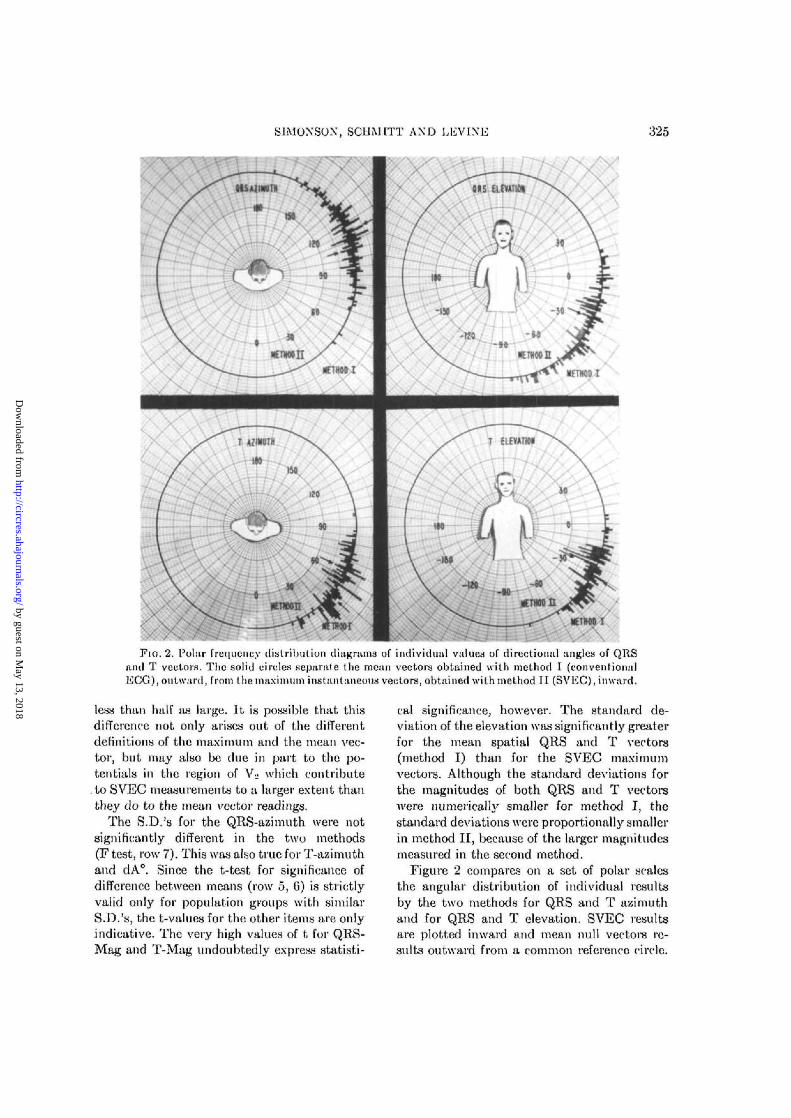
FIG. 2. Polar frequency distribution diagrams of individual values of directional angles of QRStuul T vectors. The solid circles separate the mean vectors obtained with method I (conventionalECG),outward, from the maximum instantaneous vectors, obtained with method II (SVEC), inward.
less than half as large. It is possible that thisdifference not only arises out of the differentdefinitions of the maximum and the mean vec-tor, but may also be clue in part to the po-tentials in the region of V« which contribute
. to SVEC measurements to a larger extent thanthey do to the mean vector readings.
The S.D.'s for the QRS-azimuth were notsignificantly different in the two methods(F test, row 7). This was also true for T-azimuthand dA°. Since the t-test for significance ofdifference between means (row 5, 6) is strictlyvalid only for population groups with similarS.D.'s, the t-values for the other items are onlyindicative. The very high values of t for QRS-Mag and T-Mag undoubtedly express statisti-
cal significance, however. The standard de-viation of the elevation was significantly greaterfor the mean spatial QRS and T vectors(method I) than for the SVEC maximumvectors. Although the standard deviations forthe magnitudes of both QRS and T vectorswere numerically smaller for method I, thestandard deviations were proportionally smallerin method II, because of the larger magnitudesmeasured in the second method.
Figure 2 compares on a set of polar scalesthe angular distribution of individual resultsby the two methods for QRS and T azimuthand for QRS and T elevation. SVEC resultsare plotted inward and mean null vectors re-sults outward from a common referenco circle.
by guest on May 13, 2018
http://circres.ahajournals.org/D
ownloaded from

326 COMPARISON OF TWO SPATIAL ECG VECTOR METHODS
TABLE 2 TABLE 3
Method
I (ECG)
JI (SVEC)
J (ECO)
II (SVEC)
19631954)053954)953954
)953954
MS.D.
MMMMS.D.S D.FSD.8.D.F
QRS
Aii.
11611410610619S20.S
1.11IS g157I 43
El
- 4 0- 3 9- 2 2- 2 4
26.927.4
1.0412.913.31.07
0.90.92.12.20.320.311 OS0.450.441.03
Aii.
4S49
61
6S
12 S120113
133135129
El
-32-33-25-27
16.515.51137 6S.6159
.34 5433 53
0.70 70.110.131.2S
0.1S220.211.03
dA°
423519.619 11.05
517.S1.3S
Means (M) und atandnrd deviations (S.D.) of mean (mothod I)and maximum (method II) spatiul vectors of 4S normal men in twodoterminationa (1953 and 1054). Statistical significance of F for dif-ference* between the S D for P 0.01 - 1.99; P 0 05 - 1.63
Means for each distribution are indicated byarrows. It is evident that the distributions areall basically similar but that the means arequite significantly difTerent in the case of theQRS elevation and T azimuth and that thedistributions are noticeably difTerent in breadthfor some of the items, for example the QRSelevation.
Method
In
sD.D.F
D.D.
An.
1091
6915
QRS
El.
1373
3514LSI
Map.
001
1927SI
Aii.
S123
9001
T
El.
11.46.51.53
Mag
002
131515
dA*
1013
1
5031
Annual repent variability of the mean (methodI) and maximum spatial QRS and T vector (methodII), expressed as standard deviations of the individ-ual differences, in two repeats on 48 normal men,separated by an interval of one year. Statisticalsignificance of F for P .01 = 1.99; P .05 = 1.63.
Table 2 shows the means and the S.D.'s sepa-rately for 1958 and 19.54. The group meanswere essentially the same for the two years,and differences were not statistically significantexcept for T-azimuth of method II. The S.D.'sdid not vary significantly.
Table 3 shows the repeat variability ex-pressed as S.D. of the individual differencesin the 1953 and 1954 determinations. The re-peat variability was substantially the same in
SVEC
Fio. 3. Scatter diagrams of directional angles of mean QRS and T vectors (method I, ordinate)versus maximum QRS and T vectors (method II, abscissa).
by guest on May 13, 2018
http://circres.ahajournals.org/D
ownloaded from

S1M0XS0X, SCHMITT AND LlSVIXti 827
both methods for QRS azimuth and for dA°,it was significantly greater for QRS and T ele-vation in method I, and for T azimuth, QRSand T Mag in method II. It appeal's that withrespect to repeat variability there is no con-sistent superiority of one or the other method.
The correlations between the mean (methodI) and the maximum (method II) vectors isillustrated by a set of scatter diagrams infigure 3 for the direction angles (azimuth,elevation) and as correlation coefficients, r, inthe last row of Table 1 for all seven items. Thecorrelation was highly significant statistically,exceeding the one per cent level, for all items.The highest correlation coefficient was ob-tained for the QRS-elevation (r = 0.893).
If in methods I and II identical phenomenawere being measured by fully equivalent pro-cedures, each best line in the scatter diagramsof Figure 3 would have an inclination of 45°and pass through the origin (zero on both ECGand SVEC axes). Since the slopes deviate ap-preciably from 45° in all cases, and since theintercepts are different from zero, at least inthe case of the QRS azimuth, it is evident thatthe two methods of measurement differ morethan statistically.
DISCUSSION
A central problem of spatial vector electro-cardiography is that of defining a set of direc-tions and magnitudes which will correctlycharacterize the principal electrocardiographiccomplexes. These "vector" quantities whichpresumably represent the P, the QRS, and theT complexes can be arrived at in numerousdifferent ways using various combinations ofexperimental data and theoretical concepts.We must expect the results obtained on oneindividual by different methods to differ forfour reasons: (1) there will be an experimentaluncertainty error in each measurement, (2)the vector components used to reconstruct thetotal vector may be non-equivalent, (3) themethods may emphasize differently the detailsof the averaging process by which a singlevector is made to represent all of the contribu-tions from various pails of the heart at eachinstant, and (4) the propagation of systematicerrors through the reconstruction process by
which the total vectors are synthesized mayintroduce deviations.
In this study we have made measurementson a fairly large group of normal individualsby two methods which differ in most of theabove particulars to learn whether, in spite ofwidely different experimental procedures andtheoretical detail, comparable results can beobtained. Specifically, we wished to determinewhether a statistical correlation existed be-tween the two methods and whether this corre-lation would be high enough to allow predictionof individual results from one method to theother. Such a predictive relationship, if found,would obviously encourage use of the simplermethod.
In order to determine the inherent experi-mental uncertainties in each method, repeatdeterminations were run and their internalconsistency measured. Both methods werehighly reproducible and were comparable inprecision, so that the large differences foundmust be attributed mainly to factors 2 and 3above. These should therefore lie consideredin somewhat more detail.
Method I makes several assumptions whichare not required in method II and which cantherefore cause differences: (a) the unipolarlead referred to a Wilson terminal is equivalentto a geometrically similar bipolar lead, (b)the maximal and the minimal values of eachunipolar potential component are simultaneous,(c) the maximal vector component is directedperpendicular to the direction at which anequiphasic minimum is found. In addition itshould be pointed out that both methodsneglect normalization procedures which couldcompensate for varying electrical proximity tothe heart and neither method is able to cor-rect for quadripole and higher terms which repre-sent the deviations from dipole theory whichmust exist for a heart of finite size. These addi-tional factors introduce errors which are notnecessarily equal in the two methods.
The significant deviation in mean amplitudesand absolute mean vector angles points to afundamental difference between the two sets ofvector components used. From this we mustconclude that the methods are not interchange-able. Much of the difference is no doubt charge-
by guest on May 13, 2018
http://circres.ahajournals.org/D
ownloaded from

328 COMPARISON" OF TWO SPATIAL ECG VECTOR METHODS
able to the non-ideal unipolar componentsmeasured with reference to a Wilson centralterminal but some must be attributed to thegeometrical difference between the normalvector direction and its perpendicular as de-termined from equiphasic minima.
As the measurements by the two methodsshow a high degree of statistical correlationon a group basis we must conclude that theyare related fundamentally. The correlation isnot high enough to predict the more accurateinformation, as obtained with the SVEC, fromthe more approximate data of method I, butconstruction of the mean vector from the con-ventional ECG as a first approximation isjustified.
The statistically significant correlation be-tween methods 1 and II, also has some bearingon the general validity of spatial vector analysisfor electrocardiographic interpretation. If, aspostulated by the proponents of "unipolarelectrocardiography," single unipolar leadsrecord primarily local events, no correlationcould be expected for the construction ofspatial vectors by methods so different as thosecompared in this study. Therefore, the correla-tion is in general agreement with the results ofthe dipole theory validity tests using mirrorpattern cancellations.
It is our hope that in a future communicationcomparable measurements can be reportedwhere identical leads are used. This approachwill eliminate differences inherent in centralterminals and lead geometry and will leaveprimarily the differences due to the equiphasicmean null.
SUMMAKY
Two quite different methods for measuringthe principal spatial vector electrocardiographiccomplexes are tested by direct comparison ofresults on a group of 48 normal men in two con-secutive annual investigations.
In the first method the vectors are con-structed from conventional ECG leads with theaid of a simple mechanical vector synthesizer.A frontal plane vector projection, obtainedby conventional Einthoven technic, is combinedwith a mean equiphasic null direction in the
horizontal plane as determined from precordialleads referred to a standard Wilson terminal.
In the second method spatial vector loopsare viewed directly in a stereoscopic space withthe aid of the SVEC computer, and the magni-tudes and directions of the maximum QRS andT vectors are read off directly.
Results obtained by either method are highlyreproducible individually and form in eachcase a typical population of values distributedover a large solid angle. The annual repeatvariability is similar in both methods and sub-stantially larger than the immediate repeatvariability.
The mean values of the spatial orientationangles and the vector amplitudes are sta-tistically quite different by the two methods,but there is statistically a highly significantcorrelation between the two sets of values.
It is concluded that one should consider thespatial vector built up from equiphasic meannull precordial direction and Einthoven frontalvector as closely related but not equivalent to,and not individually predictable from the max-imum SVEC spatial vector.
REFERENCES1 SCHMITT, 0. H., LKVINE, R. B. AND SIMONSON, E.:
Electrocardiogniphic mirror pattern studies. I.Experimental validity tests of the dipole hy-pothesis and of the central terminal theory. Am.Heart J. 46: 410, 1953.
! LKVINE, R. B., SCHMITT, 0. H. AND SIMONSON,E.: Electrocardiograph ic mirror pattern studies.II. The statistical and individual validity ofthe heart dipole concept as applied in electro-curdiogmphic analj'sis. Am. Heart J. 46: 500,1953.
3 SIMONSON, E., SCHMITT, O. H., LEVINE, R. B.AND DAHL, J. C : Electrocardiographic mirrorpattern studies. III. Mirror pattern cancellationin normal and abnormal subjects. Am. HeartJ. 45: 655, 1953.
4 SCHAEFER, H.: Das Elektrokardiogramm. Theorie
and Klinik. Berlin, Springer 1951, p. 556.6 DUCHOSAL, P. W. AND SULZER, R.: La vec.to-
dardiographie. Basel, S. Karger, 1949, p. 172.4 SCHERLIS, L., LASSER, R. P. AND GRISHMAN, A.:
Spatial vectorcardiography. The normal vector-cardiogram. VI. Am. Heart J. 42: 235, 1951.
7 — AND GRISHMAN, A.: Spatial veetorcardiography.Left bundle branch blook and left ventricularhypertrophy. II. Am. Heart J. 41: 494, 1951.
by guest on May 13, 2018
http://circres.ahajournals.org/D
ownloaded from

SIMONSON, SCHMITT AND LEVINE 329
8 •—: Spatial vector cardiograph)'. MyocardialP infarction. V. Am. Heart .1. 42: 24, 1951.
9 POLZEK, K.: Vergleiehende Gegeniiberstellungdei1 gebriiuchlichen Abnahme-methoden derVektorkardiographie. Verhandl. deutsch. Ges.Kreislaufforsch. 18: 91, 1952.
10 SCHUHFRIED, F.: Physikalische Ueberpilifungder vektorkardiographischen Abnahmetechnik.Verhandl. deutsch. Ges. Kreislaufforsch. 18:94, 1952.
" ElNTHOVKN, W., F A H R , G. AND DE W A A H T , A.:
On the direction and manifest size of the varia-tions of potential in the human heart and on theinfluence of the position of the heart on theform of the ECG. Am. Heart J. 40: 163, 1950.
11 GRANT, R. P.: Spatial vector electrocardiograph}'.A method for calculating the spatial electricalvectors of the heart from conventional leads.Circulation 2: 676, 1950.
13 —: The relationship of unipolar chest leads tothe electrical field of the heart. Circulation 1:S7S, 1950.
14 DAHL, J. AND SIMONSON, E.: Spatial vectoranalysis of early right ventricular preponder-ance. Am. Heart J. 45: 841, 1953.
16 LEVINE, R. B. AND SCHMITT, 0. H.: Aii elec-
tronically weighted and stabilized centralterminal. Am. J. Physiol. 163: 72S, 1950.
16 FRANK, E. AND KAY, C. F.: A reference potentialfor unipolar electrocardiograph k- measurementson models. Am. Heart J. 46: 195, 1953.
17 MCFEE, R. AND JOHNSTON, F. D.: Eleetrocardio-
graphic leads. Circulation 9: S6S, 1954.18 BURGER, H. C. AND VAN MILAAN, J. B.: Heart
vector and leads. Br. Heart J. 10: 229, 1948.19 SIMONSON, E.: A spatial vector analyzer for the
conventional electrocardiogram. Circulation7: 403, 1953.
20 LEVINE, R. B. AND SCHMITT, 0. H.: Three-
dimensional electrocardiograph)'. Proc. Fed.Am. Soc. Exper. Biol. 8: 95, 1949.
11 SCHMITT, 0. H. AND LEVINE, R. B.: Direct
visual examination of stereovectorelectrocardio-grams. Proc. Fed. Am. Soc. Exper. Biol. 11:140, 1952.
" SIMONSON, E. AND KEYS, A.: The spatial QRS
and T vector in 17S normal middle-aged men.Circulation 9: 105, 1954.
M KIMURA, N. AND SIMONSON, E.: The effect of
moderate and hard muscular work on the spatialelectrocardiogram. Am. Heart J. 45: 676, 1953.
by guest on May 13, 2018
http://circres.ahajournals.org/D
ownloaded from

ERNST SIMONSON, OTTO H. SCHMITT and RAPHAEL B. LEVINEVectors Derived from Conventional ECG Leads
Comparison of Spatial Instantaneous ECG Vectors, Measured with the SVEC, with Mean
Print ISSN: 0009-7330. Online ISSN: 1524-4571 Copyright © 1955 American Heart Association, Inc. All rights reserved.is published by the American Heart Association, 7272 Greenville Avenue, Dallas, TX 75231Circulation Research
doi: 10.1161/01.RES.3.4.3201955;3:320-329Circ Res.
http://circres.ahajournals.org/content/3/4/320World Wide Web at:
The online version of this article, along with updated information and services, is located on the
http://circres.ahajournals.org//subscriptions/
is online at: Circulation Research Information about subscribing to Subscriptions:
http://www.lww.com/reprints Information about reprints can be found online at: Reprints:
document. Permissions and Rights Question and Answer about this process is available in the
located, click Request Permissions in the middle column of the Web page under Services. Further informationEditorial Office. Once the online version of the published article for which permission is being requested is
can be obtained via RightsLink, a service of the Copyright Clearance Center, not theCirculation Research Requests for permissions to reproduce figures, tables, or portions of articles originally published inPermissions:
by guest on May 13, 2018
http://circres.ahajournals.org/D
ownloaded from