Comparison of Sample Preparation Techniques for Reduction ... · PDF file1 sigma-aldrich.com...
22
1 sigma-aldrich.com Comparison of Sample Preparation Techniques for Reduction of Matrix Interference in Biological Analysis by LC-MS-MS Charles Mi, Michael Ye, and An Trinh Supelco, Division of Sigma-Aldrich, Bellefonte, PA 16823 USA T408163
Transcript of Comparison of Sample Preparation Techniques for Reduction ... · PDF file1 sigma-aldrich.com...
1
sigma-aldrich.com
Comparison of Sample Preparation Techniques for Reduction of Matrix Interference in Biological Analysis by LC-MS-MS
Charles Mi, Michael Ye, and An TrinhSupelco, Division of Sigma-Aldrich, Bellefonte, PA 16823 USA
T408163

2
sigma-aldrich.com
Three different sample preparation techniques are evaluated in this study for effective removal of phospholipids matrix interference. Sample preparation techniques include protein precipitation (PPT), solid phase extraction (SPE) and HybridSPE technique. The degree of phospholipids interference varied greatly between the three sample preparation techniques. HybridSPE technique efficiently removed phospholipids and protein resulting in the least matrix interference. SPE removed minimal phospholipids and protein resulting moderate matrix interference. Protein precipitation removed only gross of levels of proteins from biological with no removal of phospholipids resulting in greatest matrix interference.
Abstract

3
sigma-aldrich.com
Matrix effects in biological samples have been shown to be a source of variability and inaccuracy in liquid chromatography mass spectrometry (LC-MS). Co-elution of endogenous phospholipids with analyte can cause matrix effect ion- suppression or enhancement that dramatically impact quantitative LC-MS-MS. In this study, three different sample preparation techniques are evaluated for effective removal of phospholipids matrix interference. HybridSPE method are optimized in this study and SPE and PPT methods both are generic methods without further modification.
Introduction

4
sigma-aldrich.com
Sample Preparation Methods
Generic polymeric SPE (60 mg/3 mL):
• Condition with 1 mL methanol and 1 mL water• Load 500 µL rat or dog plasma• Wash with 5% methanol in water• Elute with 1 mL methanol• Evaporate and recondition with 2 mL of water/acetonitrile with 1% FA (1:3)
HybridSPE Techniques:
• Load 100 µL rat or dog plasma• Add 300 µL acetonitrile with 1% FA• Vortex 1 min. before vacuum• Analyze the eluent via LC-MS
Protein Precipitation (PPT):
• Load 100 µL rat or dog plasma• Add 300 µL acetonitrile with 1% FA• Mix for 1 min. and centrifuge at 5K RPM for 3 min. • Analyze the sup via LC-MS

5
sigma-aldrich.com
Experiment 1Study Phospholipids Breakthrough
LC-MS: Agilent 1100/ABI Q-trap 3200, Turbo Ion Spray ESI+column: Ascentis® Express C18, 5 cm x 2.1 mm I.D.
mobile phase A: 65% acetonitrile with 0.1% ammonium formate mobile phase B: 35% water with 0.1% ammonium formate
flow rate: 200 µL/min.temp.: 30 °C
injection: 5 µL dog plasma sample prepared by different sample preparation methods
CUR IS TEM GS1 GS2 ihe CAD20 3500 500 40 55 ON Medium
Q1 Mass (amu) Q3 Mass (amu) Dwell(msec) DP EP CEP CE CXP184 184 50 100 10 10 29 4
Mass Parameters:
6
sigma-aldrich.com
XIC of +MRM (2 pairs): 184.0/184.0 amu from Sample 2 (090208003) of 090208infu.wiff (Turbo Spray) Max. 1700.0 cps.
0.5 1.0 1.5 2.0 2.5 3.0 3.5 4.0 4.5 5.0 5.5 6.0274 546 819 1091 1364 1637 1909 2182 2454 2727 3000 3272
Time, min
0.0
5000.0
1.0e4
1.5e4
2.0e4
2.5e4
3.0e4
3.5e4
4.0e4
4.5e4
5.0e4
5.5e4
6.0e4
6.5e4
7.0e4
7.5e4
8.0e4
8.5e4
9.0e4
9.4e4
Intensity, cps
0.720.66 0.80
PPT method
SPE method
HybridSPE method
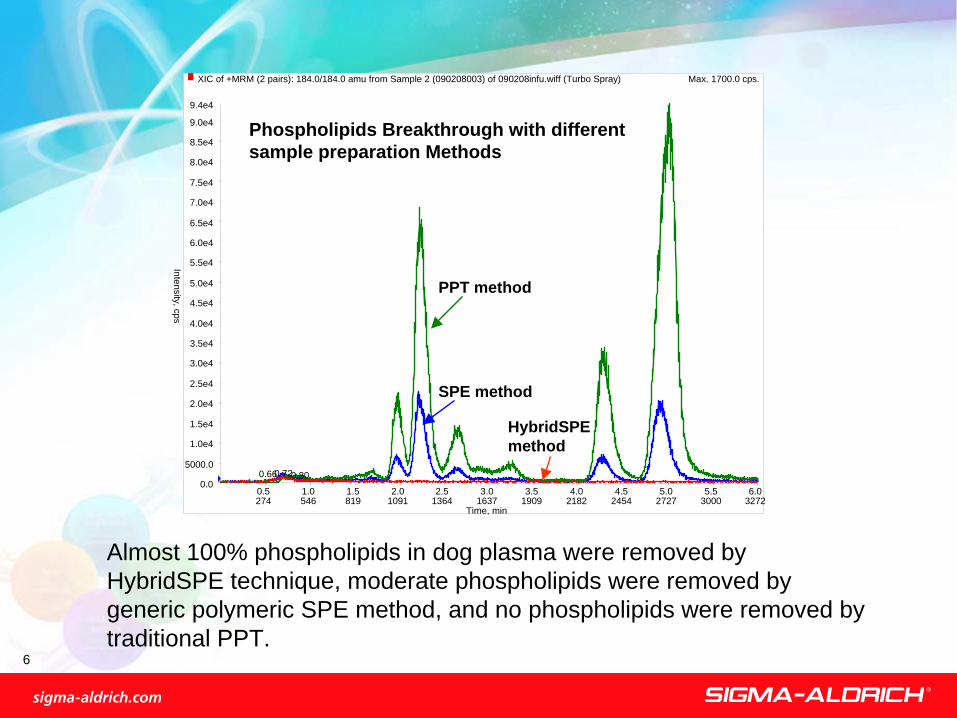
Phospholipids Breakthrough with different sample preparation Methods
Almost 100% phospholipids in dog plasma were removed by HybridSPE technique, moderate phospholipids were removed by generic polymeric SPE method, and no phospholipids were removed by traditional PPT.

7
sigma-aldrich.com
Experiment 2Study Drug Compounds Recovery
Step Total Time (min.) Flow Rate (µL/min.) A (%) B (%)0 0.0 200 75 25
1 2.0 200 95 5
2 4.5 200 95 5
3 5.0 200 75 25
4 7.0 200 75 25
LC-MS: Agilent 1100/ABI Q-trap 3200, Turbo Ion Spray ESI+column: Discovery® HS F5, 10 cm x 2.1 mm I.D.
mobile phase A: acetonitrile with 10 mM ammonium formate mobile phase B: water with 10 mM ammonium formate
flow rate: 200 µL/min.temp.: 30 °C
injection: 5 µL of the rat plasma samples cleanup with different sample preparation methods
8
sigma-aldrich.com
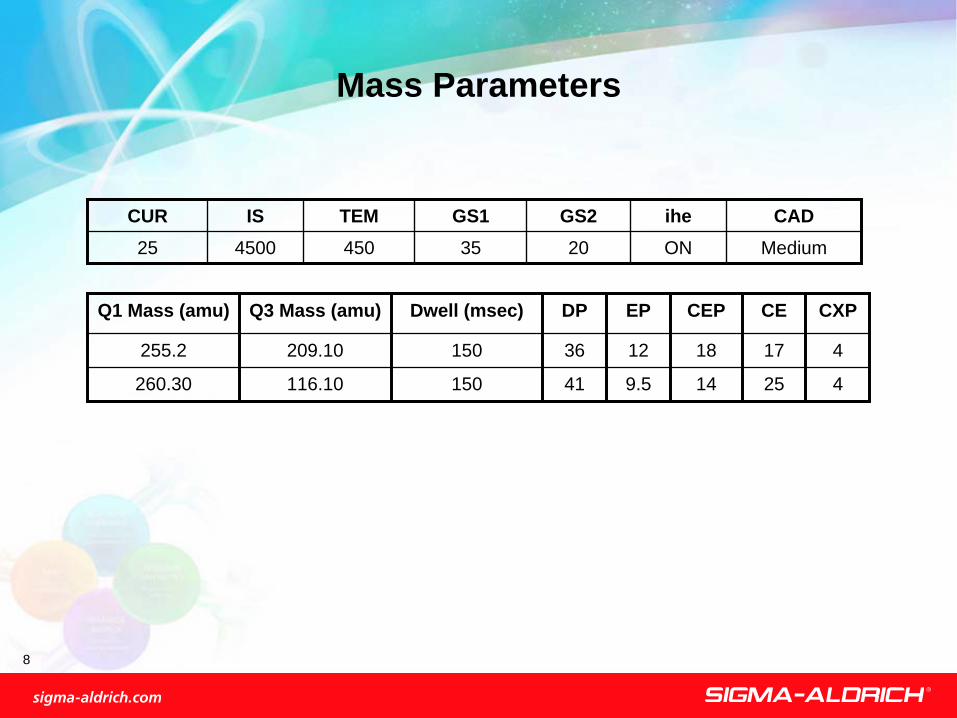
CUR IS TEM GS1 GS2 ihe CAD25 4500 450 35 20 ON Medium
Mass Parameters
Q1 Mass (amu) Q3 Mass (amu) Dwell (msec) DP EP CEP CE CXP
255.2 209.10 150 36 12 18 17 4
260.30 116.10 150 41 9.5 14 25 4

9
sigma-aldrich.com
Structures of Compounds in this Study
KetoprofenO
OH
O
CH3
+MRM: 255.20/209.10 amu
Propranolol
O
NH
OH
+MRM: 260.30/116.10 amu
10
sigma-aldrich.com
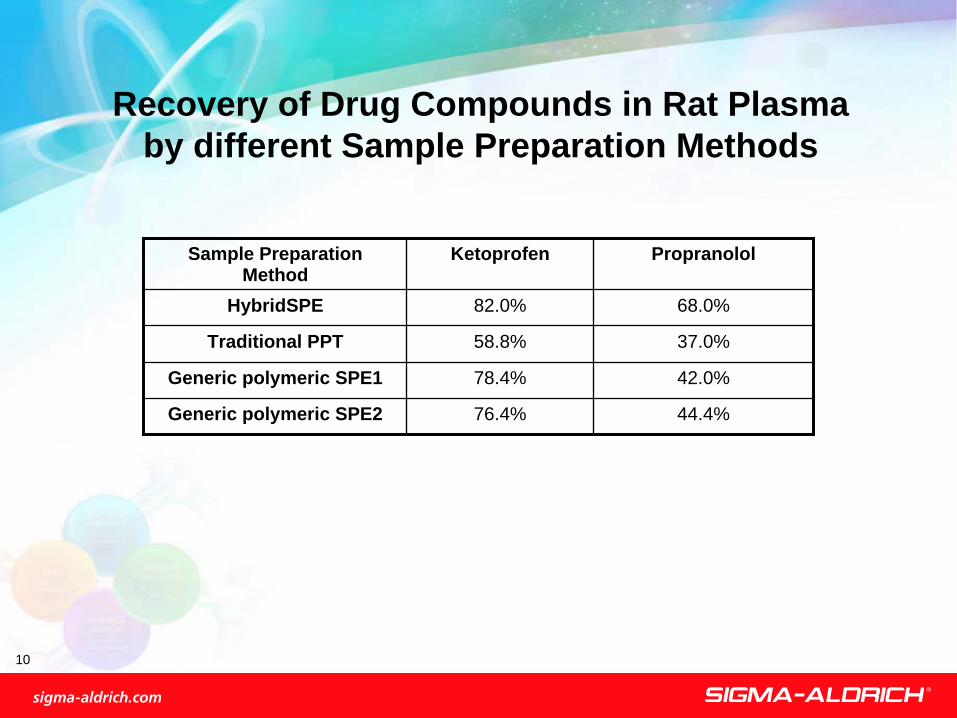
Recovery of Drug Compounds in Rat Plasma by different Sample Preparation Methods
Sample Preparation Method
Ketoprofen Propranolol
HybridSPE 82.0% 68.0%
Traditional PPT 58.8% 37.0%
Generic polymeric SPE1 78.4% 42.0%
Generic polymeric SPE2 76.4% 44.4%

11
sigma-aldrich.com
HybridSPE method provided highest recovery for both compounds and generic polymeric SPE method provided moderate recovery of both compounds while PPT method provided least recovery of both compounds.
Recovery of drug compounds in rat plasma
0%10%20%30%40%50%60%70%80%90%
HybridSPE SPE1 SPE2 PPT
Sample cleanup methods
Rec
over
yKetoprofenPropranolol

12
sigma-aldrich.com
XIC of +MRM (2 pairs): 260.3/116.1 amu from Sample 29 (092007007) of 092007.wiff (Turbo Spray) Max. 273.3 cps.
0.5 1.0 1.5 2.0 2.5 3.0 3.5 4.0 4.5 5.0 5.5 6.0 6.5Time, min
0
20
40
60
80
100
120
140
160
180
200
220
240
260
280
300
320
340
360
380
400
420
440
3.24
3.28
3.20
3.17
3.37
2.102.55 5.75
3.70 5.452.73
Hybrid PPt
Ketoprofen and Propranolol in Rat Plasma cleanup by HybridSPE
XIC of +MRM (2 pairs): 260.3/116.1 amu from Sample 28 (092007009) of 092007.wiff (Turbo Spray) Max. 166.7 cps.
0.5 1.0 1.5 2.0 2.5 3.0 3.5 4.0 4.5 5.0 5.5 6.0 6.5Time, min
0
20
40
60
80
100
120
140
160
180
200
220
240
260
280
300
320
340
360
380
400
420433
3.243.15
3.313.101.551.51
2.041.98 4.730.03 3.402.33 3.620.95 4.80 6.11 6.55
PPT
Ketoprofen and Propranolol in Rat Plasma cleanup by PPT
Recovery of propranolol in rat plasma by PPT method are much lower than the recovery of propranolol by HybridSPE method because of biological sample matrix interference in PPT sample.

13
sigma-aldrich.com
However, lower recovery of propranolol in SPE samples was also found. Some propranolol were found adsorbing on polymeric SPE stationary phase. Therefore, stronger organic solvent may require to elute the rest of propranolol from polymeric SPE phase to improve its recovery.
Recovery of ketoprofen and propranolol in rat plasma
0%10%20%30%40%50%60%70%80%90%
100%
SPE1-pre SPE1-post SPE2-pre SPE2-post
Pre-spiked and post-spiked rat plasma
Reo
cver
yKetoprofenPropranolol

14
sigma-aldrich.com
XIC of +MRM (2 pairs): 260.3/116.1 amu from Sample 26 (092007013) of 092007.wiff (Turbo Spray) Max. 300.0 cps.
0.5 1.0 1.5 2.0 2.5 3.0 3.5 4.0 4.5 5.0 5.5 6.0 6.5Time, min
0
20
40
60
80
100
120
140
160
180
200
220
240
260
280
300
320
340
360
380
400
420
3.28
3.22
3.383.16
3.451.493.632.92
3.994.19 4.46 6.481.740.490.22 4.87 5.19 5.84 6.56
HL post
Post-spiked Ketoprofen and Propranolol in Rat Plasma cleanup by SPE
XIC of +MRM (2 pairs): 260.3/116.1 amu from Sample 24 (092007015) of 092007.wiff (Turbo Spray) Max. 233.3 cps.
0.5 1.0 1.5 2.0 2.5 3.0 3.5 4.0 4.5 5.0 5.5 6.0 6.5Time, min
0
50
100
150
200
250
300
350
400
450
500
550
580
3.28
3.23
3.203.36
3.453.072.61 5.804.131.75 1.97 5.032.75 4.841.29 3.73 6.350.39 2.51 4.29 5.170.95 6.43
Pre-spiked Ketoprofen and Propranolol in Rat Plasma
cleanup by SPE
Recovery of pre-spiked propranolol in rat plasma by SPE method are low and recovery of post-spiked propranolol in rat plasma by SPE method are higher.

15
sigma-aldrich.com
Two compounds with or without rat plasma were studied by HybridSPE method. There is no big difference in their recovery by using this method. That means there is no or less matrix effect on these compounds by HybridSPE technique, but some propranolol may adsorb on the HybridSPE under current condition.
Matrix Effect on HybridSPE
0
0.2
0.4
0.6
0.8
1
1.2
Ketoprofen Propranolol
Drug compounds in different matrix
Rec
over
yw/o plasmaw/plasma

16
sigma-aldrich.com
Experiment 3Optimization of HybridSPE Method
Two different acid modifiers were compared in this study. The acids tested were formic acid (FA) and acetic acid (HA). The acid concentration was systematically adjusted and measured against recovery using a representative acidic compound (ketoprofen) and basic compound (propanolol) diluted in rat plasma (100 ng/mL).Ratio of plasma and crashing solvent volume with two different acid modifiers were also studied. The ratio was adjusted to 1:2, 1:3 and 1:5, respectively. HPLC and MS condition are the same as for Experiment 2.

17
sigma-aldrich.com
Ketoprofen in Plasma by HybridSPE 1
0%20%40%60%80%
100%120%
0.0% 0.1% 0.2% 0.5% 1.0% 1.5% 2.0%
Acid % in Acetonitrile
Rec
over
y FA
HA
Acid type and amount had great affect on the recovery of ketoprofen (acidic compounds). 1% acid modifier are optimized for giving an acceptable recovery of acidic compounds.

18
sigma-aldrich.com
Propranolol in plasma recovery by HybridSPE 1
0%
20%
40%
60%
80%
100%
0.0% 0.1% 0.2% 0.5% 1.0% 1.5% 2.0%
Acid % in Acetonitrile
Rec
over
y
FA
HA
Acid type and amount had little affect on the recovery of propanolol (basic compounds).

19
sigma-aldrich.com
Ketoprofen in plasma by HybridSPE 2
0%
20%
40%
60%
80%
100%
120%
1:2 1:3 1:5
Crash Ratio (w /1% acid in acetonitrile)
Rec
over
y
FA
HA
Ratio of plasma and crashing solvent with different acid modifiers had some affect on the recovery of ketoprofen (acidic compounds).
20
sigma-aldrich.com
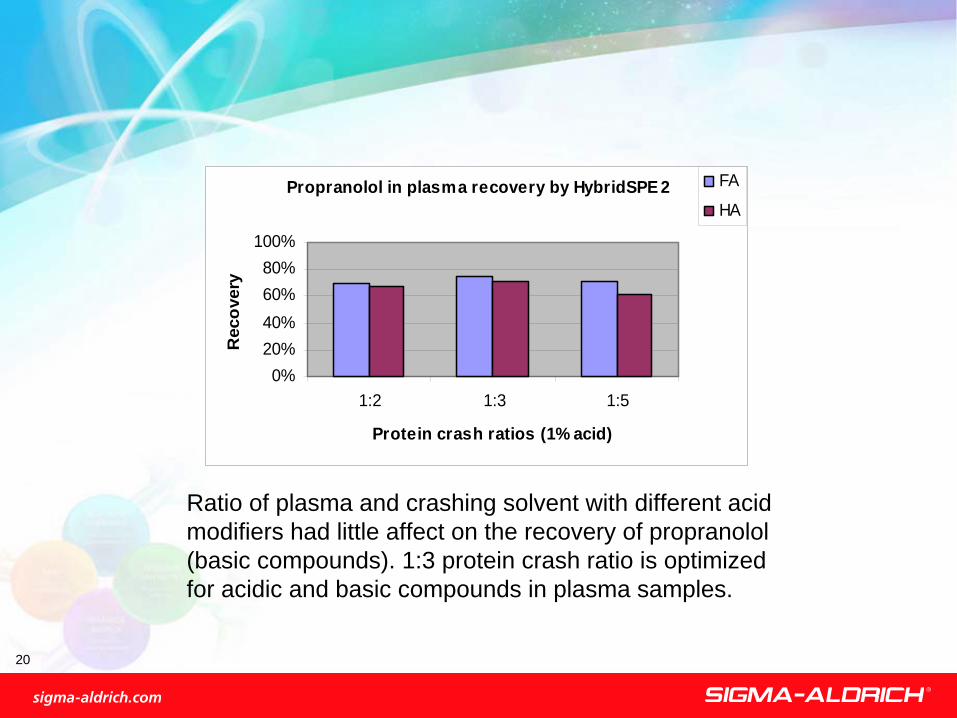
Propranolol in plasma recovery by HybridSPE 2
0%20%40%60%80%
100%
1:2 1:3 1:5
Protein crash ratios (1% acid)
Rec
over
y
FA
HA
Ratio of plasma and crashing solvent with different acid modifiers had little affect on the recovery of propranolol (basic compounds). 1:3 protein crash ratio is optimized for acidic and basic compounds in plasma samples.

21
sigma-aldrich.com
Propranolol Calibration (R = 0.9991) 54a-zrsi-plasma.rdb (propranolol): "Linear" Regression ("No" weighting): y = 87.6 x + 8.68 (r = 0.9991)
5 10 15 20 25 30 35 40 45 50 55 60 65 70 75 80 85 90 95 100Concentration, ng/mL
500
1000
1500
2000
2500
3000
3500
4000
4500
5000
5500
6000
6500
7000
7500
8000
8500
9000
54a-zrsi-plasma.rdb (ketoprofen): "Linear" Regression ("No" weighting): y = 96.6 x + 14.1 (r = 0.9995)
5 10 15 20 25 30 35 40 45 50 55 60 65 70 75 80 85 90 95 100Concentration, ng/mL
500.00
1000.00
1500.00
2000.00
2500.00
3000.00
3500.00
4000.00
4500.00
5000.00
5500.00
6000.00
6500.00
7000.00
7500.00
8000.00
8500.00
9000.00
9500.00
1.00e4
Ketoprofen Calibration (R = 0.9995)
Calibration Curves of Ketoprofen and Propranolol in Rat Plasma cleanup by HybridSPE

22
sigma-aldrich.com
The degree of phospholipids interference varied greatly between the three sample preparation techniques. HybridSPE technology efficiently removed phospholipids and protein resulting in the least matrix interference. SPE removed minimal phospholipids and protein resulting moderate matrix interference. Protein precipitation removed only gross levels of proteins from biological with no removal of phospholipids resulting in greatest matrix interference. 1:3 ratio of plasma and acetonitrile with 1% formic acid is the optimized HybridSPE sample preparation condition.
Conclusions