Comparison of rotational grazing and continuous grazing on ... · PDF fileFactors such as...
36
DEPARTMENT OF PRIMARY INDUSTRY, FISHERIES AND MINES Comparison of rotational grazing and continuous grazing on a buffel grass (Cenchrus ciliaris) dominated pasture: preliminary results from Mt Riddock Station. Kain, A.J. and Cowley, R.A. April 2008 This report presents preliminary findings from the grazing trial conducted at Mt Riddock Station as part of the Desert Knowledge CRC project “Rangelands grazing management strategies for improved economics and resource stability” funded by the National Landcare Program. The project was completed by a partnership including DPIFM, CLMA, DKCRC, CSIRO and the Cadzow family of Mt Riddock Station.
Transcript of Comparison of rotational grazing and continuous grazing on ... · PDF fileFactors such as...

DEPARTMENT OF PRIMARY INDUSTRY, FISHERIES AND MINES
Comparison of rotational grazing and continuous grazing on a buffel
grass (Cenchrus ciliaris) dominated pasture: preliminary results from
Mt Riddock Station.
Kain, A.J. and Cowley, R.A.
April 2008
This report presents preliminary findings from the grazing trial conducted at Mt Riddock Station as part of the Desert
Knowledge CRC project “Rangelands grazing management strategies for improved economics and resource stability”
funded by the National Landcare Program. The project was completed by a partnership including DPIFM, CLMA,
DKCRC, CSIRO and the Cadzow family of Mt Riddock Station.

1
Table of Contents
Acknowledgements..............................................................................................................................2
Abstract ................................................................................................................................................3
1. Background .....................................................................................................................................4
Study Site .........................................................................................................................................5
Hypotheses .......................................................................................................................................5
2. Methodology ...................................................................................................................................6
Grazing Strategies ............................................................................................................................6
Stocking rate ....................................................................................................................................7
Seasonal Conditions.........................................................................................................................7
Pasture Assessment ..........................................................................................................................7
Stock Performance .........................................................................................................................10
Statistical analysis ..........................................................................................................................10
3. Results...........................................................................................................................................11
Seasonal Conditions.......................................................................................................................11
Stocking Rates................................................................................................................................12
Carrying Capacity ..........................................................................................................................13
Utilisation of pasture......................................................................................................................14
Land Condition ..............................................................................................................................16
Species Diversity............................................................................................................................22
Pasture Quality (Rank Material) ....................................................................................................25
Stock Performance .........................................................................................................................26
4. Discussion .....................................................................................................................................27
Seasonal conditions........................................................................................................................27
Carrying Capacity and Profitability ...............................................................................................27
Cattle behaviour .............................................................................................................................28
Land Condition ..............................................................................................................................29
Species Diversity............................................................................................................................30
Pasture Quality...............................................................................................................................30
Fire Risk.........................................................................................................................................30
Stock Performance .........................................................................................................................31
5. Future Work/Conclusions .............................................................................................................31
Hypotheses .....................................................................................................................................31
Technical Implications...................................................................................................................32
Industry Recommendations............................................................................................................33
6. References .....................................................................................................................................34

2
Acknowledgements
The Department of Agriculture, Fisheries and Forestry’s National Landcare Program provided
funding through the Desert Knowledge CRC to finance this project in conjunction with the
Northern Territory Department of Primary Industry, Fisheries and Mines. This project was
completed by a partnership including the Department of Primary Industry, Fisheries and Mines, the
Centralian Land Management Association, CSIRO, DKCRC and the Cadzow family of Mt Riddock
Station.
Many individuals were involved with this project throughout its course. Andrea Tschirner, Jo
Rodney, Dionne Walsh, Chris Materne, Ben Norton, Leigh Hunt and Neil MacDonald were
involved in the initial setting up of the project. Mark Stafford Smith from the DKCRC was
instrumental in sourcing funding and getting the project off the ground. Staff from the Department
of Primary Industry, Fisheries and Mines, Alice Springs, including Ellena Hannah, Sally Leigo and
Chris Materne were involved with field work. Coral Allan provided assistance with processing
laboratory samples and data entry. Special thanks to Mark Hearnden for his assistance in data
analysis and reporting.
Jillian Fisher, project manager based with the Centralian Land Management Association, provided
invaluable assistance throughout the entire project. Jillian managed the overall project, liaised
between partners, reported to the funding organisations and assisted with both cattle work and
pasture assessments.
The concept of the rotational grazing strategy was designed by the Cadzow family as owners and
managers of Mt Riddock Station. The Cadzows had complete responsibility for the ongoing
management and implementation of the grazing strategy. Their willingness and enthusiasm to
invest time and money into scientific analysis of their management is much appreciated. Their
hospitality is second to none!

3
Abstract
There has been widespread interest by the industry in spelling practices, which hold out the
potential for increased production without damage to natural resources or sustained production with
recovery of the natural resources. The benefits of rotational grazing in the semi arid rangelands
have been little documented and it is therefore difficult for managers to commit to these new
grazing strategies. The trial at Mt Riddock Station, 200km north-east of Alice Springs, compares an
eight paddock rotation, used primarily by steers, with a continuously grazed paddock. Both the
treatment and control paddocks are dominated by the introduced perennial buffel grass (Cenchrus
ciliaris). The study aimed to test the hypotheses that rotational grazing will; increase carrying
capacity, result in more even utilisation of pasture, improve or maintain land condition, increase
species diversity, reduce fire risk and frequency and increase average daily weight gain in steers.
Given that the trial had only been operating for two years at the time of reporting there is little
conclusive evidence to support these hypotheses. Early results suggest that rotational grazing has
the potential to improve evenness of use across a pasture. Land condition did not improve under
either treatment. Species diversity declined under rotational grazing whilst remaining stable under
continuous grazing. Fire risk and steer performance were difficult to assess due to methodology
used and the relatively short time period assessed. It is also difficult to draw sound conclusions
within this trial as the paddocks differed by far more than just grazing duration and rest. Factors
such as stocking rate and distance to water are likely to be large contributors to the results to date.
It is worth noting that the managers felt that the rotational grazing strategy was producing good
results with regard to steer performance although they feel that it will take some years before the
true impact on the pastures is understood. This is typically the case in central Australia where
seasonal conditions can significantly influence the length of time before impacts on natural
resources are understood. They find the rotational grazing strategy easy to implement and are very
keen to continue with the existing strategy and to also extend it into further parts of the property.

4
1. Background Over the past decade the ongoing cost-price squeeze has forced pastoralists to look at using their
land more efficiently. There has been widespread interest by the industry in spelling practices,
which hold out the potential for increased production without damage to natural resources or
sustained production with recovery of the natural resources. A regional survey of central Australian
pastoralists conducted in 2004 found that 65% already used management strategies that
incorporated some rest from grazing. However, for most enterprises these strategies are
opportunistic and constrained by a lack of infrastructure. Because the potential benefits of
rotational grazing strategies have been little documented, particularly at a practical business scale,
in the climatically aseasonal and variable sector of the rangelands (Norton 2003), it has been
difficult for pastoralists to make informed decisions and commitments to develop strategies for their
own enterprises.
The theory for implementing rotational grazing is that pastures require a rest from defoliation in
order to regenerate. Removing grazing during the growing season allows perennial plants to
replenish energy stores in their roots, ensures plants have an opportunity to set seed and allows new
plants to become established. It follows that encouraging these processes will improve pasture
sustainability and yield, allowing for an increased carrying capacity in the longer term. The higher
stocking rates associated with rotational grazing strategies are also thought to increase production as
more even use of pasture can be achieved (Norton 2003). Conversely, cattle are selective grazers,
choosing their diet between species, within a species and for different plant parts. Selectivity
allows them to maximise the quality of their diet. Grazing strategies that use high stocking rates,
pasture monocultures and ‘force’ cattle to use all parts of the pasture, influence diet selection. In
these circumstances, cattle may not be able to select their optimum diet and therefore individual
performance may decline (McCollum 2004).
The rotational grazing strategy examined in this study was conducted on Mt Riddock Station, 200
km north-east of Alice Springs. During the summers of 2000/01 and 2001/02, Mt Riddock Station,
like most of the Alice Springs District, received very much above average summer rainfall. These
conditions were highly conducive to the spread of buffel grass (Cenchrus ciliaris) particularly under
relatively light grazing as was the case in the study area. Much of the eastern half of the station was
converted from grassland of native annual grasses with only scattered perennial grasses (including
buffel grass) to grassland dominated by buffel grass (S. Cadzow pers comm. 2006).
For pastoral managers, buffel grass provides a vigorous perennial pasture that is capable of
producing a high yield of palatable forage, is good for reclaiming degraded country and can provide
fuel for controlled fires. It also presents management challenges in that it can become rank and
unpalatable to stock subsequently reducing pasture availability and creating fuel for wildfires. A
characteristic of buffel grass is it’s capability to dominate a pasture. Thick buffel stands compete
well with native species reducing plant diversity and the ability for grazing animals to select a
varied and nutritious diet (Cavaye 1991, Friedel et al. 2006).
The principles of rotational grazing were originally devised in mesic pastures with high and
consistent plant production and there is little evidence to suggest that rotational grazing is of greater
benefit than continuous grazing in the rangelands (Briske et al. 2008). Whilst Mt Riddock is well
and truly located in a semi arid climatic zone, the introduction and dominance of buffel grass in the
study area significantly increased available palatable yield, providing the managers with an
opportunity to intensify infrastructure and management in order to graze steers immediately prior to
sale. To do this they introduced a rotational grazing system, with smaller paddocks. Their aims
were to maximize feed available by increasing yield, pasture quality and evenness of grazing;
reduce fire risk by utilising feed before it became dry and rank; gain a better understanding of the

5
advantages and disadvantages of buffel grass; achieve a balance between buffel and native grasses;
and increase marketability of steers.
Study Site
Mt Riddock Station lies approximately 200km north east of Alice
Springs (Figure 1). Average temperatures for the region range from a
low of 22.5°C to a high of 38.5°C in January and a low of 5.1°C to a
high of 22°C in July. The median October to September rainfall at the
homestead is 293mm and the median summer rainfall is 216mm.
The area of land under rotation was on the eastern boundary of Mt
Riddock Station flanking Entire Creek. The land systems are described
by Shaw and Roeger (1988) as Sandover, along the creek, (20%) and
Kanandra (80%) (see Table 1). Whilst there is some variation, the
dominant vegetation community is ironwood (Acacia estrophiolata) and
whitewood (Atalaya hemiglauca) over buffel grass.
Table 1: Land systems occurring within the trial area.
Sandover Sandy river plains and broad channels with sandy
clay loams. Open woodland of ironwood with
gidyea, mulga, whitewood, beefwood and prickly
wattle over a grassland of buffel grass with annual
grasses and forbs. There are small areas of clayey
sands which often grow less buffel grass and have
woollybutt, kerosene grass and minor spinifex.
Kanandra Broad sandy plains with scattered ironwood
dominated by buffel grass with woollyoat grass,
mulga grass, kerosene grass and forbs. Sandier
areas have corkwood, ironwood and whitewood
over woollybutt, kerosene grass, woollyoat grass
and buffel grass.
The control paddock was very large (196km2) and almost entirely made up of Kanandra land
system with some low, hilly country along the southern edge.
Hypotheses
1. Intensive rotational grazing will increase carrying capacity.
2. Rotational grazing will result in more even utilisation of pasture.
3. Land condition will be maintained or improved under rotational grazing.
4. Under intensive rotational grazing, there will be an increase in species diversity.
5. With better use of the pastures, there will be a reduction in fire risk and frequency.
6. Average daily weight gain of steers will be higher under rotational grazing.
Figure 1: Location of Mt
Riddock Station within the
Northern Territory.

6
2. Methodology
A continuously grazed control paddock was compared with an eight paddock rotation (Figure 2).
Figure 2: Layout of rotationally grazed paddocks and adjacent continuously grazed control paddock, Mt Riddock
Station.
Grazing Strategies
Rotationally grazed treatment
For the five years prior to the trial the rotationally grazed paddocks were only very lightly and
intermittently grazed. The rotationally grazed treatment consisted of eight paddocks that are
considerably smaller than the district average of 335km2 (Leigo 2006). The four northern paddocks
range from 10.2km2 to 13.5km
2 and cover a total of 46.6km
2. The four southern paddocks range
from 3.1km2 to 6.4km
2 and cover a total of 20.5km
2. To date, a rotation of steers from weaning to
sale has typically used either the northern or southern paddocks. When cattle are moved from one
paddock to another within the rotation they are simply trapped through the yard at the central
watering point. Trap gates are set by one person on a routine bore run. All areas of the paddocks
were within 5.5km from water.
Continuously grazed control
For the five years prior to the trial the control paddock was stocked with approximately 800 steers
(350kg steer = 0.8 Animal Equivalents1 (AE)) giving a stocking rate within 5km of water of
5.3AE/km2. Class of stock and numbers varied slightly over this time period due to seasonal
conditions and management goals. The control consisted of one continuously grazed paddock
(Eastern Chief paddock). Eastern Chief paddock is 196km2 of which approximately 120km
2 are
within 5km of water. Whilst cattle can travel large distances from water, it has been found that
grazing intensity declines with distance from water (Fisher 2001). To simplify our calculations, we
have assumed that most grazing occurs within 5km of water. The paddock was watered by four
separate watering points, Entire, Eastern Chief, Eldorado and Kanandra.
1 Animal equivalents (AE) based on the Grazing Land Management Workshop Notes (2005). 1AE = 450kg/dry cow.

7
Stocking rate
Rotationally grazed treatment
For each rotation, the stocking rate was determined by manager Steve Cadzow using a
predetermined graze time and a visual estimation of the forage available to determine how many
animal equivalents could be sustained in a given paddock. Carrying capacity varied slightly
between paddocks within a rotation. Steve set herd numbers and adjusted grazing time between
individual paddocks so that the paddock with the lowest carrying capacity would not be over
grazed. Steve planned for two rotations per paddock per year. Cattle spent approximately two
weeks per rotation in each of the southern paddocks and four weeks per rotation in each of the
northern paddocks. This comes to a total of 48 weeks of the year that cattle could be grazed in the
rotationally grazed paddocks. In reality, this was not always achieved due to other management
demands.
Continuously grazed control
Stocking rates were calculated in relation to a twelve month period defined as the summer rainfall
period (Oct-Mar) and the subsequent six months. Stocking rates within the control changed in
response to seasonal conditions.
Seasonal Conditions
Rainfall data from prior to the trial was from the homestead, 70 km west of the trial site. During the
trial rainfall records were collected via an accumulating rain gauge located at Eldorado and
automatic gauges at Entire and Entire 1 bores.
Pasture Assessment
Stratified site sampling was used to gauge pasture quality, quantity and cattle grazing distribution.
All of the pastures were assessed prior to commencement of the trial. The four southern paddocks
were all assessed immediately after grazing for both rotations. The only post grazing assessment in
the four northern paddocks occurred in May 2007, several months after grazing. The control
paddocks were only assessed at the beginning of the trial period and again in May 2007. Tables 2-3
show grazing and pasture assessment dates for all paddocks.

8
Table 2: Assessment record for rotationally grazed paddocks. ffff – Information collected.
ROTATIONALLY GRAZED PADDOCKS Assessments Completed
Graze TIme Paddock
Date In – Date Out Days
Assessment Date
Pasture Status
Defoln. & Cattle Activity
Pre Trial Sth T5 – T8 Jan 2006 f
Pre Trial Nth T1 – T4 July 2006
Rotation 1 South T7 9/3/06 – 16/4/06 39 May 06 f f
Rotation 1 South T5 17/4/06 – 8/5/06 22 May 06 f f
Rotation 1 South T8 9/5/06 – 28/5/06 20 July 06 f f
Rotation 1 South T6 29/5/06 – 23/6/06 25 July 06 f f
Rotation 1 South T5 25/6/06 – 3/7/06 9
Rotation 2 North T4 25/9/06 – 6/11/06 46 Nov 06 f f
Rotation 2 North T2 7/11/06 – 11/1/07 64 May 07 f
Rotation 2 North T1 12/1/07 – 7/2/07 39 May 07 f
Rotation 2 North T3 18/2/07 – 26/3/07 37 May 07 f
Rotation 3 North T3 28/3/07 – 24/4/07 28 May 07 f
Rotation 3 South T6 16/4/07 – 24/4/07 8 May 07 f f
Rotation 3 South T6 24/4/07 – 13/5/07 20 May 07 f f
Rotation 3 South T5 14/5/07 – 24/5/07 11 May 07 f f
Rotation 3 South T8 25/5/07 – 7/6/07 14 May 07 f f
Rotation 3 South T7 8/6/07 – 29/6/07 22 Sept 07 f f
Rotation 4 North T4 3/9/07 – 21/9/07 18 Not assessed
Rotation 4 North T4 22/9/07 – 5/10/07 14 as of
Rotation 4 North T2 6/10/07 – 5/11/07 31 March 2008
Rotation 4 North T1 6/11/07–10/12/07 35
Rotation 4 North T3 11/12 –28/12/07 18
Rotation 4 North T1 29/12/07 – 6/1/08 8
Rotation 4 North T2 7/1/08 – 29/1/08 22
Table 3: Assessment record for continuously grazed paddock.
CONTINUOUSLY GRAZED PADDOCKS Assessments Completed
Graze TIme Paddock
Assessment Date
Pasture Status
Defoliation & Cattle Activity
Pre Trial Eastern Chief C1 Jan 2006 f f
Pre Trial Eastern Chief C2 July 2006 f f
Continuous Eastern Chief C1-C2 May 2007 f f
Two sites were sampled at 500m, 1km and 3km from water within each rotationally grazed paddock
and three sites at each distance within the control. Sites were selected to ensure that the vegetation
was representative of the dominant vegetation community within the trial. In the rotationally
paddocks it was not always possible to locate sites at 3km from water. Where this was the case,
sites were located at least 2km from water and generally as far as possible. At each site, two
parallel 150m transects were described with 1m2 quadrats assessed every 10m.
9
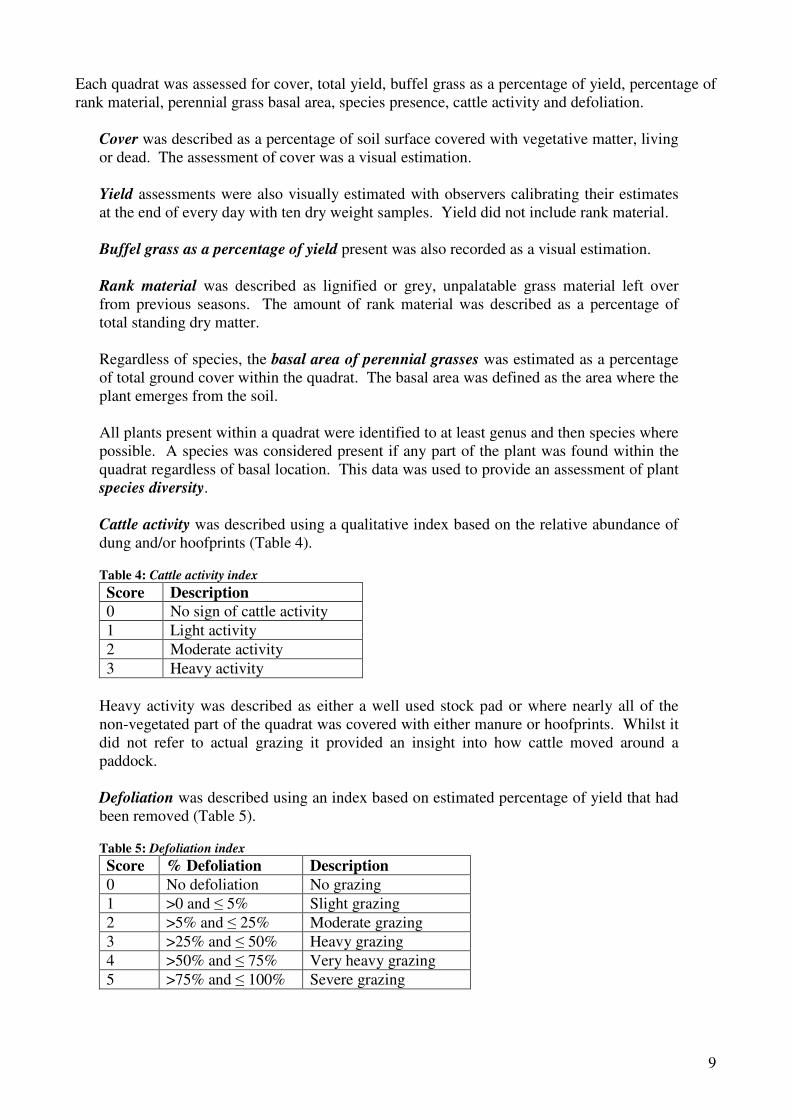
Each quadrat was assessed for cover, total yield, buffel grass as a percentage of yield, percentage of
rank material, perennial grass basal area, species presence, cattle activity and defoliation.
Cover was described as a percentage of soil surface covered with vegetative matter, living
or dead. The assessment of cover was a visual estimation.
Yield assessments were also visually estimated with observers calibrating their estimates
at the end of every day with ten dry weight samples. Yield did not include rank material.
Buffel grass as a percentage of yield present was also recorded as a visual estimation.
Rank material was described as lignified or grey, unpalatable grass material left over
from previous seasons. The amount of rank material was described as a percentage of
total standing dry matter.
Regardless of species, the basal area of perennial grasses was estimated as a percentage
of total ground cover within the quadrat. The basal area was defined as the area where the
plant emerges from the soil.
All plants present within a quadrat were identified to at least genus and then species where
possible. A species was considered present if any part of the plant was found within the
quadrat regardless of basal location. This data was used to provide an assessment of plant
species diversity.
Cattle activity was described using a qualitative index based on the relative abundance of
dung and/or hoofprints (Table 4).
Table 4: Cattle activity index
Score Description
0 No sign of cattle activity
1 Light activity
2 Moderate activity
3 Heavy activity
Heavy activity was described as either a well used stock pad or where nearly all of the
non-vegetated part of the quadrat was covered with either manure or hoofprints. Whilst it
did not refer to actual grazing it provided an insight into how cattle moved around a
paddock.
Defoliation was described using an index based on estimated percentage of yield that had
been removed (Table 5).
Table 5: Defoliation index
Score % Defoliation Description
0 No defoliation No grazing
1 >0 and ≤ 5% Slight grazing
2 >5% and ≤ 25% Moderate grazing
3 >25% and ≤ 50% Heavy grazing
4 >50% and ≤ 75% Very heavy grazing
5 >75% and ≤ 100% Severe grazing

10
Pretrial pasture sampling was undertaken in two stages. One of the continuously grazed watering
points and the southern rotationally grazed paddocks were assessed in January 2006. The second
continuously grazed watering point and the northern rotationally grazed paddocks were assessed
between June and July 2006. At both assessments the pasture was fairly dry however there may be
some differences in the data that relate to time since rain and season of rainfall. Because both the
control and treatment areas had data from each assessment period all the pretrial data was combined
for each treatment for the pretrial assessment.
With the exception of the first rotation, where pasture yields were assessed immediately prior to and
post grazing, yield was only assessed at the end of the summer growing period. This made it
impossible to use yield to determine utilisation. Attempts were made to determine utilisation using
calculated intake (Shrubb 2000). Calculated daily intake was described as a percentage of body
weight. This was determined using an equation of feed quality (dry matter digestibility, crude
protein, metabolisable energy (ME)) and average daily weight gain. Dividing the amount of ME
(MJ/day) required per day to achieve the given daily weight gain by the ME (MJ/kg) value of the
diet determines the amount of feed (kg/day) required to achieve this growth rate. However yield
assessment dates did not correlate well with rotations so this method was not successful. Given
these limitations, defoliation was used as a surrogate for utilisation.
Stock Performance
The initial induction of steers into the trial (March 2006) included both the treatment and control
animals. As the animals were processed, every fourth steer was designated for the control. As
other paddocks on the property were mustered, steers were weaned and placed into the trial until the
required stocking rates had been reached.
The control steers were placed in Eastern Chief Paddock. These steers were processed in May 2007
and then returned to the control paddock until their sale in February 2008.
Steers were individually identified, weighed and assigned a condition score at the commencement
of a rotation and then again at completion, immediately prior to sale. Whilst in the rotation, steers
were not handled unless they were being moved from the northern paddocks into the southern
paddocks in which case they were trapped then walked, using motorbikes and horses.
Supplementation was continuously provided in the form of both Boost block and LNT Uramol dry
season block. The control steers were subject to similar management practices. All trial animals
were vaccinated for botulism.
Statistical analysis
Each site was averaged for the thirty quadrats and Mann-Whitney U Tests were used to compare
treatment effects for each time period. ANCOVAs were used to examine distance from water trends
between treatments and times.

11
3. Results
Seasonal Conditions
In the five years prior to the trial, rainfall was greatly above average or average, except for the year
immediately prior when almost no rain fell at all (Table 6). Seasonal conditions for the duration of
the trial to date are described in Figure 3. Rainfall totals are provided for the period of October to
September 2005/06 and 2006/07. In the treatment and control areas, rainfall for the 12-month
period was generally below the median except for the control paddock in 06/07.
Table 6: Summer rainfall and percentiles leading up to the trial recorded at Mt Riddock homestead.
Rainfall period
Rainfall (mm)
percentile
2000/01 437 >90
2001/02 319 80
2002/03 245 60
2003/04 209 40
2004/05 48 <10
0
50
100
150
200
250
300
350
Oct 05 - Sept 06 Oct 06 - Sept 07
Ra
in (
mm
)
Eldorado (Control)
Entire 1 North
Entire Bore
35-year Median
Figure 3: Mt Riddock rainfall for the 12 month period October to September for 2005/06 and 2006/07. Median data
is from the homestead.
12 month rainfall totals do not necessarily reflect seasonal pasture growth. Figure 4 shows the
monthly totals which suggest that rain fell in most months throughout both summers. This is likely
to have allowed pasture to become robust and more resilient to grazing.
0
20
40
60
80
100
120
140
160
Oct-
05
No
v-0
5
De
c-0
5
Ja
n-0
6
Fe
b-0
6
Ma
r-0
6
Ap
r-0
6
Ma
y-0
6
Ju
n-0
6
Ju
l-0
6
Au
g-0
6
Se
p-0
6
Oct-
06
No
v-0
6
De
c-0
6
Ja
n-0
7
Fe
b-0
7
Ma
r-0
7
Ap
r-0
7
Ma
y-0
7
Ju
n-0
7
Ju
l-0
7
Au
g-0
7
Se
p-0
7
Oct-
07
No
v-0
7
De
c-0
7
Ra
in (
mm
)
Eldorado (Control)
Entire 1 North
Entire Bore
Figure 4: Mt Riddock monthly rainfall from October 2005 to December 2007.

12
Stocking Rates
Rotationally grazed treatment
Because paddock size and grazing time varied within the rotationally grazed treatments, a range of
stocking rates were used (Table 7).
Continuously grazed control
The stocking rate for the continuously grazed paddock varied only slightly throughout the project so
the average of 5.3 AE/km2 was used. The herd primarily consisted of steers and occasionally
heifers. When calculating stocking rates for the control paddock, the area described is only that
within 5km of water as it is unrealistic to expect that all the paddock is utilised evenly (Norton
2003, Quirk & McIvor 2006, Low 1972, Fisher 2001, Hunt et al. 2007).
Table 7: Stocking rate per rotationally grazed paddock
Year Rotation Paddock Area (km
2)
Days AE Days
AE/km2/year
2005-2006 One T7 5.9 39 11201 5.2
2005-2006 One T8 5.1 31 6299 3.4
2005-2006 One T6 3.1 20 8101 7.2
2005-2006 One T5 6.4 25 9727 4.2
2006-2007 Two T4 10.2 46 9881 2.7
2006-2007 Two T2 11.8 64 14666 3.4
2006-2007 Two T1 11.1 39 9716 2.4
2006-2007 Two T3 13.5 65 11603 2.4
2006-2007 Three T5 6.4 11 2437 1.0
2006-2007 Three T8 5.1 14 3153 1.7
2006-2007 Three T7 5.9 22 5058 2.3
2006-2007 Three T6 3.1 28 4629 4.1
2007-2008 Four T4 10.2 32 8672 2.3
2007-2008 Four T2 11.8 53 17891 4.2
2007-2008 Four T1 11.1 43 14557 3.6
2007-2008 Four T3 13.5 18 6261 1.3
With the exception of the first rotation, stocking rates in the rotationally grazed paddocks were
lower than in the continuously grazed paddocks (Figure 5).

13
0
1
2
3
4
5
6
Contr
ol 1
(9/3
/06-2
/10/0
6)
Rota
tion 1
(Mar0
6-J
un06)
Contr
ol 2
(Oct0
6-M
ay07)
Rota
tion 2
(Sep06-M
ar0
7)
Rota
tion 3
(Apr0
6-J
un07)
Rota
tion 4
(Sep07-J
an08)
Anim
al E
quiv
ale
nts
per
Km
2
Figure 5: Stocking rates within the rotationally grazed and continuously grazed paddocks.
The continuously grazed paddock had double the average (over time) stock days per water point
than the rotationally grazed paddocks (Table 8).
Table 8: Head per water for the different treatments over time.
Treatment average head/water total days stock days per water
Rotation 294 261 73089
Control 200 730 146000
Carrying Capacity
Yield can be an indicator of carrying capacity because it is an indication of the amount of feed
available. Yield was significantly higher in the rotationally grazed paddocks than in the
continuously grazed paddock at both assessment periods (Figure 6, Table 9).
Table 9: Yield - differences between treatments over time at Mt Riddock Station. Mann-Whitney U Test.
Treatment Continuous Grazing Rotational Grazing
Time of Assessment
Median
Yield
Median
Yield
p-level
Pretrial 2006 105 688 0.00003
Post Grazing 2007 339 550 0.03
Yie
ld (
Kg
/Ha
)
Continuous Grazing Rotational Grazing
Pretrial 2006 Post Grazing 2007100
200
300
400
500
600
700
800
900
Figure 6: Change in yield over time between treatments. Mean and 95% confidence intervals.

14
Yield varied significantly with distance from water (Figure 7, Table 10). In the continuously grazed
paddocks, yield was much lower within 1km of water than at 3km. There was no significant effect
of time or treatment on trend in yield with distance from water.
Yie
ld (
Kg
/Ha
)
Mean Mean±0.95 Conf. Interval
Pre
tria
l 2
00
6
0
200
400
600
800
1000
1200
Continuous Grazing
Po
st
Gra
zin
g 2
00
7
0.2 0.6 1.0 1.4 1.8 2.2 2.6 3.00
200
400
600
800
1000
1200
Rotational Grazing
0.2 0.6 1.0 1.4 1.8 2.2 2.6 3.0
Figure 7: Effect of time and treatment on trend in yield with distance to water at Mt Riddock Station.
Table 6: Effect of time and treatment on trend in square root yield with distance from water. ANCOVA.
Effect F value p value
Distance 6 0.01
Time 0 ns
Treatment 24 0.0000
Time by distance interaction 0 ns
Treatment by distance interaction 3 ns
Time by treatment interaction 2 ns
Distance by Season by Treatment interaction 0 ns
Utilisation of pasture
Defoliation
Differences between the control and treatment paddocks in the gradient of use out from waters were
statistically significant (Tables 11-12). Continuously grazed paddocks had higher defoliation closer
to water, which dropped off more steeply further from water (Figure 8). This compares with the
rotationally grazed paddocks, which were much more evenly grazed with distance from water.
There was no significant effect of season on the pattern of defoliation out from water (Tables 11-
12).
Table 117: Effect of time and treatment on trend in defoliation with distance from water. ANCOVA.
Effect F value p value
Intercept 172 0.0000
Distance 25 0.0000
Time 0 ns
Treatment 39 0.0000
Time by distance interaction 0 ns
Treatment by distance interaction 4 0.0000
Season by treatment interaction 33 0.0000
Distance by Season by Treatment interaction 1 ns

15
Table 8: Equations describing trend in defoliation with distance from water
Treatment Time Equation
Continuous Pretrial Defoliation = 4.455-0.8101* distance from water
Continuous Longterm Defoliation = 3.709-0.9063* distance from water
Rotation Pretrial Defoliation = 1.1257-0.3671* distance from water
Rotation Longterm Defoliation = 1.8326-0.4902* distance from water
De
folia
tio
n (
%)
Mean Mean±0.95 Conf. Interval
Po
st
Gra
zin
g 2
00
6
0
10
20
30
40
50
60
70
80
90
Continuous Grazing
Po
st
Gra
zin
g 2
00
7
0.2 0.6 1.0 1.4 1.8 2.2 2.6 3.00
10
20
30
40
50
60
70
80
90
Southern Rotational
0.2 0.6 1.0 1.4 1.8 2.2 2.6 3.0
Figure 8: Effect of time and treatment on trend in defoliation with distance to water at Mt Riddock Station.
Cattle Activity
Post grazing in 2006 and 2007, cattle activity in the rotationally grazed paddocks was significantly
different to that in the continuously grazed paddock (Table 13). There was some difference in cattle
activity with distance from water in both treatments (Figure 9). In 2006 the control paddock had
higher cattle activity at 500m from water. At 1km from water the activity was still relatively high
but by 3km cattle activity was very low. In comparison, cattle activity within the rotationally
grazed paddocks was moderate and consistent at all distances from water suggesting that cattle were
readily accessing all parts of the paddock. Cattle activity in the rotationally grazed paddocks post-
grazing in 2006 was higher and more uniform than the comparable assessment in 2007. However,
the apparent decline in activity at 2.85km is a little deceptive as it refers to only one site. The
remaining sites were all less than 2.3km from water and recorded similar cattle activity to sites
closer to water.
Table 9: Effect of time and treatment on trend in cattle activity with distance from water. ANCOVA.
Effect F value p value
Intercept 132 0.0000
Distance 13 0.0003
Time 1 ns
Treatment 24 0.0000
Time by distance interaction 2 ns
Treatment by distance interaction 0 ns
Season by treatment interaction 5 0.03
Distance by Season by Treatment interaction 1 ns

16
Table 14: Equations describing trend in cattle activity with distance from water
Treatment Time equation
Continuous Pretrial Cattle activity = 2.7975-0.4907*distance from water
Continuous Longterm Cattle activity = 1.8344-0.3634* distance from water
Rotation Pretrial Cattle activity = 0.7758-0.1812* distance from water
Rotation Longterm Cattle activity = 1.1092-0.2204* distance from water
Ca
ttle
Activity In
de
x
Mean Mean±0.95 Conf. Interval
Po
st
Gra
zin
g 2
00
6
0.0
0.5
1.0
1.5
2.0
2.5
3.0
Continuous Grazing
Po
st
Gra
zin
g 2
00
7
0.2 0.6 1.0 1.4 1.8 2.2 2.6 3.00.0
0.5
1.0
1.5
2.0
2.5
3.0
Southern Rotational
0.2 0.6 1.0 1.4 1.8 2.2 2.6 3.0
Figure 9: Effect of time and treatment on trend in cattle activity with distance to water at Mt Riddock Station.
Land Condition
Perennial grass basal area
Over time both the rotationally grazed and continuously grazed paddocks showed a decline in
perennial grass basal area (Figure 10). At both assessment times the PGBA was significantly lower
in the continuously grazed paddock than in the rotationally grazed paddocks (Table 15).
Pe
ren
nia
l G
rass B
asa
l A
rea
(%
)
Continuous Grazing Rotational Grazing
Pretrial 2006 Post Grazing 20072
3
4
5
6
7
8
9
Figure 10: Perennial grass basal – differences between treatments over time at Mt Riddock Station. Mean and 95%
confidence intervals.

17
Table 15: Perennial grass basal area - differences between treatments over time at Mt Riddock Station. Mann-
Whitney U Test.
Treatment Continuous Grazing Rotational Grazing
Time of Assessment
Median
perennial grass
basal area
Median
perennial grass
basal area
p-level
Pretrial 2006 4 6.4 0.004
Post Grazing 2007 2.8 4.7 0.01
PGBA did not show a clear trend with distance from water regardless of the grazing strategy
although overall PGBA was much lower in the continuously grazed paddocks than in the
rotationally grazed paddocks (Figure 11).
Pe
ren
nia
l G
rass B
asa
l A
rea
(%
)
Mean Mean±0.95 Conf. Interval
Pre
tria
l 2
00
6
0
2
4
6
8
10
12
Continuous Grazing
Po
st
Gra
zin
g 2
00
7
0.2 0.6 1.0 1.4 1.8 2.2 2.6 3.00
2
4
6
8
10
12
Rotational Grazing
0.2 0.6 1.0 1.4 1.8 2.2 2.6 3.0
Figure 11: Change in perennial grass basal area over time and with distance from water at Mt Riddock Station.
Total ground cover
The rotationally grazed paddocks had significantly higher cover than the continuously grazed
paddocks both pretrial and after grazing (Figure 12 & Table 16). There was little change in cover
between the pretrial and post grazing assessments in the rotationally grazed paddocks. The
continuously grazed paddock showed an increase in cover.

18
Co
ve
r (%
)
Continuous Grazing Rotational Grazing
Pretrial 2006 Post Grazing 200714
16
18
20
22
24
26
28
30
32
34
36
38
Figure 12: Cover – differences between treatments over time at Mt Riddock Station. Mean and 95% confidence
intervals.
Table 16: Cover - differences between treatments over time at Mt Riddock Station. Mann-Whitney U Test.
Time of Assessment Median Cover
Continuous Grazing
Median Cover
Rotational Grazing
p-level
Pretrial 2006 17 36 0.00002
Post Grazing 2007 15 34 0.02
It is also important to note that there was little difference in cover with distance from water within
the rotationally grazed paddocks whilst cover within the continuously grazed paddocks declined
closer to water (Figure 13, Table 17) post grazing 2007, although there was no significant effect of
treatment on trends in cover with distance to water.
Table 17: Effect of time and treatment on trend in cover with distance from water. ANCOVA.
Effect F value p value
Intercept 85 0.0000
Distance 13 0.0003
Time 0 ns
Treatment 18 0.0000
Time by distance interaction 1 ns
Treatment by distance interaction 3 ns
Season by treatment interaction 0 ns
Distance by Season by Treatment interaction 1 ns

19
Co
ver
(%)
Mean Mean±0.95 Conf. Interval
Pre
tria
l 2
00
6
0
10
20
30
40
50
60
70
Continuous Grazing
Po
st
Gra
zin
g 2
00
7
0.2 0.6 1.0 1.4 1.8 2.2 2.6 3.00
10
20
30
40
50
60
70
Rotational Grazing
0.2 0.6 1.0 1.4 1.8 2.2 2.6 3.0
Figure 13: Change in cover over time and with distance from water at Mt Riddock Station.
Species composition
The treatment and control paddocks had slightly different species composition as is evidenced
through the significant differences for some of the most frequent species between the treatments
(Table 18). The frequency of these species fluctuated through time, but seasonal changes were
similar for both treatments and there was no obvious time and treatment interaction, except for
buffel frequency which did not differ between treatments pretrial, but was significantly higher in
rotationally grazed paddocks at the end of the trial.
Table 1810: Effect of time and treatment on species frequency of abundant species at Mt Riddock Station. Mann-
Whitney U Test. * denotes significant difference between treatments for a time period, P<0.05.
Timing Pretrial 2006 Post Graze 2007
Treatment Continuous Rotational Continuous Rotational
Cenchrus ciliaris 87.4 91.5 *75.2 87.4
Aristida holathera *40.4 12.4 *45.6 18.8
Enneapogon polyphyllus *26.7 6.8 *42.2 8.2
Enneapogon avenaceus *17.8 3.9 *22.2 1.9
Tribulus terrestris 0.4 0.3 *25.6 10.9
Fimbristylis dichotoma *7.0 30.4 *3.0 22.7
Tripogon lolliformis 7.0 14.7 8.1 16.2
Indigofera colutea 0.4 0.1 16.7 25.8
With the exception of sedges in the rotationally grazed paddocks there was typically a rise in all
functional groups immediately after rain. The frequency of annual grasses was always higher in the
continuously grazed paddocks and the frequency of sedges was always higher in the rotationally
grazed paddocks (Figures 14 – 15, Tables 19-20).

20
An
nu
al G
rasse
s (
Fre
qu
en
cy I
nd
ex)
Continuous Grazing
Rotational GrazingPretrial 2006
Af ter Rain Feb 2007
Post Grazing 20070.2
0.4
0.6
0.8
1.0
1.2
1.4
1.6
1.8
2.0
2.2
2.4
2.6
2.8
Figure 14: Change in frequency of annual grasses over time between treatments. Mean and 95% confidence
intervals.
Table 11: Frequency of annual grasses - differences between treatments over time at Mt Riddock Station. Mann-
Whitney U Test.
Time of Assessment Median Frequency
Continuous Grazing
Median Frequency
Rotational Grazing
p-level
Pretrial 2006 1.0 0.4 0.003
After Rain Feb 2007 2.4 0.6 0.02
Post Grazing 2007 1.3 0.5 0.0005
Se
dg
es (
Fre
qu
en
cy I
nd
ex)
Continuous Grazing
Rotational GrazingPretrial 2006
Af ter Rain Feb 2007
Post Grazing 2007-0.1
0.0
0.1
0.2
0.3
0.4
0.5
Figure 15: Change in frequency of sedges over time between treatments. Mean and 95% confidence intervals.
Table 12: Frequency of sedges - differences between treatments over time at Mt Riddock Station. Mann-Whitney U
Test.
Time of Assessment Median Frequency
Continuous Grazing
Median Frequency
Rotational Grazing
p-level
Pretrial 2006 0 0.2 0.002
After Rain Feb 2007 0 0.3 0.01
Post Grazing 2007 0 0.1 0.02

21
In contrast forb frequency was significantly lower in the rotationally grazed paddocks only at the
end of the trial, perhaps suggesting a treatment related change through time (Figure 16, Table 21).
Fo
rbs (
Fre
qu
en
cy I
nd
ex)
Continuous Grazing
Rotational GrazingPretrial 2006
Af ter Rain Feb 2007
Post Grazing 20070.2
0.4
0.6
0.8
1.0
1.2
1.4
1.6
1.8
2.0
2.2
2.4
2.6
2.8
3.0
3.2
3.4
Figure 16: Change in frequency of forbs over time between treatments. Mean and 95% confidence intervals.
Table 13: Frequency of forbs - differences between treatments over time at Mt Riddock Station. Mann-Whitney U
Test.
Time of Assessment Median Frequency
Continuous Grazing
Median Frequency
Rotational Grazing
p-level
Pretrial 2006 0.7 0.8 ns
After Rain Feb 2007 2.9 1.9 ns
Post Grazing 2007 1.0 0.5 0.0006
There was no significant difference in frequency of perennial grasses between the rotation or the
continuous grazing (Figure 17, Table 22).
Pe
ren
nia
l G
rasse
s (
Fre
qu
en
cy I
nd
ex)
Continuous Grazing
Rotational GrazingPretrial 2006
Af ter Rain Feb 2007
Post Grazing 20070.4
0.5
0.6
0.7
0.8
0.9
1.0
1.1
Figure 17: Change in frequency of perennial grasses over time between treatments. Mean and 95% confidence
intervals.
Table 14: Frequency of perennial grasses - differences between treatments over time at Mt Riddock Station. Mann-
Whitney U Test.
Time of Assessment Median Frequency
Continuous Grazing
Median Frequency
Rotational Grazing
p-level
Pretrial 2006 1 1 ns
After Rain Feb 2007 0.6 1 ns
Post Grazing 2007 0.8 1 ns

22
Species Diversity
Total species recorded declined in both treatments over time (Table 23). In the following species
rank abundance graphs (Figures 18 – 21), species are only included when frequency is >1%.
Species composition was generally dominated by Cenchrus ciliaris and this was more extreme in
the rotationally grazed paddocks.
Table 15: Total number of species recorded.
Time of Assessment Rotational Grazing Continuous Grazing
Pretrial 2006 44 75
Post Grazing 2007 35 48
0
10
20
30
40
50
60
70
80
90
100
Cen
ch
rus c
ilia
ris
Fim
bri
sty
lis d
ich
oto
ma
Tri
pog
on
lo
llifo
rmis
Ari
stid
a h
ola
the
ra
Calo
tis h
isp
idu
la
Sa
lso
la k
ali
Ca
loce
ph
alu
s p
laty
ce
ph
alu
s
Ch
ryso
po
go
n fa
llax
En
ne
ap
og
on
poly
phyllu
s
Da
cty
locte
niu
m r
ad
ula
ns
Ch
ryso
ce
ph
alu
m a
pic
ula
tum
Wah
lenb
erg
ia s
p
Aristid
a c
on
tort
a
En
ne
ap
ogo
n a
ve
na
ce
us
Atr
iple
x e
lach
op
hylla
Ab
utilo
n s
p.
Le
pid
ium
sp
.
Go
od
en
ia s
p.
Gn
ep
ho
sis
skir
rop
ho
ra
Sw
ain
so
na
burk
ei
Bo
erh
avia
sp.
Scle
rola
en
a c
osta
ta
Ind
igo
fera
sp.
Abu
tilo
n o
tocarp
um
Scle
rola
en
a s
p.
Cu
llen
cin
ere
um
Evo
lovulu
s a
lsin
ioid
es
Scle
rola
en
a c
on
ve
xu
la
Era
gro
stis e
rio
po
da
Tri
rap
his
mo
llis
Sw
ain
so
na p
haco
ide
s
Fre
qu
en
cy (
%)
Figure 18: Rank abundance of species in rotationally grazed paddocks, pre grazing 2006.
0
10
20
30
40
50
60
70
80
90
100
Ce
nch
rus c
ilia
ris
Indig
ofe
ra c
olu
tea
Fim
bri
sty
lis d
ich
oto
ma
Ari
stid
a h
ola
thera
Tri
po
go
n lo
llifo
rmis
Tri
bu
lus te
rre
str
is
En
ne
ap
og
on p
oly
ph
yllus
Da
cty
locte
niu
m r
ad
ula
ns
Indig
ofe
ra s
p.
Ch
ryso
po
go
n fa
lla
x
Bo
erh
avia
sp
.
Ari
stida
co
nto
rta
Uro
ch
loa
En
nea
po
gon
aven
aceu
s
Scle
rola
en
a s
p.
Scle
rola
en
a c
osta
ta
Ipo
ma
ea
po
lym
orp
ha
Fre
qu
en
cy
(%
)
Figure 19: Rank abundance of species in rotationally grazed paddocks, post grazing May 2007.

23
0
10
20
30
40
50
60
70
80
90
100
Ce
nch
rus c
ilia
ris
Ari
stid
a h
ola
the
ra
En
ne
ap
og
on
po
lyp
hyllu
s
Scle
rola
en
a c
osta
ta
En
ne
ap
og
on
ave
na
ce
us
Ch
ryso
ce
ph
alu
m a
pic
ula
tum
Ab
utilo
n s
p.
Ca
loce
ph
alu
s p
laty
ce
ph
alu
s
Ca
lotis h
isp
idu
la
Ab
utilo
n o
toca
rpu
m
Fim
bri
sty
lis d
ich
oto
ma
Tri
po
go
n lo
llifo
rmis
Atr
iple
x e
lach
op
hylla
Ari
stid
a c
on
tort
a
Era
gro
stis e
rio
po
da
En
ne
ap
og
on
sp
.
Sid
a s
p.
Sa
lso
la k
ali
Bo
erh
avia
sp
.
Po
rtu
laca
ole
race
a
Evo
lovu
lus a
lsin
ioid
es
En
ch
yla
en
a to
me
nto
sa
Wa
hle
nb
erg
ia s
p
Da
cty
locte
niu
m r
ad
ula
ns
Gn
ep
ho
sis
skir
rop
ho
ra
Sw
ain
so
na
bu
rke
i
Sid
a c
un
nin
gh
am
ii
Fre
qu
en
cy
(%
)
Figure 20: Rank abundance of species in the continuously grazed paddock, pretrial 2006.
0
10
20
30
40
50
60
70
80
90
100
Ce
nch
rus c
ilia
ris
Ari
stid
a h
ola
the
ra
En
ne
ap
og
on
po
lyp
hyllu
s
Tri
bu
lus te
rre
str
is
Bo
erh
avia
sp
.
En
ne
ap
og
on
ave
na
ce
us
Ind
igo
fera
co
lute
a
Ind
igo
fera
sp
.
Ind
igo
fera
lin
na
ei
Tri
po
go
n lo
llifo
rmis
Scle
rola
en
a s
p.
Era
gro
stis e
rio
po
da
Ab
utilo
n o
toca
rpu
m
Da
cty
locte
niu
m r
ad
ula
ns
Sid
a s
p.
Fim
bri
sty
lis d
ich
oto
ma
Te
ph
rosia
sp
.
Po
rtu
laca
ole
race
a
Sid
a c
un
nin
gh
am
ii
Cle
om
e v
isco
sa
Ari
stid
a c
on
tort
a
Tra
gu
s a
ustr
iale
nsis
En
ch
yla
en
a to
me
nto
sa
So
lan
um
sp
.
Fre
qu
en
cy (
%)
Figure 21: Rank abundance of species in the continuously grazed paddock, May 2007.
At the start of the trial, there was no significant difference between species diversity or species
richness in the continuously grazed paddock and the rotationally grazed paddocks (Table 24).
Species richness describes the number of species found within a site. Simpson’s Index provides an
index of diversity. After rain and at the final assessment, species diversity and richness in the
rotationally grazed paddocks were significantly lower than in the continuously grazed paddock. At
the final assessment, species diversity and richness had declined below the pretrial level in the
rotationally grazed paddocks (Figures 22 - 23). Whilst species richness did not increase in the
continuously grazed paddock, the diversity across the pasture did, reflecting greater numbers of
individuals of species that had been less frequent in the first sampling period.

24
Table 16: Species richness and diversity- differences between treatments through time at Mt Riddock Station. ns –
not significant.
Time of
Assessment
Diversity Indicator Mean
Continuous
Grazing
Mean
Rotational
Grazing
p
Species Richness 18.3 17.9 ns Pretrial
2006 Simpson’s Index 6.6 5.7 ns
Species Richness 19.3 14.1 0.04 After Rain
Feb 2007 Simpson’s Index 11.8 7.7 0.006
Species Richness 18.6 12.2 0.002 Post Grazing
2007 Simpson’s Index 8.1 4.9 0.0005
Sim
pso
ns I
nd
ex
Continuous Grazing Rotational Grazing
Pretrial 2006 After Rain Feb07 May 20072
4
6
8
10
12
14
Figure 22: Simpsons Index of species diversity - differences between treatments through time at Mt Riddock Station.
Mean and 95% confidence intervals.
Sp
ecie
s R
ich
ne
ss
Continuous Grazing Rotational Grazing
Pretrial 2006 After Rain Feb07 May 20078
10
12
14
16
18
20
22
24
26
28
Figure 23: Species richness - differences between treatments and through time at Mt Riddock Station. Mean and
95% confidence intervals.

25
Pasture Quality (Rank Material)
Rank material was not recorded in the pretrial assessments for the southern rotationally grazed
paddocks or for one of the control areas so these areas could not be included in the analysis. Rank
material in the rotationally grazed paddocks increased over time whilst in the continuously grazed
paddock there was a decline in rank material (Table 25, Figure 24). Throughout the trial, rank
material in the continuously grazed paddock was much lower than in the rotationally grazed
paddocks. There was little change in rank material with distance from water in either treatment
(ANCOVA P>0.05) (Figure 25). There was a significant effect of treatment on change in % rank
through time (time by treatment interaction, ANCOVA F=4, P=0.02)
Table 17: Frequency of % rank - differences between treatments over time at Mt Riddock Station. Mann-Whitney U
Test.
Time of Assessment Median Frequency
Continuous Grazing
Median Frequency
Rotational Grazing
p-level
Pretrial 2006 6 10 ns
Post Grazing 2007 3 31 0.0000
Ra
nk P
lan
t M
ate
rial (%
TS
DM
)
Continuous Grazing Rotational Grazing
Pretrial 2006 Post Grazing 20070
2
4
6
8
10
12
14
16
18
20
22
24
26
28
Figure 24: Percent rank plant material – differences between treatments over time at Mt Riddock Station. Mean and
95% confidence intervals.
Ra
nk P
lant M
ate
ria
l (%
TS
DM
)
Mean Mean±0.95 Conf. Interval
TIM
ING
: P
retr
ial 2006
-5
0
5
10
15
20
25
30
35
TREATMENT: C
TIM
ING
: P
ost
Gra
zin
g 2
007
0.2 0.6 1.0 1.4 1.8 2.2 2.6 3.0-5
0
5
10
15
20
25
30
35
TREATMENT: T
0.2 0.6 1.0 1.4 1.8 2.2 2.6 3.0
Figure 25: Change in % rank material over time and with distance from water at Mt Riddock Station.

26
Stock Performance
The majority of the steers in the rotationally grazed paddocks were replaced with new steers at each
rotation. In comparison, the control steers remained the same throughout the life of the project.
Comparison of weight gains between the treatment and the control is compromised as the steers
were not truly comparable with regard to life stage or seasonal pasture quality. With the exception
of the second weigh period for the control steers, the rotationally grazed steers had a higher average
daily weight gain at all times (Figure 26).
0.0
0.1
0.2
0.3
0.4
0.5
0.6
0.7
Contr
ol 1
(9/3
/06-2
/10/0
6)
Rota
tion 1
(Mar0
6-J
un06)
Contr
ol 2
(Oct0
6-M
ay07)
Rota
tion 2
(Sep06-M
ar0
7)
Rota
tion 3
(Apr0
6-J
un07)
Rota
tion 4
(Sep07-J
an08)
Avera
ge D
aily
Weig
ht
Gain
(K
g)
Figure 26: Average daily weight gains for steers.

27
4. Discussion
When considering the results, it is important to consider all the differences between the rotational
and continuous grazing strategy treatments and how these might have affected the results, because
the paddocks differed in more ways than just grazing duration and rest. The two strategies present
differences in terms of grazing duration, stocking rate, paddock size, distance to water, head per
water and pasture yield, composition and cover at the start of the trial. Even within the rotationally
grazed paddocks, timing of rest periods in relation to rainfall varied, perhaps resulting in differences
in pasture growth.
Of particular importance is the issue of stocking rate. Whilst the stocking rate of the rotationally
grazed paddocks is much higher than the control during grazing periods it is only for a short period
of time. High stocking rates can encourage cattle to use parts of the pasture that they normally
would not in a continuously grazed system. Whilst this can lead to improved production for a given
area, it may be to the detriment of individual animal performance. Stocking rate has a big impact
on animal performance, perhaps more so than actual grazing system employed (Heitschmidt et al.
1990).
Seasonal conditions
The summer of 2005/06, immediately preceding the trial, and the subsequent summer of 2006/07
were both below the median for rainfall although they could still be described as within a ‘normal’
range of variation. In both years the continuously grazed paddock received more rainfall than the
treatment areas. This may have resulted in a higher potential for plant growth and/or a higher
quality pasture in the continuously grazed paddock compared to the rotationally grazed paddocks.
Seasonal effects are considered throughout the discussion.
Carrying Capacity and Profitability
Increased carrying capacity is often attributed to rotational grazing strategies for a number of
reasons. The first assumption is that rest from grazing helps to maximise forage available.
Secondly, high, short term stocking rates are thought to encourage stock to graze all parts of the
pasture thus making best use of the available feed (Humphries 1991).
The rotationally grazed paddocks had been only very lightly grazed, in the five years immediately
prior to trial commencement. Yield in all rotationally grazed paddocks declined very slightly after
the first graze period as would be expected following grazing with no further growth events prior to
assessment. The exception to this was the northern paddock T2 which experienced an exceptional
growth event immediately after grazing. The southern rotationally grazed paddocks experienced a
second grazing episode although at a lower stocking rate than the first graze. Subsequent yield
assessments remained similar to the previous assessment period. This suggests that stock in the
second graze period consumed all of the intervening growth. It is interesting to note the significant
decline in yield after the first grazing period in the southern paddock T7. This paddock had by far
the longest graze period (39 days c.f. average of 22 days) as it was not possible for management to
move stock. At the time, the manager felt that this paddock had been over grazed and no other
paddocks were utilised to that extent.
The most important observation is that yield in the continuously grazed paddock was always much
lower than the rotationally grazed paddocks. If stocking rates were to be determined based on
utilising 20% of the yield available within 5km from water as of May 2007, the rotationally grazed
paddocks would have allowed a carrying capacity of 3.2AE/km2/year (which is close to what they

28
did carry) whilst the continuously grazed paddocks would only carry 2AE/km2/year (compared with
the actual stocking rates of more than double this). Hence the continuously grazed paddock had
more than double the utilisation rates of the rotationally grazed paddocks – unless stock
significantly utilised areas further than 5km from water in the continuously grazed control. In May
2007, high yields at the continuously grazed sites (C2 only) are explained by the comparatively
higher rainfall received in this area, the flush of annual species following rain and a temporary
reduced stocking rate just prior to assessment. Once the annual species died, the carrying capacity
would have declined.
Stocking rate in the rotationally grazed paddocks was always lower than in the control. This is not
an indication of carrying capacity, rather a reflection on management decisions. A lower stocking
rate can allow steers to select a more nutritious diet, thus increasing their performance. Subsequent
profitability can increase as the return on individual animals’ increases.
In this instance, growing steers for sale is more profitable if beasts are of a premium weight. For
the first year of the trial, the average daily weight gain for the steers in the rotation exceeded that of
the control steers despite the rotation paddocks receiving slightly less rain than the continuously
grazed paddock. In the second year the control steers appear to have outperformed the rotation
steers. This may have been due to higher rainfall totals received in the control paddock however,
given that the control steers were more mature animals than those in the rotation it is not possible to
draw accurate conclusions.
Cattle behaviour
Maintaining or improving land condition also tends to raise long term profitability of a grazing
enterprise. How grazing animals use a paddock, both spatially and temporally, impacts on land
condition. In this instance, it is also important to note that the uniformity of buffel grass,
particularly in the rotationally grazed paddocks, may help to reduce the intensity of patch grazing
compared with a more heterogonous pasture (Teague & Dowhower 2003).
Cattle activity and defoliation in the southern rotationally grazed paddocks were relatively uniform
across the whole area in 2006. The pattern of defoliation suggests that the rotational grazing
strategy achieves more evenly distributed grazing across the paddock, minimising the effect of the
grazing gradient and subsequent pasture degradation close to water. In 2007, the pattern appears
similar with the exception of the site furthest from water. In fact there is a steeper slope in the data
suggesting that cattle activity is declining with distance from water. Herd size and average number
of days per paddock varied between the two grazing events and it is possible that these factors have
contributed to cattle behaviour within the paddocks. It is also possible that the results seen in 2006
are a product of grazing from a new watering point meaning that the pasture had a uniform grazing
history throughout the paddock.
The continuously grazed paddock is quite different and shows that there is heavy cattle activity and
defoliation close to water and much lighter impact at 3km from water. This type of activity can
lead to the formation of grazing gradients and overgrazing of pastures close to water.
More even activity across the paddock means that cattle are not camping in favoured areas. This is
desirable as areas where cattle camp are characterised by large amounts of manure and urine. This
means that nutrients obtained across the pasture are redistributed and become concentrated at the
camps, potentially leading to a decline in nutrients available to the broader pasture (Humphreys
1991, Pieper & Heitschmidt 1988).

29
Generally, both cattle activity and defoliation were higher at 3km from water in the rotationally
grazed paddocks than in the continuously grazed paddocks suggesting that cattle were moving and
grazing throughout this area.
In the northern rotationally grazed paddocks, manager Steve Cadzow observed that cattle were
rarely seen further than 2km from water. These observations, in conjunction with the lack of
grazing at the furthest distance from water in the southern paddocks, perhaps highlight the
relationship between grazing pressure and paddock utilisation. This suggests that as long as there is
sufficient bulk and quality of feed within 2km of water then cattle prefer not to walk further than
this unless required.
Achieving even use across a paddock requires a delicate balance in order to avoid overgrazing near
the watering point. Even though the 2006 results suggest that cattle are using the southern
rotationally grazed paddocks very evenly it is important to remember that the watering point was
new and had never been grazed before. This means that there were no areas of recent regrowth that
might be considered more favourable to a steer.
Defoliation in 2007 appears to decline slightly with distance from water. Herd size and length of
grazing time were both smaller in 2007 and this is likely to have influenced cattle activity. Whilst
yield had declined and percentage rank material had increased between the pretrial and post grazing
assessments, there had been some regrowth which would have been higher quality than relict plant
material from previous seasons. Steers are likely to be preferentially grazing the regrowth but
would also consume some older material at the same location. It is also possible that a flush of
palatable, ephemeral species had increased grazing pressure close to water. Thirdly, given that the
herd size was smaller (379 head cf. 307 head) in 2007, competition between animals may have
reduced. It is not possible to quantify these suspicions as pasture quality was not recorded. If cattle
are eating their fill closer to water they are perhaps less likely to venture further from water in
search of preferred forage. When cattle preferentially graze areas in relation to distance from water
then a grazing gradient will form within the rotationally grazed paddocks (Bastin et al. 1993,
Hodder & Low 1978, Lange 1969).
Land Condition
Land condition is difficult to quantify. The presence of palatable perennial grass such as buffel
grass is considered to be a sign of good pasture condition (Chilcott et al. 2005). Large perennial
grass basal areas and other forms of ground cover help achieve maximum pasture production,
protect soil from erosion, catch runoff and nutrients and maintain ecosystem processes (Teague &
Dowhower 2003).
On average, perennial grass basal area and cover was consistently lower in the continuously grazed
paddock compared to the rotationally grazed areas, particularly at areas close to water. This may be
due to historical grazing being lower in the rotationally grazed paddocks. This may mean that the
ability of the continuously grazed paddock to produce useful forage is lower than that of the
rotationally grazed areas. Whilst there is a significant increase in cover in the continuously grazed
paddock in May 2007, perennial grass basal area has not increased at the same time. This increase
in cover is due to short lived annual species that will not contribute greatly to long term land
condition improvement.
The data show that perennial grass basal area declined over time in both treatments. The reduction
in basal area may reflect the natural (season induced) decline following a run of very high rainfall
years which led to increases in buffel at the sites. Nevertheless the downward trend is potentially a
concern to land condition status. However long term monitoring would be needed in order to

30
separate land condition trends from seasonal response. Another possibility is that although
observers did undergo training to reduce observer variation, an observer’s estimates may still vary
through time and different observers for different sample periods may also cause variation through
time. For this reason trends in perennial grass basal area through time may be due to observer
variation rather than actual trend.
There was a change in species frequency over time in both the rotationally grazed and continuously
grazed paddocks. However this reflected seasonal conditions experienced within the trial and was
usually not an effect of treatment. Exceptions were lower forb frequency and higher buffel in the
rotational grazed paddocks only at the end of the trial, potentially suggesting a separating out of
species composition.
Species Diversity
When buffel grass becomes very dominant in a pasture it causes a decline in native ground cover
species (Friedel et al. 2006). One possible cause is the sheer physical size of the plant
outcompeting and shading other plants. The frequency of buffel grass didn’t vary between the
rotationally grazed paddocks and the continuously grazed paddock, but the degree to which it
dominated yield was quite different. The buffel plants in the continuously grazed paddock were
much smaller than in the rotation, as is evidenced by the smaller perennial grass basal area for a
similar frequency of buffel, perhaps allowing a greater response of ephemeral, annual species to
germinate. This may help to explain why the number of species remained consistent and higher in
the continuously grazed paddock compared to the rotationally grazed paddocks. This observation is
confounded by the fact that the continuously grazed paddock received slightly more rainfall in 2007
than the rotation. Given the decrease in perennial grass basal area in the rotationally grazed
paddocks the species diversity may increase through time in response to gaps opening up.
Pasture Quality
It is not surprising that the percentage of rank material was much higher in the rotationally grazed
paddocks as prior to the commencement of the trial, these paddocks had not been grazed for five
years. This coincided with very wet years that generated a lot of growth that had become rank and
unpalatable. In contrast, the adjacent control paddock had been continuously grazed resulting in
much less opportunity for pasture to become rank.
The managers had hoped that the high, short term stocking rates would result in a reduction of rank
material. The short duration of the trial and the lower stocking rates in the rotation may have
contributed to this not being achieved yet. This has not occurred and it is likely that fire, or some
other form of intervention, is required to remove this rank load. Best practice methodologies in the
subtropical pastoral regions tend to recommend fire as a tool for refreshing rank pasture (Materne
2005). The long term aim is that the rotation strategy will allow cattle to better utilise buffel growth
before it becomes rank. The trial had not been running long enough for this to be tested.
Fire Risk
The hypothesis to reduce fire risk using rotational grazing is based on the potential ability to reduce
the amount of rank material that is produced and also to break the load and continuity of fuel
through grazing. As discussed elsewhere, it is not yet possible to determine the impact of rotational
grazing on the formation of rank material.
Fuel loads of greater than 1,200kg/ha are considered to be a fire risk in perennial Astrebla
communities (Materne pers. comm. 2008) and this may be a comparable for buffel grass. In central

31
Australia, fuel in excess of >1,000 kg/ha is recommended for remedial burning (Chilcott et al.
2005). In comparison, fuel loads in the rotationally grazed paddocks had initial yields of
approximately 775kg/ha and post-grazing yields of 679kg/ha, and may not have caused a significant
fire hazard at either time. However, fire risk is a combination of fuel load and fuel continuity so
breaking up the continuity of fuel is also desirable in reducing fire risk. Cover was significantly
higher in the rotation than in the control and did not change through time perhaps suggesting that
continuity of fuel does not decline in a rotationally grazed system. Defoliation in the rotationally
grazed paddocks was also quite even across the landscape compared with the continuous grazing
perhaps also suggesting that the continuity of fuel does not vary much across the landscape with
rotation. Neither cover nor defoliation truly describes fuel continuity and it was not within the
scope of this project to undertake more detailed sampling.
Conversely, increasing or at least maintaining, yield and cover is desirable in terms of carrying
capacity and land condition status respectively.
Stock Performance
It is not possible to accurately compare average daily weight gain with the rotation steers and the
control steers due to the difference in their weigh dates. The managers have certainly been
impressed with the average daily weight gain in the rotationally grazed steers and have received
excellent prices on sale. Long term analysis of average daily weight gain and stocking rate need to
be considered in order to determine whether it is the rotation, or perhaps a lower stocking rate that
is delivering the best results.
5. Future Work/Conclusions Hypotheses
Few of the original hypotheses could be supported by the data collected to date.
Intensive rotational grazing will increase carrying capacity.
Although the managers wanted to increase the carrying capacity using rotational grazing, they have
actually run fewer animals per watered area in the rotation. Hence they didn’t really test this aspect,
although the added infrastructure will have increased CC due to an increase in watered area on the
property, but not due to the rotations per se.
Rotational grazing will result in more even utilisation of pasture.
It appears as though the rotational grazing strategy in the smaller southern paddocks may help to
achieve more even use of pastures. This may be a combination of the high stocking rate and short
grazing period, forcing cattle to spread out across the paddock. Conversely, the relatively low
stocking rate when compared to continuous grazing combined with small, better watered paddocks
means that cattle have the opportunity to always select only the most attractive parts of the pasture.
These confounding factors mean that evenness of use may or may not be due to the rotational nature
of grazing. Observations from the manager suggest that evenness of use is not as obvious in the
northern rotationally grazed paddocks and he intends to locate a second watering point so that cattle
do not have to travel more than 3km from water to access the whole paddock. Achieving more
even use requires a delicate balance so as not to create a grazing gradient. If, as discussed earlier, a
grazing gradient is being formed in the rotationally grazed paddocks then it is likely to become
more obvious in the future.
Land condition will be maintained or improved under rotational grazing.

32
There was little evidence that land condition improved for either treatment. Ground cover and
buffel frequency trends suggest that the rotational grazing strategy has some potential to at least
maintain land condition, although the decline in perennial grass basal area would suggest otherwise,
but this may be more seasonal.
Under intensive rotational grazing, there will be an increase in species diversity.
Contrary to the expectation that species diversity would increase under rotational grazing, diversity
declined in the rotation, while the continuous remained stable. It is important to remember that the
nature of central Australia’s extremely variable climatic conditions can have a big impact on plant
growth making it notoriously difficult to distinguish between management effects and seasonal
influence in a time period of only two years. Trends should become more obvious in future years.
With better use of the pastures, there will be a reduction in fire risk and frequency.
Fire risk was difficult to assess within this project. Whilst yield and cover did not decline in the
rotationally grazed paddocks, rankness of pasture increased rather than the anticipated decline. The
goal of reducing a fuel load is, in some ways, contradictory to the goals of increasing carrying
capacity and land condition.
Average daily weight gain of steers will be higher under rotational grazing
Cattle performance has largely been described using average daily weight gain. Due to a lack of
comparable control data it is difficult to draw any conclusions at this stage. Hopefully, as the trial
progresses in the coming years, more useful data will be forthcoming.
It is difficult to draw sound conclusions within this trial as the paddocks differed by far more than
just grazing duration and rest. Factors such as stocking rate and distance to water are likely to be
large contributors to the results to date.
It is worth noting that the managers felt that the rotational grazing strategy was producing good
results with regard to steer performance although they feel that it will take some years before the
true impact on the pastures is understood. This is typically the case in central Australia where
seasonal conditions can significantly influence the length of time before impacts on natural
resources are understood. They find the rotational grazing strategy easy to implement and are very
keen to continue with the existing strategy and to also extend it into further parts of the property.
Technical Implications
Grazing strategies must be implemented for many consecutive years before reliable conclusions can
be made. This is particularly the case in the aseasonal, variable climate of central Australia.
Further time is needed to assess long term impacts of this particular rotational grazing strategy.
Study designs must be carefully planned to ensure that factors such as stocking rate do not override
the effects of the grazing system in impact. The considerably higher stocking rate in the
continuously grazed paddock highlights the need for it to be stocked according to forage availability
in the watered area also, not just the rotational paddocks.
A more thorough understanding of the elements that affect fire risk would have ensured a more
comprehensive study design thus allowing the relevant hypothesis to be more thoroughly tested.

33
Industry Recommendations
More even utilisation of paddock area can be gained through smaller, better watered paddocks.
Ensuring that productive pastures are all within 3km of water would have similar benefits.
To date, this study provides little evidence that rotational grazing will improve species diversity,
land condition, rankness or fire frequency. Rather, species diversity and rankness of pasture
worsened under the rotational grazing system.
Ultimately, stocking rate is potentially the most important factor contributing to land condition and
productivity.
Rotational grazing strategies, through the characteristic of having very high stock densities for short
periods of time, encourage managers to assess forage availability and therefore carrying capacity
and hence adaptively match stock numbers to available forage. This factor alone may determine the
benefits from rotational systems rather than the usually attributed rotation and rest.
34
6. References
Bastin G. N., Pickup G., Chewings V. H. & Pearce, G (1993) Land Degradation Assessment in
Central Australia Using a Grazing Gradient Method Rangeland Jnl. V15 No.2.
Briske, D. D., Derner, J.D., Brown, J.R., Fuhlendorf, S.D., Teague, W.R., Havstad, K.M., Gillen,
R.L., Ash, A.J. and Willms, W.D. (2008) Rotational grazing on rangelands: Reconciliation of
perception and experimental evidence. Jnl. Rangeland Ecology & Management. V61. No1. January
2008.
Cavaye, J. (1991) The buffel book. Qld Department of Primary Industries. Brisbane.
Chilcott C.R., Rodney J.P., Kennedy A.J. and Bastin, G.N. (2005) Grazing Land Management –
Central Australia Version: Workshop notes, Meat & Livestock Australia Limited.
Davies, K.W. (2007) Influence of Plant Functional Group Removal on Inorganic Soil Nitrogen
Concentrations in Native Grasslands. Rangeland Ecol Management 60:304-310.
Fisher, A. (2001) Biogeography and conservation of Mitchell grasslands in northern Australia. PhD
Thesis, Northern Territory University. Darwin.
Friedel, M., Puckey, H., O’Malley, C., Waycott, M., Smyth, A. & Miller, G. (2006) Buffel grass:
both friend and foe. The evaluation of the advantages and disadvantages of buffel grass use and
recommendations for future research. Report 17. A report to the Desert Knowledge Cooperative
Research Centre on The dispersal, impact and management of buffel grass (Cenchrus ciliaris) in
desert Australia. DKCRC, Alice Springs.
Heitschmidt, R. K., Conner, J. R., Canon, S.K., Pinchak, W.E., Walker, J.W. and Dowhower, S.L.
(1990) Cow/calf production and economic returns from yearlong continuous, deferred rotation and
rotational grazing treatments. J. Prod. Agric., Vol.3 No.1.
Hodder R.M. & Low W.A. (1978) Grazing distribution of free-ranging cattle at three sites in the
Alice Springs district, Central Australia Aust. Rangel. J. V.1 No.2.
Humphreys, L.R. (1991) Tropical Pasture Utilisation. Cambridge University Press.
Hunt L.P., Petty S., Cowley R., Fisher A., Ash A. and MacDonald, N. (2007) Factors affecting the
management of cattle grazing distribution in northern Australia: preliminary observations on the
effect of paddock size and water points. The Rangeland Jnl. V29, 169-179.
Lange, R. T. (1969) The piosphere: sheep track and dung patterns Jnl. Range Management V22,
396-400.
Leigo, S. (2006) Pastoral Industry Survey 2004, Alice Springs. DPIFM, Alice Springs, NT.
Low, W.A. (1972) Community preference by free ranging shorthorns in the Alice Springs district.
Proc. Aust. Soc. Anim. Prod. 9:381.
Materne, C. (2005) Mitchell grasslands quality and quantity guide. Barkly Landcare and
Conservation Association.
35
McCollum, T. (2004) Managing nutrition of cattle grazing rangelands. Southwest Beef
Symposium, Texas A & M University, Odessa, Texas.
Norton, B.E. (2003) Spatial management of grazing to enhance both livestock production and
resource condition: a scientific argument. Proceedings of the VIIth International Rangelands
Congress, Durban, South Africa.
Pieper R.D. & Heitschmidt R.K. (1988) Is short duration grazing the answer? Jnl. Soil & Water
Cons. 43(2):133-137.
Quirk, M. & McIvor, J. (2006) Grazing Land Management Technical Manual Meat & Livestock
Australia.
Shaw, K. & Roeger, L. (1988) Rangeland monitoring and pasture management on Huckitta Station.
KS09/RM3. Dept. Industries and Development, Alice Springs, NT.
Shrubb, V. (2000) Explanatory notes for users of the Australian Feeds Information Centre (AFIC)
Database. Technote No.108, DPIF, Alice Springs.
Teague, W.R. & Dowhower, S.L. (2003) Patch dynamics under rotational and continuous grazing
management in large, heterogeneous paddocks. Jnl. Arid Environments 53: 211-229.