
Comparison of Pulsator and Conventional clariflocculator ...
72
Comparison of Pulsator and Conventional clariflocculator for turbidity removal 2016 A DISSERTATION REPORT on “Comparison of Pulsator vs Conventional Clariflocculator for turbidity removal” By Megha Gupta M.tech.(Environment) 2014PCE5140 Supervisor Dr. A.B. Gupta Professor Department of Civil Engineering Submitted for the partial fulfillment of degree of MASTER OF TECHNOLOGY In ENVIRONMENTAL ENGINEERING DEPARTMENT OF CIVIL ENGINEERING MALAVIYA NATIONAL INSTITUTE OF TECHNOLOGY, JAIPUR June 2016 DEPARTMENT OF CIVIL ENGINEERING MALAVIYA NATIONAL INSTITUTE OF TECHNOLOGY JAIPUR JAIPUR, RAJASTHAN-302017 DEPARTMENT OF CIVIL ENGINEERING
Transcript of Comparison of Pulsator and Conventional clariflocculator ...

Comparison of Pulsator and Conventional clariflocculator for turbidity removal 2016
A DISSERTATION REPORT
on
“Comparison of Pulsator vs Conventional Clariflocculator for turbidity removal”
By
Megha Gupta
M.tech.(Environment)
2014PCE5140
Supervisor
Dr. A.B. Gupta
Professor
Department of Civil Engineering
Submitted for the partial fulfillment of degree of
MASTER OF TECHNOLOGY
In
ENVIRONMENTAL ENGINEERING
DEPARTMENT OF CIVIL ENGINEERING
MALAVIYA NATIONAL INSTITUTE OF TECHNOLOGY, JAIPUR
June 2016
DEPARTMENT OF CIVIL ENGINEERING MALAVIYA NATIONAL INSTITUTE OF
TECHNOLOGY JAIPUR
JAIPUR, RAJASTHAN-302017
DEPARTMENT OF CIVIL ENGINEERING

Comparison of Pulsator and Conventional clariflocculator for turbidity removal 2016
CERTIFICATE
This is to certify that the dissertation report on “Comparison of Pulsator vs Conventional
clariflocculator for turbidity removal” which is submitted by Megha Gupta
(ID2014PCE5140), in partial fulfillment for the Master of Technology in Environmental
Engineering to the Malaviya National Institute of Technology, Jaipur. It is record of student‟s
own work carried out by her under my supervision and guidance during academic session (2015-
2016).This work is approved for submission.
Similarity Index = 22%
Checked by software TurnItIn on 20.06.2016.
Place: Jaipur Supervisor: Date:
Dr. A.B. Gupta
Professor,
Department of
Civil Engineering,
MNIT, Jaipur
MALAVIYA NATIONAL INSTITUTE OF TECHNOLOGY
JAIPUR RAJASTHAN-302017

Comparison of Pulsator and Conventional clariflocculator for turbidity removal 2016
ACKNOWLEDGEMENT
I would like to express deep regards and gratitude to my supervisor Dr. A.B. Gupta, Professor,
Department of Civil Engineering, MNIT Jaipur for his unwavering support for the completion of
this dissertation report successfully.
I also express my thanks to Dr. Urmila Brighu , Associate Professor, Department of Civil
Engineering, MNIT Jaipur for her guidance throughout the thesis work. I would like to thank
Prof. Gunwant Sharma, H.O.D., Civil Engineering Department, MNIT Jaipur, and Dr. Rohit
Goyal , Professor, Department of Civil Engineering, MNIT Jaipur for extending every possible
help and encouragement.
I want to take this opportunity to thank Mr. Rakesh Shukla (Degremont) for his time and support
in pilot scale model development. I also want to thank Mr. Ramesh C. Sharma (Sr. Technician,
Chemical Department) for his invaluable time and efforts in fabricating the model.
I also want to thank Mr. Sadique Ansari Yasin (Lab Technician, PHE Lab), Mr. Girdhari Lal
Murari (Technician, Hydraulics Lab) . I express sincere thanks to my M.Tech project members
Mr. Suparshve Kumar Jain, Ms. Neelam Kothari and Mr. Shashank Srivastava for their
cooperation and efforts in the project.
Megha Gupta
Environmental Engineering
2014PCE5140

Comparison of Pulsator and Conventional clariflocculator for turbidity removal 2016
1
CONTENTS
List of Tables 3
List of Graphs 4
List of Figures 5
Abstract 6
1. INTRODUCTION 7
1.1 Need of the Study 8
1.2 Objectives of Study 10
2. LITERATURE REVIEW 11
2.1 Coagulation- flocculation 13
2.1.1 Particle behavior 13
2.1.2 Coagulation and its mechanism 15
2.1.3 Flocculation 19
2.2 Coagulants 20
2.2.1 Aluminum and Iron based coagulants 20
2.2.2 Natural coagulants 21
2.3 Pulsator clarifier 22
3. MATERIALS AND METHODS 25
3.1 The Experimental Set Up 25
3.1.1 Location and Timing 25
3.1.2 Construction and Fabrication of Pulsator model 25
3.1.3 Construction and Fabrication of Conventional clariflocculator 29
3.2 Model Operation 30
3.2.1 Coagulant and Turbidity 30
3.2.2 Selection of inlet turbidity and coagulant dosage 31
3.2.3 Preparation of synthetic turbid water 32
3.2.4 Selection of operating flow 32
3.2.5 Dosing of chemicals 33

Comparison of Pulsator and Conventional clariflocculator for turbidity removal 2016
2
3.2.6 Sludge Blanket formation 33
3.2.7 Algae Growth in the Pulsator pilot plant 34
3.3 Data collection 35
3.3.1 Laboratory Analysis 35
3.3.1.1 pH 35
3.3.1.2 Alkalinity 36
3.3.1.3 Turbidity 37
3.3.1.4 Jar Test 39
3.3.2 Field Visits 41
3.3.3 Weekly reports from Surajpura water treatment plant 42
3.3.4 Data analysis 42
3.4 Instruments used 43
4. RESULTS AND DISCUSSION 44
4.1 Analysis of Surajpura water treatment plant in terms of turbidity removal 44
4.2 Results of Jar Test on Bisalpur raw water 46
4.3 Pulsator model Results 49
4.3.1 Turbidity Removal 49
4.3.2 Effect on Turbidity due to Algae growth in Pulsator Model 52
4.3.3 Model cleaning by Chlorine for algae removal 53
4.4 Comparison between Surajpura WTP and Pulsator Pilot Scale Model 54
4.4.1 Comparison at inlet turbidity = 2NTU and PAC Dosage = 25 ppm 54
4.4.2 Comparison at inlet turbidity = 3NTU and PAC DOSAGE = 25 ppm 55
4.5 Conventional clariflocculator model Results 57
4.6 Comparison between Pulsator Pilot Scale Model and conventional
Clariflocculator
60
5. CONCLUSIONS AND RECOMMENDATIONS 63
6. FUTURE RESEARCH 65
7. REFERENCES
Appendix –A
66

Comparison of Pulsator and Conventional clariflocculator for turbidity removal 2016
3
LIST OF TABLES
Table 3.1: Physical and chemical properties of Arya PAC 31
Table 3.2: Inlet Turbidity and coagulant dosage 32
Table 3.3: Turbidity: NTU and equivalent mg/l of Bentonite 32
Table 3.4: Operating flows of pulsator and clariflocculator 33
Table 3.5: Feed rates for bentonite and PAC under operating flow 33
Table 3.6: Coagulant dosages for Jar test 41
Table 3.7: Instrument Description 43
Table 4.1: Water quality parameters for treatment plant 44
Table 4.2: Jar test results 47
Table 4.3: Turbidity removal in Pulsator 49
Table 4.4: Comparison at a raw turbidity of 2 NTU and PAC dose of 25 ppm 54
Table 4.5: Comparison at a raw turbidity of 3 NTU and PAC dose of 25 ppm 56
Table 4.6: Turbidity removal in conventional clariflocculator 57

Comparison of Pulsator and Conventional clariflocculator for turbidity removal 2016
4
LIST OF GRAPHS
Graph 4.1: Turbidity variation for monsoon and post monsoon season 45
Graph 4.2: Turbidity variation for winter season 46
Graph 4.3: Residual turbidity with varying PAC dosage 47
Graph 4.4: Variation of pH with PAC dosage 48
Graph 4.5: Variation of alkalinity with PAC dosage 49
Graph 4.6: Turbidity removal in pulsator 50
Graph 4.7: Percentage removal efficiency of pulsator 51
Graph 4.8: Effect on turbidity due to algae growth 52
Graph 4.9: Model cleaning by chlorine - Day 1 53
Graph 4.10: Model cleaning by chlorine - Day 2 53
Graph 4.11: Comparison at a raw turbidity of 2 NTU and PAC dose of 25 ppm 54
Graph 4.12: Percentage removal at a raw turbidity of 2 NTU & PAC dose of 25 ppm 55
Graph 4.13: Comparison at a raw turbidity of 3 NTU and PAC dose of 25 ppm 56
Graph 4.14: Percentage removal at a raw turbidity of 3 NTU & PAC dose of 25 ppm 57
Graph 4.15: Turbidity removal by clariflocculator 58
Graph 4.16: Overall turbidity removal after filtration 59
Graph 4.17: Comparison between clariflocculator and pulsator for residual turbidity
post clarification
60
Graph 4.18: Comparison between clariflocculator and pulsator for residual turbidity
post filtration – 20 µm filter
61
Graph 4.19: Comparison between clariflocculator and pulsator for residual turbidity
post filtration – 11 µm filter
61
Comparison of Pulsator and Conventional clariflocculator for turbidity removal 2016
5
LIST OF FIGURES
Figure 2.1: A negative colloidal particle with its electrostatic field 14
Figure 2.2: Alum dose versus water turbidity for coagulation/flocculation 17
Figure 2.3: Schematic representation of bridging model for destabilization of
colloids by polymers
18
Figure 2.4: Cutview of pulsator clarifier 23
Figure 3.1: Schematic Diagram of pulsator model 26
Figure 3.2: Construction of pulsator column and stand at MNIT, Jaipur 27
Figure 3.3: Photograph of the pilot plant of pulsator at MNIT, Jaipur 28
Figure 3.4: Schematic Diagram of conventional clariflocculator 29
Figure 3.5: Photograph of conventional clariflocculator at MNIT, Jaipur 30
Figure 3.6: Photograph of blanket formation in Pulsator pilot plant 34
Figure 3.7: Algal growth in the pulsator pilot plant 35
Figure 3.8: A) Digital pH meter B) Weighing Balance 36
Figure 3.9: Digital Nephelometer at PHE Lab, MNIT, Jaipur and its principle 38
Figure 3.10: Jar Test apparatus at PHE lab, MNIT Jaipur 41
Figure 3.11: Sampling points at Surajpura water treatment plant 42

Comparison of Pulsator and Conventional clariflocculator for turbidity removal 2016
6
ABSTRACT
Safe and potable water is essential for the promotion of health and well-being of society.
Sustained supply of treated surface water which meets the drinking water standards is therefore
of paramount significance. Water treatment plants based on conventional technology have long
been found to be uneconomical concerning usage of power, the requirement for area and dosage
of chemicals, to mention a few important markers. Besides, technologies in water treatment
involving integral mechanical components rake up operational and maintenance issues.
Proprietary technologies for flocculation have had an impact since the advent of solids contact
units, among which Infilco Degrémont‟s Superpulsator® has had its share of success. However,
Superpulsators®, like most of the proprietary technologies, are designed and sized by
manufacturer‟s recommendations and rationales that explain their behavior are deficient.
Therefore, a pilot plant based on Superpulsator® technology was designed for a capacity of 8173
liters per day and fabricated at the Malviya National Institute of Technology Jaipur campus. For
this, the state-of-the-art water treatment plant of PHED at Surajpura of 1020 MLD capacity
constructed by Degrémont Limited (and currently operated by Larsen and Toubro Ltd.) was
surveyed and studied for sizing the pilot plant in order to depict the functioning as closely as
possible. The column is made of Perspex™ rings, and the pilot plant offers a host of other
features and flexibility to ensure unparalleled insight into the functioning of Superpulsator® and
support detailed research.
The raw water turbidity received at Surajpura WTP is reported to be consistently ranging
between 2.5-3.5 NTU which is very low, while pH ranges from 7 to 8.The analysis of 35 week
plant data along with the experimental data of the pulsator clarifier model resulted into the
recommendations that there exists a strong opportunity to reduce the chemical dosage, i.e. the
PAC dosage may be reduced to the range of 5 -10 ppm in steps from the presently administered
dosage of 25 – 40 ppm when the raw water turbidity levels are below 10 NTU. Also, the detailed
analysis indicated superior performance of pulsator clarifier over conventional clariflocculator
for turbidity removal when raw water turbidity varied from 2 to 30 NTU.

Comparison of Pulsator and Conventional clariflocculator for turbidity removal 2016
7
1. INTRODUCTION
All waters, especially surface waters, have both suspended and dissolved particles. These
impurities mostly arise from the dissolution of minerals, land erosion, decay of vegetation and
several domestic and industrial waste discharges. They may consist of organic or inorganic
matter as well as may include several biological organisms, like algae, bacteria and viruses.
These constituents deteriorate water quality and appearance as well as can carry pathogenic
organisms, causing diseases. Thus, they need to be removed by suitable methods to make the
water suitable for drinking and various domestic and industrial purposes.
The processes of coagulation and flocculation in water treatment are used to separate the
dissolved and suspended particles from the water.These processes constitute the backbone
processes in most water and advanced wastewater treatment plants. Their objective is to enhance
the separation of particulate species in downstream processes such as sedimentation and
filtration. Proper application of coagulation and flocculation depends upon several factors like
source of suspended particles, their charge, particle size, shape, and density. Suspended solids in
water possess a negative charge. Since these particles have the same type of surface charge, they
repel each other when they come close together. Hence, suspended solids will not clump together
to settle out of the water and will remain in suspension, unless proper coagulation and
flocculation is employed. (Prakash et.al, 2014)
Coagulation is the process of destabilization by charge neutralization. These neutralized particles
no longer repel each other and can be brought together. Coagulation is necessary for the removal
of the colloidal-sized suspended matter.A chemical coagulant, such as aluminum salts, iron salts
or polymers, is added to source water to facilitate bonding among particulates. Flocculation is the
process by which the destabilized, or "coagulated," particles are brought together to form a larger
agglomeration, or "floc. The agglomeration of particles is a function of their rate of collisions.
The function of flocculation is to optimize the rate of contact between the destabilized particles,
hence increasing their rate of collision and bringing about the attachment and aggregation of the
particles into larger and denser floc. Thus, the flocculation process allows the colloidal particles

Comparison of Pulsator and Conventional clariflocculator for turbidity removal 2016
8
to come together and build into larger flocs that are more amenable to separation by settling or
filtration. (Weber et al., 1970)
Conventionally, coagulation and flocculation have been carried out in two different tanks,viz. a
rapid mix tank and a flocculation basin in series, followed by settling under gravity in a clarifier.
Most water and wastewater treatment plants are based on these designs. The destabilization
process is achieved by the following four mechanisms of coagulation: double-layer compression;
adsorption and charge neutralization; entrapment of particles in precipitate; and adsorption and
bridging between particles. However, if the water is having low turbidity and low alkalinity
which is normally there when the intake is situated in a large impoundment/lake, the
conventional systems with their sweep floc mechanism are less effective. (Packham, R. F.,
1962). In such scenarios, the alternative is either to use the bridging mechanism by using Poly
aluminium chloride as the coagulant (Pernitsky, D. J. and Edzwald, J. K., 2000) or/and improved
clarification by employing a zone of high solids contact to achieve a better quality effluent. This
can be accomplished in an up-flow clarifier, which is so called because the flow of water occurs
in upward direction through the clarifier as the solids settle under gravity to the bottom.
Summarily solids contact clarifiers can remove materials by utilization of chemical reactions
because of ideal reacting environment, can enhance sedimentation by improving the physical
characteristics of the material to be removed and can maximize the use of chemicals and occupy
a smaller space.
1.1 Need of the study
Pulsed sludge blanket technology goes a step further over other solids contact clarifiers by
maintaining a contracting and expanding sludge blanket which acts as a filter, without
compromising flow distribution in order to gain efficient and high rate solids contact. The
pulsing sludge blanket combines flocculation, clarification and sludge collection into one
compact system. This design results in improved efficiency and superior effluent quality at much
lower operating costs. Despite the pulsator clarifier is the most widely used in the world in many
water treatment stations, no theoretical and experimental analysis have been reported yet in the
literature to describe the operation of pulsator clarifier. Few researches have been done and many
realms haven‟t even been touched upon for this promising technology, namely removal of
fluoride, residual aluminium, turbidity removal, etc.

Comparison of Pulsator and Conventional clariflocculator for turbidity removal 2016
9
The Bisalpur-Jaipur Water Supply Project (BWSP) is a state-of- the-art plant, only one in
Rajasthan, and among the select few in India, based on the Pulsed sludge blanket technology. It
has been designed to supply water from the existing Bisalpur Dam headworks up to Balawala on
the south edge of Jaipur City to reduce the city‟s reliance on its already scarce ground water
resources, and include complementary provisions for supplying water to other areas. With the
completion of the phase-II expansion, the project will achieve a total capacity of 1020 MLD
clear water production.
The water treatment plant at Surajpura receives low turbidity and low alkalinity water from the
Bisalpur Dam. The raw water turbidity is reported to be consistently ranging between 2.5-3.5
NTU, while pH ranges from 7 to 8 but at times the raw water quality at the dam varies and
problems like colour and odour are observed in treated water. This has led to the increased
dosage of chemicals in the treatment process. It is a well-known fact that the Chlorine and
Aluminium compounds are known to have adverse impacts on human health and the
environment and therefore, any increase in the dosage of these chemicals is undesirable besides
being expensive and adding to O&M cost. Currently, a 25-40 ppm dosage of 100% Poly
aluminium chloride is used as coagulant along with pulsator technology at Surajpura WTP. The
plant incurs a daily cost of INR 0.1 million on the coagulant and INR15, 000 on prechlorination.
Thus the daily cost of chemicals is significantly high vis-à- vis the raw water quality. and a scope
exists to reduce these chemical costs for the plant and work out an optimum coagulant dosage for
the plant at various turbidity levels. In this regard, a detailed experimental analysis of the
pulsator model can help in decoding pulsator operation as well as compare its performance with
conventional clariflocculator.
The present study is carried out by a group of four students of MNIT, Jaipur. The complete study
work consisting of design, fabrication and experimentation was done as a team and individual
studies are then taken up by each student for detailed investigation. The work was divided into
following four thesis titles:
1) Comparative analysis of turbidity removal in pulsator pilot scale model vs conventional
clariflocculator by Megha Gupta.

Comparison of Pulsator and Conventional clariflocculator for turbidity removal 2016
10
2) Comparative analysis of aluminium removal in pulsator pilot scale model vs conventional
clariflocculator by Neelam Kothari.
3) Comparative analysis of the effect on performance of the pulsator pilot plant and conventional
clariflocculator when polyaluminium chloride and alum are used as coagulants by Shashank
Srivastava.
4) Performance Analysis of Surajpura WTP of Bisalpur Jaipur Water Supply Project and Cost
Optimization Study using a Pulsator Clarifier Pilot Plant by Suparshve Kumar Jain.
1.2 Objectives of study
1) Design and fabrication of a pilot scale pulsator model and a lab scale model of conventional
clariflocculator.
2) To develop an understanding of model operation and assess the performance of pilot scale
pulsator model in terms of turbidity removal.
3) To compare the turbidity removal efficacy of the pilot scale model with that of Superpulsator
at Surajpura water treatment plant.
4) To compare the performance of pulsator model with lab scale model of conventional
clariflocculator for turbidity removal and thus analyzes the new technology.

Comparison of Pulsator and Conventional clariflocculator for turbidity removal 2016
11
CHAPTER-2
2. LITERATURE REVIEW
Turbidity measures the “cloudiness” of water or more precisely, it measures the extent to which
light is absorbed and scattered by suspended sediment, dissolved organic matter, and, to a lesser
extent, plankton and other microscopic organisms (APHA, 1999).
Natural and anthropogenic inputs of sediments and dissolved organic matter into the water
column can result in increased turbidity levels. Algae, whether natural or induced by
anthropogenic nutrient inputs, also can increase turbidity levels, but to a lesser extent than
suspended sediments. Major controlling factors of turbidity magnitude, duration, frequency and
composition include precipitation, stream gradient, geology, natural disturbance and land use, all
of which can be highly variable. Land use practices and wildfires, particularly preceding large
storms, can result in massive inputs of turbidity causing sediment to stream channels (May and
Lee, 2004). Larger, heavier particles tend to settle first, while smaller clay particles remain
suspended for a longer period of time, contributing to downstream turbidity levels.
The colloidal material, which exerts turbidity, provides adsorption sites for chemicals and for
biological organisms. They may cause undesirable tastes and odors and may also be harmful.
The major effect turbidity has on humans might be simply aesthetic - people don't like the look
of dirty water.Turbidity also increases real costs to the treatment of surface water supplies used
for drinking water since it must be virtually eliminated for effective disinfection to occur. The
disinfection effeciency with chlorine is reduced due to presence of suspended particles as they
act as shields for the bacteria and virus. Similarly, suspended solids can shield bacteria
from ultraviolet (UV) sterilization of water. In drinking water, the higher the turbidity level, the
higher the risk that people may develop gastrointestinal diseases. In natural water bodies,
turbidity may cause a slight brown or other color to water and thus, may reduce light penetration
and photosynthetic reaction in stream and lakes. It increases the load on filters and the filter may
go out of operation, if excess turbidity exists.

Comparison of Pulsator and Conventional clariflocculator for turbidity removal 2016
12
Turbidity measurements are used to determine the raw water quality, different chemicals and
their dosages needed as well as effectiveness of treatment produced. Turbidity is usually
measured in Jackson turbidity units (JTU) or nephelometric turbidity units (NTU) or, depending
on the method used for measurement. Nephelometric Turbidity Unit (NTU) signifies the
instrument is measuring scattered light from the sample at 90-degree angle from the incident
light. The Jackson Candle method (units: Jackson Turbidity Unit or JTU) is essentially the
inverse measure of the length of the water column needed to completely obscure a candle flame
viewed through it. The longer the water column required, the clearer the water. This unit is no
longer in standard use.
Turbidity can be measured using either a turbidity tube or an electronic turbidity meter . The
turbidity tube condenses water in a graded tube which allows determination of turbidity based on
a contrast disk in its bottom. A Secchi disk is used for turbidity measurement in reservoirs,lakes,
channels, and the ocean. This white and black disk is lowered into water until it can no longer be
seen; the recorded depth (Secchi depth) is a measure of the transparency of the water (inversely
related to turbidity). The Secchi disk has the advantages of being quick and easy to use,
integrating turbidity over depth (where variable turbidity layers are present), and lesser cost. The
3-fold division of the Secchi depth can provide a rough estimate of the depth of the euphotic
zone ; however this cannot be used in shallow waters where the disk can still be seen on the
bottom.
Pathogenic microorganisms are present in almost all surface waters and must be disinfected prior
to human consumption. Since the disinfection process does not work effectively in the presence
of turbidity, it becomes essential to remove the suspended solids causing turbidity in water . This
is achieved by a sequence of treatment processes that typically includes coagulation,
flocculation, sedimentation, and filtration.
Different countries have prescribed different limits for permissible values of turbidity in drinking
water. In U.S.A turbidity is regulated as a "treatment technique", and depends on water source,
like surface water, groundwater under the direct influence of surface water, or groundwater.
Additionally, the turbidity level is further regulated on the basis of treatment implemented within
each classification of water. EPA‟s surface water treatment rules require surface water systems
and ground water under direct influence of surface water systems that use conventional and

Comparison of Pulsator and Conventional clariflocculator for turbidity removal 2016
13
direct filtration, that at no time the turbidity be higher than 1.0 NTU (nephelometric turbidity
unit) and for atleast 95 percent of samples in any month it must be less than 0.3 NTU. Turbidity
should follow state limits and at no time must exceed 5 NTU for systems that use filtration other
than the direct or conventional filtration (USEPA,1996). The World Health Organization (WHO)
recommends that turbidity levels be less than 1.0 NTU prior to disinfection (WHO, 2008). The
Indian Standard for Drinking water prescribes an acceptable limit of 1 NTU and a permissible
limit (in the absence of an alternate water source) as 5 NTU (IS 10500, 2012)
2.1 Coagulation- flocculation
2.1.1 Particle behaviour
Finely dispersed colloidal and suspened particles producing turbidity and color of
the water cannot be removed sufficiently by the ordinary sedimentation process. The suspended
particles vary considerably in composition, source, charge,shape, particle size, and density. Most
suspended solids in water possess a negative charge and repel each other when they come close
together since they have the same type of surface charge,. Therefore, they will remain in
suspension rather than clump together and settle out of the water. Hence, the goal of the first
process in water treatment, i.e. coagulation, is to cause particle destabilisation and allow them to
come closer and stick together.
There are two types of colloids: hydrophobic colloids and hydrophilic colloids. Hydrophobic
colloids include clay and non-hydrated metal oxides and are unstableand thus can be easily
destabilized. Hydrophilic colloids like soap are stable. When mixed with water, hydrophobic
colloid form solutions that are not easily destabilized. The similar negative electrical charges
and electrical forces keep the individual particles separate and hence the colloids stay in
suspension as small particles (Binnie et al. 2002).
The magnitude of the zeta potential (Zp) is usually used to indicate colloidal particle stability.
The electric potential between the bulk solution and the shear plane is called the zeta potential.
Zp is described with the double-layer model shown in Figure 2.1 (Reynolds and Richards 1996).
A negative colloidal particle attracts to its surface ions of the opposite charge. A compact layer
on the colloid surface is called the fixed layer. The remaining counter ions extend into the bulk
of the solution, and constitute the diffused layer. The two layers represent the region surrounding

Comparison of Pulsator and Conventional clariflocculator for turbidity removal 2016
14
the particle where there is an electrostatic potential. The shear plane or shear surface surrounding
the particle contains the volume of water which moves together with the particle.
Figure 2.1: A negative colloidal particle with its electrostatic field (Reynolds and Richards,
1996)
The zeta potential is a measure of the repulsion forces between the colloidal particles and,
therefore, the stability of the colloidal suspension. A high Zp represents strong forces of
separation (via electrostatic repulsion) and a stable system, i.e. particles tend to suspend. Low Zp
is indicative of relatively unstable systems, i.e. particles tend to aggregate (Reynolds and
Richards 1996).
Coagulation-flocculation is a chemical water treatment process typically applied prior
to sedimentation and filtration (e.g. rapid sand filtration) to improve the ability of the subsequent
treatment process to remove particles. They occur in successive steps intended to overcome the
forces stabilizing the suspended particles, allowing particle collision and growth of floc.

Comparison of Pulsator and Conventional clariflocculator for turbidity removal 2016
15
2.1.2 Coagulation and its mechanism
Coagulation is a process which is used to neutralize the charge of the suspended particles and
thus bring them closer to form a gelatinous mass large enough to settle under gravity or be
trapped in the filter.
Chemical coagulation is achieved by the addition of inorganic coagulants, such as iron and
aluminium salts. When added to water, aqueous Fe(III) and Al(III) salts get dissociated to their
respective trivalent ions, Al3+
and Fe3+
. These ions get hydrolyzed and form numerous soluble
complexes with high positive charges, thus adsorbing on the surface of the negatively charged
colloids (Matilainen et al., 2010).
Coagulation can be accomplished through any of four different mechanisms:
1) Double-layer compression
The mechanism of double-layer compression relies on compressing the diffuse layer surrounding
a colloid. This is accomplished by increasing the ionic strength of the solution through the
addition of an indifferent electrolyte. The added electrolyte increases the charge density in the
diffuse layer. The diffuse layer is „compressed‟ toward the particle surface, reducing the
thickness of the layer. Therefore, the zeta potential, Zp, is significantly decreased (Reynolds and
Richards 1996).
2) Adsorption and charge neutralization
Some chemicals are capable of being adsorbed onto the surface of colloidal particles. If the
charge of the adsorbed species is opposite to that of the colloids, such adsorption results in a
reduction of surface potential and thereby, causing destabilization of colloidal
particle. Destabilization by adsorption is stoichiometric in nature. Thus, the required dosage of
coagulant increases with an increase in colloid concentration. Here, it is possible that the system
may get overdosed with the adsorbable species and restabilization may occur as a result of a
reversal of charge on the colloidal particle.

Comparison of Pulsator and Conventional clariflocculator for turbidity removal 2016
16
3) Enmeshment by a precipitate (Sweep-floc coagulation)
Chemical compounds such as aluminum sulfate (Al2(SO4)3), ferric chloride (FeCl3), and lime
(CaO or Ca(OH)2) are frequently used as coagulants to form the precipitates of Al(OH)3,
Fe(OH)3 and CaCO3. These precipitates physically entrap the suspended colloidal particles as
they settle, especially during subsequent flocculation. When the colloidal particles themselves
serve as nuclei for the formation of the precipitate, the flocs are formed around colloidal particles
and the sweep-floc coagulation process can be enhanced. Thus, the rate of precipitation increases
with increasing concentration of colloidal particles (turbidity) in the solution (Binnie et al.,
2002).
Sweep flocculation generally provides considerably improved particle removal than when
particles are destabilised just by charge neutralisation. A part of the reason is the greatly
improved rate of aggregation, because of the increased solids concentration. Hydroxide
precipitates tend to have a rather open structure, so that even a small mass can give a large
effective volume concentration and, hence, a high probability of capturing other particles. It is
also possible that binding („bridging‟) of particles by precipitated hydroxide may give stronger
aggregates. Increasing the coagulant dosage in the sweep region gives progressively larger
volumes of sludge but, beyond the operational optimum dosage, there is a little improvement in
particle removal (Duan and Gregory, 2003).
Figure 2.2 demonstrates how alum functions as a coagulant to treat high turbidity water (greater
than 100 NTU). There is no reduction in turbidity while alum doses are low, for there is
insufficient hydroaluminum (III) species to provide effective destabilization. With increasing
alum dose, turbidities decrease to a minimum value, as complete destabilization occurs. This
stage is dominated by adsorption and charge neutralization mechanism. The optimum dosage
often (but not always) corresponds to a Zp which is near zero. A further increase in alum dose
will cause restabilization of the particles due to charge reversal on the colloids occurring. The
further addition of alum to very high doses results in the formation of a precipitate of Al(OH)3(s)
because the amount of Al(III) added to the water exceeds the solubility limit of the hydroxide.
This bulky precipitate enmeshes particles and settles rapidly to form the „sweep-floc‟ region of
coagulation (Sanks 1979).

Comparison of Pulsator and Conventional clariflocculator for turbidity removal 2016
17
For a low turbidity water (less than 10 NTU), removal by adsorption and neutralization of alum
polymers is not possible for insufficient contact opportunities are available. Removal is
dominated by sweep-floc coagulation (Sanks, 1979).
Figure 2.2: Alum dose versus water turbidity for coagulation/flocculation (Snoeyink and
Jenkins 1980)
4) Interparticle bridging
Synthetic poylmeric compounds have been shown to be effective coagulants for the
destabilization of colloids in water. These coagulants can be characterized as having large
molecular sizes, and multiple electrical charges along a molecular chain of carbon atoms.
The interparticle bridging process was summarized by Bagwell et al. (2001) as follows:
Figure 2.3(a) shows the simplest form of bridging, a polymer molecule will attach to a colloidal
particle at single or more sites. Colloidal attachment is caused by coulombic attraction if the
charges are of opposite charge or from ion exchange, hydrogen bonding, or van der Waal‟s
forces.
Figure 2.3(b) shows the second reaction, in which the remaining length of the polymer molecule
from the colloidal particle in the first reaction extends out into the solution. Attachment can
occur to form a bridge if a second particle having some vacant adsorption sites contacts the
extended polymer molecule. Thus, the polymer serves as the bridge. However, if the extended

Comparison of Pulsator and Conventional clariflocculator for turbidity removal 2016
18
polymer molecule does not contact another particle, it can fold back on itself and adsorb on the
surface of itself as shown in Figure 2.3(c). The original particle is restabilized.
If the quantity of polymer is overdosed, polymer segment may saturate the colloidal surfaces,
thus no sites on the surfaces are available for interparticle bridging. This reaction (Figure 2.3(d))
causes restabilization of the particles. Intense agitation in solution can cause restabilization
because polymer-surface bonds or bridges formed are destroyed. These reactions are shown in
Figure 2.3(e) and 2.3(f).
Figure 2.3: Schematic representation of bridging model for destabilization of colloids by
polymers (Bagwell et al., 2001)

Comparison of Pulsator and Conventional clariflocculator for turbidity removal 2016
19
2.1.3 Flocculation
Flocculation is a gentle mixing stage during which the particle size increases from
submicroscopic microfloc to visible suspended particles. The process of slow mixing brings the
microflocs in contact with each other. Collisions of the microfloc particles bonds them together
to produce larger, visible flocs called pinflocs. The floc size keeps on increasing through
additional collisions and by interaction with the inorganic polymers formed by the coagulant or
with added organic polymers. High molecular weight polymers, called coagulant aids, may be
added during this step to add weight, help bridge, bind, and strengthen the floc, and increase the
settling rate. These led to the formation of macroflocs.Once the floc reaches its optimum size and
strength, the water is ready for the sedimentation process (MRWA, 2003).
There are three major mechanisms of flocculation transport as described below:
1) Perikinetic flocculation is the aggregation of particles caused by random thermal motion
(Brownian diffusion). The driving force for particle movement is the thermal energy of the
fluid. It most likely occurs when at least one of the particles is quite small, which is less than
approximately 1 µm in diameter (Han and Lawler 1992). This mechanism causes particles to
be continually moving in the water and can lead to collisions between two particles.
2) Orthokinetic flocculation is the aggregation of particles caused by induced energy in the fluid.
The destabilized particles follow the streamlines and eventually result in interparticle contacts
(Binnie et al. 2002). Han and Lawler (1992) indicated that orthokinetic flocculation most
likely occurs when both particles are greater than approximately 1 μm in diameter and fairly
similar in size (within a factor of 10 in size ratio).
3) Differential settling is caused by different settling velocities of particles. Because the settling
velocity of particles which have similar densities is proportional to the particle size, the
sedimentation of differential particles in heterogeneous suspension provides an additional
transport for promoting flocculation. It most likely occurs when at least one of the flocculated
particle diameter is larger than 10 µm and the other is significantly different in size (Han and
Lawler 1992, Thomas et al. 1999).

Comparison of Pulsator and Conventional clariflocculator for turbidity removal 2016
20
2.2 Coagulants
The choice of coagulant chemical depends upon several factors, like the raw water conditions,
the nature of the suspended particles to be removed, the treatment facility design, and the cost of
the chemicals necessary to produce the desired results. Final selection of the coagulant (or
coagulants) should be done after thorough jar testing and plant scale evaluation. Considerations
must be given to required quality of effluent, cost of treatment, effect upon downstream
treatment process performance, method and cost of sludge handling and disposal, and net overall
cost at the dose required for effective treatment.
2.2.1 Aluminium and Iron based coagulants
The aluminum and iron coagulants include aluminum sulfate, aluminum chloride, sodium
aluminate, ferric sulfate, ferrous sulfate, ferric chloride and ferric chloride sulfate. The addition
of metal coagulants to water causes the metal ions (Al and Fe) to hydrolyze rapidly but in an
uncontrolled manner, forming a series of metal hydrolysis species. The trivalent ions of Al(III)
and Fe(III) hydrate to form aquometal complexes Al(H2O)63+
and Fe(H2O)63+
. These complexes
then go through a series of hydrolytic reactions in which H2O molecules are replaced by
hydroxide ions to form several soluble products such as Al(OH)2+
and Fe(OH)2+
. These species
are quite effective as coagulants as they adsorb very strongly on the surface of most negative
colloids.
The charge on the dissolved coagulant species and the relative amount of floc formed are a
function of pH. The solubility of Al(OH)3(s) and Fe(OH)3(s) is minimum at a particular pH and
increases in either direction from that value. Hence, pH must be controlled to ensure optimum
coagulation conditions.
Ferric and Alum Chloride reacts with natural alkalinity in water as follows:
Al2(SO4)3.14H2O + 6 𝐇𝐂𝐎𝟑− 2 Al(OH)3(s) + 6CO2 +14 H2O + 3 SO4
2-
FeCl3 + 3 𝐇𝐂𝐎𝟑−
Fe(OH)3(s) +3 CO2 + 3 Cl
-
If the carbonates are not present in sufficient concentration, sodium carbonate Na2CO3 or
hydrated lime Ca (OH)2are needed to be added.

Comparison of Pulsator and Conventional clariflocculator for turbidity removal 2016
21
There has been considerable development in pre-hydrolyzed inorganic coagulants, based on
aluminum and iron to produce the desired hydrolysis species regardless of the process conditions
during treatment, for example, polyaluminium chloride (PACl), polyaluminium sulphate (PAS),
aluminum chlorohydrate, etc. Pre-polymerized inorganic coagulants are manufactured with
varying basicity ratios, base addition rates, base concentrations, initial metal concentrations,
ageing time, and ageing temperature. PACl has been made by partially neutralizing AlCl3 to
different basicity ratios, and its use has been continuously spreading. Prehydrolyzing the AlCl3
can enhance the amount of Al13 (AlO4Al12(OH)247+) in the coagulation process, which, in turn, has
been noted to be the most efficient Al-species for contaminant removal. These coagulant species
(Al13 or Alb) are considered to be the most efficient Al-species due to their larger size and higher
positive charges (Matilainen et al., 2012).
A comparison of the hydrolytic reaction of alum with laboratory prepared PACl showed that they
form different solid phases. Polyaluminium chloride tends to exist as a cluster of small spheres
(<25mm) and/or chain-like structures, whereas alum flocs are usually fluffy, porous structures
(ranging from 25 to 100mm). Due to their structure, polymeric species cause lesser turbidity in
suspension than alum. (Sinha et al., 2004)
2.2.2 Natural coagulants
Treatment using inorganic coagulants such as aluminum sulfate, ferric chloride, calcium
carbonate and synthetic organic polymer (polyaluminium chloride (PACl), polyethylene imine)
are common coagulant used in water treatment lead to disposal problems such as accumulation
of alumimum in the environment .Moreover, some studies have reported that residual aluminum
sulfate (alum) and polyaluminium chloride may induce Alzhemier‟s disease (Muthuraman and
Sasikala, 2014).Hence, natural coagulants which are derived from plant pose no health risk as
well as are cost effective and easily accessible especially for water treatment in rural areas. Some
of the natural coagulants are: Cactus latifera,Moringa oleifera , Nirmali, Okra, sugar, red bean,
red maize, etc. Naturally occurring coagulants are usually considere safe for human health. Some
studies on natural coagulants have been carried out and various naturalcoagulants have been
produced or extracted from microorganisms, animals, or plants (Muyibi et al., 2004).

Comparison of Pulsator and Conventional clariflocculator for turbidity removal 2016
22
2.3 Pulsator clarifier
Pulsator clarifier is a high rate clarifier which combines the advantages of both a highly
concentrated and homogeneous sludge blanket and internal sludge recirculation. The
homogeneity and recirculation of sludge blanket are affected by periodic pulsations in flow.
Suspended particles can be removed from water by agglomerating them into particles large
enough to settle by gravity. A combination of coagulating chemicals and inter particle collisions
provides the means by which small particles coalesce to form larger particles. Addition of
coagulating chemicals causes the formation of small settling flocs. If the liquid mass is gently
agitated, contact occurs between the particles, and they grow in size. This effect called
flocculation is greatly enhanced when it takes place in the presence of previously formed flocs.
The newly formed particles deposit by appending on surfaces of those already present, so that
they grow in size at much greater rates. Producing heavier, faster settling floc than would be
possible in the absence of previously formed particles.
In pulsator clarifier, the water flows upward through the sludge blanket in a cycling or pulsating
manner. During the surging flow, the bed expands uniformly and during subsiding flow, the bed
settles uniformly, as it would behave in a liquid at rest. As a result of cycling flow, the blanket
remains homogeneous throughout its depth with no stratification, facilitating continuous,
effective contact between water and sludge.
The pulsator differs from the normal sludge blanket tank in that water is admitted at varying rates
of inflow, a distinct surge being succeeded by a period of quiescence. The sludge blanket
expands during the period of maximum inflow and contracts as soon as inflow diminishes.
In the design of pulsator clarifier, the speed of inflow is not allowed to exceed limits that would
break up the blanket. The gentle up and down movement induced in the sludge blanket creates a
thicker and more uniform sludge zone which improves the clarifying action.
Flocculation rate is one of the most important characteristics in the operation of pulsator clarifier
.This rate is influenced by a number of physical parameters and operating conditions. Sludge
blanket height, upflow velocity of coagulated water, volume concentration of sludge blanket and
physical properties of flocs, all these factors are highly interactive and control the pulsator

Comparison of Pulsator and Conventional clariflocculator for turbidity removal 2016
23
clarifier performance.Numerous investigations show that, flocculation criteria GCt, which is the
product of shear rate, volume concentration of sludge blanket and residence time gives an
indication for the best flocculation conditions in sludge blanket. Also, Flocculation criteria is a
basic factor in the design of any sludge blanket clarifiers type.
Steady fluidization is one of the most important characteristics of Pulsator clarifier, which
represent the balance between the varying upward flow velocity of coagulated water and the
hindered settling velocity of the fluidized bed. In sludge blanket clarifier (e.g. pulsator clarifier),
flocculation occurs where the coagulated water pass through previously formed floc particles that
comprise the fluidized bed.For fluidized bed flocculator the hydraulic flow must be steady and
maintain a steady fluidization of the existing floc particles; the incoming flocculating particles
must aggregate to a size equal to the existing flocs or, more likely, be collected on them; and
there must be a balance between the incoming solid and withdrawal of excess floc to maintain a
steady state. The steady fluidization requires that the upward flow velocity be equal to the
hindered settling velocity of the fluidized bed
Despite the pulsator clarifier is the most widely used in the world in many water treatment
stations, no theoretical and experimental analysis have been reported yet in the literature to
describe the operation of pulsator clarifier. Most of the experimental and theoretical researches
that have been reported on flocculation process in upward flow clarifiers were for hopper-
bottomed sludge blanket clarifier and accelerator type solid contact clarifier.
Working principle:
Figure 2.4 Cutview of pulsator clarifier (Source:Degremont Superpulsator® Clarifier)

Comparison of Pulsator and Conventional clariflocculator for turbidity removal 2016
24
The pulsation system – the heart of pulsator – consists of a vacuum pump to elevate the water
level in the vacuum chamber and a vent valve is present to lower it. As the water level rises in
the vacuum chamber due to low pressure, the sludge blanket compresses like a spring. When the
water level reaches the set hydraulic head, the vent valve opens and the water column surges into
the distribution channel and laterals with a pulsing action that uniformly expands the sludge
blanket. Cut view of a pulsator clarifier is shown in Figure 2.4. The coagulated water, as it is
distributed across the bottom of the clarification/flocculation zone, creates the pulsing energy.
This pulsing energy gets converted into gently stirring turbulence. This turbulence helps to
flocculate the coagulated water into a settable floc. The newly flocculated floc is mixed with
previously flocculated sludge blanket within the flocculation/clarification zone,. The intimate
contacting of the newly formed floc with previously formed floc helps create larger, denser and
more settleable floc.
As the water level in the vacuum chamber reaches a low level (equal to vent time) and the entire
pulsing energy has been dissipated, the surge of flow slows down and the sludge blanket starts
settling. When the water reaches the lowest marked level, the vent valve closes and the vacuum
is applied again in the the vacuum chamber. The incoming raw water rises again and the cycle
is repeated as described above. A complete pulsation cycle is usually of 40 to 60 seconds and the
action helps creating a uniform sludge blanket.

Comparison of Pulsator and Conventional clariflocculator for turbidity removal 2016
25
CHAPTER-3
3. MATERIALS AND METHODS
This chapter presents the process for the development of laboratory scale models of a pulsator
and a conventional clariflocculator and describes the experimental procedures followed for the
assessment of their efficiencies.
3.1 The Experimental Set Up
A pilot plant was constructed as per design recommendations given by Infilco Degremont Ltd
mainly consisting of rise rate and the flow rate of continuous and the pulsed flow. Its fabrication
and operational procedures are described in the following sections.
3.1.1 Location and Timing
In order to analyze and compare the performance, a pilot plant of pulsator clarifier and a lab
scale model of conventional clariflocculator was designed and constructed. The two models were
installed at Hydraulics Lab, MNIT, Jaipur and experimental work was performed at PHE Lab,
MNIT, Jaipur. Experiments on the model were carried out for a period of three months from
February to April, 2016.
3.1.2 Construction and Fabrication of pulsator model
„Pulsator‟, a proprietary technology for flocculation, is generally designed and sized by
technologies like pulsator, with the exception of solids contact clarifier, are not available, albeit
in the terms of qualitative descriptions. The pilot plant of pulsator was designed in consultation
with Degrémont Limited. In the design of pulsator clarifier, the upflow velocity is not allowed to
exceed limits that would break up the blanket. Hence, rise rate was taken as the design parameter
for the pilot plant. A rise rate of 3m/hr was selected during normal flow and 12 m/hr was taken
for pulse flow. Also, the design flows were selected on the basis that the pulse flow should be

Comparison of Pulsator and Conventional clariflocculator for turbidity removal 2016
26
four times the regular flow. Moreover, the state-of-the-art water treatment plant of PHED at
Surajpura of 1020 MLD capacity constructed by Degrémont Limited (and currently operated by
Larsen and Toubro Ltd.) was surveyed and studied for sizing the pilot plant in order to depict the
functioning as closely as possible. Therefore, a pilot plant based on Superpulsator® technology
was designed for a capacity of 8000 liters per day.
Figure 3.1: Schematic Diagram of pulsator model
The fabrication of the model was done at MNIT, Jaipur campus. It consisted of the pulsator
column, actuator assembly, rotameters, peristaltic pumps and dosing tanks. The pulsator column
was made of Perspex sheet in order to provide a clear picture and understanding of the concept
of sludge blanket formation. Four commercially available 300 mm outer diameter Perspex
cylinders were rigidly joined to form a column of 8 feet height.These pipes were joined rigidly
and at other two places square Perspex flanges of 16 inch having 12 mm thickness with suitable
gaskets were used. Also, the bottom of this 8 feet high pipe was covered with a 16-inch flange
and placed on & joined with a table top thus a total of five Perspex flanges were used. An iron
frame was used to support the height of the pulsator column and the entire model is fitted on a
wooden stand to provide structural stability. Figure 3.2 shows the pulsator column during the
construction phase.

Comparison of Pulsator and Conventional clariflocculator for turbidity removal 2016
27
Figure 3.2: Construction of pulsator column and stand at MNIT, Jaipur
Sampling points at appropriate locations were provided to draw sludge samples from the blanket.
Overall, three sludge sampling points were identified to facilitate sludge testing and conduct
further experiments to give an insight of sludge blanket properties.
A sludge extraction unit at a height of 1.2 m above the bottom of the tank was provided to
remove the excess sludge. The excess sludge flow into the hopper provided in one section of the
clarifier and becomes concentrated there. Sludge is drawn off periodically through the sludge
removal pipes. The effluent or clarified water is collected through a hose pipe positioned at a
height of 2.2 m above the bottom of the tank. The location is so selected that enough detention
time is available for the flocs to settle.
To prevent the sludge blanket from collapsing, pulse is generated by the actuator assembly. The
pulse cycle, which consists of pulse duration and idle time, can be adjusted manually by the
operator. Here, the pulse cycle was set to 55 seconds where, the pulse duration was of 10 seconds

Comparison of Pulsator and Conventional clariflocculator for turbidity removal 2016
28
and the idle time was 45 seconds. The sludge blanket in the bottom part of the pulsator is
subjected to alternating vertical motions. It expands during the pulse when the water rushes in for
10 seconds and then shrinks (packs) during idle time which lasts for 45 seconds.
An inverted cone of Perspex sheet is placed at the bottom of the column, just after the inlet. The
purpose of the cone is to facilitate adequate mixing of the coagulant with the raw water by
reduction in cross section area of flow, thus providing increased velocity for mixing.
Additionally, the cone should be so designed that the particles do not settle on it, instead slide
from the annular space between the cone and the pulsator column back into the flocculation
zone. To meet this requirement, the cone angle was selected as 55 degrees. The model was
designed to run at a regular flow rate of 0.212 m3/hr and pulse flow rate of 0.848 m
3/hr. A
rotameter of 5 lpm was used for the regular flow and a second rotameter of 15 lpm was used for
the pulse flow.
Two dosing tanks, each of 100 liters capacity were provided to introduce turbidity and the
coagulant.A heavy duty stirrer arrangement using a 0.3 KW motor with a speed regulator was
made for the turbidity dosing tank in order to ensure that the turbidity introduction into the tap
water used for feeding the pilot plant is uniform and thus synthesizing the raw water with the
desired turbidity levels Two peristaltic pumps each with a maximum flow rate of 450 ml/minute
were installed to feed the turbidity and coagulant from the dosing tanks into the influent pipe
carrying the raw water. The influent pipe delivers the raw water at the geometric centre of the
pulsator column.The complete setup of the pulsator clarifier pilot plant is depicted in Figure 3.3.
Figure 3.3: Photograph of the pilot plant of pulsator at MNIT, Jaipur
Comparison of Pulsator and Conventional clariflocculator for turbidity removal 2016
29
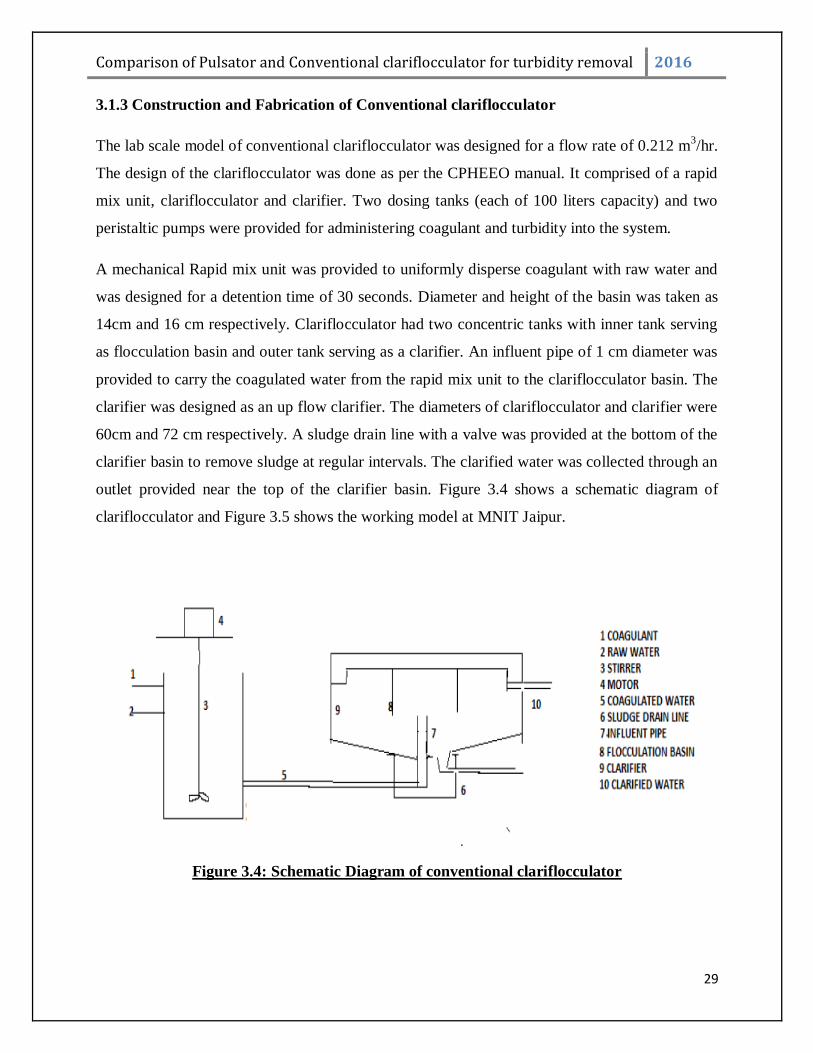
3.1.3 Construction and Fabrication of Conventional clariflocculator
The lab scale model of conventional clariflocculator was designed for a flow rate of 0.212 m3/hr.
The design of the clariflocculator was done as per the CPHEEO manual. It comprised of a rapid
mix unit, clariflocculator and clarifier. Two dosing tanks (each of 100 liters capacity) and two
peristaltic pumps were provided for administering coagulant and turbidity into the system.
A mechanical Rapid mix unit was provided to uniformly disperse coagulant with raw water and
was designed for a detention time of 30 seconds. Diameter and height of the basin was taken as
14cm and 16 cm respectively. Clariflocculator had two concentric tanks with inner tank serving
as flocculation basin and outer tank serving as a clarifier. An influent pipe of 1 cm diameter was
provided to carry the coagulated water from the rapid mix unit to the clariflocculator basin. The
clarifier was designed as an up flow clarifier. The diameters of clariflocculator and clarifier were
60cm and 72 cm respectively. A sludge drain line with a valve was provided at the bottom of the
clarifier basin to remove sludge at regular intervals. The clarified water was collected through an
outlet provided near the top of the clarifier basin. Figure 3.4 shows a schematic diagram of
clariflocculator and Figure 3.5 shows the working model at MNIT Jaipur.
Figure 3.4: Schematic Diagram of conventional clariflocculator
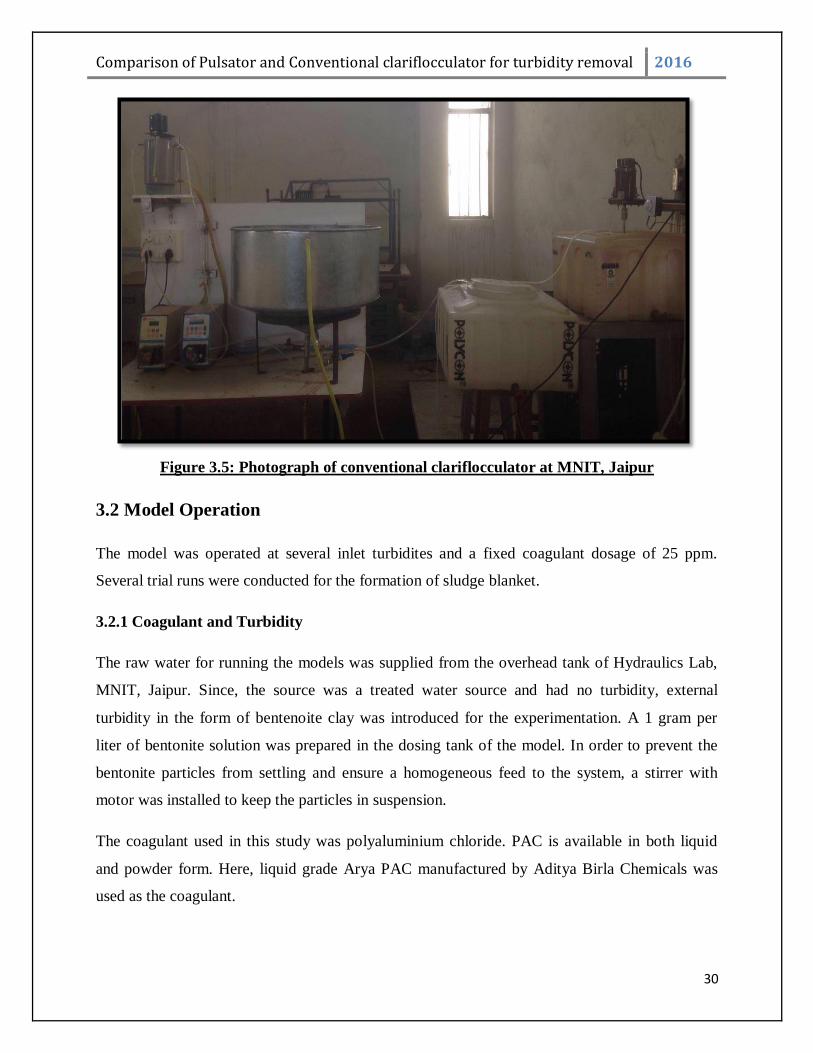
Comparison of Pulsator and Conventional clariflocculator for turbidity removal 2016
30
Figure 3.5: Photograph of conventional clariflocculator at MNIT, Jaipur
3.2 Model Operation
The model was operated at several inlet turbidites and a fixed coagulant dosage of 25 ppm.
Several trial runs were conducted for the formation of sludge blanket.
3.2.1 Coagulant and Turbidity
The raw water for running the models was supplied from the overhead tank of Hydraulics Lab,
MNIT, Jaipur. Since, the source was a treated water source and had no turbidity, external
turbidity in the form of bentenoite clay was introduced for the experimentation. A 1 gram per
liter of bentonite solution was prepared in the dosing tank of the model. In order to prevent the
bentonite particles from settling and ensure a homogeneous feed to the system, a stirrer with
motor was installed to keep the particles in suspension.
The coagulant used in this study was polyaluminium chloride. PAC is available in both liquid
and powder form. Here, liquid grade Arya PAC manufactured by Aditya Birla Chemicals was
used as the coagulant.

Comparison of Pulsator and Conventional clariflocculator for turbidity removal 2016
31
Following are the physical and chemical properties of Arya PAC (Table 3.1)
Table 3.1: Physical and chemical properties of Arya PAC (Source: Aditya Birla Chemicals)
Aluminium as Al2O3% by mass, min 10.2
Chloride as Cl, per cent by mass,
max.
10.5
Specific gravity at 25°C, min. 1.20
pH of 5% aqueous solution, w/v 2.5-4.5
Basicity, per cent by mass, min. 64.0
Sulphate, per cent mass, max 2.5
100% PAC was supplied by the Surajpura water treatment plant for the study. A 1% solution of
PAC was prepared in the dosing tanks to feed the model. 0.83 ml of 1% PAC is equivalent to a
PAC dosage of 10ppm.
3.2.2 Selection of inlet turbidity and coagulant dosage
The selection of inlet turbidity and coagulant dosage was done through the analysis of the
weekly reports of the Surajpura water treatment plant. 35 weeks data from June, 2015 to January,
2016 was analyzed. A total of seven turbidity values, i.e., 2,3,5,8,10,20,30 NTU were selected to
be run on the pilot plant and conventional clariflocculator. The inlet turbidity at the Surajpura
water treatment plant varied from 2- 14 NTU for the 35 week period and it was found that 99%
of inlet turbidities were less than 13.9 NTU. Hence, five out of seven turbidities were selected
below 13.9 NTU, viz, 2,3,5,8 and 10 NTU. Two turbidity values were selected above 13.9 NTU,
viz, 20 and 30 NTU for research purpose.
A coagulant dose of 25 ppm is been currently used at the plant under normal conditions. The
dose is increased to 30 or 35 ppm in case colour in raw water is reported. Weekly analysis of
coagulant dose show that 70% times a dose of 25 ppm was used at the plant. Hence, a dosage of
25 ppm was selected for the pulsator pilot plant and conventional clariflocculator. The raw water
turbidity values and coagulant dose used is summarized in Table 3.2.

Comparison of Pulsator and Conventional clariflocculator for turbidity removal 2016
32
Table 3.2: Inlet Turbidity and coagulant dosage
Inlet Turbidity runs (Total -7) 2,3,5,8,10,20,30 NTU
Coagulant Dosage 25 ppm
3.2.3 Preparation of synthetic turbid water
Commercially available bentonite clay was used in this study. Synthetic turbid water was
prepared by adding 1gram of bentonite to 1 liter of distilled water. The solution was then shaken
thoroughly achieve uniform and homogeneous sample. Resulting suspension was found to be
colloidal and used as stock solution for preparation of turbid water samples. Samples from 20
mg/l to 1000 mg/l were prepared using stock solution by dilution with distilled water. Turbidity
for each sample was measured and expressed in nephelometric turbidity unit (NTU).The
following table (Table 3.3) gives the equivalent mg/l of bentonite for each NTU of turbidity run
in the models:
Table 3.3: Turbidity: NTU and equivalent mg/l of Bentonite
Turbidity(NTU) 2 3 5 8 10 20 30
Bentonite in mg/l 5 10 20 30 45 75 100
3.2.4 Selection of operating flow
Numerous combinations of pulse and regular flow were run on the pulsator model so that the
sludge blanket remains stable in suspension and was of desired height, i.e 1.2 m above the
bottom. Based on this, a regular flow of 2.2 lpm and a pulse flow of 8.8 lpm was worked out
after several trials for conducting the further experimentation. Thus, the system was operated at
an overall flow of 3.745 liters/ minute and a capacity of 5393liters /day .The operating pulse flow
also worked out to be four times the regular flow as per the design criteria.
In order to establish a comparison between the two technologies, conventional clariflocculator
was operated at an equivalent flow of 3.745 liters/minute. Table 3.4 summarizes the operating
flows for the two models.

Comparison of Pulsator and Conventional clariflocculator for turbidity removal 2016
33
Table 3.4: Operating flows of pulsator and clariflocculator
Pulsator pilot plant Conventional clariflocculator
Regular flow (lpm) Pulse flow (lpm) Flow (lpm)
2.2 8.8 3.75
3.2.5 Dosing of chemicals
PAC and bentonite solutions prepared as described above, were fed into the system through
peristaltic pumps. An empirical relationship was established between the flow rate and rpm of
the pump. The pump was operated at different rpm and the corresponding flow rate was
measured. It was found that the pump flow rate in ml/minute is three times the pump rpm. This
relationship was used for the input of chemicals to both the systems. The following feed rates
(Table 3.5) calculated on the basis of operating flow and solution strength were used for the
turbidity and coagulant.
Table 3.5: Feed rates for bentonite and PAC under operating flow
PAC (ppm) Turbidity (NTU)
25 2 3 5 8 10 20 30
Feed rate
(ml/minute)
7.8 18.7 37.5 74.9 112.4 168.5 280.9 374.5
3.2.6 Sludge Blanket formation
In a pulsator clarifier, sludge blanket not only helps in agglomerating newly formed floc but also
helps the suspended and colloidal matter to adhere to the floc. Thus, blanket depth, homogeneity
and its physical properties play an important role in the flocculation process.
For the study, a sludge blanket of height 1.2 m was established. The blanket was developed by
feeding a very high dosage of turbidity in the form of Bentonite. A 500 ppm dose of bentonite
and a 100 ppm dose of PAC was fed into the system for 2 days. The sludge blanket gradually
increased in volume due to entrapping of the impurities contained in the feed water. The blanket
was kept in suspension by adjusting the regular and the pulse flow. An increase in pulse flow

Comparison of Pulsator and Conventional clariflocculator for turbidity removal 2016
34
pushes the particles upwards and keeps them in suspension. A decrease in pulse flow gives the
flocs time to settle under gravity. The pulse cycle was kept of 55 seconds. The height of the
blanket is maintained at desired level by continuously extracting the sludge through the hopper.
Figure 3.6: Photograph of blanket formation in Pulsator pilot plant
3.2.7 Algae Growth in the pulsator pilot plant
The pulsator pilot plant was under the direct exposure of sunlight. As a result, there was an algal
growth in the model. A green- brown algal growth got developed over the entire length of
pulsator column (Figure 3.7). Three pulsator runs at turbidity values of 3,5 and 8 NTU and a
PAC dosage of 25 ppm were also carried out in the presence of algae in the system. Thereafter,
in order to eliminate algae, a chlorine dose of 5ppm was run till all organics got consumed and a
free residual chlorine of 5 ppm was left in the effluent. The chlorine runs were conducted for two
consecutive days. This helped in establishing the chlorine demand of the algae growth in the
model. The final cleaning of the model was done by manually scrapping the algae off the wall

Comparison of Pulsator and Conventional clariflocculator for turbidity removal 2016
35
and bottom of the pulsator and backwashing the system. The sludge blanket was again developed
after the cleaning.
Figure 3.7: Algal growth in the pulsator pilot plant
3.3 Data collection
Primary data was collected through experimental analysis and the 35 week data from Surajpura
treatment plant was used as secondary data.
3.3.1 Laboratory Analysis
3.3.1.1 pH: pH of the collected samples was measured using pH meter available in the PHE
laboratory, MNIT, Jaipur (Figure 3.8).
Procedure
The pH meter was calibrated by immersing the electrode in the buffer solution of known
pH, normally 4.0 and 7.0.

Comparison of Pulsator and Conventional clariflocculator for turbidity removal 2016
36
Electrode was rinsed with distilled water and the electrode was put in the solution for
which pH is desired.
pH of the water sample was read.
Figure 3.8: A) Digital pH meter B) Weighing Balance
3.3.1.2 ALKALINITY
The titration method as per (APHA, 1999) was used for determination of alkalinity.
Procedure:
1) 25ml of water sample was taken in a conical flask.
2) 2- 3 drops of Phenolphthalein solution, alcoholic, pH 8.3 indicator was added. Pink color was
observed.
3) The sample was then titrated against 0.02 N H2SO4 till the color disappears. The reading was
noted and phenolphthalein alkalinity (P) was calculated as:
Where, A = ml of acid used
Alkalinity, mg l CaCO3 = A X N X 50,000
ml of sample

Comparison of Pulsator and Conventional clariflocculator for turbidity removal 2016
37
N= Normality of the acid
4) Then, 2-3 drops of methyl orange solution, pH 4.5 indicator as added. Pale yellow color was
observed.
5) Again the sample was titrated with 0.02 N H2SO4 till bright yellow color appears. The
reading was noted and total alkalinity (T) was calculated as:
Where, B = ml of acid used
N= Normality of the acid
Calculation of alkalinity relationships: The determination of the phenolphthalein and total
alkalinity offer a means for classification of the three principal forms of alkalinity present in
water on a stoichiometric basis. The classification ascribes the entire alkalinity to carbonate,
bicarbonate and hydroxide. According to this scheme:
1. Carbonate (𝐂𝐎𝟑𝟐−) alkalinity is present when phenolphthalein alkalinity is not zero but is less
than total alkalinity (P<T).
2. Hydroxide (𝐎𝐇−) alkalinity is present if phenolphthalein alkalinity is more than half the total
alkalinity (P>=1/2 T).
3. Bicarbonate (𝐇𝐂𝐎𝟑−) alkalinity is present if phenolphthalein alkalinity is less than half the
total alkalinity (P < =1/2).
3.3.1.3 TURBIDITY
Principle: This method is based on a comparison of the intensity of light scattered by the sample
under defined conditions with the intensity of light scattered by a standard reference suspension
under the same conditions. Higher the intensity of scattered light, higher the turbidity
(APHA,1999)
Alkalinity, mg l CaCO3 = B X N X 50,000
ml of sample

Comparison of Pulsator and Conventional clariflocculator for turbidity removal 2016
38
Instrument specifications (Figure 3.9):
Model Number Digital Nephelometer Model -341E
Range 0 to 19.9 NTU F.S.
0 to 199.9 NTU F.S.
Resolution 0.1 NTU
Figure 3.9: Digital Nephelometer at PHE Lab, MNIT, Jaipur and its principle
Preparation of stock turbidity suspension:
A) Solution A: 1.0 gm of Hydrazine sulphate (NH2)2H2SO4 (laboratory grade) was dissolved in
distilled water and is diluted to 100 ml in a volumetric flask.
B) Solution B: 10.0 gm of Hexamethylenetetramine (CH2)6N4was dissolved in distilled water
and diluted to 100 ml in volumetric flask.
C) In a 100 ml volumetric flask, 5.0 ml of solution A was mixed with 5.0 ml of solution B and
allowed to stand for 24 hours at 25oC ± 3
oC. Then it was diluted to the mark (100 ml) and mixed.
The turbidity of this suspension was 400 NTU.

Comparison of Pulsator and Conventional clariflocculator for turbidity removal 2016
39
Preparation of standard turbidity suspensions :
a) 25 ml of stock turbidity suspension was diluted to 100 ml with distilled water. The turbidity of
this suspension was 100 NTU.
b) 10 ml of 100 NTU solution was further diluted to 100ml with distilled water. The turbidity of
this suspension was 10 NTU.
Procedure:
1) A sufficient warm up period was given to the instrument after switching it ON.
2) The instrument was set to zero by distilled water. This was done by setting the display to 00.0
by adjusting the „Set Zero‟ knob.
3) To calibrate the instrument, the prepared standard suspensions were taken in the test tube.
Appropriate range was selected using the Range switch. For 0-20 NTU range, 10 NTU solution
was used and for higher range (0-200 NTU), 100 NTU solution was used as standard. The
display was set to the value of the standard suspension with the „Calibrate‟ knob.
4) Again the display was checked as zero with the test tube containing distilled water.
5) The sample to be tested was thoroughly shaken till bubbles disappear. For measurement of
turbidity less than 20 NTU the range switch was puton 20 NTU and the sample was taken into
the test tube. The reading was taken directly from the digital display.
6) For measurement of turbidity above 200 NTU,the sample was diluted with known volumes of
turbidity free water until the turbidity falls within 200 NTU and the Range switch was put to 200
NTU.Now the turbidity of the original sample was calculated from the turbidity of the diluted
sample and using the dilution factor.
3.3.1.4 JAR TEST
Raw water sample was collected from Bisalpur. Jar tests on this sample was performed with
PAC for optimum coagulant dosage and optimum pH. The coagulant dose varied from 5 to 60
ppm. The samples were tested for pH, turbidity and alkalinity.

Comparison of Pulsator and Conventional clariflocculator for turbidity removal 2016
40
Principle: The jar test is a common laboratory procedure which is used to determine the
optimum operating conditions for water or wastewater treatment. The method allows adjustments
in pH, variations in coagulant or polymer dose, testing of different coagulant or polymer types
alternating mixing speeds on a small scale in order to predict the functioning of a large scale
treatment operation. A jar test simulates the processes of coagulation and flocculation that
encourage the removal of suspended solids and organic matter which can lead to turbidity, odor
and taste problems.
Procedure:
1) The turbidity, pH and alkalinity of raw water sample was determined using the above
procedures.
2) Six jars were filled to 500 ml each with raw water.The filled jars were placed on the gang
stirrer, with the paddles positioned identically in each beaker.
3) PAC was added into each of the beakers to obtain the desired concentrations in the raw water
samples. Here, jar test was performed on 12 samples with varying PAC dosage from 5 ppm to 60
ppm. Hence, two sets of jar test was performed, i.e. 5 to 30 ppm in Set -1 and 35- 60 ppm in Set-
2. A 1% solution of PAC was prepared and following doses were introduced for each desired
coagulant concentration (Table 3.6).
4) Rapid mix was done for each jar at 100 to 150 rpm for 2 minutes. The rapid mix helped to
disperse the coagulant throughout each container.
5) At the end of 2 minutes, the stirring speed was now reduced to 25 to 35 rpm and mixing was
continued at this speed for 15 to 20 minutes. This slower mixing speed helped promote floc
formation by enhancing particle collisions which lead to larger flocs.
6) At the end of the mixing period, the stirrer was turned off and the flocs were allowed to settle
for 30 minutes.
7) The supernatant was then removed from each beaker and turbidity was determined for each of
the samples. Similarly, pH and alkalinity readings were taken for each sample.

Comparison of Pulsator and Conventional clariflocculator for turbidity removal 2016
41
Table 3.6: Coagulant dosages for Jar test
SET -1 SET -2
Coagulant
concentration
(ppm)
Dosage of 1%
PAC in ml
Coagulant
concentration
(ppm)
Dosage of 1%
PAC in ml
5 0.210 35 1.450
10 0.420 40 1.660
15 0.620 45 1.870
20 0.830 50 2.080
25 1.040 55 2.280
30 1.250 60 2.490
Figure 3.10: Jar Test apparatus at PHE lab, MNIT Jaipur
3.3.2 Field Visits
Surajpura water treatment plant was visited to develop an insight of the water treatment
operations at the plant as well as to identify various sampling points for the study. Overall, six
sampling points at the plant were identified and numerous water quality parameters were
measured and reported at each of these points. The sampling points are as shown (Figure 3.11):
1) Raw water at Inlet

Comparison of Pulsator and Conventional clariflocculator for turbidity removal 2016
42
2) Immediately after prechlorination and PAC dosing
3) Before Hydraulic jump
4) After hydraulic jump and before pulsator
5) Pulsator outlet before filter
6) Filter Outlet
Figure 3.11: Sampling points at Surajpura water treatment plant
3.3.3 Weekly reports from Surajpura water treatment plant
Weekly reports from June, 2015 to January, 2016 were obtained for turbidity from the Surajpura
water treatment plant. For the 35 week period, turbidity data was analyzed for different water
treatment stages, namely, raw water turbidity, turbidity at pulsator outlet and turbidity post
filtration.
3.3.4 Data analysis
The pilot pulsator plant was compared with the Superpulsator at Surajpura water treatment plant
for residual turbidity. Turbidity values at pulsator outlet and post filtration were compared for
different inlet turbidity ranges. Thus, effectiveness of pulsator was analysed in terms of turbidity

Comparison of Pulsator and Conventional clariflocculator for turbidity removal 2016
43
removal. Also, a comparative analysis of conventional clariflocculator and pulsator pilot in terms
of turbidity removal was done.
3.4 Instruments used
Following table (Table 3.7) gives a brief description of various instruments used for
experimentation.
Table 3.7 Instrument Description
S.No. Instrument Company Model
1. pH Meter Labtronics LT-11
2. Nephelometer Electronics India Model 341
3. Weighing Balance CAS CAUW220D
4. Jar test apparatus Accumax India
5. Chlorine kit Hannah UV
photometer
6. Distilled water Unit

Comparison of Pulsator and Conventional clariflocculator for turbidity removal 2016
44
CHAPTER-4
4. RESULTS AND DISCUSSION
The experimental data for the pulsator pilot plant and clariflocculator as well as secondary data
obtained from Surajpura is analysed and compared in this chapter.
4.1 Analysis of Surajpura water treatment plant in terms of turbidity removal
The 35 week treatment plant data was analyzed with respect to numerous parameters like pH,
turbidity, suspended solids and coagulant dosage. The summarized value of each parameter is
shown in Table 4.1 below:
Table 4.1 : Water quality parameters for treatment plant
RAW WATER QUALITY
PARAMETERS MEAN STANDARD DEVIATION
Turbidity (NTU) 3.77 2.60
pH 7.64 0.05
Coagulant dose(ppm)
(equivalent to1.452 ppm as Al)
27.14 3.27
CLARIFIED WATER QUALITY
Turbidity (NTU) 0.84 0.15
Suspended solids (mg/l) 1.52 0.51
TREATED WATER QUALITY
Turbidity (NTU) 0.27 0.04
pH 7.23 0.04
It is found that:
99% of raw water turbidity values were less than 13.9 NTU and 60% of the coagulant
dosages were 25 ppm. This preliminary data analysis was used as a basis for turbidity and
coagulant dosage selection for the pulsator model.

Comparison of Pulsator and Conventional clariflocculator for turbidity removal 2016
45
90% of the clarified turbidity values were less than 1.0 NTU.
The pH was found to decrease marginally from 7.64 to 7.23. This eliminates the need of
adding any external alkalinity to the system.
As per the Indian Standard for Drinking Water, IS-10500, 2012, the acceptable limit of
turbidity is 1 NTU. The turbidity of treated water is well below the prescribed limits with
a mean value of 0.27 NTU and standard deviation of 0.04 NTU.
Turbidity data for the treatment plant was collected from June, 2015 to January, 2016. The data
was categorized into two seasons, i.e. monsoon-post monsoon season and winter season.
Graph 4.1: Turbidity variation for monsoon and post monsoon season
The above graph (Graph 4.1) shows that during monsoon- post monsoon season, turbidity values
varied from as low as 2.5 NTU to as high as 14.1 NTU. The occurrence of high turbidities was
rare even during the monsoon season. Higher turbidity values were observed for two consecutive
days which can be attributed to either an algal bloom or a high incidence of rainfall, thus keeping
particles in suspension. Turbidity of clarified water is below 1 NTU and that of treated water is
below 0.3 NTU.
0
2
4
6
8
10
12
14
16
6/9
/201
5
6/1
5/2
01
5
6/2
2/2
015
6/3
0/2
015
7/8
/201
5
7/1
8/2
015
7/2
4/2
015
7/3
1/2
01
5
8/1
/201
5
8/1
0/2
015
8/1
9/2
015
8/3
1/2
015
9/1
/201
5
9/7/
2015
9/1
5/2
015
9/2
8/2
015
TUR
BID
ITY
(NTU
)
RAW WATER CLARIFIED WATER TREATED WATER

Comparison of Pulsator and Conventional clariflocculator for turbidity removal 2016
46
Graph 4.2: Turbidity variation for winter season
From Graph 4.2, turbidity values during the winter season were relatively lower and generally
varied around 3 NTU. Turbidity of clarified water is below 1 NTU and that of treated water is
below 0.3 NTU.
Following observations can be made by analysis of above graphs (Graph 4.2 and 4.3):
The raw turbidity itself is very low and even during the monsoon season there are
negligible instances of high turbidity. Also, the coagulation flocculation process itself is
highly efficient in turbidity removal; hence, the filter is under-utilized. Thus, there is a
scope to reduce the coagulant dosage.
Statistical testing of turbidity data for two seasons, i.e. winter and monsoon showed no
significant difference at p<0.05.
4.2 Results of Jar Test on Bisalpur raw water
Jar test was conducted with raw water from Bisalpur with varying PAC dosage from 5 ppm to 60
ppm to investigate the optimum PAC dosage. The measured values of turbidity, pH, alkalinity
are shown in Table 4.2.
00.5
11.5
22.5
33.5
4
10
/2/2
01
5
10
/12
/20
15
10/2
0/20
15
10
/27
/20
15
11
/1/2
01
5
11
/7/2
01
5
11
/15
/20
15
11
/22
/20
15
11
/30
/20
15
12
/1/2
01
5
12
/9/2
01
5
12
/16
/20
15
12
/24
/20
15
12
/31
/20
15
1/1
/20
16
1/9
/20
16
1/1
6/2
01
6
1/2
5/2
01
6
1/3
1/2
01
6
TUR
BID
ITY
(NTU
)
RAW WATER CLARIFIED WATER TREATED WATER

Comparison of Pulsator and Conventional clariflocculator for turbidity removal 2016
47
Table 4.2 : Jar test results
COAGULANT
DOSAGE (PPM)
RESIDUAL
TURBIDITY (NTU)
pH ALKALINITY (as
mg/L of CaCO3)
5 0.4 7.86 32
10 0.3 7.85 28
15 0.4 7.68 28
20 0.2 7.46 20
25 0.1 7.36 28
30 0.1 6.84 24
35 0.0 7.25 24
40 0.0 7.39 24
45 0.1 7.45 24
50 0.2 7.42 20
55 0.1 7.25 24
60 0.2 7.34 16
Graph 4.3: Residual turbidity with varying PAC dosage
Graph 4.3 shows the variation of residual turbidity with PAC dosage. The raw water turbidity
was found to be 0.6 NTU which is very low in itself. In case of low turbid waters (turbidity <
5NTU), the jar tests are not very reliable in determining the optimum coagulant dosage (Deborah
et.al., 1988). Here, the residual turbidity reduced to zero at Pac dosage of 35 and 40 ppm. Also,
the residual turbidity is very low even for dosages below 25 ppm and further reduction can be
achieved by filter. Thus, there lies a need use a coagulant dose optimum for a set turbidity target
rather than the dosage corresponding to minimum turbidity. This will ensure effective filter
0
0.1
0.2
0.3
0.4
0.5
0.6
0.7
5 10 15 20 25 30 35 40 45 50 55 60
RES
IDU
AL
TUR
BID
ITY
(N
TU)
COAGULANT DOSAGE (PPM)
CLARIFIED WATER RAW WATER

Comparison of Pulsator and Conventional clariflocculator for turbidity removal 2016
48
utilization. Currently, a 25ppm dosage of 100% PAC is administered at Surajpura. The current
dosage can be reduced as with higher coagulant dosage, there lies a risk of charge reversal,
thereby causing resuspension of particles. Thus, the system can be said to be overdosed. Hence,
there lies a need for further optimization of coagulant dose in the range of 5ppm – 20 ppm
taking into account coagulant cost, alkalinity, pH , sludge production, filter utilization, etc as
other variables with appropriate weight factors.
Graph 4.4: Variation of pH with PAC dosage
The effect of poly aluminium chloride dose on pH is shown in Graph 4.4. The addition of metal
coagulants lowers the water pH. Due to acidic nature of metal coagulants they consume large
amounts of raw water alkalinity. For water with low alkalinity, pH decrease more rapidly with
increase in PAC dosage. Here, the pH of raw water is 7.84. Initially, there is no change in pH till
10 ppm as less alkalinity is consumed at low coagulant concentration. From 15 ppm, the pH
decreased significantly. As PAC is a prehydrolysed species, the drop is small and all dosages
resulted in pH within the acceptable range of 6.5-9 for potable water.
6.2
6.4
6.6
6.8
7
7.2
7.4
7.6
7.8
8
5 10 15 20 25 30 35 40 45 50 55 60
pH
COAGULANT DOSAGE (PPM)
CLARIFIED RAW WATER

Comparison of Pulsator and Conventional clariflocculator for turbidity removal 2016
49
Graph 4.5: Variation of alkalinity with PAC dosage
Graph 4.5 illustrates the effect of PAC dosage on alkalinity. It is evident that alkalinity decreases
with the increase in coagulant dose. The raw water alkalinity was found to be 32 ppm and it
dropped to as low as 16 mg/l of CaCO3 at a PAC dosage of 60 ppm.
4.3 Pulsator model Results
The pulsator pilot scale model was operated at seven inlet turbidity values (two runs each) and
the effluent turbidity was reported. Turbidity post filtration with 20 and 11 micron filter was also
recorded.
4.3.1 TURBIDITY REMOVAL
The pulsator model was operated for several inlet turbidity values at a constant coagulant dosage
of 25 ppm. The clarified water was then filtered through 11 µm and 20 µm filters. Table 4.3
shows the turbidity removal in pulsator.
Table 4.3 : Turbidity removal in pulsator
INLET
TURBIDITY (NTU)
CLARIFIED
(NTU)
FILTERED
20 µm 11 µm
2 1.0 0.6 0.4
3 1.9 0.6 0.3
02468
10121416182022242628303234
5 10 15 20 25 30 35 40 45 50 55 60
ALK
ALI
NIT
Y (
mg/
L O
f C
aCO
3)
COAGULANT DOSAGE (PPM)
CLARIFIED WATER RAW WATER

Comparison of Pulsator and Conventional clariflocculator for turbidity removal 2016
50
5 2.4 0.5 0.1
8 4.3 0.2 0.3
10 4.9 1.1 0.8
20 1.6 0.8 0.6
30 2.1 0.6 0.2
Graph 4.6: Turbidity removal in pulsator
Graph 4.6 shows the turbidity values of clarified and filtered water for various inlet turbidity
values. It can be seen that there is an appreciable reduction in turbidity post clarification as well
as filtration. The clarified water turbidity is always less than 5 NTU. The filtered water turbidity
is less than 1 NTU for all inlet turbidities and therefore, meets the acceptable limit of 1 NTU
(Indian Standard for Drinking Water, IS-10500, 2012). The pulsator was able to reduce turbidity
drastically for 20 NTU and 30 NTU to 1.6 and 2.1 NTU respectively. At higher turbidities, both
charge neutralization and polymerization became effective mechanism for turbidity removal as
number of sites available for coagulant reaction increased. At lower turbidities, polymerization
only is the effective removal mechanism. The possible explanation for observance of higher
residual turbidity at 8 and 10 NTU compared to 2,3,5 NTU can be resuspension of particles due
to charge reversal.
0
1
2
3
4
5
2 3 5 8 10 20 30
RES
IDU
AL
TU
RB
IDIT
Y (
NTU
)
INLET TURBIDITY (NTU)
CLARIFIED WATER FILTERED WATER-20 MICRON
FILTERED WATER-11 MICRON

Comparison of Pulsator and Conventional clariflocculator for turbidity removal 2016
51
Graph 4.7: Percentage removal efficiency of pulsator
Graph 4.7 illustrates the overall turbidity removal efficiency at various treatment stages. The
turbidity removal efficiency is found to increase with increase in inlet turbidity. This study may
be explained in terms of the increase in suspended particles available with an increase in initial
turbidity. This increase created more sites for adsorption and inter-particle bridge formation
resulting in an increase in particle collision frequency and agglomeration rate leading to decrease
in residual turbidity. It varied from 36.67% at 3 NTU to 93% at 30 NTU. The overall filter
efficiency vary from 70% - 98% for 20 micron filter. A better overall removal efficiency is
observed with 11 micron filter which vary from 80% to 99.33%. These results show that-
Floc formation improves with increase in turbidity as more sites for polymerization are
available to the coagulant. Hence, addition of a coagulant aid can improve the pulsator
efficiency and reduce the load on the filter units.
Also, it can be inferred that the around 30%-40% of floc formed are of size greater than
11micron which are easily removed by the filter.
For 20 and 30 NTU, more than 90% turbidity removal happened in pulsator itself, leaving
the filters under-utilized. Thus, a lower coagulant dosage can be tested for these turbidity
values, thereby, reducing coagulant cost as well as sludge produced.
0
20
40
60
80
100
2 3 5 8 10 20 30OV
ERA
LL R
EMO
VA
L (
%)
INLET TURBIDITY (NTU)
CLARIFIED WATER POST FILTRATION- 20 MICRON
POST FILTRATION- 11 MICRON

Comparison of Pulsator and Conventional clariflocculator for turbidity removal 2016
52
4.3.2 EFFECT ON TURBIDITY DUE TO ALGAE GROWTH IN PULSATOR MODEL
Due to exposure to sunlight, algae growth was observed in the pulsator model. The model was
operated at three turbidities, i.e. 2, 3, 5 NTU during this period. Graph 4.8 shows the effect of
algae growth on effluent turbidity.
Graph 4.8: Effect on turbidity due to algae growth
The above graph (Graph 4.8) illustrates that:
Turbidity levels of clarified water increased due to algae instead of decreasing. This
increase is due to the existence of algal cells in the clarified water. Also, coagulation –
flocculation may also have got affected due to algae.
Though, the turbiditity of clarified water is high, yet the turbidity levels post filtration are
very low and in coherence with those during normal pulsator operation. Thus, the
flocculated algal cells are of size greater than 20 micron, thereby, got removed by
filtration. It has been reported that sludge blanket-type clarifiers are substantially more
effective than static settlers, particularly upflow pulsed systems–90-99% phytoplankton
removal in 4 plants (Mouchet and Bonnélye, 1998)
0.0
2.0
4.0
6.0
8.0
10.0
12.0
2 3 5
6.0
3.6
10.1
0.3 0.3 0.50.3 0.3 0.3
RES
IDU
AL
TUR
BID
ITY
(N
TU)
INLET TURBIDITY (NTU)
CLARIFIED WATER FILTERED WATER- 20 MICRON
FILTERED WATER- 11 MICRON

Comparison of Pulsator and Conventional clariflocculator for turbidity removal 2016
53
4.3.3 MODEL CLEANING BY CHLORINE FOR ALGAE REMOVAL
A chlorine dosage of 5 ppm was run in the pulsator model for algae removal. The residual
chlorine at effluent end was monitored at regular intervals.
Graph 4.9 shows that the residual chlorine levels initially increase slowly for the first 90 minutes.
Later a steep increase in chlorine level is observed for next 30 minutes. Residual chlorine of 4.5
ppm was available at the end of 120 minutes.
Graph 4.9: Model cleaning by chlorine- Day 1
Graph 4.10: Model cleaning by chlorine - Day 2
0.00
1.00
2.00
3.00
4.00
5.00
0 30 50 60 70 80 90 100110120
Re
sid
ual
ch
lrin
e(p
pm
)
Time elapsed (mins)
Residual Chlorine (Day -1)
Residual chlorine(ppm)
0.00
1.00
2.00
3.00
4.00
5.00
6.00
0 30 50 65 95 125 155 170Re
sid
ual
Ch
lori
ne(
pp
m)
Time elapsed (mins)
Residual Chlorine (Day -2)
Residual chlorine(ppm)

Comparison of Pulsator and Conventional clariflocculator for turbidity removal 2016
54
Graph 4.10 illustrates the residual chlorine levels for second run. Here, initial residual chlorine of
0.2 ppm was present at the start which slowly increased to 2 ppm in 125 minutes. A steep
increase in chlorine level occurred thereafter and residual chlorine of 5 ppm is achieved in 45
minutes.
4.4 Comparison between Surajpura Water Treatment Plant and Pulsator
Pilot Scale Model
4.4.1 COMPARISON AT INLET TURBIDITY = 2NTU AND PAC DOSAGE = 25 ppm
The pilot pulsator model was operated at 2 NTU and PAC dosage of 25 ppm for two runs and
mean residual turbidity of clarified and filtered water was reported. Similarly, for comparison
inlet turbidity values below 2.5 NTU were selected from the 35 week data and a mean value
reported as shown in the Table 19 below:
Table 4.4: Comparison at a raw turbidity of 2 NTU and PAC dose of 25 ppm
Clarified Filtered
Surajpura 0.8 0.2
Pulsator 20 µm 1.0
0.6
11 µm 0.4
Graph 4.11: Comparison at a raw turbidity of 2 NTU and PAC dose of 25 ppm
0
0.2
0.4
0.6
0.8
1
1.2
CLARIFIED FILTERED
Res
idu
al T
urb
idit
y (N
TU)
BISALPUR PULSATOR 20 MICRON
PULSATOR 11 MICRON

Comparison of Pulsator and Conventional clariflocculator for turbidity removal 2016
55
The above graph (Graph 4.11) shows that the pulsator model was able to reduce the turbidity to 1
NTU and to 0.6 and 0.4NTU after 20 µm and 11 µm filters respectively. At Surajpura, the mean
residual turbidity post pulsator was found to be 0.8 NTU with a standard deviation of 0.1 NTU
and post filtration as 0.2NTU with a standard deviation of 0.02 NTU. Hence, the turbidity values
observed for pilot plant are slightly higher than those for the treatment plant.
Graph 4.12: Percentage removal at a raw turbidity of 2 NTU and PAC dose of 25 ppm
From Graph 4.12, the removal efficiency of pulsator model is 50% post clarification and an
overall turbidity removal of 80% and 70% is achieved after 11µm and 20µm filters respectively.
A 69% removal post clarification and an overall 90.16% removal are observed for the treatment
plant. Lower efficiency of pulsator model as compared to the treatment plant can be attributed to
lesser system stability owing to discontinuous operation of the lab scale model as well as high
dependence of effluent quality on sludge blanket properties.
4.4.2 COMPARISON AT INLET TURBIDITY = 3NTU AND PAC DOSAGE = 25 ppm
The pilot pulsator model was operated at 3 NTU and PAC dosage of 25 ppm for two runs and
mean residual turbidity of clarified and filtered water was reported. Similarly, for comparison
inlet turbidity values between 2.5 to 3.5 NTU were selected from the 35 week data and a mean
value reported as shown in the Table 4.5.
69.00
90.16
50.00
80.00
70.00
0
10
20
30
40
50
60
70
80
90
100
CLARIFIED FILTERED
TUR
BID
ITY
REM
OV
AL
(%)
BISALPUR PULSATOR 11 MICRON PULSATOR 20 MICRON

Comparison of Pulsator and Conventional clariflocculator for turbidity removal 2016
56
Table 4.5: Comparison at a raw turbidity of 3 NTU and PAC dose of 25 ppm
Clarified Filtered
Surajpura 0.9 0.3
Pulsator 20 µm 1.9
0.5
11 µm 0.3
Graph 4.13: Comparison at a raw turbidity of 3 NTU and PAC dose of 25 ppm
Here, the turbidity of clarified water from pulsator is 1.9 NTU as compared to the much lower
value of 0.9 NTU (standard deviation of 0.2 NTU) at Surajpura (Graph 4.13) However, the
filtered water turbidity for pulsator are 0.5 NTU (20 µm) and 0.3 NTU (11 µm). Similar values
for Surajpura are 0.3 NTU with standard deviation of 0.04 NTU.
The above results explain the floc formation in the pulsator model. Though the turbidity
of clarified water is comparatively higher, but the floc size is large enough not to pass
through the filter. The turbidity post filtration is equal for the model and plant. This
ensures that the model was able to achieve effective flocculation and a higher turbidity of
clarified water can be due to a carried away floc during sampling. Also, it can be inferred
that the majority flocs are of size greater than 20µm.
0
0.5
1
1.5
2
CLARIFIED FILTERED
RES
IDU
AL
TUR
BID
ITY
(NTU
)
BISALPUR PULSATOR 20 MICRON PULSATOR 11 MICRON

Comparison of Pulsator and Conventional clariflocculator for turbidity removal 2016
57
Graph 4.14: Percentage removal at a raw turbidity of 3 NTU and PAC dose of 25 ppm
The removal efficiency for pulsator and the treatment plant are 36.67% and 71.33% respectively.
The overall turbidity removal post filtration is 83.33% (20 µm) and 90% (11 µm) for the model
and 90.69% for the treatment plant. Hence, a major portion of turbidity is removed during
filtration too due to effective flocculation at the previous stage.
4.5 Conventional clariflocculator model Results
The conventional clariflocculator was operated at seven inlet turbidities at a PAC dosage of 25
ppm for a comparison between two technologies in terms of turbidity removal. Table 4.6 shows
the turbidity of clarified and filtered water for various inlet turbidities.
Table 4.6: Turbidity removal in conventional clariflocculator
INLET
TURBIDITY (NTU)
CLARIFIED
(NTU)
FILTERED
20 µm 11 µm
2 4.8 0.0 0.0
3 5.7 0.8 0.2
5 7.6 1.4 1.3
8 7.6 1.4 0.7
10 6.6 1.3 0.4
20 10.8 1.0 0.4
30 13.8 2.1 0.7
0
20
40
60
80
100
CLARIFIED FILTERED
TUR
BID
ITY
REM
OV
AL(
%)
BISALPUR PULSATOR 11 MICRON PULSATOR 20 MICRON

Comparison of Pulsator and Conventional clariflocculator for turbidity removal 2016
58
Graph 4.15: Turbidity removal by clariflocculator
Graph 4.15 illustrates the turbidity removal in conventional clariflocculator. The effluent from
clariflocculator is found to have turbidity of 7.6, 6.6, 10.8 and 13.8 NTU for inlet turbidity of 8,
10, 20, 30 NTU respectively. It can be seen that there is not much reduction in turbidity.
However, turbidity post- filtration is quite low and generally around 1 NTU.
This can be due to insufficient detention time for the flocs to settle in clariflocculator.
These flocs contribute to turbidity post clariflocculator, but are removed during filtration.
Also, a piped outlet for effluent collection was provided in the model which caused
suction of flocs with the effluent. Hence, a need was felt to provide a peripheral weir
instead of piped outlet to reduce weir loading.
For inlet turbidity of 2, 3, and 5 NTU, the effluent turbidities are higher. This can be attributed to
ineffective coagulation due to low turbidity. A coagulant aid is required for low turbidities for
effective coagulation.
0
5
10
15
2 3 5 8 10 20 30RES
IDU
AL
TU
RB
IDIT
Y (
NTU
)
INLET TURBIDITY (NTU)
CLARIFIED WATER FILTERED WATER - 20 MICRON
FILTERED WATER -11 MICRON

Comparison of Pulsator and Conventional clariflocculator for turbidity removal 2016
59
Graph 4.16: Overall turbidity removal after filtration
From Graph 4.16, for 3-30 NTU, the overall removal efficiency is found to increase with
increase in turbidity. For 20 micron filter, the overall removal efficiency varied from 72% to
95%. Higher removal efficiency for 11 micron filter from 74% to 98% is observed for 11 micron
filter. The maximum removal achieved in clariflocculator is 54%. Thus, a large fraction of
turbidity is removed in filtration. In such cases, due to extra burden on filter, filter runs are
shortened and frequent backwashing is required.
0.00
20.00
40.00
60.00
80.00
100.00
120.00
2 3 5 8 10 20 30
OV
ERA
LL T
YR
BID
ITY
REM
OV
AL
(%)
INLET TURBIDITY (NTU)
FILTERED WATER - 20 MICRON
FILTERED WATER- 11 MICRON
CLARIFIED WATER

Comparison of Pulsator and Conventional clariflocculator for turbidity removal 2016
60
4.6 Comparison between Pulsator Pilot Scale Model and conventional
clariflocculator
Graph 4.17: Comparison between clariflocculator and pulsator for residual turbidity post
clarification
Graph 4.17 shows the superior performance of pulsator clarifier over conventional
clariflocculator for same turbidity and coagulant dosage. The residual turbidity from pulsator
was well below that obtained from conventional clariflocculation. For inlet turbidity of 20 and 30
NTU, the pulsator was able to reduce the turbidities drastically unlike clariflocculator.
02468
10121416
2 3 5 8 10 20 30RES
IDU
AL
TU
RB
IDIT
Y (
NTU
)
INLET TURBIDITY (NTU)
PULSATOR- CLARIFIED
CONVENTIONAL CLARIFLOCCULATOR-CLARIFIED

Comparison of Pulsator and Conventional clariflocculator for turbidity removal 2016
61
Graph 4.18: Comparison between clariflocculator and pulsator for residual turbidity post
filtration – 20 µm filter
From Graph 4.18, the residual turbidity post filtration with 20 micron filter is comparatively
lower for pulsator effluent. This can be attributed to better flocculation in the presence of a
suspended sludge blanket.
Graph 4.19: Comparison between clariflocculator and pulsator for residual turbidity post
filtration – 11 µm filter
0
0.5
1
1.5
2
2.5
2 3 5 8 10 20 30RES
IDU
AL
TU
RB
IDIT
Y(N
TU)
INLET TURBIDITY (NTU)
FILTERED- PULSATOR
FILTERED- CONVENTIONAL CLARIFLOCCULATOR
0
0.2
0.4
0.6
0.8
1
1.2
1.4
2 3 5 8 10 20 30
RES
IDU
AL
TU
RB
IDIT
Y (
NTU
)
INLET TURBIDITY (NTU)
FILTERED - PULSATOR
FILTERED - CONVENTIONAL CLARIFLOCCULATOR

Comparison of Pulsator and Conventional clariflocculator for turbidity removal 2016
62
Graph 4.19 illustrates that post filtration through a 11 micron filter, pulsator gives better results
for inlet turbidities of 3-8 NTU. For higher turbidity range, conventional clariflocculator showed
better turbidity removal post 11 micron filter. Hence, pulsator can be said to function better at
lower turbidities.

Comparison of Pulsator and Conventional clariflocculator for turbidity removal 2016
63
CHAPTER- 5
5. CONCLUSIONS AND RECOMMENDATIONS
After the successful operation of the pulsator pilot scale model and clariflocculator and the
following experimentation, following conclusions can be made after thorough analysis:
1) Detailed analysis of the Bisalpur water quality data for 35 weeks showed that the raw water
turbidity is very low and there is no significant variation in turbidity with season. The mean
turbidity values for clarified water and treated water are 0.84 NTU and 0.27 NTU respectively.
These values meet the drinking water standards, clearly indicates that the Surajpura WTP is
performing well.
2) Jar tests conducted on Bisalpur raw water emphasised that for low turbidity waters, coagulant
dose should be selected for a targeted residual turbidity rather than the minimum residual
turbidity. Thus, the current 25 ppm dose of 100% PAC need to be reduced to 5-20 ppm, thus
eliminating the risk of resuspension. This inference was further supported by the experimental
analysis carried out with the pulsator pilot plant.
3) Successful fabrication and operation of Pulsator Clarifier Pilot Plant in Perspex sheet provided
the rare opportunity to visualize and thus better understand the process of sludge blanket
formation. Development of sludge blanket, its stabilisation and ability to maintain it to desired
level height by adjusting the regular and the pulsed flow, is one of the most significant parts of
this study.
4) For the raw water turbidity range of 2-30 NTU, there is an appreciable reduction in turbidity
post clarification as well as filtration in pulsator clarifier. The clarified water turbidity is always
less than 5 NTU. The filtered water turbidity is less than 1 NTU for all inlet turbidities and
therefore, meets the acceptable limit of 1 NTU as per IS 10500:2012.
5) The operation of the pulsator pilot plant at raw water turbidity from 2-30 NTU indicated that
the turbidity removal efficiency in pulsator clarifier increases with the increased turbidity levels

Comparison of Pulsator and Conventional clariflocculator for turbidity removal 2016
64
in the raw water. It increased from 36.67% at 3 NTU to 93% at 30 NTU. The same inference can
be drawn from the analysis of Surajpura WTP data for 35 weeks.
6) The overall filter efficiency for clarified water from the pilot plant varied from 70% - 98% for
20 micron filter. A better overall removal efficiency is observed with 11 micron filter which
varied from 80% to 99.33%. In view of argument placed at (5), it is indicative that at PAC
dosage of 25 ppm, a large fraction of turbidity removal occurred during clarificaltion stage only,
thus leaving the filters under- utilized as well as contributing excess chemical and sludge
disposal costs. Thus, the coagulant dose can be reduced below 5 ppm to ensure efficient filter
utilization.
7) Comparative analysis of pulsator pilot plant with conventional clariflocculator clearly showed
the superior performance of pulsator clarifier in turbidity removal. For low turbidities, the
clariflocculator was not able to reduce turbidity well. The maximum removal achieved in
clariflocculator was 54%. At the same time, the pulsator was able to reduce the turbidity to
permissible limits efficiently.
Comparison of Pulsator and Conventional clariflocculator for turbidity removal 2016
65
CHAPTER -6
6. FUTURE RESEARCH
A number of practical research ideas that can be executed. Few of these are:
Certain design changes can be incorporated in the clariflocculator model. Replacement of
pipe outlet with peripheral weir will help in eliminating suction, thus preventing the flocs
being drawn with the effluent.
Provision for continuous operation of the models can help in providing a more stable
sludge blanket with uniform properties, thus facilitating better comparison at different
inlet turbidities.
Suggestion of a better and economical coagulant, as against 100% Polyaluminium
Chloride being currently administered at the Surajpura WTP of Bisalpur-Jaipur Water
Supply Project (BJWSP). The ability of the pulsator clarifier to handle low solids
concentration water and chemistry of the water supplied from the Bisalpur dam, prima
facie warrant a deeper investigation of the coagulation mechanism and the coagulant
used. Combinations of alum, Polyaluminium Chloride and other chemicals can be
simulated to come up with an improved coagulant for the Surajpura WTP.
The present study can be extended to examine the direct removal of many other
contaminants that can be adsorbed by colloids. These contaminants include metals such
as arsenic, toxic organic matter, viruses, emerging pathogens such as Cryptosporidium
and Giardia, and humic materials.
The pulsed sludge blanket technology has the potential of replacing the settler and
membrane combination in the „Nalgonda‟ process equipment for the de- fluoridation of
water. It is also supposed that this new design will result in much reduced residual
aluminium levels.

Comparison of Pulsator and Conventional clariflocculator for turbidity removal 2016
66
REFERENCES
APHA, Standard Methods for the Examination of Water and Wastewater, 20th. Edited by Arnold
E. Greenberg, Andrew D. Eaton Lenore S. Clesceri. American Water Works Association, Water
Environment Federation, 1999.
Bagwell T., Henry H.B. and Kenneth M.B., 2001, Handbook of public water systems, 2nd
Edition, HDR Engineering Inc., New York.
Binnie C., Kimber, M. and Smethurst. G., (2002), Basic water treatment,Thomas Telford Ltd.,
London.
Deborah R.B., Suing-Ill C., Mohammed A. and Hendricks D. (1988) Bench-Scale Evaluation of
Coagulants for Low Turbidity Water, American Water Works Association, 80-(4), 199-204.
Duan J., Gregory J. (2003), Coagulation by hydrolysing metal salts, Advances in Colloid and
Interface Science, 100- (102), 475-502.
Han M. and Lawler D.F.,( 1992). The (relative) insignificance of G in flocculation, American
Water Works Association, 82-(11), 56-73.
Indian Standards for Drinking water, IS-10500,2012.
Matilainen A., Vepsalainen M., Sillanppa M. (2010), Natural organic matter removal by
coagulation during drinking water treatment: A review, Advances in Colloid and Interface
science, (159), 189-197.
Mouchet P. and Bonnélye V. (1998), Solving algae problems: French expertise and worldwide
applications, Water Research, (47), 125-141.
MRWA (Editor) (2003): Coagulation and Flocculation Process Fundamentals, MRWA:
Minnesota Rural Water Association.
Muthuraman G. and Sasikala S. (2014), Removal of turbidity from drinking water using natural
coagulants, Journal of Industrial and Engineering Chemistry,(20), 1727-1731.

Comparison of Pulsator and Conventional clariflocculator for turbidity removal 2016
67
Muyibi S.A. and Evison L.M. (1995), Optimizing Physical Parameters Affecting Coagulation of
Turbid Water with Moringa oleifera seeds, Water Research, 29-(12), 2689-2695
National Primary Drinking Water Standards, USEPA, 1996.
Packham, R. F. (1962), The coagulation process II; Effect of pH on the precipitation of
aluminium hydroxide, Applied Chemistry, (12), 564-568
Pernitsky D. J. and Edzwald J. K. (2000), Polyaluminium chloride – chemistry and selection,
Proceedings of Annual Conference at Denver (CDROM), American Water Works Association.
Prakash N.B., Sockan V., Jayakaran P, (2014), Waste Water Treatment by Coagulation and
Flocculation, International Journal of Engineering Science and Innovative Technology,3(2),
2319-5967.
Reynolds, T.D. and Richards, P.A., (1996), Unit operations and processes in environmental
engineering. 2nd Edition, PWS Publishing Company.
Sanks, R.L., (1979), Water treatment plant design, Ann Arbor Science Publishers Inc.
Sinha S., Yoon Y., Amy G., Yoon J. (2004), Determining the effectiveness of conventional and
alternative coagulants through effective characterization schemes, Chemosphere, (57), 1115-
1122.
Snoeyink V.L. and Jenkins D., (1980), Water chemistry, John Wiley and Sons, Inc., NewYork
Thomas D.N., Judd S.J. and Fawcett N., (1999), Flocculation modeling: a review, Water
Research, 33(7), 1579-1592.
Weber W. J., Hopkins C. B. and Bloom R. (1970), Physiological treatment of wastewater, Water
Pollution Control Fed., 42(1), 83-99.
World Health Organization, Guidelines for Drinking-Water Quality, 3rd ed.; World Health
Organization: Geneva, Switzerland, 2008.

Comparison of Pulsator and Conventional clariflocculator for turbidity removal 2016
68
APPENDIX -A
PULSATOR RESULTS FOR TWO RUNS
Residual Turbidity for RUN-1
RAW TURBIDITY
(NTU)
UNFILTERED
(NTU)
FILTERED
WATER (NTU)
20µm 11µm
2 1.0 0.7 0.5
3 2.4 1.0 0.6
5 2.7 0.9 0.2
8 6.0 0.3 0.4
10 4.9 1.2 0.9
20 2.2 0.2 0.2
30 2.2 0.5 0.2
Residual Turbidity for RUN-2
RAW TURBIDITY
(NTU)
UNFILTERED
(NTU)
FILTERED
WATER (NTU)
20µm 11µm
2 1.0 0.5 0.3
3 1.5 0.1 0.0
5 2.1 0.1 0.0
8 2.5 0.1 0.3
10 5.0 0.9 0.6
20 7.6 1.4 1.0
30 2.0 0.5 0.1

Comparison of Pulsator and Conventional clariflocculator for turbidity removal 2016
69