
Comparison of power-split and parallel hybrid powertrain...
8
Comparison of power-split and parallel hybrid powertrain architectures with a single electric machine: Dynamic programming approach Yalian Yang a,b,⇑ , Xiaosong Hu a,b,⇑ , Huanxin Pei a,b , Zhiyuan Peng c a The State Key Laboratory of Mechanical Transmissions, Chongqing University, Chongqing 400044, China b Department of Automotive Engineering, Chongqing University, Chongqing 400044, China c Automobile Engineering Institute, Chongqing Changan Automobile Co. Ltd., 401120, China highlights A power-split HEV with a single electric motor is constructed. Comparisons with P1 and P2 hybrid systems are made. Dynamic programming optimizes the hybrid systems. Multiple operating modes are useful to fuel economy. article info Article history: Received 18 November 2015 Received in revised form 2 February 2016 Accepted 3 February 2016 Keywords: Single electric machine Velocity coupling Hybrid electric vehicle Dynamic programming Fuel economy abstract Due to limited flexibility of engine operation, it is uneasy to improve the fuel economy of parallel hybrid electric vehicles (HEVs) with a single electric machine (SEM) from control perspective only. However, from design perspective, it is likely to devise multiple operating modes on a powertrain system to achieve better fuel economy. Therefore, in this paper, a velocity coupling HEV system with a SEM has been pro- posed, which has eleven modes, including an electric vehicle (EV) mode, three regenerative braking modes, an engine-start mode, an electrically variable transmission (EVT) mode, a parallel HEV mode, an engine-only mode, and three charging modes. Dynamic Programming (DP), as a global optimization algorithm, is leveraged to minimize the fuel consumption of this system. For comparison purposes, the P1 and P2 HEV systems are also examined by DP using the same vehicular parameters. Comparative results indicate that the P2 HEV saves about 6.68% fuel consumption over the P1 HEV, while more improvement can be observed from the proposed velocity coupling HEV, with 13.82% fuel consumption reduction over the P1 HEV. Ó 2016 Elsevier Ltd. All rights reserved. 1. Introduction Hybrid electric vehicles (HEVs) are among the most promising solutions to overcome serious concerns over environmental deteri- oration and fuel shortage [1–5]. Almost all automotive companies are actively developing HEVs [6–8]. Among all HEV types, power- split HEVs are the most popular type, as they can achieve great fuel economy with the electrically variable transmission (EVT) function which decouples the engine speed from the vehicle speed [9]. For example, Zhang et al. have developed systematic design proce- dures with automated modeling and screening for power-split HEVs [10,11]. Nevertheless, these EVT systems need two electric machines, which are very complicated and expensive [12]. In con- trast, HEVs with a single electric machine (SEM) are more cost- competitive and efficient [13]. Therefore, increasing researchers have been exploring them. Their salient characteristic is to obtain excellent fuel economy and emissions reduction through several operating modes, e.g., idle-stop mode, motor assisting mode, charging mode, and regenerative braking mode [14–17]. Munan et al. demonstrated that an HEV with a SEM improved 2.27% fuel economy by using idle-stop only in NEDC cycle and 6% in NEDC when using both idle-stop and motor assisting modes [18]. Maliko- poulos et al. found that a high-mobility multi-wheel vehicle (HMMWV) with a SEM decreased 4.3% fuel economy in city- highway combined cycle [19]. Liao et al. showed that a hybrid truck with a SEM increased about 13% fuel economy, compared to the conventional truck on primary road conditions [20]. http://dx.doi.org/10.1016/j.apenergy.2016.02.023 0306-2619/Ó 2016 Elsevier Ltd. All rights reserved. ⇑ Corresponding authors at: No. 174, Shazhengjie, Shapingba District, Chongqing 400044, China. Tel.: +86 131 9314 5610; fax: +86 23 6510 6195 (Y. Yang). Tel.: +86 136 1820 9956; fax: +86 23 6510 6195 (X. Hu). E-mail addresses: [email protected] (Y. Yang), [email protected] (X. Hu). Applied Energy 168 (2016) 683–690 Contents lists available at ScienceDirect Applied Energy journal homepage: www.elsevier.com/locate/apenergy
Transcript of Comparison of power-split and parallel hybrid powertrain...

Applied Energy 168 (2016) 683–690
Contents lists available at ScienceDirect
Applied Energy
journal homepage: www.elsevier .com/locate /apenergy
Comparison of power-split and parallel hybrid powertrain architectureswith a single electric machine: Dynamic programming approach
http://dx.doi.org/10.1016/j.apenergy.2016.02.0230306-2619/� 2016 Elsevier Ltd. All rights reserved.
⇑ Corresponding authors at: No. 174, Shazhengjie, Shapingba District, Chongqing400044, China. Tel.: +86 131 9314 5610; fax: +86 23 6510 6195 (Y. Yang). Tel.: +86136 1820 9956; fax: +86 23 6510 6195 (X. Hu).
E-mail addresses: [email protected] (Y. Yang), [email protected] (X. Hu).
Yalian Yang a,b,⇑, Xiaosong Hu a,b,⇑, Huanxin Pei a,b, Zhiyuan Peng c
a The State Key Laboratory of Mechanical Transmissions, Chongqing University, Chongqing 400044, ChinabDepartment of Automotive Engineering, Chongqing University, Chongqing 400044, ChinacAutomobile Engineering Institute, Chongqing Changan Automobile Co. Ltd., 401120, China
h i g h l i g h t s
� A power-split HEV with a single electric motor is constructed.� Comparisons with P1 and P2 hybrid systems are made.� Dynamic programming optimizes the hybrid systems.� Multiple operating modes are useful to fuel economy.
a r t i c l e i n f o
Article history:Received 18 November 2015Received in revised form 2 February 2016Accepted 3 February 2016
Keywords:Single electric machineVelocity couplingHybrid electric vehicleDynamic programmingFuel economy
a b s t r a c t
Due to limited flexibility of engine operation, it is uneasy to improve the fuel economy of parallel hybridelectric vehicles (HEVs) with a single electric machine (SEM) from control perspective only. However,from design perspective, it is likely to devise multiple operating modes on a powertrain system to achievebetter fuel economy. Therefore, in this paper, a velocity coupling HEV system with a SEM has been pro-posed, which has eleven modes, including an electric vehicle (EV) mode, three regenerative brakingmodes, an engine-start mode, an electrically variable transmission (EVT) mode, a parallel HEV mode,an engine-only mode, and three charging modes. Dynamic Programming (DP), as a global optimizationalgorithm, is leveraged to minimize the fuel consumption of this system. For comparison purposes, theP1 and P2 HEV systems are also examined by DP using the same vehicular parameters. Comparativeresults indicate that the P2 HEV saves about 6.68% fuel consumption over the P1 HEV, while moreimprovement can be observed from the proposed velocity coupling HEV, with 13.82% fuel consumptionreduction over the P1 HEV.
� 2016 Elsevier Ltd. All rights reserved.
1. Introduction
Hybrid electric vehicles (HEVs) are among the most promisingsolutions to overcome serious concerns over environmental deteri-oration and fuel shortage [1–5]. Almost all automotive companiesare actively developing HEVs [6–8]. Among all HEV types, power-split HEVs are the most popular type, as they can achieve great fueleconomy with the electrically variable transmission (EVT) functionwhich decouples the engine speed from the vehicle speed [9]. Forexample, Zhang et al. have developed systematic design proce-dures with automated modeling and screening for power-split
HEVs [10,11]. Nevertheless, these EVT systems need two electricmachines, which are very complicated and expensive [12]. In con-trast, HEVs with a single electric machine (SEM) are more cost-competitive and efficient [13]. Therefore, increasing researchershave been exploring them. Their salient characteristic is to obtainexcellent fuel economy and emissions reduction through severaloperating modes, e.g., idle-stop mode, motor assisting mode,charging mode, and regenerative braking mode [14–17]. Munanet al. demonstrated that an HEV with a SEM improved 2.27% fueleconomy by using idle-stop only in NEDC cycle and 6% in NEDCwhen using both idle-stop and motor assisting modes [18]. Maliko-poulos et al. found that a high-mobility multi-wheel vehicle(HMMWV) with a SEM decreased 4.3% fuel economy in city-highway combined cycle [19]. Liao et al. showed that a hybridtruck with a SEM increased about 13% fuel economy, comparedto the conventional truck on primary road conditions [20].
684 Y. Yang et al. / Applied Energy 168 (2016) 683–690
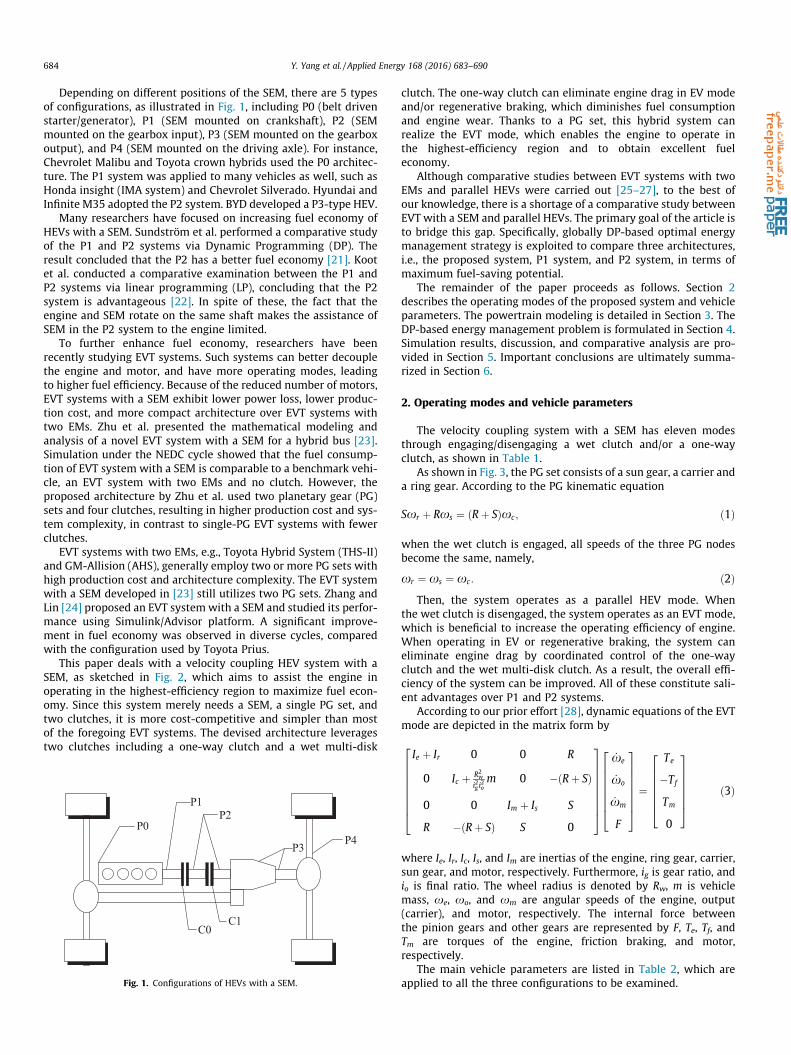
Depending on different positions of the SEM, there are 5 typesof configurations, as illustrated in Fig. 1, including P0 (belt drivenstarter/generator), P1 (SEM mounted on crankshaft), P2 (SEMmounted on the gearbox input), P3 (SEM mounted on the gearboxoutput), and P4 (SEM mounted on the driving axle). For instance,Chevrolet Malibu and Toyota crown hybrids used the P0 architec-ture. The P1 system was applied to many vehicles as well, such asHonda insight (IMA system) and Chevrolet Silverado. Hyundai andInfinite M35 adopted the P2 system. BYD developed a P3-type HEV.
Many researchers have focused on increasing fuel economy ofHEVs with a SEM. Sundström et al. performed a comparative studyof the P1 and P2 systems via Dynamic Programming (DP). Theresult concluded that the P2 has a better fuel economy [21]. Kootet al. conducted a comparative examination between the P1 andP2 systems via linear programming (LP), concluding that the P2system is advantageous [22]. In spite of these, the fact that theengine and SEM rotate on the same shaft makes the assistance ofSEM in the P2 system to the engine limited.
To further enhance fuel economy, researchers have beenrecently studying EVT systems. Such systems can better decouplethe engine and motor, and have more operating modes, leadingto higher fuel efficiency. Because of the reduced number of motors,EVT systems with a SEM exhibit lower power loss, lower produc-tion cost, and more compact architecture over EVT systems withtwo EMs. Zhu et al. presented the mathematical modeling andanalysis of a novel EVT system with a SEM for a hybrid bus [23].Simulation under the NEDC cycle showed that the fuel consump-tion of EVT system with a SEM is comparable to a benchmark vehi-cle, an EVT system with two EMs and no clutch. However, theproposed architecture by Zhu et al. used two planetary gear (PG)sets and four clutches, resulting in higher production cost and sys-tem complexity, in contrast to single-PG EVT systems with fewerclutches.
EVT systems with two EMs, e.g., Toyota Hybrid System (THS-II)and GM-Allision (AHS), generally employ two or more PG sets withhigh production cost and architecture complexity. The EVT systemwith a SEM developed in [23] still utilizes two PG sets. Zhang andLin [24] proposed an EVT systemwith a SEM and studied its perfor-mance using Simulink/Advisor platform. A significant improve-ment in fuel economy was observed in diverse cycles, comparedwith the configuration used by Toyota Prius.
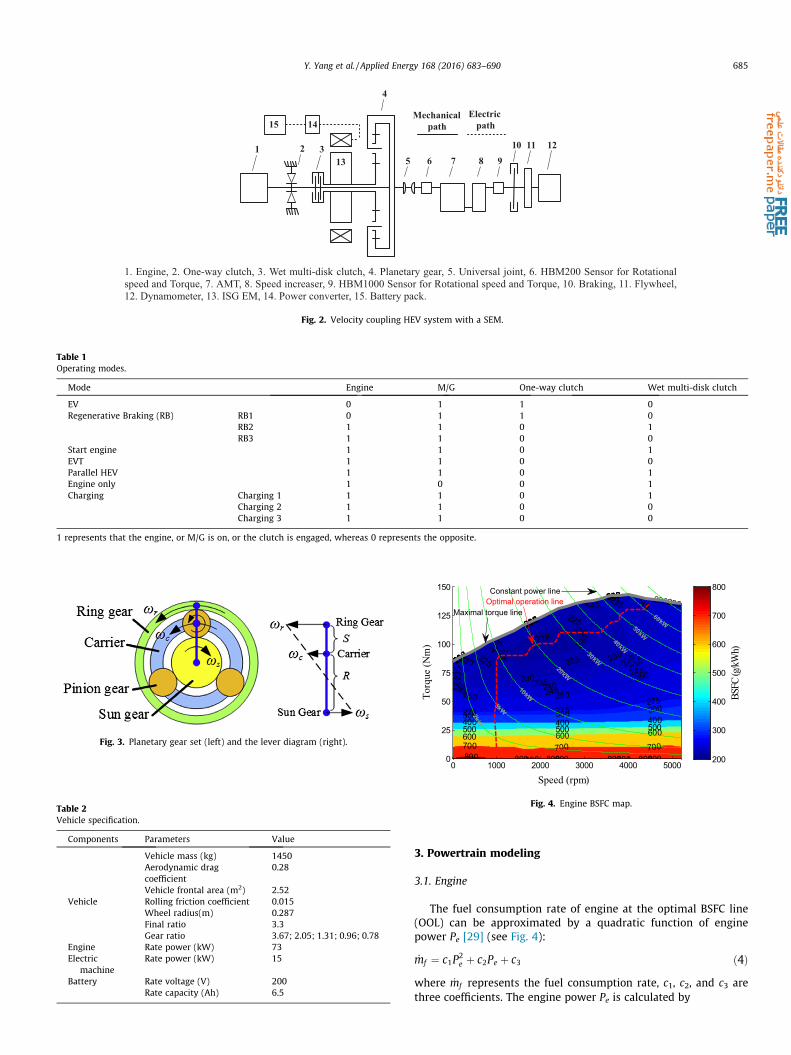
This paper deals with a velocity coupling HEV system with aSEM, as sketched in Fig. 2, which aims to assist the engine inoperating in the highest-efficiency region to maximize fuel econ-omy. Since this system merely needs a SEM, a single PG set, andtwo clutches, it is more cost-competitive and simpler than mostof the foregoing EVT systems. The devised architecture leveragestwo clutches including a one-way clutch and a wet multi-disk
P0
P1P2
P3P4
C0C1
Fig. 1. Configurations of HEVs with a SEM.
clutch. The one-way clutch can eliminate engine drag in EV modeand/or regenerative braking, which diminishes fuel consumptionand engine wear. Thanks to a PG set, this hybrid system canrealize the EVT mode, which enables the engine to operate inthe highest-efficiency region and to obtain excellent fueleconomy.
Although comparative studies between EVT systems with twoEMs and parallel HEVs were carried out [25–27], to the best ofour knowledge, there is a shortage of a comparative study betweenEVT with a SEM and parallel HEVs. The primary goal of the article isto bridge this gap. Specifically, globally DP-based optimal energymanagement strategy is exploited to compare three architectures,i.e., the proposed system, P1 system, and P2 system, in terms ofmaximum fuel-saving potential.
The remainder of the paper proceeds as follows. Section 2describes the operating modes of the proposed system and vehicleparameters. The powertrain modeling is detailed in Section 3. TheDP-based energy management problem is formulated in Section 4.Simulation results, discussion, and comparative analysis are pro-vided in Section 5. Important conclusions are ultimately summa-rized in Section 6.
2. Operating modes and vehicle parameters
The velocity coupling system with a SEM has eleven modesthrough engaging/disengaging a wet clutch and/or a one-wayclutch, as shown in Table 1.
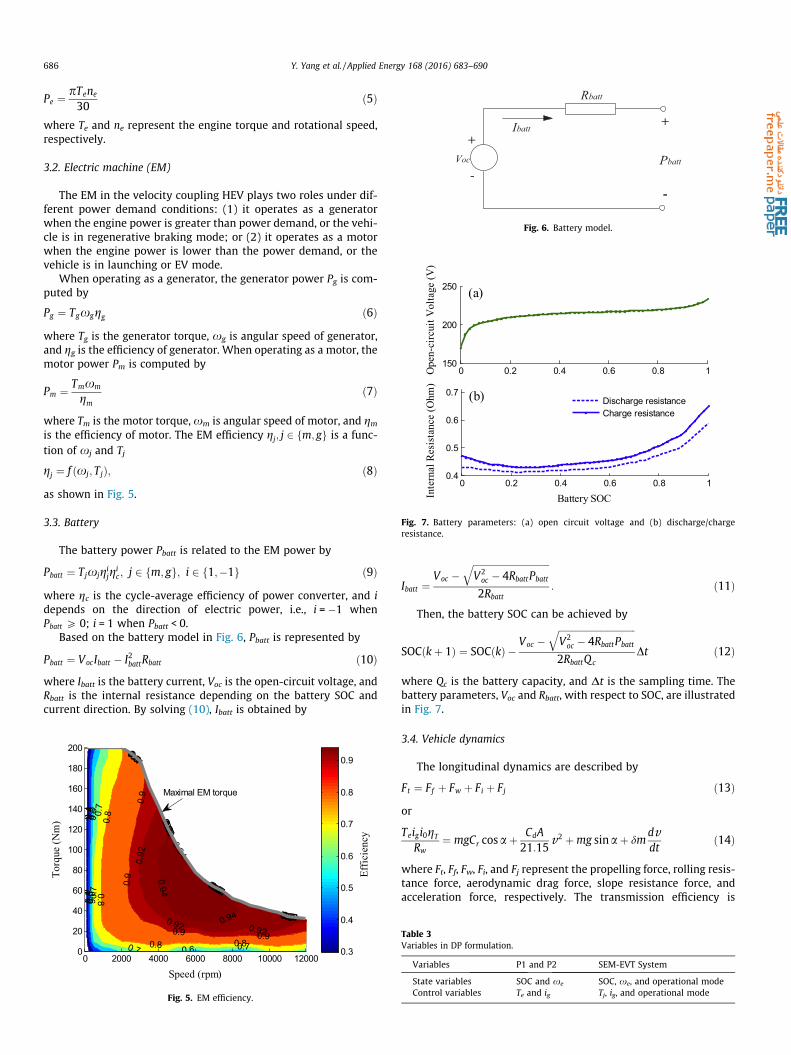
As shown in Fig. 3, the PG set consists of a sun gear, a carrier anda ring gear. According to the PG kinematic equation
Sxr þ Rxs ¼ ðRþ SÞxc; ð1Þ
when the wet clutch is engaged, all speeds of the three PG nodesbecome the same, namely,
xr ¼ xs ¼ xc: ð2ÞThen, the system operates as a parallel HEV mode. When
the wet clutch is disengaged, the system operates as an EVT mode,which is beneficial to increase the operating efficiency of engine.When operating in EV or regenerative braking, the system caneliminate engine drag by coordinated control of the one-wayclutch and the wet multi-disk clutch. As a result, the overall effi-ciency of the system can be improved. All of these constitute sali-ent advantages over P1 and P2 systems.
According to our prior effort [28], dynamic equations of the EVTmode are depicted in the matrix form by
Ie þ Ir 0 0 R
0 Ic þ R2wi2g i
2om 0 �ðRþ SÞ
0 0 Im þ Is S
R �ðRþ SÞ S 0
266666664
377777775
_xe
_xo
_xm
F
26666664
37777775¼
Te
�Tf
Tm
0
2666664
3777775
ð3Þ
where Ie, Ir, Ic, Is, and Im are inertias of the engine, ring gear, carrier,sun gear, and motor, respectively. Furthermore, ig is gear ratio, andio is final ratio. The wheel radius is denoted by Rw, m is vehiclemass, xe, xo, and xm are angular speeds of the engine, output(carrier), and motor, respectively. The internal force betweenthe pinion gears and other gears are represented by F, Te, Tf, andTm are torques of the engine, friction braking, and motor,respectively.
The main vehicle parameters are listed in Table 2, which areapplied to all the three configurations to be examined.
1 2 3
4
5 6 7 8 910 11 12
13
Mechanical path
Electric path15 14
1. Engine, 2. One-way clutch, 3. Wet multi-disk clutch, 4. Planetary gear, 5. Universal joint, 6. HBM200 Sensor for Rotational speed and Torque, 7. AMT, 8. Speed increaser, 9. HBM1000 Sensor for Rotational speed and Torque, 10. Braking, 11. Flywheel, 12. Dynamometer, 13. ISG EM, 14. Power converter, 15. Battery pack.
Fig. 2. Velocity coupling HEV system with a SEM.
Table 1Operating modes.
Mode Engine M/G One-way clutch Wet multi-disk clutch
EV 0 1 1 0Regenerative Braking (RB) RB1 0 1 1 0
RB2 1 1 0 1RB3 1 1 0 0
Start engine 1 1 0 1EVT 1 1 0 0Parallel HEV 1 1 0 1Engine only 1 0 0 1Charging Charging 1 1 1 0 1
Charging 2 1 1 0 0Charging 3 1 1 0 0
1 represents that the engine, or M/G is on, or the clutch is engaged, whereas 0 represents the opposite.
Fig. 3. Planetary gear set (left) and the lever diagram (right).
Table 2Vehicle specification.
Components Parameters Value
Vehicle mass (kg) 1450Aerodynamic dragcoefficient
0.28
Vehicle frontal area (m2) 2.52Vehicle Rolling friction coefficient 0.015
Wheel radius(m) 0.287Final ratio 3.3Gear ratio 3.67; 2.05; 1.31; 0.96; 0.78
Engine Rate power (kW) 73Electric
machineRate power (kW) 15
Battery Rate voltage (V) 200Rate capacity (Ah) 6.5
200
200
200
205
205
205
210
210
210
215
215
215
216
216
216
220
220
220
225
225
225
230
230
230
230230
235
235
235
235 235
240 240
240
240
245 245
245
250 250
250
275 275275
300 300 300400 400 400500 500 500600 600 600700 700 700
225 225
225
225
220
220
220
800 800 800800800 800 800800800
216
Speed (rpm)
Torq
ue (N
m)
2kW
5kW
10kW
20kW
30kW
40kW
50kW
60kW
BSFC
(g/kW
h)
0 1000 2000 3000 4000 50000
25
50
75
100
125
150
200
300
400
500
600
700
800
Optimal operation lineMaximal torque line
Constant power line
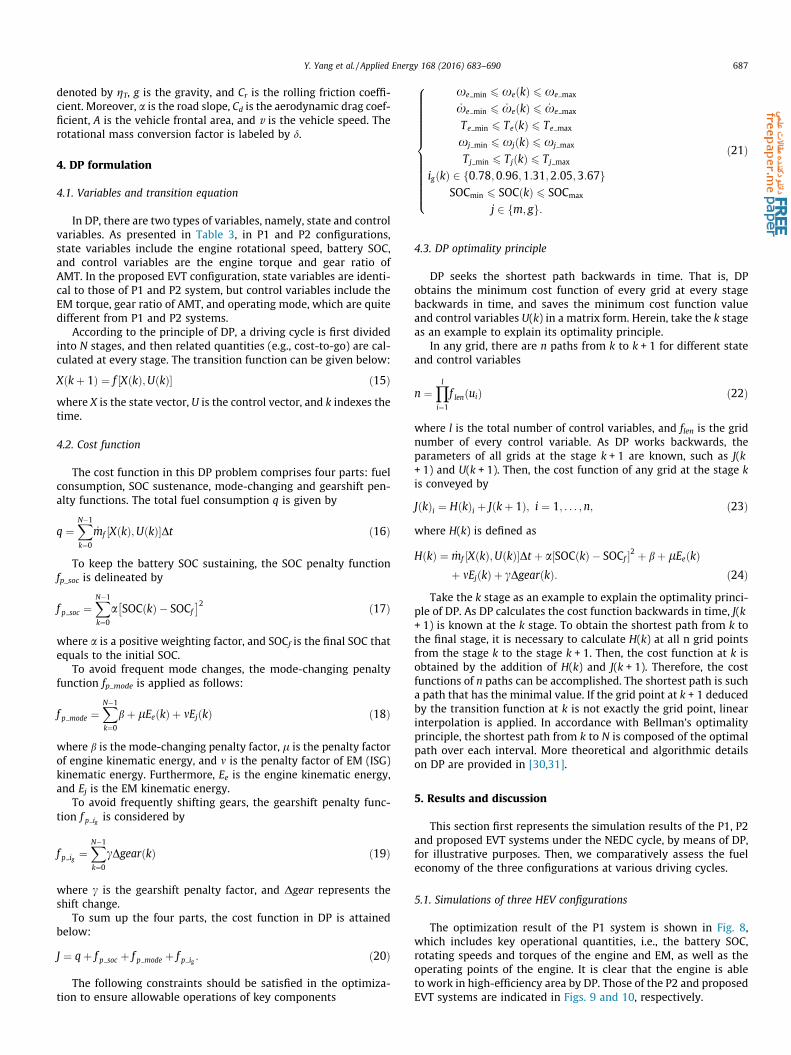
Fig. 4. Engine BSFC map.
Y. Yang et al. / Applied Energy 168 (2016) 683–690 685
3. Powertrain modeling
3.1. Engine
The fuel consumption rate of engine at the optimal BSFC line(OOL) can be approximated by a quadratic function of enginepower Pe [29] (see Fig. 4):
_mf ¼ c1P2e þ c2Pe þ c3 ð4Þ
where _mf represents the fuel consumption rate, c1, c2, and c3 arethree coefficients. The engine power Pe is calculated by
Rbatt
+
Pbatt
-
Voc
+
-
Ibatt
Fig. 6. Battery model.
0 0.2 0.4 0.6 0.8 1150
200
250
Ope
n-ci
rcui
t Vol
tage
(V)
0 0.2 0.4 0.6 0.8 10.4
0.5
0.6
0.7
Inte
rnal
Res
ista
nce
(Ohm
)
Battery SOC
Discharge resistanceCharge resistance
(a)
(b)
Fig. 7. Battery parameters: (a) open circuit voltage and (b) discharge/chargeresistance.
686 Y. Yang et al. / Applied Energy 168 (2016) 683–690
Pe ¼ pTene
30ð5Þ
where Te and ne represent the engine torque and rotational speed,respectively.
3.2. Electric machine (EM)
The EM in the velocity coupling HEV plays two roles under dif-ferent power demand conditions: (1) it operates as a generatorwhen the engine power is greater than power demand, or the vehi-cle is in regenerative braking mode; or (2) it operates as a motorwhen the engine power is lower than the power demand, or thevehicle is in launching or EV mode.
When operating as a generator, the generator power Pg is com-puted by
Pg ¼ Tgxggg ð6Þwhere Tg is the generator torque, xg is angular speed of generator,and gg is the efficiency of generator. When operating as a motor, themotor power Pm is computed by
Pm ¼ Tmxm
gmð7Þ
where Tm is the motor torque,xm is angular speed of motor, and gmis the efficiency of motor. The EM efficiency gj; j 2 fm; gg is a func-tion of xj and Tj
gj ¼ f ðxj; TjÞ; ð8Þas shown in Fig. 5.
3.3. Battery
The battery power Pbatt is related to the EM power by
Pbatt ¼ Tjxjgijg
ic; j 2 fm; gg; i 2 f1;�1g ð9Þ
where gc is the cycle-average efficiency of power converter, and idepends on the direction of electric power, i.e., i = �1 whenPbatt P 0; i = 1 when Pbatt < 0.
Based on the battery model in Fig. 6, Pbatt is represented by
Pbatt ¼ VocIbatt � I2battRbatt ð10Þwhere Ibatt is the battery current, Voc is the open-circuit voltage, andRbatt is the internal resistance depending on the battery SOC andcurrent direction. By solving (10), Ibatt is obtained by
03
0.3
0.3
0.3
0.3
0.3
0.4
0.4
0.4
0.4
0.4
0.4
0.5
0.5
0.5
0.5
0.5
0.5
0 6
0.6
0.6
0.6
0.6
0.6
0.6
0.70.7
0.7
0.7
0.7
0.7
0.7
0.7
0.80.8
0.8
0.8
0.8
0.8
0.8
0.8
0.90.9
0.9
0.9
0.9
0.9
0.90.92
0.92
0.92
0.92
0.92
0.920.94
0.940.94
Speed (rpm)
Torq
ue (N
m)
0 2000 4000 6000 8000 10000 120000
20
40
60
80
100
120
140
160
180
200
Effic
ienc
y
0.3
0.4
0.5
0.6
0.7
0.8
0.9
Maximal EM torque
Fig. 5. EM efficiency.
Ibatt ¼Voc �
ffiffiffiffiffiffiffiffiffiffiffiffiffiffiffiffiffiffiffiffiffiffiffiffiffiffiffiffiffiffiffiffiffiV2
oc � 4RbattPbatt
q
2Rbatt: ð11Þ
Then, the battery SOC can be achieved by
SOCðkþ 1Þ ¼ SOCðkÞ �Voc �
ffiffiffiffiffiffiffiffiffiffiffiffiffiffiffiffiffiffiffiffiffiffiffiffiffiffiffiffiffiffiffiffiffiV2
oc � 4RbattPbatt
q
2RbattQcDt ð12Þ
where Qc is the battery capacity, and Dt is the sampling time. Thebattery parameters, Voc and Rbatt, with respect to SOC, are illustratedin Fig. 7.
3.4. Vehicle dynamics
The longitudinal dynamics are described by
Ft ¼ Ff þ Fw þ Fi þ Fj ð13Þor
Teigi0gT
Rw¼ mgCr cosaþ CdA
21:15v2 þmg sinaþ dm
dvdt
ð14Þ
where Ft, Ff, Fw, Fi, and Fj represent the propelling force, rolling resis-tance force, aerodynamic drag force, slope resistance force, andacceleration force, respectively. The transmission efficiency is
Table 3Variables in DP formulation.
Variables P1 and P2 SEM-EVT System
State variables SOC and xe SOC, xe, and operational modeControl variables Te and ig Tj, ig, and operational mode
Y. Yang et al. / Applied Energy 168 (2016) 683–690 687
denoted by gT, g is the gravity, and Cr is the rolling friction coeffi-cient. Moreover, a is the road slope, Cd is the aerodynamic drag coef-ficient, A is the vehicle frontal area, and v is the vehicle speed. Therotational mass conversion factor is labeled by d.
4. DP formulation
4.1. Variables and transition equation
In DP, there are two types of variables, namely, state and controlvariables. As presented in Table 3, in P1 and P2 configurations,state variables include the engine rotational speed, battery SOC,and control variables are the engine torque and gear ratio ofAMT. In the proposed EVT configuration, state variables are identi-cal to those of P1 and P2 system, but control variables include theEM torque, gear ratio of AMT, and operating mode, which are quitedifferent from P1 and P2 systems.
According to the principle of DP, a driving cycle is first dividedinto N stages, and then related quantities (e.g., cost-to-go) are cal-culated at every stage. The transition function can be given below:
Xðkþ 1Þ ¼ f ½XðkÞ;UðkÞ� ð15Þwhere X is the state vector, U is the control vector, and k indexes thetime.
4.2. Cost function
The cost function in this DP problem comprises four parts: fuelconsumption, SOC sustenance, mode-changing and gearshift pen-alty functions. The total fuel consumption q is given by
q ¼XN�1
k¼0
_mf XðkÞ;UðkÞ½ �Dt ð16Þ
To keep the battery SOC sustaining, the SOC penalty functionfp_soc is delineated by
f p soc ¼XN�1
k¼0
a SOCðkÞ � SOCf
� �2 ð17Þ
where a is a positive weighting factor, and SOCf is the final SOC thatequals to the initial SOC.
To avoid frequent mode changes, the mode-changing penaltyfunction fp_mode is applied as follows:
f p mode ¼XN�1
k¼0
bþ lEeðkÞ þ mEjðkÞ ð18Þ
where b is the mode-changing penalty factor, l is the penalty factorof engine kinematic energy, and m is the penalty factor of EM (ISG)kinematic energy. Furthermore, Ee is the engine kinematic energy,and Ej is the EM kinematic energy.
To avoid frequently shifting gears, the gearshift penalty func-tion f p ig is considered by
f p ig ¼XN�1
k¼0
cDgearðkÞ ð19Þ
where c is the gearshift penalty factor, and Dgear represents theshift change.
To sum up the four parts, the cost function in DP is attainedbelow:
J ¼ qþ f p soc þ f p mode þ f p ig : ð20Þ
The following constraints should be satisfied in the optimiza-tion to ensure allowable operations of key components
xe min 6 xeðkÞ 6 xe max
_xe min 6 _xeðkÞ 6 _xe max
Te min 6 TeðkÞ 6 Te max
xj min 6 xjðkÞ 6 xj max
Tj min 6 TjðkÞ 6 Tj max
igðkÞ 2 f0:78;0:96;1:31;2:05;3:67gSOCmin 6 SOCðkÞ 6 SOCmax
j 2 fm; gg:
8>>>>>>>>>>>>><>>>>>>>>>>>>>:
ð21Þ
4.3. DP optimality principle
DP seeks the shortest path backwards in time. That is, DPobtains the minimum cost function of every grid at every stagebackwards in time, and saves the minimum cost function valueand control variables U(k) in a matrix form. Herein, take the k stageas an example to explain its optimality principle.
In any grid, there are n paths from k to k + 1 for different stateand control variables
n ¼Yl
i¼1
f lenðuiÞ ð22Þ
where l is the total number of control variables, and flen is the gridnumber of every control variable. As DP works backwards, theparameters of all grids at the stage k + 1 are known, such as J(k+ 1) and U(k + 1). Then, the cost function of any grid at the stage kis conveyed by
JðkÞi ¼ HðkÞi þ Jðkþ 1Þ; i ¼ 1; . . . ;n; ð23Þ
where H(k) is defined as
HðkÞ ¼ _mf ½XðkÞ;UðkÞ�Dt þ a½SOCðkÞ � SOCf �2 þ bþ lEeðkÞþ mEjðkÞ þ cDgearðkÞ: ð24Þ
Take the k stage as an example to explain the optimality princi-ple of DP. As DP calculates the cost function backwards in time, J(k+ 1) is known at the k stage. To obtain the shortest path from k tothe final stage, it is necessary to calculate H(k) at all n grid pointsfrom the stage k to the stage k + 1. Then, the cost function at k isobtained by the addition of H(k) and J(k + 1). Therefore, the costfunctions of n paths can be accomplished. The shortest path is sucha path that has the minimal value. If the grid point at k + 1 deducedby the transition function at k is not exactly the grid point, linearinterpolation is applied. In accordance with Bellman’s optimalityprinciple, the shortest path from k to N is composed of the optimalpath over each interval. More theoretical and algorithmic detailson DP are provided in [30,31].
5. Results and discussion
This section first represents the simulation results of the P1, P2and proposed EVT systems under the NEDC cycle, by means of DP,for illustrative purposes. Then, we comparatively assess the fueleconomy of the three configurations at various driving cycles.
5.1. Simulations of three HEV configurations
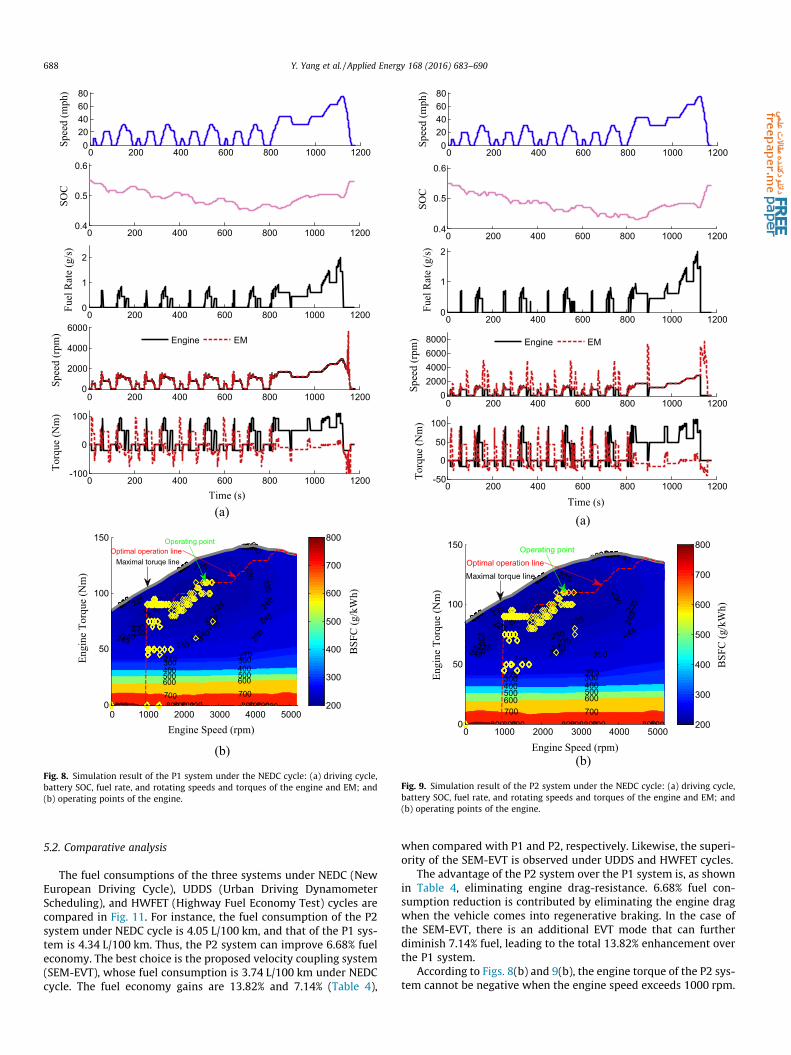
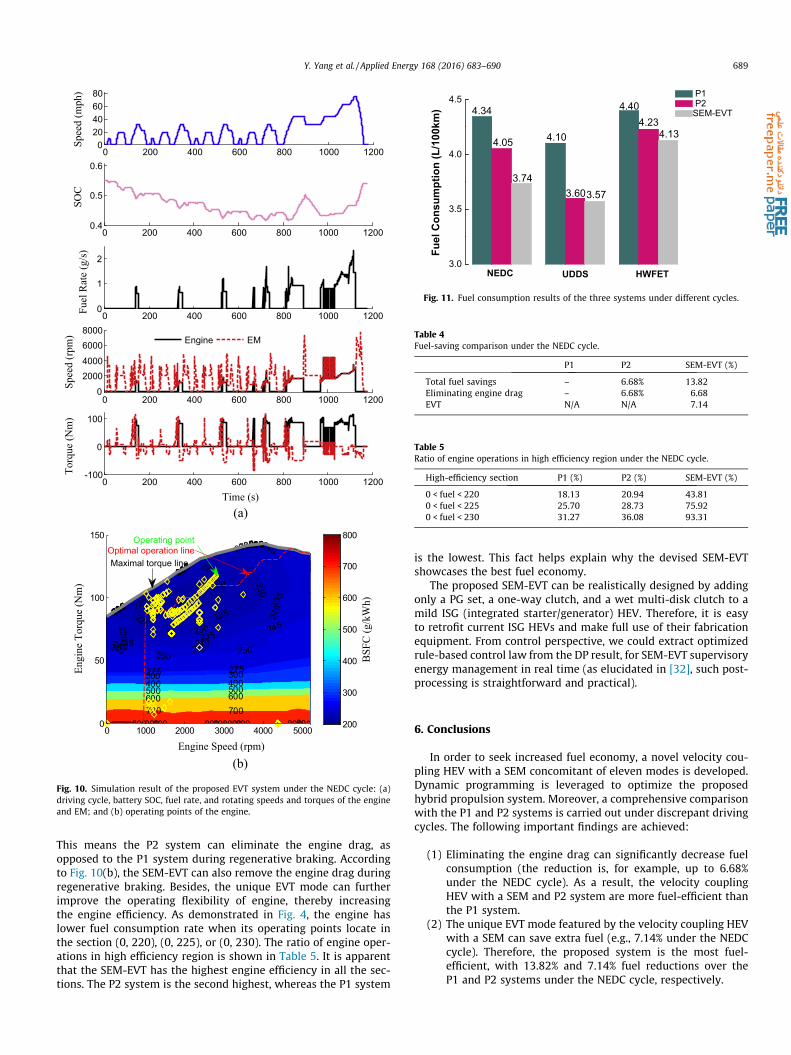
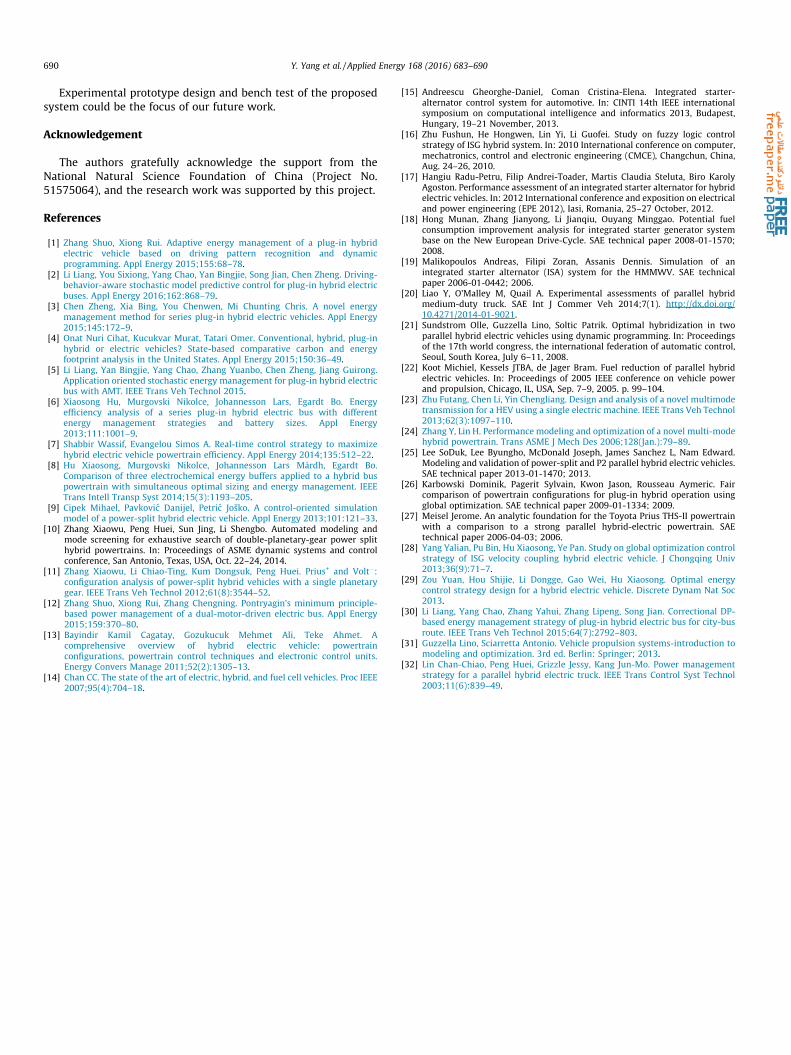
The optimization result of the P1 system is shown in Fig. 8,which includes key operational quantities, i.e., the battery SOC,rotating speeds and torques of the engine and EM, as well as theoperating points of the engine. It is clear that the engine is ableto work in high-efficiency area by DP. Those of the P2 and proposedEVT systems are indicated in Figs. 9 and 10, respectively.
0 200 400 600 800 1000 12000
20406080
Spee
d (m
ph)
0 200 400 600 800 1000 12000.4
0.5
0.6
SOC
0 200 400 600 800 1000 12000
1
2
Fuel
Rat
e (g
/s)
0 200 400 600 800 1000 12000
2000
4000
6000
Spee
d (r
pm)
0 200 400 600 800 1000 1200-100
0
100
Torq
ue (N
m)
Time (s)
Engine EM
(a)
(b)
200
200
200
205
205
205
210
210
210
215
215
215
216
216
216
220
220
220
225
225
225
230230
230230
235 235
235
235
240 240
240
240
245 245
245
250
250
275 275300 300400 400500 500600 600
700 700
225225
225
225
220
220
800 800800800800 800 800800800
216
Engine Speed (rpm)0 1000 2000 3000 4000 5000
0
50
100
150
BSF
C (g
/kW
h)
200
300
400
500
600
700
800
Maximal toruqe lineOptimal operation line
Operating point
Engi
ne T
orqu
e (N
m)
Fig. 8. Simulation result of the P1 system under the NEDC cycle: (a) driving cycle,battery SOC, fuel rate, and rotating speeds and torques of the engine and EM; and(b) operating points of the engine.
0 200 400 600 800 1000 12000
20406080
Spee
d (m
ph)
0 200 400 600 800 1000 12000.4
0.5
0.6
SOC
0 200 400 600 800 1000 12000
1
2
Fuel
Rat
e (g
/s)
0 200 400 600 800 1000 12000
2000400060008000
Spee
d (r
pm) Engine EM
0 200 400 600 800 1000 1200-50
0
50
100To
rque
(Nm
)
Time (s)
(a)
(b)
200
200
200
205
205
205
210
210
210
215
215
215
216
216
216
220
220
220
225
225
225
230 230
230
230
235 235
235
235
240 240
240
240
245 245
245
250 250
275 275300 300400 400500 500600 600700 700
225 225
225
225
220
220
800 800 800800800 800 800800800
216
0 1000 2000 3000 4000 50000
50
100
150
200
300
400
500
600
700
800Operating point
Maximal torque line
Optimal operation line
Engine Speed (rpm)
Engi
ne T
orqu
e (N
m)
BSF
C (g
/kW
h)
Fig. 9. Simulation result of the P2 system under the NEDC cycle: (a) driving cycle,battery SOC, fuel rate, and rotating speeds and torques of the engine and EM; and(b) operating points of the engine.
688 Y. Yang et al. / Applied Energy 168 (2016) 683–690
5.2. Comparative analysis
The fuel consumptions of the three systems under NEDC (NewEuropean Driving Cycle), UDDS (Urban Driving DynamometerScheduling), and HWFET (Highway Fuel Economy Test) cycles arecompared in Fig. 11. For instance, the fuel consumption of the P2system under NEDC cycle is 4.05 L/100 km, and that of the P1 sys-tem is 4.34 L/100 km. Thus, the P2 system can improve 6.68% fueleconomy. The best choice is the proposed velocity coupling system(SEM-EVT), whose fuel consumption is 3.74 L/100 km under NEDCcycle. The fuel economy gains are 13.82% and 7.14% (Table 4),
when compared with P1 and P2, respectively. Likewise, the superi-ority of the SEM-EVT is observed under UDDS and HWFET cycles.
The advantage of the P2 system over the P1 system is, as shownin Table 4, eliminating engine drag-resistance. 6.68% fuel con-sumption reduction is contributed by eliminating the engine dragwhen the vehicle comes into regenerative braking. In the case ofthe SEM-EVT, there is an additional EVT mode that can furtherdiminish 7.14% fuel, leading to the total 13.82% enhancement overthe P1 system.
According to Figs. 8(b) and 9(b), the engine torque of the P2 sys-tem cannot be negative when the engine speed exceeds 1000 rpm.
0 200 400 600 800 1000 12000
20406080
Spee
d (m
ph)
0 200 400 600 800 1000 12000.4
0.5
0.6
SOC
0 200 400 600 800 1000 12000
1
2
Fuel
Rat
e (g
/s)
0 200 400 600 800 1000 12000
20004000
60008000
Spee
d (r
pm) Engine EM
0 200 400 600 800 1000 1200-100
0
100
Torq
ue (N
m)
Time (s)(a)
(b)
200
200
200
205
205
205
210
210
210
215
215
215
216
216
216
220
220
220
225
225
225
230 230
230
230
235 235
235
235
240 240
240
240
245 245
245
250 250
275 275300 300400 400500 500600 600700 700
225 225
225
225
220
220
800 800 800800800 800 800800800
216
0 1000 2000 3000 4000 50000
50
100
150
200
300
400
500
600
700
800
Optimal operation lineOperating point
Maximal torque line
Engine Speed (rpm)
Engi
ne T
orqu
e (N
m)
BSF
C (g
/kW
h)
Fig. 10. Simulation result of the proposed EVT system under the NEDC cycle: (a)driving cycle, battery SOC, fuel rate, and rotating speeds and torques of the engineand EM; and (b) operating points of the engine.
3.0
3.5
4.0
4.5
Fuel
Con
sum
ptio
n (L
/100
km)
P1 P2SEM-EVT
NEDC UDDS HWFET
4.34
4.05
3.74
4.10
3.603.57
4.404.23
4.13
Fig. 11. Fuel consumption results of the three systems under different cycles.
Table 4Fuel-saving comparison under the NEDC cycle.
P1 P2 SEM-EVT (%)
Total fuel savings – 6.68% 13.82Eliminating engine drag – 6.68% 6.68EVT N/A N/A 7.14
Table 5Ratio of engine operations in high efficiency region under the NEDC cycle.
High-efficiency section P1 (%) P2 (%) SEM-EVT (%)
0 < fuel < 220 18.13 20.94 43.810 < fuel < 225 25.70 28.73 75.920 < fuel < 230 31.27 36.08 93.31
Y. Yang et al. / Applied Energy 168 (2016) 683–690 689
This means the P2 system can eliminate the engine drag, asopposed to the P1 system during regenerative braking. Accordingto Fig. 10(b), the SEM-EVT can also remove the engine drag duringregenerative braking. Besides, the unique EVT mode can furtherimprove the operating flexibility of engine, thereby increasingthe engine efficiency. As demonstrated in Fig. 4, the engine haslower fuel consumption rate when its operating points locate inthe section (0, 220), (0, 225), or (0, 230). The ratio of engine oper-ations in high efficiency region is shown in Table 5. It is apparentthat the SEM-EVT has the highest engine efficiency in all the sec-tions. The P2 system is the second highest, whereas the P1 system
is the lowest. This fact helps explain why the devised SEM-EVTshowcases the best fuel economy.
The proposed SEM-EVT can be realistically designed by addingonly a PG set, a one-way clutch, and a wet multi-disk clutch to amild ISG (integrated starter/generator) HEV. Therefore, it is easyto retrofit current ISG HEVs and make full use of their fabricationequipment. From control perspective, we could extract optimizedrule-based control law from the DP result, for SEM-EVT supervisoryenergy management in real time (as elucidated in [32], such post-processing is straightforward and practical).
6. Conclusions
In order to seek increased fuel economy, a novel velocity cou-pling HEV with a SEM concomitant of eleven modes is developed.Dynamic programming is leveraged to optimize the proposedhybrid propulsion system. Moreover, a comprehensive comparisonwith the P1 and P2 systems is carried out under discrepant drivingcycles. The following important findings are achieved:
(1) Eliminating the engine drag can significantly decrease fuelconsumption (the reduction is, for example, up to 6.68%under the NEDC cycle). As a result, the velocity couplingHEV with a SEM and P2 system are more fuel-efficient thanthe P1 system.
(2) The unique EVT mode featured by the velocity coupling HEVwith a SEM can save extra fuel (e.g., 7.14% under the NEDCcycle). Therefore, the proposed system is the most fuel-efficient, with 13.82% and 7.14% fuel reductions over theP1 and P2 systems under the NEDC cycle, respectively.
690 Y. Yang et al. / Applied Energy 168 (2016) 683–690
Experimental prototype design and bench test of the proposedsystem could be the focus of our future work.
Acknowledgement
The authors gratefully acknowledge the support from theNational Natural Science Foundation of China (Project No.51575064), and the research work was supported by this project.
References
[1] Zhang Shuo, Xiong Rui. Adaptive energy management of a plug-in hybridelectric vehicle based on driving pattern recognition and dynamicprogramming. Appl Energy 2015;155:68–78.
[2] Li Liang, You Sixiong, Yang Chao, Yan Bingjie, Song Jian, Chen Zheng. Driving-behavior-aware stochastic model predictive control for plug-in hybrid electricbuses. Appl Energy 2016;162:868–79.
[3] Chen Zheng, Xia Bing, You Chenwen, Mi Chunting Chris. A novel energymanagement method for series plug-in hybrid electric vehicles. Appl Energy2015;145:172–9.
[4] Onat Nuri Cihat, Kucukvar Murat, Tatari Omer. Conventional, hybrid, plug-inhybrid or electric vehicles? State-based comparative carbon and energyfootprint analysis in the United States. Appl Energy 2015;150:36–49.
[5] Li Liang, Yan Bingjie, Yang Chao, Zhang Yuanbo, Chen Zheng, Jiang Guirong.Application oriented stochastic energy management for plug-in hybrid electricbus with AMT. IEEE Trans Veh Technol 2015.
[6] Xiaosong Hu, Murgovski Nikolce, Johannesson Lars, Egardt Bo. Energyefficiency analysis of a series plug-in hybrid electric bus with differentenergy management strategies and battery sizes. Appl Energy2013;111:1001–9.
[7] Shabbir Wassif, Evangelou Simos A. Real-time control strategy to maximizehybrid electric vehicle powertrain efficiency. Appl Energy 2014;135:512–22.
[8] Hu Xiaosong, Murgovski Nikolce, Johannesson Lars Mårdh, Egardt Bo.Comparison of three electrochemical energy buffers applied to a hybrid buspowertrain with simultaneous optimal sizing and energy management. IEEETrans Intell Transp Syst 2014;15(3):1193–205.
[9] Cipek Mihael, Pavkovic Danijel, Petric Joško. A control-oriented simulationmodel of a power-split hybrid electric vehicle. Appl Energy 2013;101:121–33.
[10] Zhang Xiaowu, Peng Huei, Sun Jing, Li Shengbo. Automated modeling andmode screening for exhaustive search of double-planetary-gear power splithybrid powertrains. In: Proceedings of ASME dynamic systems and controlconference, San Antonio, Texas, USA, Oct. 22–24, 2014.
[11] Zhang Xiaowu, Li Chiao-Ting, Kum Dongsuk, Peng Huei. Prius+ and Volt�:configuration analysis of power-split hybrid vehicles with a single planetarygear. IEEE Trans Veh Technol 2012;61(8):3544–52.
[12] Zhang Shuo, Xiong Rui, Zhang Chengning. Pontryagin’s minimum principle-based power management of a dual-motor-driven electric bus. Appl Energy2015;159:370–80.
[13] Bayindir Kamil Cagatay, Gozukucuk Mehmet Ali, Teke Ahmet. Acomprehensive overview of hybrid electric vehicle: powertrainconfigurations, powertrain control techniques and electronic control units.Energy Convers Manage 2011;52(2):1305–13.
[14] Chan CC. The state of the art of electric, hybrid, and fuel cell vehicles. Proc IEEE2007;95(4):704–18.
[15] Andreescu Gheorghe-Daniel, Coman Cristina-Elena. Integrated starter-alternator control system for automotive. In: CINTI 14th IEEE internationalsymposium on computational intelligence and informatics 2013, Budapest,Hungary, 19–21 November, 2013.
[16] Zhu Fushun, He Hongwen, Lin Yi, Li Guofei. Study on fuzzy logic controlstrategy of ISG hybrid system. In: 2010 International conference on computer,mechatronics, control and electronic engineering (CMCE), Changchun, China,Aug. 24–26, 2010.
[17] Hangiu Radu-Petru, Filip Andrei-Toader, Martis Claudia Steluta, Biro KarolyAgoston. Performance assessment of an integrated starter alternator for hybridelectric vehicles. In: 2012 International conference and exposition on electricaland power engineering (EPE 2012), Iasi, Romania, 25–27 October, 2012.
[18] Hong Munan, Zhang Jianyong, Li Jianqiu, Ouyang Minggao. Potential fuelconsumption improvement analysis for integrated starter generator systembase on the New European Drive-Cycle. SAE technical paper 2008-01-1570;2008.
[19] Malikopoulos Andreas, Filipi Zoran, Assanis Dennis. Simulation of anintegrated starter alternator (ISA) system for the HMMWV. SAE technicalpaper 2006-01-0442; 2006.
[20] Liao Y, O’Malley M, Quail A. Experimental assessments of parallel hybridmedium-duty truck. SAE Int J Commer Veh 2014;7(1). http://dx.doi.org/10.4271/2014-01-9021.
[21] Sundstrom Olle, Guzzella Lino, Soltic Patrik. Optimal hybridization in twoparallel hybrid electric vehicles using dynamic programming. In: Proceedingsof the 17th world congress, the international federation of automatic control,Seoul, South Korea, July 6–11, 2008.
[22] Koot Michiel, Kessels JTBA, de Jager Bram. Fuel reduction of parallel hybridelectric vehicles. In: Proceedings of 2005 IEEE conference on vehicle powerand propulsion, Chicago, IL, USA, Sep. 7–9, 2005. p. 99–104.
[23] Zhu Futang, Chen Li, Yin Chengliang. Design and analysis of a novel multimodetransmission for a HEV using a single electric machine. IEEE Trans Veh Technol2013;62(3):1097–110.
[24] Zhang Y, Lin H. Performance modeling and optimization of a novel multi-modehybrid powertrain. Trans ASME J Mech Des 2006;128(Jan.):79–89.
[25] Lee SoDuk, Lee Byungho, McDonald Joseph, James Sanchez L, Nam Edward.Modeling and validation of power-split and P2 parallel hybrid electric vehicles.SAE technical paper 2013-01-1470; 2013.
[26] Karbowski Dominik, Pagerit Sylvain, Kwon Jason, Rousseau Aymeric. Faircomparison of powertrain configurations for plug-in hybrid operation usingglobal optimization. SAE technical paper 2009-01-1334; 2009.
[27] Meisel Jerome. An analytic foundation for the Toyota Prius THS-II powertrainwith a comparison to a strong parallel hybrid-electric powertrain. SAEtechnical paper 2006-04-03; 2006.
[28] Yang Yalian, Pu Bin, Hu Xiaosong, Ye Pan. Study on global optimization controlstrategy of ISG velocity coupling hybrid electric vehicle. J Chongqing Univ2013;36(9):71–7.
[29] Zou Yuan, Hou Shijie, Li Dongge, Gao Wei, Hu Xiaosong. Optimal energycontrol strategy design for a hybrid electric vehicle. Discrete Dynam Nat Soc2013.
[30] Li Liang, Yang Chao, Zhang Yahui, Zhang Lipeng, Song Jian. Correctional DP-based energy management strategy of plug-in hybrid electric bus for city-busroute. IEEE Trans Veh Technol 2015;64(7):2792–803.
[31] Guzzella Lino, Sciarretta Antonio. Vehicle propulsion systems-introduction tomodeling and optimization. 3rd ed. Berlin: Springer; 2013.
[32] Lin Chan-Chiao, Peng Huei, Grizzle Jessy, Kang Jun-Mo. Power managementstrategy for a parallel hybrid electric truck. IEEE Trans Control Syst Technol2003;11(6):839–49.