COMPARISON OF POST-TENSIONED CAST IN PLACE …
187
COMPARISON OF POST-TENSIONED CAST IN PLACE CONCRETE AND STEEL-CONCRETE COMPOSITE BENT CAPS by FRANCISCO DAVID BERROCAL RUIZ Presented to the Faculty of the Graduate School of The University of Texas at Arlington in Partial Fulfillment of the Requirements for the Degree of MASTER OF SCIENCE IN CIVIL ENGINEERING THE UNIVERSITY OF TEXAS AT ARLINGTON December 2015
Transcript of COMPARISON OF POST-TENSIONED CAST IN PLACE …

COMPARISON OF POST-TENSIONED CAST IN PLACE
CONCRETE AND STEEL-CONCRETE
COMPOSITE BENT CAPS
by
FRANCISCO DAVID BERROCAL RUIZ
Presented to the Faculty of the Graduate School of
The University of Texas at Arlington in Partial Fulfillment
of the Requirements
for the Degree of
MASTER OF SCIENCE IN CIVIL ENGINEERING
THE UNIVERSITY OF TEXAS AT ARLINGTON
December 2015

ii
Copyright © by Francisco David Berrocal Ruiz 2015
All Rights Reserved

iii
Acknowledgements
I would like to sincerely thank Dr. Nur Yazdani for his continuous support and
guidance during the completion of my M.S. program at The University of Texas at
Arlington, for his patience, motivation, and immense knowledge. Attending his
extraordinary courses has been an honor, and his motivation helped me to succeed in
the completion of my degree.
My most sincere and deepest gratitude are extended to Dr. Seyedali Abolmaali
and Dr. Seyed Mohammad Razavi for willingly accepting my invitation to be part of my
thesis committee, as well as for the outstanding courses I had the honor to attend.
I would like also to extend my gratitude to the Civil Engineering staff. Although
dealing with international students is not always easy, I have always been received with a
smile.
I am deeply grateful to my Company, Ferrovial-Agroman, for giving me the
opportunity to work in an exciting project, for their support during the completion of my
M.S. program, and for their commitment with the training and education of their
employees. My special gratitude to Carlos Fernandez Lillo for giving me the opportunity
of taking my M.S degree, and to Leonardo Le for his help and support in the development
of this research work.
Thanks to my parents, for their constant support and motivation to become a
better person, for their understanding and guidance, for their unwavering love and
encouragement to overcome the life challenges. My gratitude is extended to my brothers,
for their unconditional love and support.

iv
Finally, the last but not the least. I extend my deepest gratitude to my loving wife,
Maria Angeles, for her unconditional love and motivation, for her patience and endless
support during long hours of study with her by my side, for her confidence and
encouragement.
August 12, 2015

v
Abstract
COMPARISON OF POST-TENSIONED CAST IN PLACE
CONCRETE AND STEEL-CONCRETE
COMPOSITE BENT CAPS
FRANCISCO DAVID BERROCAL RUIZ
The University of Texas at Arlington, 2015
Supervising Professor: Nur Yazdani
Civil engineering projects are conditioned not only by the technology available
but also by resources availability as well as budget and construction time. Special
conditions applicable to particular projects can also control their development.
The correct selection from the different feasible alternatives can determine the
final output of a project. In that sense, the importance of bridge structures on both the
overall budget and schedule of civil engineering projects makes the selection of the
proper structural typology decisive for their success or failure. In some cases, special
characteristics can establish the need of innovative solutions to guarantee a successful
development of the project.
The evolution of the urban areas and consequently the increase in their
population, translates into increasing traffic volumes that, eventually, may overcome the
existing transportation infrastructures capacity. The construction of new projects to
increase the capacity of the transportation system in consolidated urban areas generates
conflicts with existing infrastructures that may require the development of new
construction processes, techniques and structural typologies to limit the impact on the
traffic.

vi
The complexity of the IH-635 Managed Lanes Project located in Dallas County
has posed several technical and constructive challenges, leading to the adoption of
solutions different from the traditionally adopted. The particular solution given to the
substructure of Bridge 4 crossing over IH-35E on the IH-635 project has been analyzed
on this study. Two alternatives will be analyzed in terms of structural behavior, cost-
efficiency and schedule: the original cast in place post-tensioned concrete structure and
the finally built steel-concrete composite prefabricated bent cap solution.

vii
Table of Contents
Acknowledgements ............................................................................................................. iii
Abstract ............................................................................................................................... v
List of Illustrations ............................................................................................................... x
List of Tables .....................................................................................................................xiv
Chapter 1 INTRODUCTION ................................................................................................ 1
1.1 Introduction ............................................................................................................... 1
1.2 Project Background .................................................................................................. 1
1.3 Need Statement ........................................................................................................ 5
1.4 Research Objectives ................................................................................................ 6
1.5 Thesis Organization .................................................................................................. 7
Chapter 2 BACKGROUND AND LITERATURE REVIEW .................................................. 9
2.1 Historical Introduction ............................................................................................... 9
2.2 Structural Background ............................................................................................ 11
2.2.1 Introduction ...................................................................................................... 11
2.2.2 Hammerhead Pier ........................................................................................... 13
2.2.3 Bent Pier .......................................................................................................... 15
2.2.4 Solid Wall Pier ................................................................................................. 16
2.2.5 Integral Pier ..................................................................................................... 17
2.2.6 Proposed Pier Typologies ............................................................................... 18
2.3 Cost Estimation Background .................................................................................. 20
2.4 Scheduling Background .......................................................................................... 22
2.5 Case of Study Background ..................................................................................... 24
Chapter 3 FINITE ELEMENT MODELLING ...................................................................... 33
3.1 Materials ................................................................................................................. 33
viii
3.1.1 Concrete .......................................................................................................... 33
3.1.2 Reinforcing Steel ............................................................................................. 46
3.1.3 Prestressing Steel ........................................................................................... 48
3.1.4 Structural Steel ................................................................................................ 51
3.2 Loads ...................................................................................................................... 53
3.3 Boundary Conditions .............................................................................................. 54
3.4 Post-Tensioned Concrete Cap Model .................................................................... 55
3.4.1 Introduction ...................................................................................................... 55
3.4.2 Prestressing Force .......................................................................................... 61
3.4.2.1 Prestress Loss ......................................................................................... 61
3.4.2.2 Load-Balancing Force .............................................................................. 69
3.3.3 Element Types ................................................................................................. 71
3.3.4 Mesh Generation ............................................................................................. 73
3.3.5 FEM validation ................................................................................................. 75
3.4 Steel-Concrete Composite Cap Model ................................................................... 78
3.4.1 Introduction ...................................................................................................... 78
3.4.2 Element Types ................................................................................................. 83
3.4.3 Mesh Generation ............................................................................................. 84
3.4.4 FEM Validation ................................................................................................ 86
Chapter 4 COST ESTIMATE AND SCHEDULE ............................................................... 90
4.1. Materials and Activities Identified .......................................................................... 90
4.1.1 Post-Tensioned Bent Cap ............................................................................... 90
4.2.2 Composite Bent Cap ....................................................................................... 92
4.2. Unit Costs and Cost Estimate ................................................................................ 95
4.3 Activities Duration ................................................................................................... 97

ix
Chapter 5 SUMMARY AND RESULTS DISCUSSION ................................................... 101
5.1 Summary .............................................................................................................. 101
5.2 FEM Modelling and Results .................................................................................. 104
5.3 Cost and Schedule Comparison ........................................................................... 108
Chapter 6 CONCLUSIONS AND RECOMMENDATIONS FOR FUTURE
RESEARCH .................................................................................................................... 111
6.1 Conclusions .......................................................................................................... 111
6.2 Recommendations for Future Research .............................................................. 112
Appendix A Bridge 4 Drawings ....................................................................................... 117
Appendix B Load Calculations ........................................................................................ 134
Appendix C Prestress Loss Calculations ........................................................................ 149
Appendix D Post-Tensioned Concrete Cap Model. Validation Calculations .................. 154
Appendix E Steel-Concrete Composite Cap Model. Validation Calculations ................. 159
Appendix F Cost Estimation ............................................................................................ 164
References ...................................................................................................................... 167
Biographical Information ................................................................................................. 173

x
List of Illustrations
Figure 1-1 Project Location ................................................................................................. 2
Figure 1-2 Bridge 4 Location ............................................................................................... 3
Figure 1-3 Bridge 4 Crossing over IH-35E .......................................................................... 4
Figure 1-4 Bridge 4 Typical Section .................................................................................... 5
Figure 2-1 The Alcantara Bridge (Spain) .......................................................................... 10
Figure 2-2 a) Balanced Hammerhead Pier b) Unbalanced Hammerhead Pier ................ 14
Figure 2-3 a) Rectangular Bent Pier b) Inverted T Bent Pier ............................................ 15
Figure 2-4 Solid Wall Pier ................................................................................................. 17
Figure 2-5 Integral Steel Pier Cap .................................................................................... 18
Figure 2-6 Gantt Chart Example (Newitt, 2009) ............................................................... 23
Figure 2-7 Network Schedule (Hutchings, 2004) .............................................................. 24
Figure 2-8 Bridge 4 Location Before Construction ............................................................ 26
Figure 2-9 Bridge 4 Plan View .......................................................................................... 27
Figure 2-10 Composite Bent Cap Lifting Operation .......................................................... 28
Figure 2-11 Bent Caps 7, 8 and 9 in Place ....................................................................... 28
Figure 2-12 Bridge 4 Construction. Girders in Place ........................................................ 30
Figure 2-13 Bridge 4 Finished and in Service ................................................................... 32
Figure 3-1 Typical Stress-Strain Curves for Concrete in Compression (Wight &
MacGregor, 2012) ............................................................................................................. 36
Figure 3-2 Compressive stress-strain curve adopted for modelling concrete with Abaqus
(Wahalathantri, Thambiratnam, Chan, & Fawzia, 2011) ................................................... 37
Figure 3-3 Modified Tension Stiffening Model for Abaqus (Wahalathantri, Thambiratnam,
Chan, & Fawzia, 2011) ...................................................................................................... 39

xi
Figure 3-4 Definition of Inelastic Strain, Plastic Strain and Damage Parameter for (Cyclic)
Compression Loading (Birtel & Mark, 2006) ..................................................................... 40
Figure 3-5 Definition of Cracking Strain, Plastic Strain and Damage Parameter for
(Cyclic) Tensile Loading (Birtel & Mark, 2006) ................................................................. 40
Figure 3-6 Stress-Strain Curve. Concrete Under Uniaxial Compression ......................... 43
Figure 3-7 Damage Parameter. Concrete Under Compression ....................................... 43
Figure 3-8 Stress-Strain Curve. Concrete Under Uniaxial Tension .................................. 45
Figure 3-9 Damage Parameter. Concrete Under Tension ................................................ 45
Figure 3-10 Typical Stress-Strain Curves for Reinforcing Steel (Nilson, Darwin, & Dolan,
2004) ................................................................................................................................. 46
Figure 3-11 Grade 60 Reinforcing Steel. Stress-Strain Curve.......................................... 47
Figure 3-12 Typical Stress-Strain Curves for Prestressing Steel (Naaman, 2012) .......... 48
Figure 3-13 Typical Determination of Yield Strength for Prestressing Steel (Naaman,
2012) ................................................................................................................................. 49
Figure 3-14 Grade 270 Low Relaxation Prestressing Steel. Stress-Strain Curve ........... 50
Figure 3-15 Typical Stress-Strain Curves Structural Steel ............................................... 51
Figure 3-16 Grade 50 Structural Steel. Stress-Strain Curve ............................................ 52
Figure 3-17 Live Load Model ............................................................................................ 53
Figure 3-18 Boundary Conditions ..................................................................................... 55
Figure 3-19 Plan View Geometry of Post-Tensioned Concrete Cap ................................ 57
Figure 3-20 Tendons Profiles ............................................................................................ 57
Figure 3-21 Prestressed Concrete Cap Typical Section ................................................... 58
Figure 3-22 Concrete Cap Part in Abaqus Model ............................................................. 59
Figure 3-23 Reinforcement Parts in Abaqus Model .......................................................... 60
Figure 3-24 Prestress Loss per Tendon. Creep Loss ∆fpS(C) .......................................... 66

xii
Figure 3-25 Prestress Loss per Tendon. Shrinkage Loss ∆fpS(SH) .................................. 68
Figure 3-26 Prestress Loss per Tendon. Steel Relaxation Loss ∆fpS(RL) ........................ 69
Figure 3-27 Load Balancing Force. Draped Tendons ....................................................... 70
Figure 3-28 Parabolic Tendon Free Body Diagram .......................................................... 70
Figure 3-29 Abaqus Naming Convention for Truss Elements .......................................... 72
Figure 3-30 Abaqus 2 Nodes 3D Truss Element T3D2 .................................................... 72
Figure 3-31 Abaqus Naming Convention for Continuum Elements .................................. 73
Figure 3-32 Abaqus 4 Nodes 3D Tetrahedral Element C3D4 .......................................... 73
Figure 3-33 Post-Tensioned Cap Model. Number of Nodes vs. Mesh Size ..................... 74
Figure 3-34 Post-Tensioned Cap Model.5 Inches (127 mm) Mesh Size Detail ................ 75
Figure 3-35 Post-Tensioned Cap. Bending Stresses (psi) Distribution. 5 Inches (127 mm)
Mesh Model ....................................................................................................................... 76
Figure 3-36 Plan View Geometry of Steel-Concrete Composite Cap ............................... 79
Figure 3-37 Composite Cap Typical Section .................................................................... 79
Figure 3-38 Concrete Slab Part in Abaqus Model ............................................................ 80
Figure 3-39 Reinforcement Parts in Concrete Slab .......................................................... 81
Figure 3-40 Steel Cap Part in Abaqus Model ................................................................... 82
Figure 3-41 Stiffeners and Diaphragms Parts in Abaqus Model ...................................... 83
Figure 3-42 Abaqus Naming Convention for Conventional Shell Elements .................... 84
Figure 3-43 Abaqus 3 Nodes 3D Conventional Shell Element S3 ................................... 84
Figure 3-44 Composite Cap Model. Number of Nodes vs. Mesh Size ............................. 85
Figure 3-45 Composite Cap Model. 3 Inches (76.2 mm) Mesh Detail .............................. 86
Figure 3-46 Bending Stresses (psi) Distribution in Concrete Slab. 3 Inches (76.2 mm)
Mesh Model ....................................................................................................................... 87

xiii
Figure 3-47 Bending Stresses (psi) Distribution in Steel Section. 3 Inches (76.2 mm)
Mesh Model ....................................................................................................................... 87
Figure 4-1 Composite Bent Cap Ready to be Placed ....................................................... 94
Figure 4-2 Lifting of Composite Bent Cap ......................................................................... 95
Figure 4-3 Post-Tensioned Bent Cap Construction Schedule .......................................... 99
Figure 4-4 Composite Bent Cap Construction Schedule .................................................. 99
Figure 5-1 Post-Tensioned Cap Model. Deflections (inches) ......................................... 107
Figure 5-2 Composite Cap Model. Deflections (inches) ................................................. 107
Figure 6-1 Post-Tensioned Cap. End and Support Detail .............................................. 114
Figure 6-2 Post-Tensioned Cap. Detail A ....................................................................... 114
Figure 6-3 Post-Tensioned Cap. Transverse Section at Support ................................... 115

xiv
List of Tables
Table 2-1 Bridge Classification Based on Slab Position and Structural Form. (Barker &
Puckett, 2013) ................................................................................................................... 12
Table 3-1 Default Parameters of CDP Model under Compound Stress ........................... 35
Table 3-2 Concrete Compressive Behavior Model ........................................................... 42
Table 3-3 Concrete Tensile Behavior Model..................................................................... 44
Table 3-4 Summary of Girder Reactions at Support ......................................................... 54
Table 3-5 Tendons Elevations .......................................................................................... 58
Table 3-6 Post-Tensioned Cap Model. Mesh Characteristics .......................................... 74
Table 3-7 Post-tensioned Concrete Cap Model. Validation Analysis. US Units ............... 77
Table 3-8 Post-Tensioned Concrete Cap Model. Validation Analysis. SI Units ............... 77
Table 3-9 Composite Bent Cap Model. Mesh Characteristics .......................................... 85
Table 3-10 Composite Cap Model. Validation Analysis. US Units ................................... 88
Table 3-11 Composite Cap Model. Validation Analysis. SI Units ..................................... 89

1
Chapter 1
INTRODUCTION
1.1 Introduction
The construction market has dramatically changed during the last decades.
Construction companies from all around the world have internationalized their operations,
looking for new growing opportunities abroad in markets with an increasing
competitiveness. In that sense, it is extremely important for the projects main contractors
and developing agencies to accurately determine, from the set of feasible engineering
alternatives, the one that better guarantee the successful development of the projects.
An aspect of large transportation projects stands out from the rest of them for its
remarkable influence in the overall result of the project: bridge structures. Bridges
construction can determine whether a project is successfully developed or not because of
the amount of resources and time needed in their construction. Also, the need of
increasing the capacity of existing transportation infrastructures in already consolidated
urban areas, where maintaining a minimum service level for the traffic during the
construction of the project is key to keep the normal daily activity, has posed other
challenges for the structural engineer.
1.2 Project Background
The IH-635 Managed Lanes Project is located in North Dallas (Texas) and
comprises works on both IH-35 and IH-635 freeways. Started in early 2011, it is expected
to be completed and opened to public on summer 2015. After its completion, it will

2
dramatically increase the traffic capacity of this important east-west corridor in Dallas. It
will consist of four to six general purpose lanes per bound, two managed lanes per
bound, and two to three frontage road lanes per bound.
Figure 1-1 Project Location
The IH-35 IH-635 interchange became one of the major landmarks of the project
because of its complexity and extensive use of structures. A new Loop 12-IH 635 WB
3
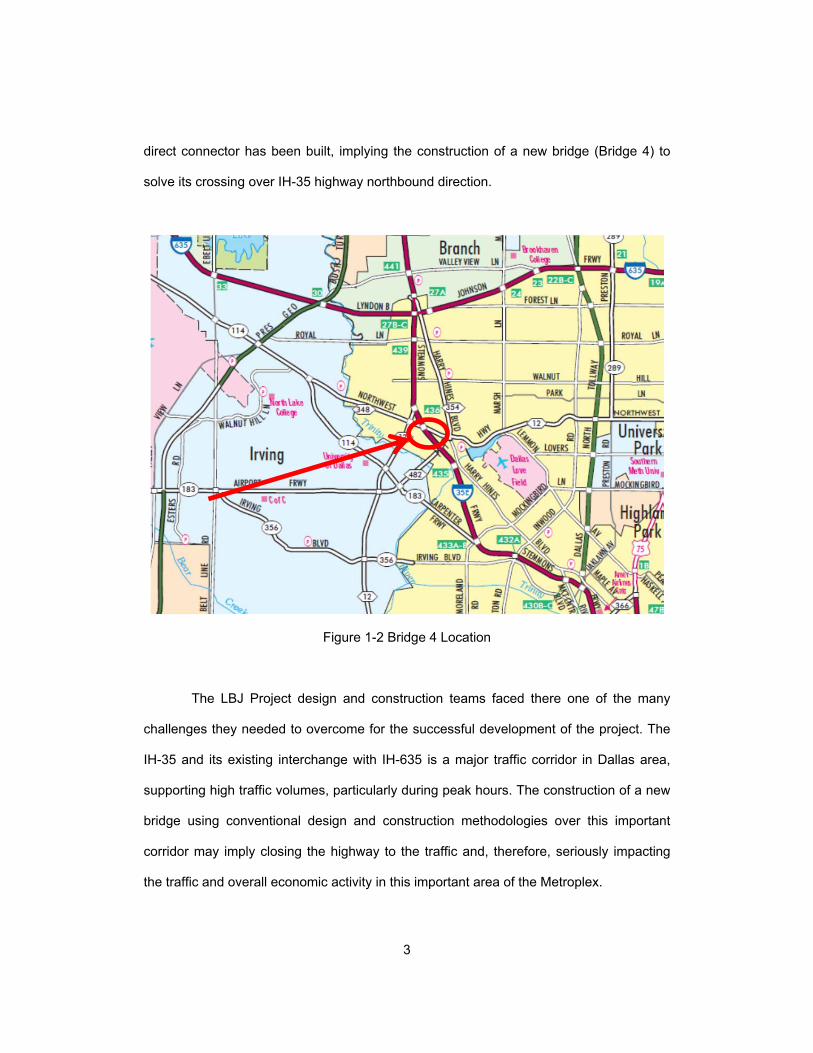
direct connector has been built, implying the construction of a new bridge (Bridge 4) to
solve its crossing over IH-35 highway northbound direction.
Figure 1-2 Bridge 4 Location
The LBJ Project design and construction teams faced there one of the many
challenges they needed to overcome for the successful development of the project. The
IH-35 and its existing interchange with IH-635 is a major traffic corridor in Dallas area,
supporting high traffic volumes, particularly during peak hours. The construction of a new
bridge using conventional design and construction methodologies over this important
corridor may imply closing the highway to the traffic and, therefore, seriously impacting
the traffic and overall economic activity in this important area of the Metroplex.

4
Figure 1-3 Bridge 4 Crossing over IH-35E
The singularity of the problem faced needed of an innovative solution. The
originally designed post-tensioned cast in place concrete bent cap solution could not be
built without a long term closure of the IH-35E highway for the required form work and
concrete curing times. The solution to be adopted may have to be prefabricated and
simply supported on the columns to limit to the minimum the impact to the traffic. With
spans varying from 74.5 ft. to 86 ft. (22.71 to 26.21 m.) between supports, a precast
prestressed concrete bent cap would have been too heavy to be safely lifted. A
composite steel-concrete bent cap, consisting of a rectangular shaped section of steel
with a top compression concrete slab, was designed and built as a lighter alternative
complying with the previously mentioned requirements.
Bridge 4 crossing over IH 35E

5
Figure 1-4 Bridge 4 Typical Section
This study will consist of the performance of a comparison between both
solutions in terms of structural behavior, cost-efficiency and construction time.
1.3 Need Statement
Selecting the most appropriate solution for the design of a bridge structure is a
difficult task that involves the contribution of professionals with different backgrounds.
The particular conditions of the project in hand have to be deeply analyzed to obtain the
expected outcome in terms of quality, safety, cost and schedule.

6
The continuous development of our cities translates in increasing traffic volumes
that will eventually overcome the existing transportation infrastructures capacity.
Therefore, the construction of new projects to increase traffic capacity of our highways
and toll ways in consolidated urban areas and conflicting with other existing
infrastructures may lead to the development of new construction processes, techniques
and structural typologies.
The current construction market conditions, with an increasing competitiveness
for the construction companies, have made the design optimization key for the structural
engineer success. In that sense, the availability of comprehensive and detailed guidance
documents describing the new processes, techniques and structural typologies is
extremely important to ensure that engineers properly comply with their commitment with
the society.
In the opinion of this research’s author, engineers like himself with a privileged
position in a major construction company and therefore, with a unique opportunity of
participating in large construction projects have the responsibility of showing to the
engineering community those innovative methods, solutions or techniques used in such
projects. This research is the result of that commitment
1.4 Research Objectives
The objective of this research is to establish adequate modeling techniques to be
used in the analysis and design of both structural typologies in future researches, and
conduct a comparison between the two previously discussed structural solutions in terms
of structural behavior at service, cost-efficiency and construction schedule. The tasks to
be completed are:

7
- Literature Review. Currently available literature about bridge design, cost
estimation and construction scheduling methodologies will be analyzed,
identifying their applicability to the case in study
- Structural analysis. Both the posttensioned concrete bent cap original design
and the steel-concrete composite bent cap alternative will be modeled using
the commercial software ABAQUS to accurately simulate their structural
behavior.
- Cost estimation. The total direct cost of both structural alternatives has been
determined for their use in preliminary studies.
- Construction scheduling. The construction time required for both solutions
have been determined to be used as guidance for preliminary studies.
- Conclusions. The results obtained are compared to determine the
advantages and disadvantages of each of the solutions analyzed.
1.5 Thesis Organization
Chapter 1 introduces the problem in hand and its controlling parameters. The
justification of its need, objectives of the research and the document organization are
also presented in this chapter.
Chapter 2 presents the current situation of bridge substructure design in the
available literature and related researches. Cost estimation and construction planning
literature references are also researched to better establish methodologies to be used in
subsequent chapter’s analyses.
8
Chapter 3 describes the finite element model analysis performed for the two bent
cap typologies studied, establishing the required parameters for the development of
accurate models and methods for their validations.
Chapter 4 provides the cost analysis and construction schedule of the two
solutions studied in this Thesis.
Chapter 5 summarizes the results obtained, allowing for their comparison and
discussion.
Chapter 6 includes the conclusions drawn from the work performed in this thesis.
Proposals for future researches are also provided.
Appendix A includes the drawings in which the general geometry of Bridge 4 and
the particular details of the two different structural alternatives studied are shown.
Appendix B presents a summary of the load calculations performed by modeling
the bridge using the software PGSuper.
Appendix C provides the prestress losses calculations performed to determine
the effective prestress force to be applied in the development of the first finite element
model.
Appendix D shows the hand calculations performed to validate the results
obtained from the post-tensioned bent cap model developed in Abaqus.
Appendix E presents the calculations performed to validate the composite bent
cap model developed using Abaqus.
Appendix F includes the detailed estimates obtained for the two structural
solutions studied.
Finally, a list of the references used in the development of this thesis is included.
9
Chapter 2
BACKGROUND AND LITERATURE REVIEW
This chapter presents the information gathered about the topic under analysis.
After a brief historical introduction, substructure typologies available in the literature
researched are presented and their main characteristics are outlined. Once the two
typologies proposed have been described, cost estimation and construction planning
methodologies are investigated to determine the techniques that will better serve for the
purposes of this study. Finally, the case under analysis is described.
2.1 Historical Introduction
Bridge building is inherent to human society development. The first bridge in
human history was probably built in prehistoric times when the need of crossing a river
made a man cut a tree and use it for that purpose.
For a long time, the bridge building technology did not experience a noticeable
advance, and bridges were built from locally and naturally available materials. It is not
until the rise of the Roman Empire when this technology sees a revolution. The need of
an extensive net of transportation infrastructures to allow quick and safe communication
and transportation of people and goods led to the discovery of the stone arc. Some of
those bridges have become major landmarks, like the Alcantara Bridge in Spain, which is
still opened to traffic after 2,000 years in service.

10
Figure 2-1 The Alcantara Bridge (Spain)
The fall of the Roman Empire changed drastically the way bridges were seen.
They were no longer an essential infrastructure and they had the disadvantage of being
hard to defend from invaders. As a consequence, many of them were demolished during
the Middle Ages.
Bridge construction did not experience an increase until the Renaissance, but the
lack of new materials prevented engineers from developing new bridge typologies. That
situation changed during the 19th century with the availability of new construction
materials. Improvements in the fabrication processes of gray iron first and steel later cut
the prices of those materials. Later, the discovery and development of reinforced and
prestressed concrete meant a new revolution for the structural engineering. The
appearance of those new construction materials, joined to the development of the
modern Mechanics of Materials theory, led to the development of the modern bridge
concept.

11
2.2 Structural Background
2.2.1 Introduction
The terms pier and bent are used to refer to any type of substructure used to
transfer the bridge superstructure loads to the bridge foundation in intermediate supports
between abutments.
The evolution of pier typologies is a consequence of the intensive use of bridges
caused by the changes in our transportation infrastructures (Zhao & Tonias, 2012). While
bridges were originally used to cross over natural features, the development of the
modern transportation networks and their interactions and conflicts have introduced new
design constraints for bridges.
The literature available about bridge design usually establishes bridge
classifications based mainly, when not exclusively, in the superstructure typology –this is,
beams and deck- the materials used and, in some cases, other criteria. For example,
(Lebet & Hirt, 2013) establish the following as main criteria for bridge classification:
- Type of use.
- Geometry.
- Structural form.
- Type of slab.
- Cross section.
- Slab position.
- Erection method.
- Slab construction.

12
Most of the bridge classifications are based in a single criterion. For example, the
classifications proposed by (Lee & Sternberg, 2015) and (Zhao & Tonias, 2012) are
based only in the structural form of the bridge superstructure. Other authors base their
classifications in more than one criterion.
Table 2-1 Bridge Classification Based on Slab Position and Structural Form.
(Barker & Puckett, 2013)
This widespread consideration of a bridge being only its superstructure has led to
a general lack of information about the possible alternatives that the structural engineer
has when facing the design of a bridge substructure.
In general, abutment design is deeply analyzed (Zhao & Tonias, 2012),
particularly when referring to integral abutments. For example, (Barr, Halling, Huffaker, &
Boyle, 2013) investigated the reasons behind abutment spalling on an integral abutment
bridge in Salt Lake City by first instrumenting and monitoring the bridge and second by
developing and calibrating a finite element model of the bridge. (Nikravan, 2013) studied
the structural behavior of integral bridges when subjected to temperature variations using
3D finite element models, and determined the key parameters that impact the behavior of
such bridges.
Main structure below the deck line Arched and truss‐arched bridges
Main structure above the deck lineSuspension, cable‐stayed and through‐
truss bridgesMain structure coincident with the
deck lineGirder and slab bridges
BRIDGE CLASIFICATION

13
However, pier typologies are generally omitted or, in the best of the scenarios,
limited to the standard solutions made of cast in place reinforced concrete supported
either by one –hammerhead bent cap- or more than one –column and pile bent cap
(Chen & Duan, 2014). Some special typologies like the straddle bent caps are briefly
described in other documents (Colleti & Sheahan, 2012), but their main characteristics
and design processes are not covered in depth.
Some public agencies have also published several documents detailing the
design process of the most common bent cap typologies. Design examples of rectangular
column bent caps (TxDOT, Rectangular Bent Cap Design Example, 2010), inverted T
column bent caps (TxDOT, Inverted Tee Bent Cap Design Example, 2010) and
hammerhead bent caps (AZDOT, ND) have been developed to help the structural
engineer. However, it is difficult for the engineer to find guidance in the design of the two
special substructure typologies analyzed in this report.
2.2.2 Hammerhead Pier
This solution consists of the use of one or more columns and a hammer shaped
pier cap. Conventionally made of reinforced concrete, this typology is mainly used in
urban areas where the space available for the column placement is limited by underpass
traffic or existing utilities. In those cases, hammerhead piers with a single column are
widely used.
Structurally, this typology works as a rigid-frame structure with one or two
cantilevered ends. The characteristic hammerhead shape of this pier type is the result of
the cantilevered section optimization. The design is more efficient if the cantilevered
portions are balanced in both ends of the cap, resulting in a smaller column section.

14
Design wise, hammerhead caps are usually considered deep members, what implies that
shear deformations are not negligible and, therefore, the Bernoulli hypothesis is not
applicable. Under those conditions, the applicable codes establish the strut-and-tie
method as the preferred simplified design methodology to be applied in the design of
hammerhead piers. (Nicholas, Barth, & Boyajian, 2011) compared the reinforcing
requirements of the strength design approach for flexure and shear and the strut-and-tie
model method in their application to hammerhead piers design.
Figure 2-2 a) Balanced Hammerhead Pier b) Unbalanced Hammerhead Pier
As a variation of this type of substructure element, prestress can be introduced.
(Pereira, 1994) conducted a research to analyze the behavior of hammerhead piers
reinforced with T-headed bars and different levels of prestressing in the cantilever ends
by testing under static loading six pier models.

15
2.2.3 Bent Pier
The bent pier consists of a bent beam supported by two of more columns and
constituting a rigid frame structure. Usually made of reinforced concrete, this is the most
common type of pier in highway bridges (Zhao & Tonias, 2012).
Different variations of this type of pier can be found depending on the section
used for the bent beam. The most common sections are the rectangular; and the inverted
T section, that is used when a higher modulus of inertia is needed to resist the loads
applied.
Figure 2-3 a) Rectangular Bent Pier b) Inverted T Bent Pier
Although columns are usually made of reinforced concrete, other alternatives like
cast-in shell steel piles are available. (Ferley, 2013) developed finite element models to
analyze the behavior of the connections between reinforced concrete bent caps and cast-
in-shell piles under lateral loads.
(Bracci, Keating, & Hueste, 2000) studied the cause of unexpected cracks in the
cantilevered regions of reinforced concrete bent caps when subjected to service loads.
The research consisted of testing 16 full-scale specimens until failure, and concluded that

16
the flexural cracking was related to the stress levels in longitudinal reinforcement below
the service stress limits in the applicable codes.
As a variation of this typology, prestress can be introduced while keeping the
rigid frame configuration. (Billington S. L., 1994) studied the structural behavior of two-
span continuous bent caps with different levels of prestress by constructing and loading
to failure 4 models.
A singularity of the inverted T section is that the girders are usually supported by
the bottom flange. (Furlong, Ferguson, & Ma, 1971) studied the behavior of the structural
section under that particular loading case by performing 24 load tests over 6 different
specimens. As a result of the study, reinforcement details and design procedures for the
bottom flange as well as the web shear strength for inverted T bent caps were provided.
2.2.4 Solid Wall Pier
A solid wall pier is constituted by a reinforced concrete solid wall. Because of the
slenderness of the solution and the possibility of being built streamlined, this typology of
pier is mainly used in water crossings.
Its use in highway bridges is limited to not excessively wide bridges. The use of
wide solid wall piers can create a tunnel effect and may need of the placement of
illumination systems.

17
Figure 2-4 Solid Wall Pier
2.2.5 Integral Pier
This type of pier implies a rigid connection to the bridge superstructure. Integral
connections between bridge superstructure and substructure, for bridges either made of
concrete or made of steel, are used to reduce the structure depth and increase the
vertical clearance (Colleti & Sheahan, 2012), and improve the structural seismic
performance (Wassef & Davis, 2004).
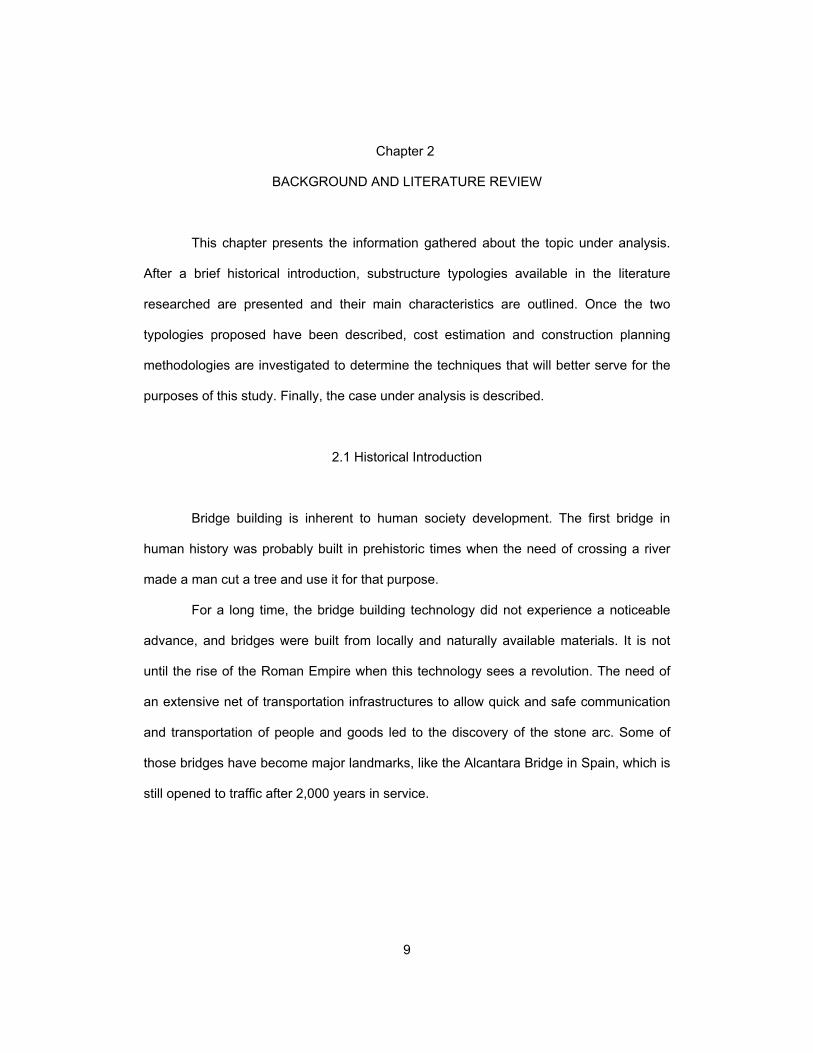
Several studies have been performed to analyze some particular aspects of
integral piers. For example, (Ales, 1994) developed a new connection detail between an
integral steel cap girder and concrete piers, while (Wassef & Davis, 2004) included the
development of recommended methodologies, specifications and design examples about
integral steel box-beam pier caps. Also, (Denio, Yura, & Kreger, 1995) studied the shear
18
strength and reinforcing details to be provided in the connection between steel bent caps
and concrete piers by performing eleven static load tests over six pier cap specimens.
Figure 2-5 Integral Steel Pier Cap
2.2.6 Proposed Pier Typologies
As stated before, the construction of new transportation infrastructures and the
improvement of the existing ones in urban areas may imply impacting traffic flows in
existing roadways. These impacts not only affect the traffic, but also the general activity
of the area, by limiting the regular development of the economic activity and generating
discomfort to the public in general.
The pier caps typologies described before imply a cast in place construction
when made of concrete, or a considerable amount of work to be performed in the
crossing area when made of steel. However, limiting the impact of new project
construction over existing traffic in situations like the one studied in this research can only
be achieved by the use of prefabricated solutions.

19
Structural prefabricated systems have been successfully used in different
structure typologies with the well-known advantages:
- Reduction of the construction time and the number of operations to be
performed in situ.
- Improved in plant quality control.
- Work zone safety improvement.
- Lower environmental impact.
The development of bridge substructure prefabricated structural systems will add
to the previously exposed advantages a reduction in the number and time of traffic
detours and closures. In that sense, different researches have been performed to study
the applicability of such systems to bridge substructure construction. For example, (Unly,
2010) proposed different precast reinforced concrete systems applicable to the
construction of abutments and bent caps.
(Billington, Barnes, & Breen, 1998) proposed reinforced concrete precast
systems applicable to the construction of single and double column inverted T
hammerhead pier caps and developed connection details between the different elements
forming the pier caps.
(Matsumoto, et al., 2001) developed a precast reinforced concrete system for the
construction of pile bent caps to be used in nonseismic regions and three different
connection details to cast in place or precast trestle piles. The study includes testing of
the systems described and proposes design methodologies for the elements proposed.
Other systems have been applied successfully. For example, precast post-
tensioned simply supported bent caps with an inverted T section and with spans up to 58
ft. (17.68 m.) have been successfully used for the u-section bridges along the managed
lanes in the LBJ project.

20
However, there is a practical limit for the span length of these precast elements
due to their self-weight to allow for their safely lifting and placement.
Two pier cap typologies are presented in this dissertation. The first one consist of
the use of cast in place posttensioned concrete pier cap with a rectangular section, and
simply supported on concrete columns built at both sides of the affected roadway. In this
case, the pier cap will work as a prestressed concrete girder simply supported at both
ends. The original design of Bridge 4 used this typology in the crossing over IH-35E in
the LBJ project.
The second proposed typology tries to solve the weight problem that limits the
application of the previously described precast concrete systems by using different
materials applied to the same structural concept: the use of a composite steel-concrete
section, constituted by a rectangular steel section topped by a cast in place concrete slab
to resist the top compression, and again simply supported at both ends. This solution has
also the advantage of simplifying the construction process by changing the time
consuming process of post-tensioning the tendons on an elevated position by simply
lifting and placing the steel-concrete section once the concrete slab has reached enough
strength to support its self-weight.
2.3 Cost Estimation Background
Accurately determining the cost of a construction project is a difficult task that
implies the use of experience, engineering judgment and scientific principles (Bhargava,
2009). Guidance and databases including unit cost for different construction activities and
materials are very useful for the cost estimator, but he usually needs to face the problem
of the opacity of the companies and their reticence to make public such data.

21
Different methods are available for the estimator depending on the project stage
and information available, and accuracy needed (Pratt, 2011):
- Preliminary estimating techniques. Estimates prepared in early stages of the
project are usually prepared using these techniques because of the lack of
detailed information about the project.
- Detailed estimating techniques. These methods are intended to be used at
advanced stages of the project, when the information available about the
project is more detailed and none or few design decisions are left to be
made.
The importance of precisely estimating construction cost in all the phases of a
project is essential for its successful development. Design wise, it is crucial to properly
determine construction cost at early stages of the project as an aid for the decision
makers (Samphaongoen, 2009) to ensure the appropriate structural typology selection.
Independently from the level of development of the project, the following two
different types of cost can be defined (Pratt, 2011):
- Direct cost. It can be defined as the cost of material, labor and equipment
directly used for the construction of a unit measurement of the construction
activities identified for the project. This cost, provided that the construction
processes are optimized, should not significantly vary depending on the
company performing the work.
- Indirect cost or general expenses. It is included in this category the cost of all
the auxiliary items that the contractor needs to properly develop his activity
but that are not specifically related to any of the construction activities
identified for the project. This cost may greatly vary depending on the
construction company policies and internal methods of operation.
22
The cost of the pier cap typologies proposed in this research will be evaluated in
terms of direct cost to provide designers with accurate information for alternative
selection processes.
2.4 Scheduling Background
(Mubarak, 2010) defined scheduling as
‘The determination of the timing and sequence of operations in the project and their assembly to give the overall completion time’.
Construction scheduling has evolved as the construction market conditions
changed in the past (Hutchings, 2004). Nowadays, the competitiveness in the
construction market leaves no room for the companies to misestimate the time needed
for the project completion.
Therefore, if the proper estimation of a project cost is important, precisely
knowing the time needed for the project completion is crucial to meet the deadlines and
vital for the project success. In the same way that it was previously discussed when
referring to cost estimation, schedules are developed during the different phases a
project consists of. Depending on the particular case, correct conclusions obtained from
an alternative selection process may condition the project development.
Different methods are available for the project scheduler depending on the grade
of accuracy and the additional information required. The two most common
methodologies are:
- Bar (Gantt) charts. Originally developed by Henry L. Gantt, this method is by
far the most extended one for scheduling construction projects (Newitt,

23
2009). The chart consists of a graphical representation of the activities to be
completed for the project completion, their duration and order of precedence.
Bar charts are the simplest method used nowadays in project scheduling,
and have the advantage of being easy to develop, read and update. But that
simplicity becomes also its major disadvantage because of its incapacity of
showing activities relationships in large and complex projects (Hutchings,
2004)
Figure 2-6 Gantt Chart Example (Newitt, 2009)
- Critical Path Method (CPM). This methodology is usually used in conjunction
with Gantt Charts in project scheduling applied to complex projects. The
method consist of determining those activities that will condition the
construction process, and then establishing and showing graphically the
construction paths through them and determining the duration of those paths.
This method has the advantage of properly showing the activities
precedence relationships in large projects. Between its disadvantages, the

24
CPM is complex to implement and understand, requiring a better qualified
staff (Newitt, 2009).
Figure 2-7 Network Schedule (Hutchings, 2004)
- Program evaluation and Review Technique (PERT). This method is a
variation of the CPM in which different times (optimistic time, most likely time,
pessimistic time) to account for the fact that actual activities duration may
vary from those assigned. Therefore, it is considered a probabilistic method.
- Linear scheduling method (LSM). This method consists of the graphical
representation of the activities, precedence relationships and duration times
in a flowchart like diagram. It can be considered a simplification of the CPM
method for use in construction projects with a low number of activities with
large associated quantities (Mubarak, 2010).
2.5 Case of Study Background
Approximately 13 miles long, the LBJ Express includes improvements along IH-
635 corridor from Luna Road to Greenville Avenue, as well as between Loop 12 and
Valwood Parkway on IH-35E. The works that are being performed includes the
25
reconstruction of the IH-635 highway and its frontage roads, and the construction of 4
new managed lanes (two per bound).
Because of its complexity and the extensive use of bridges, the IH-35 IH-635
interchange became one of the major landmarks of the project. To provide direct access
from both Loop 12 to the new managed lanes, a new Loop 12-IH 635 WB direct
connector has been built. Its crossing over IH-35E has been solved with the construction
of Bridge 4.
With a total length of 1,016 ft. (304.8 m), the bridge is divided into 9 spans with 3
TX54 girders per span, with the exception of span 3 that is constituted by 3 steel plate
girders. The future extension of the bridge with two new girders per span was also
considered in the design.
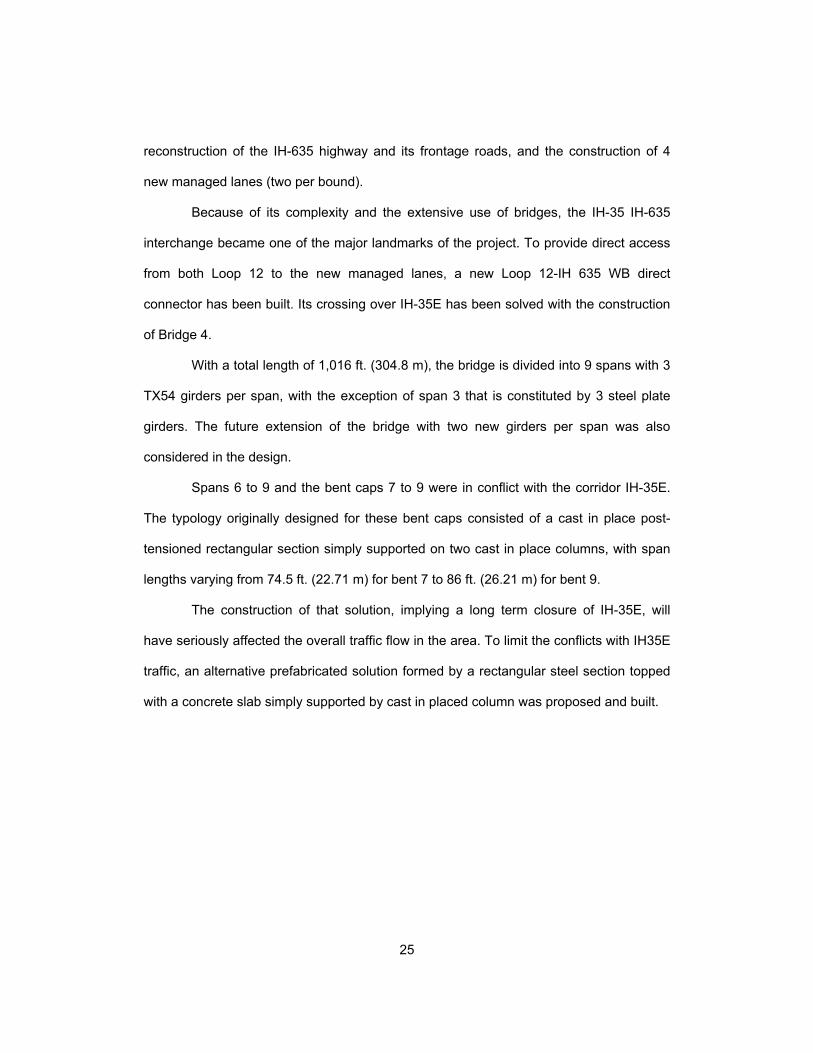
Spans 6 to 9 and the bent caps 7 to 9 were in conflict with the corridor IH-35E.
The typology originally designed for these bent caps consisted of a cast in place post-
tensioned rectangular section simply supported on two cast in place columns, with span
lengths varying from 74.5 ft. (22.71 m) for bent 7 to 86 ft. (26.21 m) for bent 9.
The construction of that solution, implying a long term closure of IH-35E, will
have seriously affected the overall traffic flow in the area. To limit the conflicts with IH35E
traffic, an alternative prefabricated solution formed by a rectangular steel section topped
with a concrete slab simply supported by cast in placed column was proposed and built.

26
Figure 2-8 Bridge 4 Location Before Construction
N
Loop 12
IH-35E NB

27
Figure 2-9 Bridge 4 Plan View

28
Figure 2-10 Composite Bent Cap Lifting Operation
Figure 2-11 Bent Caps 7, 8 and 9 in Place
29
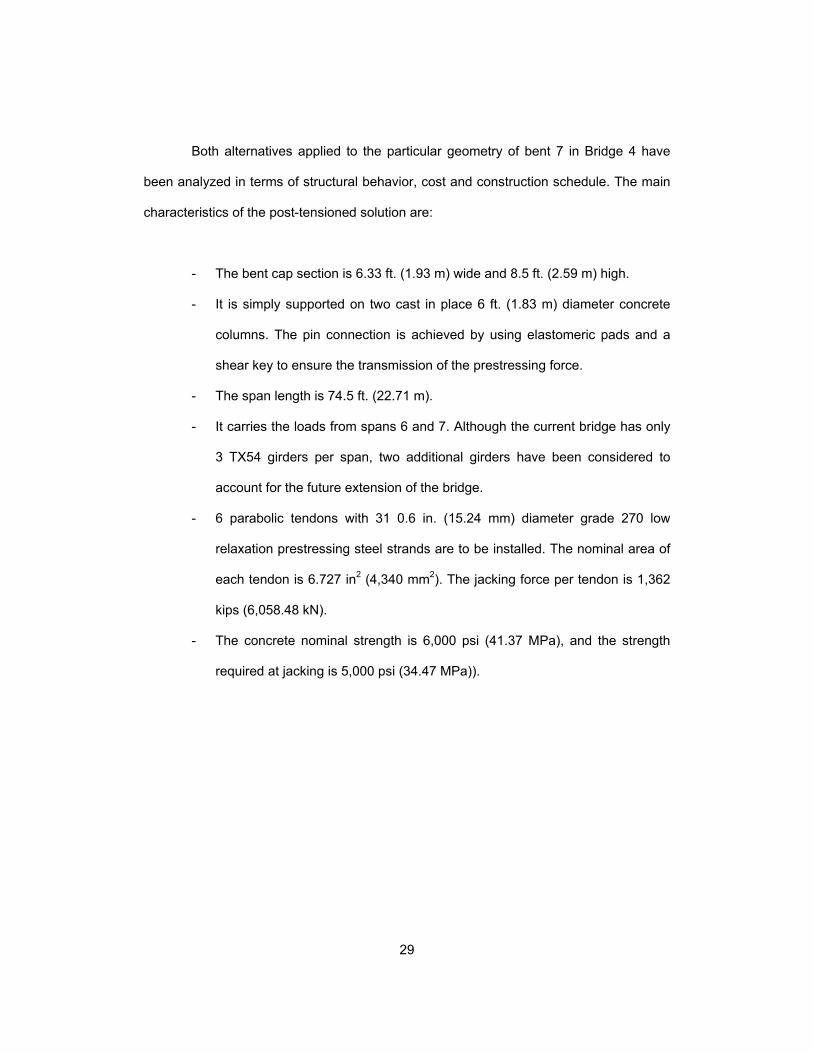
Both alternatives applied to the particular geometry of bent 7 in Bridge 4 have
been analyzed in terms of structural behavior, cost and construction schedule. The main
characteristics of the post-tensioned solution are:
- The bent cap section is 6.33 ft. (1.93 m) wide and 8.5 ft. (2.59 m) high.
- It is simply supported on two cast in place 6 ft. (1.83 m) diameter concrete
columns. The pin connection is achieved by using elastomeric pads and a
shear key to ensure the transmission of the prestressing force.
- The span length is 74.5 ft. (22.71 m).
- It carries the loads from spans 6 and 7. Although the current bridge has only
3 TX54 girders per span, two additional girders have been considered to
account for the future extension of the bridge.
- 6 parabolic tendons with 31 0.6 in. (15.24 mm) diameter grade 270 low
relaxation prestressing steel strands are to be installed. The nominal area of
each tendon is 6.727 in2 (4,340 mm2). The jacking force per tendon is 1,362
kips (6,058.48 kN).
- The concrete nominal strength is 6,000 psi (41.37 MPa), and the strength
required at jacking is 5,000 psi (34.47 MPa)).

30
Figure 2-12 Bridge 4 Construction. Girders in Place
31
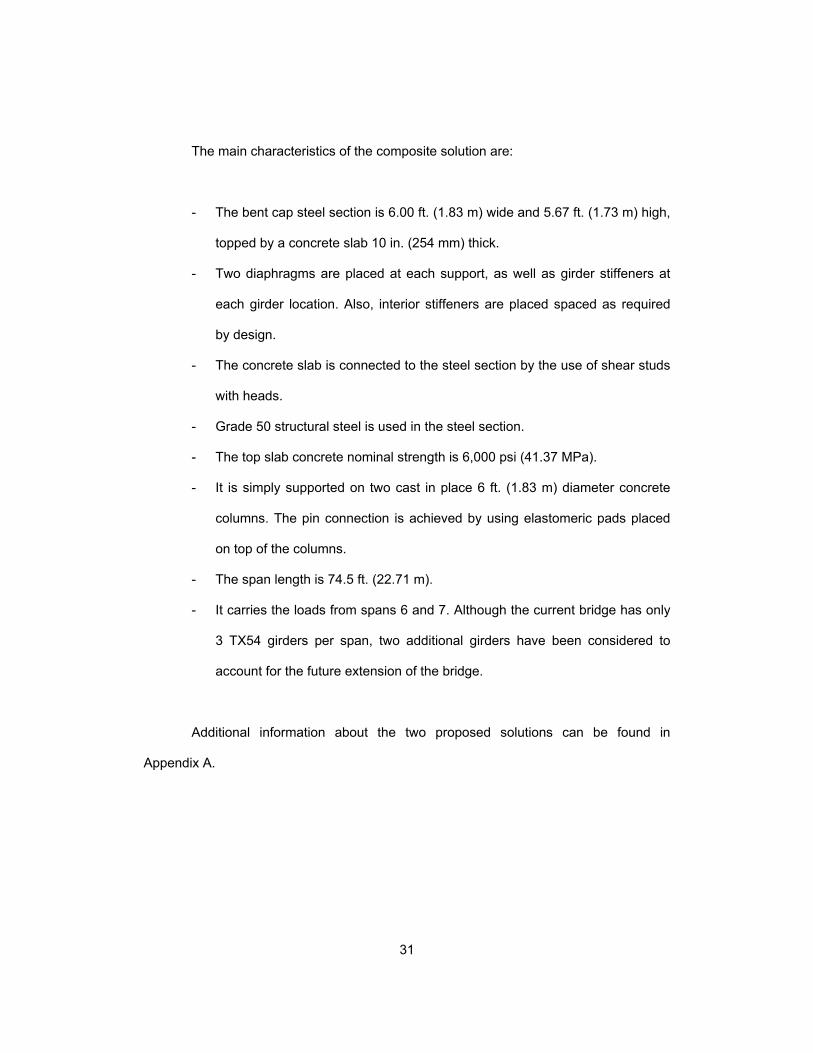
The main characteristics of the composite solution are:
- The bent cap steel section is 6.00 ft. (1.83 m) wide and 5.67 ft. (1.73 m) high,
topped by a concrete slab 10 in. (254 mm) thick.
- Two diaphragms are placed at each support, as well as girder stiffeners at
each girder location. Also, interior stiffeners are placed spaced as required
by design.
- The concrete slab is connected to the steel section by the use of shear studs
with heads.
- Grade 50 structural steel is used in the steel section.
- The top slab concrete nominal strength is 6,000 psi (41.37 MPa).
- It is simply supported on two cast in place 6 ft. (1.83 m) diameter concrete
columns. The pin connection is achieved by using elastomeric pads placed
on top of the columns.
- The span length is 74.5 ft. (22.71 m).
- It carries the loads from spans 6 and 7. Although the current bridge has only
3 TX54 girders per span, two additional girders have been considered to
account for the future extension of the bridge.
Additional information about the two proposed solutions can be found in
Appendix A.
32
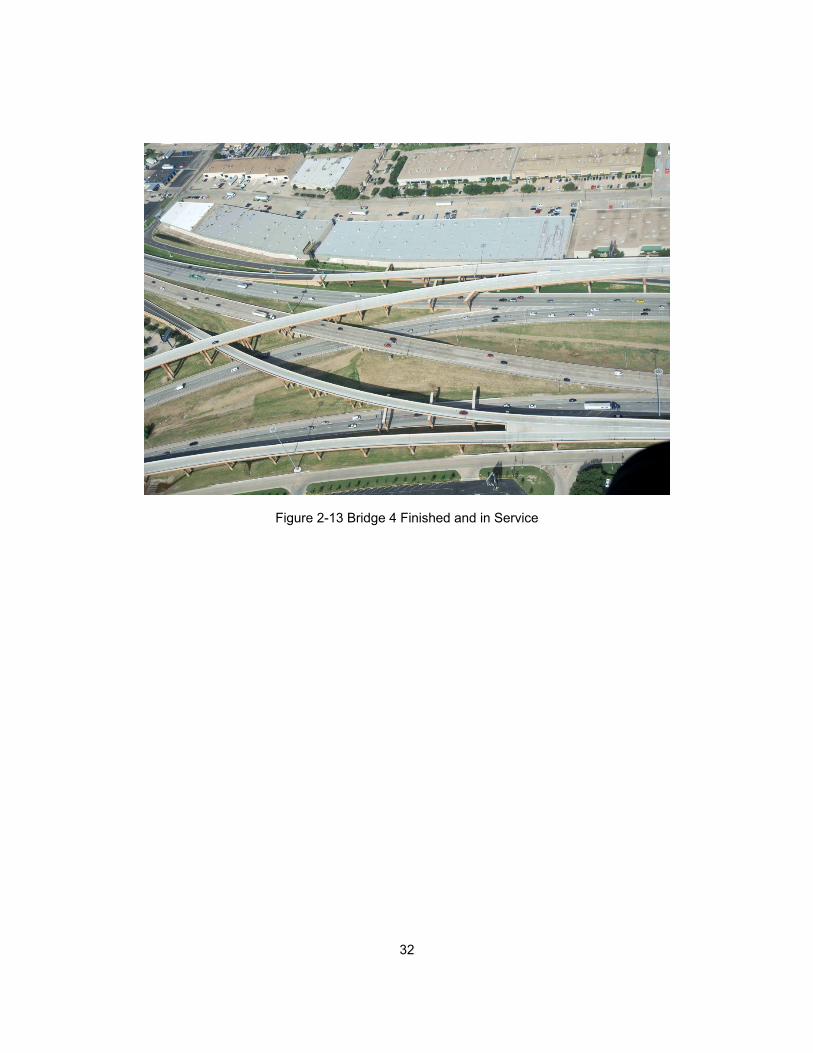
Figure 2-13 Bridge 4 Finished and in Service

33
Chapter 3
FINITE ELEMENT MODELLING
The main objective of this chapter is establish modelling techniques to be used in
the application of the finite element method using the commercial software Abaqus to
model the structural typologies presented minimizing the computational cost of running
the models. First, the materials models to be used are presented. The second part
describes the live loads to be used in the models based on the applicable structural
codes. Then, after describing the boundary conditions assumed, the models developed
are presented. Finally, the validation of the two models developed is performed to
investigate the accuracy of the results obtained.
3.1 Materials
Properly modelling material properties is essential for developing accurate finite
element models (FEM) since the material models will determine how the structure
behaves when subjected to the design loading case.
The commercial software Abaqus includes several material models to help the
user in FEM development. The material properties used in the development of the FEM
models included in this research are described below.
3.1.1 Concrete
Abaqus software includes the following three models applicable to concrete as a
brittle material:

34
Brittle cracking model. This model is intended to be used for materials with brittle
behavior dominated by tensile cracking, allowing the removal of elements in the model
based on a failure criterion. It assumes a simplified linear elastic response for the
material in compression, and a linear elastic-plastic behavior in tension. However, the
behavior of concrete when subjected to compressive stresses is known to be plastic.
Therefore, the use of this model is not adequate for models like the ones developed in
this dissertation, in which concrete is going to be subjected mainly to compression.
Concrete smeared cracking model. Also thought to be used for modelling brittle
materials dominated by tensile cracking, it allows for the use of a plastic behavior for the
material under compression and it uses a linear elastic-plastic model under tension. It
only accounts for tensile cracking (that means it does not model properly compression
failure, and therefore, is considered not adequate for the cases of study). It models the
postfailure behavior and the reinforcement interaction by the use of the tension stiffening
concept: after reaching the tensile stress limit for the concrete, the tensional stresses are
gradually transferred from the concrete element to the reinforcement element.
Concrete damage plasticity (CDP) model. This model is intended to be used for
materials with brittle behavior with the possibility of establishing failure criterions in
compression and tension by the use of damage parameters. It models both the behaviors
of the material in tension and compression as linear elastic-plastic, and it considers
tension stiffening to model the tension postfailure behavior and reinforcement interaction.
This is the material model that better approximates the behavior of concrete in the two
FEM to be analyzed and, therefore, have been used in this study.
Different parameters have to be determined to properly define the concrete
damage plasticity model in Abaqus. The first five parameters to be defined are related to
the performance of concrete under compound stress and determine the shape and

35
orientation of the failure surface. In the absence of more accurate empirical data,
(Kmiecik & Kaminski, 2011) propose the following values to be used:
Table 3-1 Default Parameters of CDP Model under Compound Stress
(Kmiecik & Kaminski, 2011)
The stress-strain curve for the concrete in compression is obtained using the
following model applicable to concrete strengths from 2,175.57 to 18,129.71 psi (15 to
125 MPa) (Wight & MacGregor, 2012):
/
⁄ (1)
where
f’c=peak stress.
ε0=strain when fc reaches f’c. (See Eq. (2))
n=a curve-fitting factor. (See Eq. (3))
Ec= initial tangent modulus (when εc=0). (See Eq. (6))
k=factor that calibrates the slope of the ascending and descending branches of
the curve. (See Eqs. (4) and (5)).

36
(2)
0.8 (3)
1 1 (4)
0.67 1 1 (5)
The initial tangent modulus is taken for normal weight concrete as (AASHTO,
2012):
1,820 ′ (6)
Figure 3-1 Typical Stress-Strain Curves for Concrete in Compression
(Wight & MacGregor, 2012)

37
The previous figure shows the stress-strain curves for different concrete
strengths obtained by the application of the described model. As can be observed, the
behavior of concrete subjected to compressive uniaxial loading is plastic, although the
first portion of the curve can be approximated by a straight line with a slope of Ec. Also, a
maximum value of stress and its corresponding strain must be defined as a limit for total
compression crushing failure of the concrete. Those two limiting values in the
compressive behavior of concrete have been taken as 0.5f’c and 0.3f’c (Wahalathantri,
Thambiratnam, Chan, & Fawzia, 2011).
Figure 3-2 Compressive stress-strain curve adopted for modelling concrete with Abaqus
(Wahalathantri, Thambiratnam, Chan, & Fawzia, 2011)
The following stress-strain relationship for the behavior of concrete when
subjected to uniaxial tension has been initially followed (Kmiecik & Kaminski, 2011):

38
(7)
⁄ (8)
where
Ec= initial tangent modulus (when εc=0). (See Eq. (6)
fr=tensile strength of the concrete. (See Eq. (9))
εr=strain when ft reaches fr.
n=weakening rate. Assumed a value of 0.4 (Kmiecik & Kaminski, 2011).
The tensile strength of the concrete is taken as its modulus of rupture (AASHTO,
2012):
0.24 ′ (9)
However, this type of curves is known to cause run time errors in Abaqus
material models. Therefore, the simplified stress-strain relationship shown in Figure 3-3
(Wahalathantri, Thambiratnam, Chan, & Fawzia, 2011) have been used in the
development of the finite element models. The material model used implies an elastic
behavior up to the modulus of rupture of the material. The subsequent discharge branch,
that defines the plastic behavior of the material, is approximated by using three line
segments.

39
Figure 3-3 Modified Tension Stiffening Model for Abaqus (Wahalathantri, Thambiratnam,
Chan, & Fawzia, 2011)
The compressive damage parameter dc is related to the plastic strain by the
following equation (Birtel & Mark, 2006):
1⁄
(10)
where the compressive plastic strain is proportional to the inelastic strain εcin=εc-
σcEc-1 using the parameter bc. A value of 0.7 for this parameter has been used since it
accurately simulates the unloading path of concrete under compression.

40
Figure 3-4 Definition of Inelastic Strain, Plastic Strain and Damage Parameter for (Cyclic)
Compression Loading (Birtel & Mark, 2006)
Figure 3-5 Definition of Cracking Strain, Plastic Strain and Damage Parameter for
(Cyclic) Tensile Loading (Birtel & Mark, 2006)

41
Following the same concept, the tension damage parameter dt can be defined as
follows (Birtel & Mark, 2006):
1⁄
(11)
where the tensile plastic strain is proportional to the cracking strain εtck=εt-σtEc
-1
using the experimentally determined parameter bt equal to 0.1.
The following tables and figures summarize the values obtained for the
compressive behavior for a concrete strength of 6,000 psi (41.37 MPa), as well as its
damage parameter.
As discussed above, compressive concrete behavior have been assumed to be
linear elastic up to half its peak strength (3,000 psi or 20.68 MPa), followed by a strain
hardening branch till the point the material reaches its maximum strength. Finally, a strain
softening branch extends up to a limiting stress of 1,800 psi (12.41 MPa) or 0.3f’c.

42
Table 3-2 Concrete Compressive Behavior Model
f'c 6,000.000 psi 41.369 MPa
Ec 4,458,071.332 psi 30,737.327 MPa
ν 0.200
n 3.2
ε0 1.958E‐03
K 1 if εc/ε0<=1
1.337 if εc/ε0>1
bc 0.7
εcpl dc εc
in εc σc (psi) σc (MPa)
‐ ‐ ‐ 0.000E+00 0.00 0.00
‐ ‐ ‐ 2.500E‐04 1,113.82 7.68
‐ ‐ ‐ 5.000E‐04 2,216.26 15.28
0.000E+00 0.000 0.000E+00 6.835E‐04 3,000.00 20.68
2.664E‐05 0.013 3.805E‐05 9.335E‐04 3,991.89 27.52
6.897E‐05 0.027 9.853E‐05 1.183E‐03 4,836.80 33.35
1.441E‐04 0.048 2.059E‐04 1.433E‐03 5,472.86 37.73
2.581E‐04 0.078 3.688E‐04 1.683E‐03 5,861.15 40.41
4.282E‐04 0.120 6.118E‐04 1.958E‐03 6,000.00 41.37
6.673E‐04 0.186 9.533E‐04 2.208E‐03 5,591.81 38.55
9.393E‐04 0.265 1.342E‐03 2.458E‐03 4,974.29 34.30
1.223E‐03 0.353 1.747E‐03 2.708E‐03 4,280.41 29.51
1.504E‐03 0.443 2.149E‐03 2.958E‐03 3,607.08 24.87
1.773E‐03 0.530 2.533E‐03 3.208E‐03 3,005.93 20.73
2.029E‐03 0.608 2.898E‐03 3.458E‐03 2,494.47 17.20
2.270E‐03 0.677 3.243E‐03 3.708E‐03 2,070.85 14.28
2.446E‐03 0.722 3.495E‐03 3.899E‐03 1,800.00 12.41

43
Figure 3-6 Stress-Strain Curve. Concrete Under Uniaxial Compression
Figure 3-7 Damage Parameter. Concrete Under Compression
0.00
1000.00
2000.00
3000.00
4000.00
5000.00
6000.00
7000.00
0.000E+00
5.000E‐04
1.000E‐03
1.500E‐03
2.000E‐03
2.500E‐03
3.000E‐03
3.500E‐03
4.000E‐03
4.500E‐03
Stress (psi)
StrainNOTE: 1 psi = 6,894.76 Pa
0.000
0.100
0.200
0.300
0.400
0.500
0.600
0.700
0.800
0.000E+00
5.000E‐04
1.000E‐03
1.500E‐03
2.000E‐03
2.500E‐03
3.000E‐03
Dam
age param
eter, d
c
Plastic strain, εcpl

44
In the same way, the tensile performance for a concrete strength of 6,000 psi
(41.37 MPa), as well as the tensile damage parameter, are shown in the following tables
and figures.
Tensile concrete behavior has been considered linear elastic up to the modulus
of rupture of the material, followed by a strain softening branch divided in three different
areas as discussed before.
Table 3-3 Concrete Tensile Behavior Model
f'c 6,000.000 psi 41.369 MPa
n 0.400
ν 0.200
Ec 4,458,071.332 psi 30,737.327 MPa
fr 587.878 psi 4.053 MPa
εr 1.319E‐04
bt 0.1
εtpl dt εt
ck εt σt (psi) σc (MPa)
0.000E+00 0.000 0.000E+00 0.000E+00 0.00 0.00
0.000E+00 0.000 0.000E+00 2.198E‐05 97.98 0.68
0.000E+00 0.000 0.000E+00 4.396E‐05 195.96 1.35
0.000E+00 0.000 0.000E+00 6.593E‐05 293.94 2.03
0.000E+00 0.000 0.000E+00 8.791E‐05 391.92 2.70
0.000E+00 0.000 0.000E+00 1.099E‐04 489.90 3.38
0.000E+00 0.000 0.000E+00 1.319E‐04 587.88 4.05
2.110E‐06 0.135 2.110E‐05 1.429E‐04 542.81 3.74
4.220E‐06 0.254 4.220E‐05 1.538E‐04 497.74 3.43
6.330E‐06 0.359 6.330E‐05 1.648E‐04 452.67 3.12
1.308E‐05 0.555 1.308E‐04 2.253E‐04 421.31 2.90
1.982E‐05 0.671 1.982E‐04 2.857E‐04 389.96 2.69
2.657E‐05 0.748 2.657E‐04 3.462E‐04 358.61 2.47
3.332E‐05 0.803 3.332E‐04 4.066E‐04 327.25 2.26
4.007E‐05 0.845 4.007E‐04 4.670E‐04 295.90 2.04
4.681E‐05 0.877 4.681E‐04 5.275E‐04 264.54 1.82
5.791E‐05 0.910 5.791E‐04 6.308E‐04 230.25 1.59
6.901E‐05 0.934 6.901E‐04 7.341E‐04 195.96 1.35
8.011E‐05 0.952 8.011E‐04 8.374E‐04 161.67 1.11
9.121E‐05 0.966 9.121E‐04 9.407E‐04 127.37 0.88
1.023E‐04 0.978 1.023E‐03 1.044E‐03 93.08 0.64
1.134E‐04 0.987 1.134E‐03 1.147E‐03 58.79 0.41

45
Figure 3-8 Stress-Strain Curve. Concrete Under Uniaxial Tension
Figure 3-9 Damage Parameter. Concrete Under Tension
0.000
100.000
200.000
300.000
400.000
500.000
600.000
700.000
0.000E+00
2.000E‐04
4.000E‐04
6.000E‐04
8.000E‐04
1.000E‐03
1.200E‐03
1.400E‐03
Stress (psi)
StrainNOTE: 1 psi = 6,894.76 Pa
0.000
0.200
0.400
0.600
0.800
1.000
1.200
0.000E+00
2.000E+00
4.000E+00
6.000E+00
8.000E+00
1.000E+01
1.200E+01
1.400E+01
1.600E+01
1.800E+01
Dam
age param
eter, d
t
Plastic Strain, εcpl

46
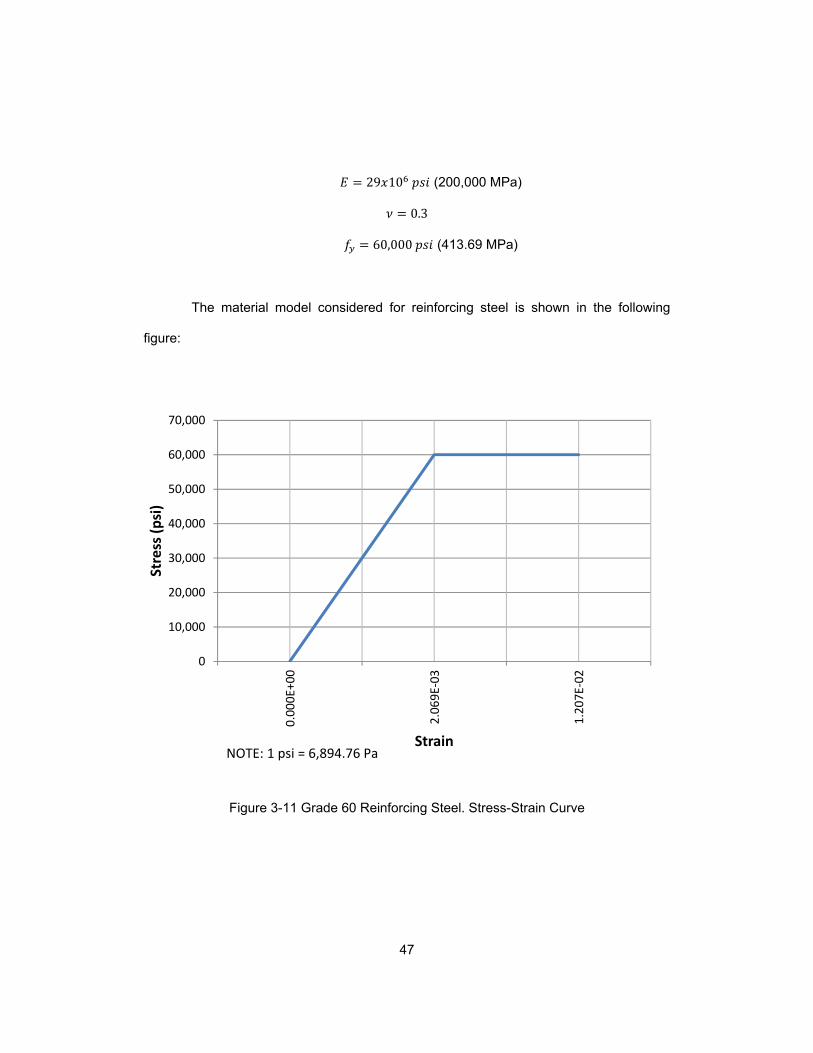
3.1.2 Reinforcing Steel
The reinforcing steel considered in the FEM performed is grade 60, with a yield
strength of 60,000 psi (413.69 MPa). The following figure shows the strain-stress curves
for different grades of steel. For a grade 60 steel, it can be seen that after the initial
elastic behavior up to the yielding point, a perfectly plastic behavior take place followed
by a strain hardening branch. Finally, a strain softening branch extends up to the ultimate
strength of the material
Figure 3-10 Typical Stress-Strain Curves for Reinforcing Steel
(Nilson, Darwin, & Dolan, 2004)
For the purpose of modelling the material, reinforcing steel has been considered
an elastic-perfectly plastic material. Steel elastic properties have been taken as follows
(AASHTO, 2012):
47
29 10 (200,000 MPa)
0.3
60,000 (413.69 MPa)
The material model considered for reinforcing steel is shown in the following
figure:
Figure 3-11 Grade 60 Reinforcing Steel. Stress-Strain Curve
0
10,000
20,000
30,000
40,000
50,000
60,000
70,000
0.000E+00
2.069E‐03
1.207E‐02
Stress (psi)
StrainNOTE: 1 psi = 6,894.76 Pa

48
3.1.3 Prestressing Steel
Unless reinforcing steel, in which the yielding stress can be clearly defined from
the results of a uniaxial tension test, yielding stress limit for prestressing steels is no that
clear. Different arbitrary methods that identify the yielding point as the stress reached at a
certain strain are usually used. The following figures show the stress-strain curve for
different prestressing steels and the 1% strain criteria to determine the yielding stress.
Also, the criterion for determining the failure strain of the steel is included.
Figure 3-12 Typical Stress-Strain Curves for Prestressing Steel (Naaman, 2012)

49
Figure 3-13 Typical Determination of Yield Strength for Prestressing Steel
(Naaman, 2012)
Prestressing steel will be modelled as an elastic-plastic material, with the
following properties (AASHTO, 2012):
Low relaxation Grade 270 prestressing steel
28.5 10 196,500.63
0.3
270,000 1,861.59
0.035

50
243,000 1,675.43
31-0.6” (15.24 mm) Φ strands. Nominal area 6.727 in2 (4,340 mm2) per tendon
The stress-strain curve obtained based on the previously described criteria and
data for the prestressing steel is shown in the following figure:
Figure 3-14 Grade 270 Low Relaxation Prestressing Steel.
Stress-Strain Curve
0
50,000
100,000
150,000
200,000
250,000
300,000
0.000E+00
8.526E‐03
3.500E‐02
Stress (psi)
StrainNOTE: 1 psi = 6,894.76 Pa

51
3.1.4 Structural Steel
Structural steels presents similar stress-strain curves to those obtained for
reinforcing steel in uniaxial tension tests, with an elastic branch and a well-defined
yielding point, followed by strain hardening and strain softening curves. The following
figure shows the stress-strain curve for different structural steels.
Figure 3-15 Typical Stress-Strain Curves Structural Steel
For the purpose of modelling the material, structural steel has been considered
an elastic-perfectly plastic material. Steel properties have been taken as follows
(AASHTO, 2012):

52
A709 Grade 50 steel
29 10 200,000
0.3
65,000 448.16
50,000 344.74
The material model considered for reinforcing steel is shown in the following
figure:
Figure 3-16 Grade 50 Structural Steel. Stress-Strain Curve
0
10,000
20,000
30,000
40,000
50,000
60,000
70,000
0.000E+00
1.724E‐03
1.000E‐01
Stress (psi)
StrainNOTE: 1 psi = 6,894.76 Pa
53
3.2 Loads
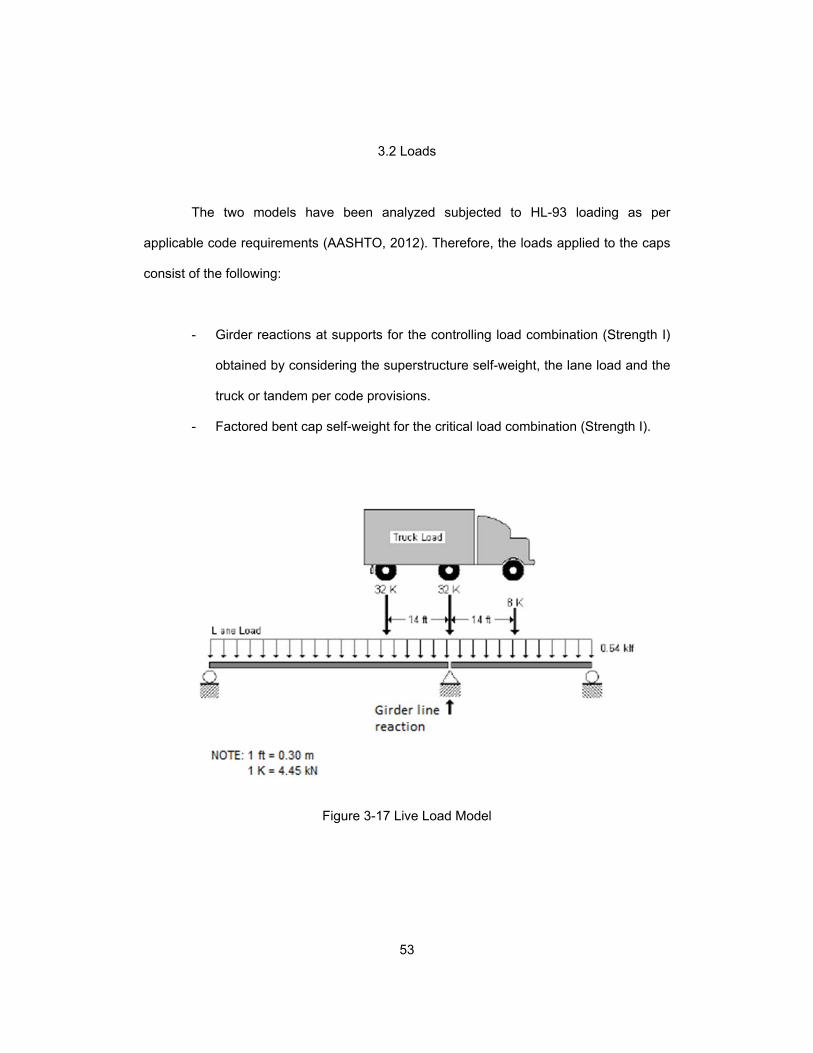
The two models have been analyzed subjected to HL-93 loading as per
applicable code requirements (AASHTO, 2012). Therefore, the loads applied to the caps
consist of the following:
- Girder reactions at supports for the controlling load combination (Strength I)
obtained by considering the superstructure self-weight, the lane load and the
truck or tandem per code provisions.
- Factored bent cap self-weight for the critical load combination (Strength I).
Figure 3-17 Live Load Model

54
The girder reactions at supports have been determined by modelling with the
software PGSuper the two bridge spans that load the pier cap under analysis. The
following table summarizes the results obtained in that model. Further information can be
found in Appendix B.
Table 3-4 Summary of Girder Reactions at Support
Finally, the unfactored self-weight of the caps materials have been considered by
using the following unit weights for the materials. A load factor γp of 1.25 (AASHTO,
2012) have been considered in the models.
- Normal weight concrete: 0.145 kcf (23.04 KN/m3).
- Structural steel 0.490 kcf (77.84 KN/m3).
3.3 Boundary Conditions
The post-tensioned and composite caps have been considered simply supported
at both ends as shown in the figure below. This consideration translates as follows in
terms of modelling with Abaqus:
GIRDER LINE
TOTAL REACTION, kip (kN)
1 285.69 (1,270.75)2 336.87 (1,489.40)3 433.27 (1,927.18)4 531.15 (2,362.55)5 556.31 (2,474.47)

55
- At both ends, movements along the x axis (oriented transversally to the
element) are released. Constraining these movements generates additional
stresses under the deformations caused by the Poisson effect, and does not
properly model the actual behavior of the cap.
- At the left end, rotation about the x axis is released. This complies with the
assumption of having a pin support at that end of the member.
- The support at the right end is modeled as a roller. Therefore, movement
along the z axis and rotation about the x axis are released.
Figure 3-18 Boundary Conditions
3.4 Post-Tensioned Concrete Cap Model
3.4.1 Introduction
The prestressed concrete cap has the following characteristics:
- It has been modeled as a simply supported beam, spanning between the two
columns a total length of 74.5 ft. (22.71 m).
- The cross section of the concrete cap is 8.5 ft. (2.59 m) high by 6.33 ft. (1.93
m) wide.
z
y
x

56
- The cap serves as support for 10 girders (5 from the backward span and 5
from the forward span). The actual bridge has only three girders for span, but
other two were considered in the design for future extension of the bridge.
- The cap is prestressed with 6 tendons following parabolic shapes. Each
tendon is constituted by 31-0.6” (15.24 mm) Φ grade 270 low relaxation steel
strands.
The following figures summarize the main features of the prestressed concrete
cap modeled. Additional information can be found in Appendix A.

57
Figure 3-19 Plan View Geometry of Post-Tensioned Concrete Cap
Figure 3-20 Tendons Profiles

58
Table 3-5 Tendons Elevations
Figure 3-21 Prestressed Concrete Cap Typical Section

59
The following parts have been included in the Abaqus model for the prestressed
concrete bent cap:
- Concrete cap section. The concrete solid is modeled using a 3D deformable
homogeneous solid element simply supported at its ends (pinned-roller
boundary conditions).
Figure 3-22 Concrete Cap Part in Abaqus Model
- Reinforcement. Both longitudinal and transverse reinforcement have been
included in the model. The rebar has been modeled as 3D wire elements
with truss sections (capable of developing only axial stresses) with a cross
sectional area equal to the actual area of the rebar. To guarantee the
deformation compatibility and a proper stress transmission between concrete
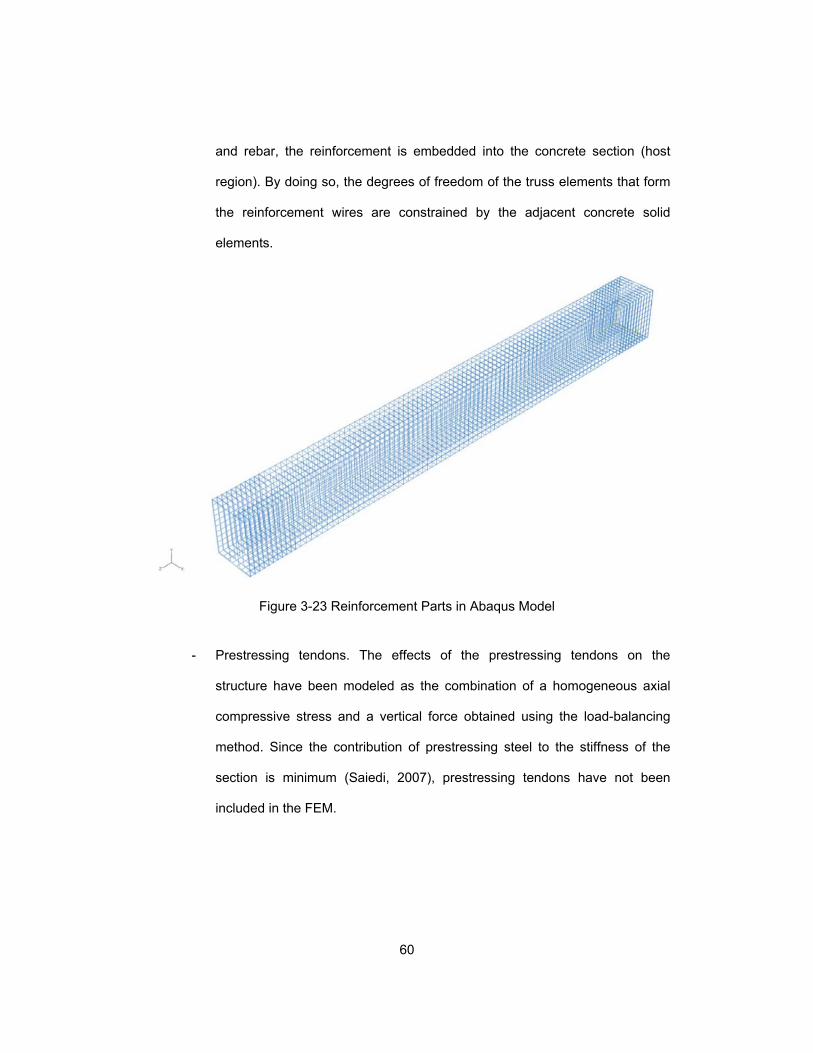
60
and rebar, the reinforcement is embedded into the concrete section (host
region). By doing so, the degrees of freedom of the truss elements that form
the reinforcement wires are constrained by the adjacent concrete solid
elements.
Figure 3-23 Reinforcement Parts in Abaqus Model
- Prestressing tendons. The effects of the prestressing tendons on the
structure have been modeled as the combination of a homogeneous axial
compressive stress and a vertical force obtained using the load-balancing
method. Since the contribution of prestressing steel to the stiffness of the
section is minimum (Saiedi, 2007), prestressing tendons have not been
included in the FEM.

61
3.4.2 Prestressing Force
The effect of the post-tensioning tendons on the model will be taking into account
by the introduction of two different loads:
- A compressive force applied at the ends of the member. This force has been
determined by deducting the prestress losses to the jacking force to obtain
the effective prestress force. This force is introduced into the model as a
constant compressive pressure at both ends due to the fact that the center of
gravity of the tendons coincides with the center of gravity of the section at
both ends of the members.
- A vertical distributed load due to the load-balancing effect of the draped
tendons. This force is obtained by imposing equilibrium at the tensioned
tendon. The procedure followed is explained below.
3.4.2.1 Prestress Loss
The prestress force at jacking per tendon for the post-tensioned concrete cap is
defined in the drawings to be 972.97 kips (4,327.99 kN). However, to properly model the
behavior of the structure, instantaneous and long term prestress losses shall be
considered. For a post-tensioned member, the total losses can be obtained as (AASHTO,
2012):
∆ ∆ ∆ ∆ ∆ (12)
where
∆fpT is the total loss (ksi).
∆fpF is the loss due to friction (ksi).
∆fpA is the loss due to anchorage set (ksi).

62
∆fpES is the sum of all losses or gains due to elastic shortening or extension at the
time of application of prestress and/or external loads (ksi).
∆fpLT are the losses due to long-term shrinkage and creep of concrete, and
relaxation of the steel (ksi).
The methodology followed to obtain the prestress losses is described below. The
complete analysis performed is included in Appendix C. A total prestress loss of 57.83 ksi
(398.74 MPa) has been obtained. Therefore, the long term prestress force to be
considered in the FEM is 972.97 kips (4,327.78 kN) per tendon.
Friction Loss
The friction between the prestressing tendon and the duct in which it is place
reduces the prestress force applied to the tendon. This loss can be estimated as
(AASHTO, 2012):
∆ 1 (13)
where
fpj is the stress in the prestressing steel at jacking (ksi).
x is the length of a prestressing tendon from the jacking end to any point under
consideration (ft).
k wobble friction coefficient (per foot of tendon). Taken as 0.0002 per bridge
drawings.
μ is the coefficient of friction. Taken as 0.23 per bridge drawings.
α is the sum of the absolute values of angular change of prestressing steel path
from jacking end, or from the nearest jacking end if tensioning is done equally at
both ends, to the point under investigation (rad).
The prestress loss caused by friction between the tendon and the duct obtained
following the outlined procedure is 7.842 ksi (54.07MPa) per tendon.
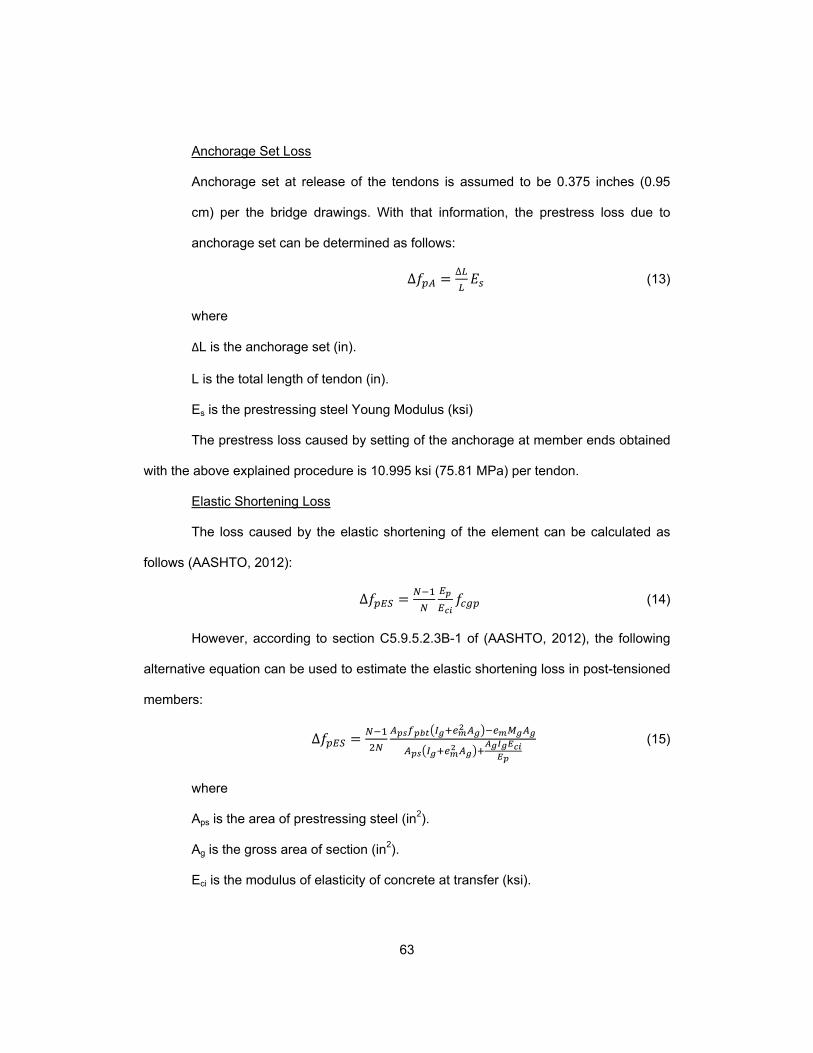
63
Anchorage Set Loss
Anchorage set at release of the tendons is assumed to be 0.375 inches (0.95
cm) per the bridge drawings. With that information, the prestress loss due to
anchorage set can be determined as follows:
∆∆
(13)
where
ΔL is the anchorage set (in).
L is the total length of tendon (in).
Es is the prestressing steel Young Modulus (ksi)
The prestress loss caused by setting of the anchorage at member ends obtained
with the above explained procedure is 10.995 ksi (75.81 MPa) per tendon.
Elastic Shortening Loss
The loss caused by the elastic shortening of the element can be calculated as
follows (AASHTO, 2012):
∆ (14)
However, according to section C5.9.5.2.3B-1 of (AASHTO, 2012), the following
alternative equation can be used to estimate the elastic shortening loss in post-tensioned
members:
∆ (15)
where
Aps is the area of prestressing steel (in2).
Ag is the gross area of section (in2).
Eci is the modulus of elasticity of concrete at transfer (ksi).

64
Ep is the modulus of elasticity of prestressing tendons (ksi).
em is the average eccentricity at midspan (in).
fpbt is the stress in prestressing steel immediately prior to transfer (ksi).
Ig is the moment of inertia of the gross concrete section (in4).
Mg is the midspan moment due to member self-weight (kip-in).
N is the number of identical prestressing tendons.
fpj is the stress in the prestressing steel at jacking (ksi).
The prestress loss due to elastic shortening of the member when subjected to
the prestressing force have been estimated to be 2.936 ksi (75.81 MPa) using the
outlined procedure.
Creep, Shrinkage and Relaxation of Prestressing Steel Losses
Several methods of obtaining these losses are included in (AASHTO, 2012). The
equation proposed in 5.9.5.3 is approximate and intended to be used only for standard
precast pretensioned members. The procedure outlined in 5.9.5.4 is intended to be used
when a more accurate estimation of time dependent losses is required. However, that
procedure is not intended to be used for post-tensioned elements with no composite
action. Therefore, time dependent losses due to creep and shrinkage will be determined
using 5.4.3.2.
The creep coefficient is defined as (AASHTO, 2012):
, 1.9 ∙ ∙ ∙ ∙ ∙ . (16)
in which
1.45 0.13 ⁄ 1.0 (17)
1.56 0.008 (18)
(19)

65
(20)
where
H is the relative humidity (%).
ks is the factor for the effect of the volume-to-surface ratio of the component.
kf is the factor for the effect of concrete strength.
khc is the humidity factor for creep.
ktd is the time development factor.
t is the maturity of concrete (day) defined as age of concrete between time of
loading for creep calculations, or end of curing for shrinkage calculations, and
time being considered for analysis of creep or shrinkage effects.
ti is the age of concrete at time of load application (day).
V/S is the volume-to-surface ration (in).
f’ci is the specified compressive strength of concrete at time of prestressing for
pretensioned members and at time of initial loading for nonprestressed members.
If concrete age at time of initial loading is unknown at design time, f’ci may be
taken as 0.80 f’c (ksi)
Once obtained the creep coefficient, the loss due to creep can be obtained as
follows
∙
∙ (21)
∙ (22)
∆ ∙ (23)
where
εci is the instantaneous strain (initial elastic strain) due to loading.
εc is the deformation due to creep.

66
The values obtained for different maturity times have been represented in the
following figure. As can be observed in the figure below, the prestress loss caused by
creep of the concrete tends quickly to a value close to 9 kips (62.05 MPa). The final value
of 8.842 kips (90.97 MPa) obtained will be used in the calculations.
Figure 3-24 Prestress Loss per Tendon. Creep Loss ∆fpS(C)
The strain due to shrinkage at a time t can be calculated as (AASHTO, 2012):
0.48 ∙ 10 (24)
0.000
1.000
2.000
3.000
4.000
5.000
6.000
7.000
8.000
9.000
10.000
0 2000 4000 6000 8000 10000 12000 14000 16000
Δf p
S(C) (ksi)
Time (days)
NOTE: 1 ksi= 6.89 MPa
67
where
2 0.014 (25)
And the total shrinkage loss is determined by:
∆ ∙ (26)
The prestress loss caused by shrinkage of the concrete has been calculated for
different maturity times. The following figure, that summarize the results obtained, shows
how shrinkage loss tends asymptotically to a value close to 13 ksi (89.63 MPa). The final
value of 13.188 ksi (90.93 MPa) obtained has been used to determine the long term
prestress force.

68
Figure 3-25 Prestress Loss per Tendon. Shrinkage Loss ∆fpS(SH)
Finally, the loss caused by the relaxation of the strands is determined by the
following equation:
(27)
in which
1 0.55 (28)
where
k is 30 for low relaxation strands.
t is the duration of loading in hours.
0.000
2.000
4.000
6.000
8.000
10.000
12.000
14.000
0 2000 4000 6000 8000 10000 12000 14000 16000
Δf p
S(SH
) (ksi)
Time (days)NOTE: 1 ksi = 6.89 MPa

69
The values obtained for the steel relaxation loss for different times after loading
are represented in the following graphic. A final value of 14.027 ksi (96.72 MPa) has
been considered in the calculations.
Figure 3-26 Prestress Loss per Tendon. Steel Relaxation Loss ∆fpS(RL)
3.4.2.2 Load-Balancing Force
An advantageous feature of draped post-tensioned tendons is that they develop
a vertical force capable of counteracting or balancing the external loads applied to the
prestressed member. This load is equal to the force required to keep the tendon in its
draped shape at jacking. The following figure shows the load-balancing effect of a
parabolic draped tendon.
0.000
2.000
4.000
6.000
8.000
10.000
12.000
14.000
16.000
0 5000000 10000000 15000000 20000000 25000000
Δf p
S(RL) (ksi)
TimeNOTE: 1 ksi = 6.89 MPa
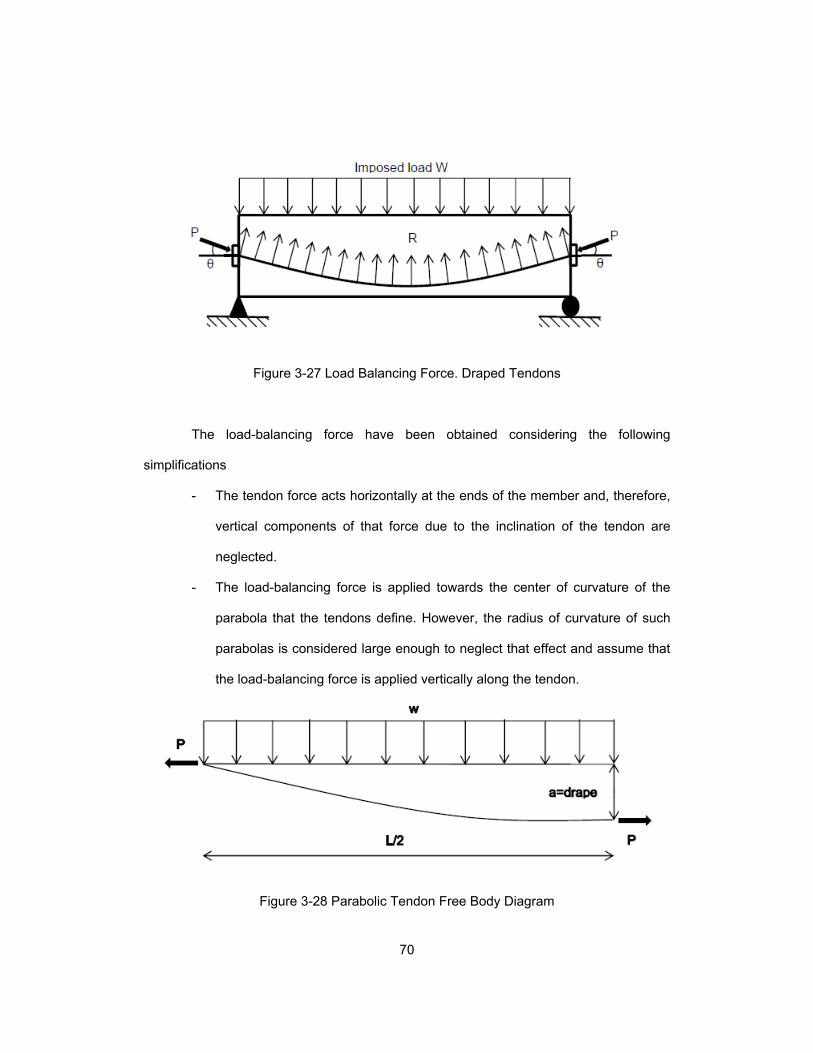
70
Figure 3-27 Load Balancing Force. Draped Tendons
The load-balancing force have been obtained considering the following
simplifications
- The tendon force acts horizontally at the ends of the member and, therefore,
vertical components of that force due to the inclination of the tendon are
neglected.
- The load-balancing force is applied towards the center of curvature of the
parabola that the tendons define. However, the radius of curvature of such
parabolas is considered large enough to neglect that effect and assume that
the load-balancing force is applied vertically along the tendon.
Figure 3-28 Parabolic Tendon Free Body Diagram

71
Figure 3-28 shows the free body diagram at mid-span of a parabolic tendon. By
the application of equilibrium equations, taking summation of moments from the left end:
∑ 0 (29)
∗ ∗ (30)
(31)
Considering the previously exposed, the load-balancing force applied to the
model for each type of tendon takes a value of:
∗ . ∗ .4.944 ⁄ 73.305 ⁄ (32)
∗ . ∗ .3.361 ⁄ 49.833 ⁄ (34)
∗ . ∗ .1.779 ⁄ 23.377 ⁄ (35)
And the total load-balancing force is:
2 ∗ 2 ∗ 2 ∗ 20.168 ⁄ 299.031 ⁄ (36)
3.3.3 Element Types
As explained above, two different types of parts have been included in the model:
the 3D deformable homogeneous solid and 3D wires with truss sections. Abaqus library
includes, for each type of part to be modeled, two types of finite elements (FE): linear
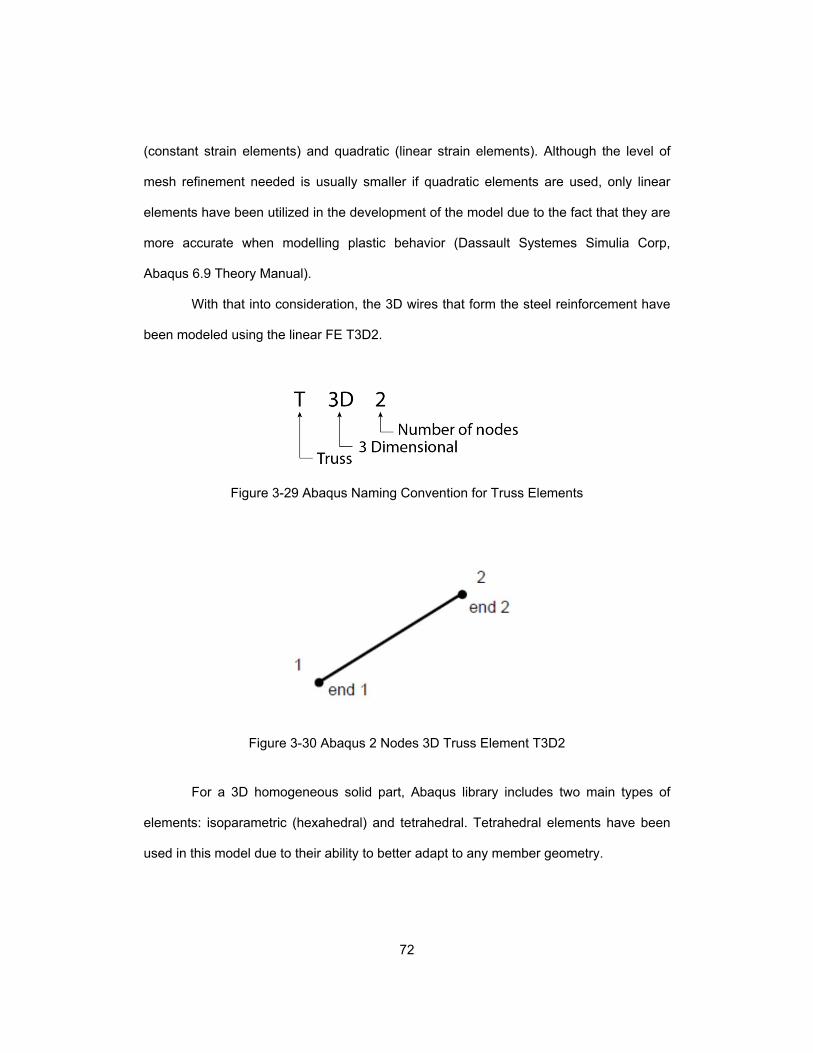
72
(constant strain elements) and quadratic (linear strain elements). Although the level of
mesh refinement needed is usually smaller if quadratic elements are used, only linear
elements have been utilized in the development of the model due to the fact that they are
more accurate when modelling plastic behavior (Dassault Systemes Simulia Corp,
Abaqus 6.9 Theory Manual).
With that into consideration, the 3D wires that form the steel reinforcement have
been modeled using the linear FE T3D2.
Figure 3-29 Abaqus Naming Convention for Truss Elements
Figure 3-30 Abaqus 2 Nodes 3D Truss Element T3D2
For a 3D homogeneous solid part, Abaqus library includes two main types of
elements: isoparametric (hexahedral) and tetrahedral. Tetrahedral elements have been
used in this model due to their ability to better adapt to any member geometry.

73
Figure 3-31 Abaqus Naming Convention for Continuum Elements
Figure 3-32 Abaqus 4 Nodes 3D Tetrahedral Element C3D4
3.3.4 Mesh Generation
Finite element models accuracy depends not only on the type of elements
selected but also on the number of them. A smaller size of element and, consequently, a
larger number of them, results in the development of more accurate models. Models with
mesh maximum sizes varying from 15 to 5 inches (381 to 127 mm) have been generated
and analyzed. It was found that the computer does not have capacity to run models with
mesh sizes below 5 inches (127 mm), for a total of approximately 77,000 nodes. The
following table summarizes the main characteristics of the meshes analyzed.
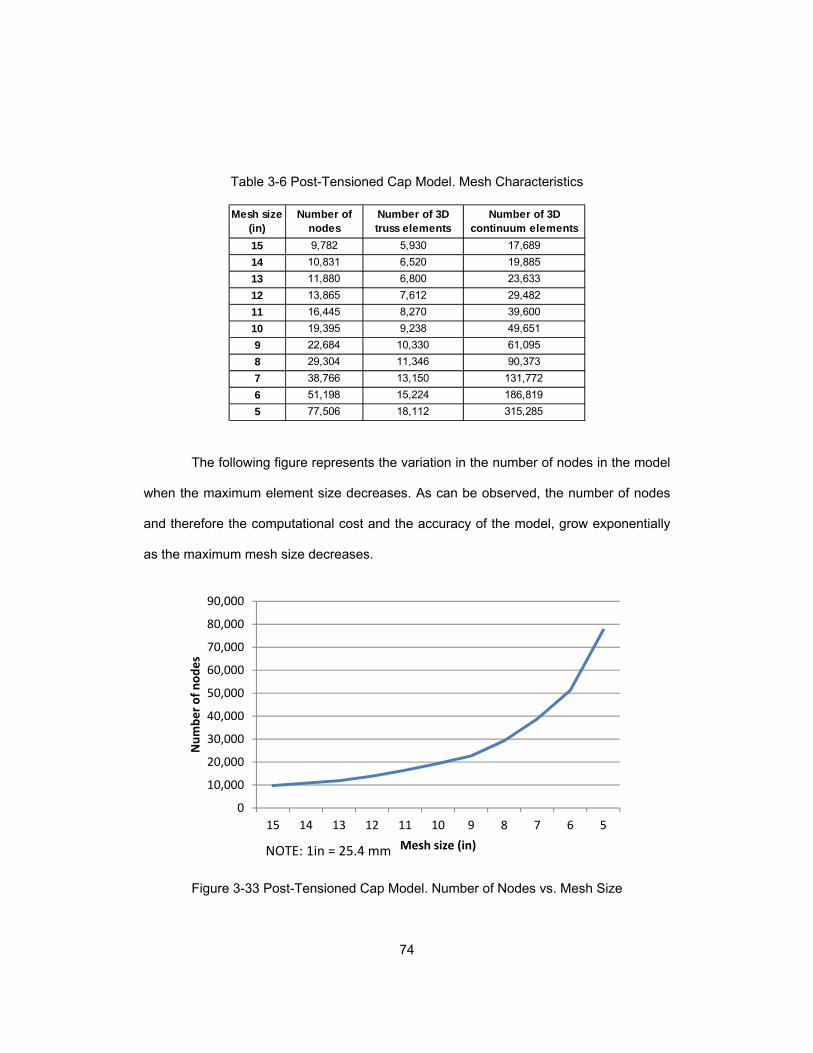
74
Table 3-6 Post-Tensioned Cap Model. Mesh Characteristics
The following figure represents the variation in the number of nodes in the model
when the maximum element size decreases. As can be observed, the number of nodes
and therefore the computational cost and the accuracy of the model, grow exponentially
as the maximum mesh size decreases.
Figure 3-33 Post-Tensioned Cap Model. Number of Nodes vs. Mesh Size
Mesh size (in)
Number of nodes
Number of 3D truss elements
Number of 3D continuum elements
15 9,782 5,930 17,689
14 10,831 6,520 19,885
13 11,880 6,800 23,633
12 13,865 7,612 29,482
11 16,445 8,270 39,600
10 19,395 9,238 49,651
9 22,684 10,330 61,095
8 29,304 11,346 90,373
7 38,766 13,150 131,772
6 51,198 15,224 186,819
5 77,506 18,112 315,285
0
10,000
20,000
30,000
40,000
50,000
60,000
70,000
80,000
90,000
15 14 13 12 11 10 9 8 7 6 5
Number of nodes
Mesh size (in)NOTE: 1in = 25.4 mm

75
Figure 3-34 Post-Tensioned Cap Model.5 Inches (127 mm) Mesh Size Detail
3.3.5 FEM validation
To determine if the model developed tends to the correct solution when the mesh
is refined, one of the results obtained has to be checked using alternative procedures. To
optimize the model development procedure, the result to be confirmed has to be chosen
so that the time required in that verification is limited to the minimum.
The solution obtained implies that the concrete element remains within the elastic
limits for both top and bottom fiber stresses under the bending action:
- The top fiber compression stress at maximum moment section is found to be
2,106.2 psi (14.52 MPa), below the elastic limit of 3,000 psi (20.684 MPa)
defined in the material model.

76
- The bottom fiber compression stress at maximum moment section is found to
be 539.4 psi (3.72 MPa), below the elastic and fracture limit of 587.88 psi
(4.053 MPa).
Figure 3-35 Post-Tensioned Cap. Bending Stresses (psi) Distribution.
5 Inches (127 mm) Mesh Model
Under those circumstances, simplified hand calculations performed with the
following assumptions provide accurate enough reference values to check the adequacy
of the results obtained:
- The structure behaves elastically and, therefore, the superposition principle
is applicable.

77
- Straight sections before deformation remain straight after deformation
(Bernoulli’s hypothesis).
- The contribution of the longitudinal steel to the section strength will be
neglected, so that there is no need of transforming the different materials that
form the structural section.
The calculations performed under these hypotheses are included in Appendix E.
The results obtained are shown in the following table. There are small differences due to
already mentioned approximations in the hand calculations. As can be seen, the model
developed adequately simulates the structural behavior of the bent cap.
Table 3-7 Post-tensioned Concrete Cap Model. Validation Analysis. US Units
Table 3-8 Post-Tensioned Concrete Cap Model. Validation Analysis. SI Units
Max. Bottom Fiber Stress.
Model (psi)
Max. Bottom Fiber Stress.
Hand Calculations (psi)Difference (psi)
539.4 560.5 21.1
Max. Top Fiber Stress.
Model (psi)
Max. Top Fiber Stress.
Hand Calculations (psi)Difference (psi)
‐2,106.2 ‐2,066.7 39.5
Max. Bottom Fiber Stress.
Model (MPa)
Max. Bottom Fiber Stress.
Hand Calculations (MPa)
Difference
(MPa)
0.4 0.4 0.0
Max. Top Fiber Stress.
Model (MPa)
Max. Top Fiber Stress.
Hand Calculations (MPa)
Difference
(MPa)
‐1.5 ‐1.4 0.1

78
3.4 Steel-Concrete Composite Cap Model
3.4.1 Introduction
The steel-concrete composite concrete cap has the following characteristics:
- It has been modeled as a simply supported beam, spanning between the two
columns a total length of 74.5 ft. (22.708 m).
- The cross section of cap consists of a steel box girder with a top slab 10
inches (254 mm) thick. The connection between these two elements is
achieved by the use of studs embedded in the concrete section after pouring.
- The cap serves as support for 10 girders (5 from the backward span and 5
from the forward span). Although the bridge built has only three girders per
span, its section is planned to be widened in the future by the addition of two
new girders.
The following figures summarize the main features of the steel-concrete
composite cap modeled. Additional information can be found in Appendix A.
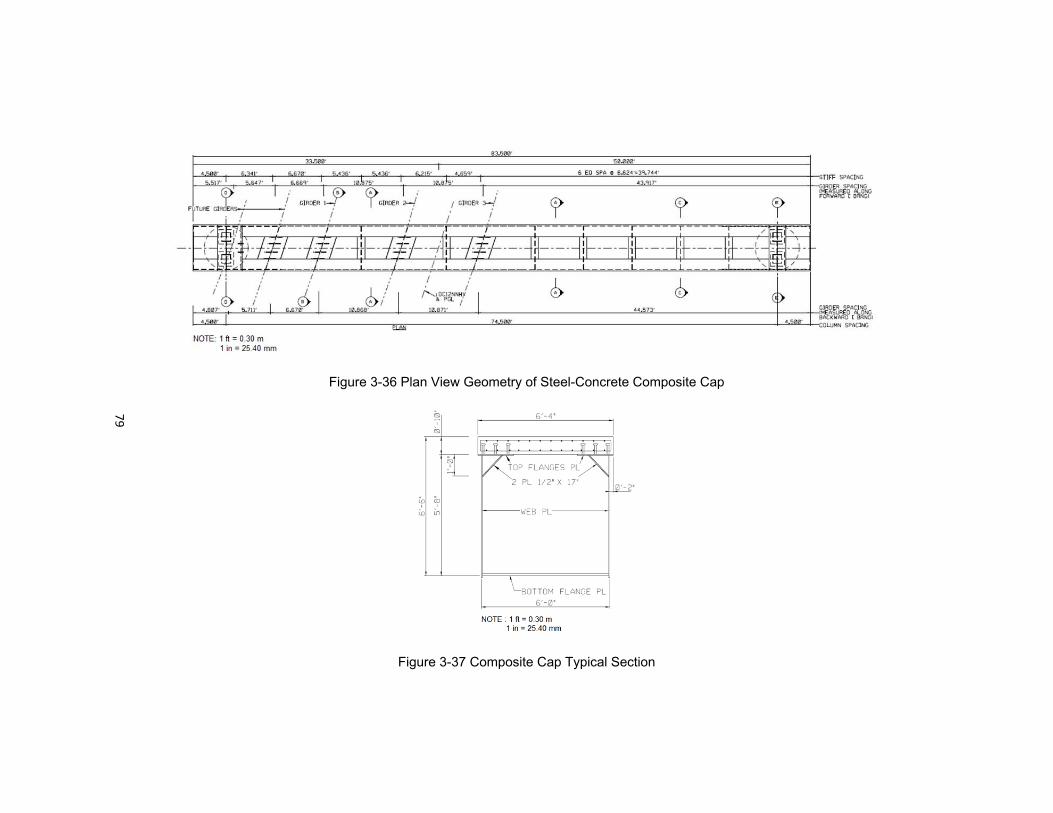
79
Figure 3-36 Plan View Geometry of Steel-Concrete Composite Cap
Figure 3-37 Composite Cap Typical Section
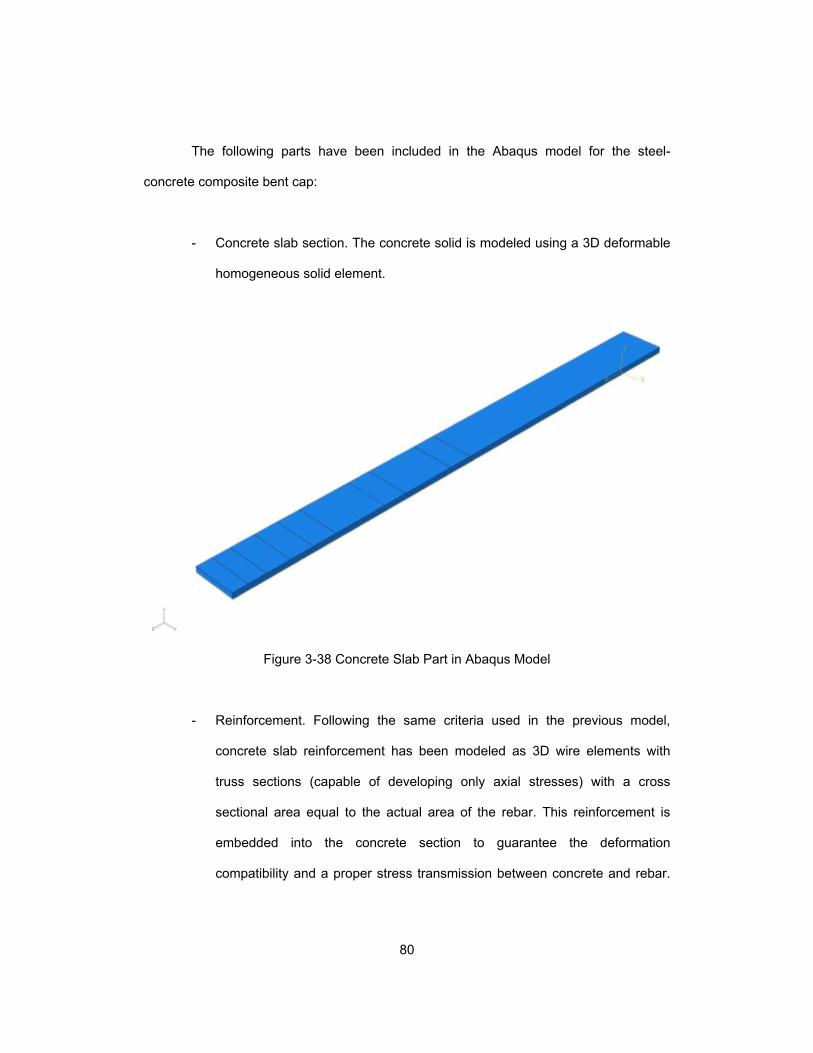
80
The following parts have been included in the Abaqus model for the steel-
concrete composite bent cap:
- Concrete slab section. The concrete solid is modeled using a 3D deformable
homogeneous solid element.
Figure 3-38 Concrete Slab Part in Abaqus Model
- Reinforcement. Following the same criteria used in the previous model,
concrete slab reinforcement has been modeled as 3D wire elements with
truss sections (capable of developing only axial stresses) with a cross
sectional area equal to the actual area of the rebar. This reinforcement is
embedded into the concrete section to guarantee the deformation
compatibility and a proper stress transmission between concrete and rebar.

81
In that way, the degrees of freedom of the truss elements that form the
reinforcement wires are constrained by the adjacent concrete solid elements.
Figure 3-39 Reinforcement Parts in Concrete Slab
- Steel cap section. The steel section is modeled using 3D deformable shell
elements. It is considered simply supported at both ends (pinned-roller
boundary conditions). The top flange of the steel cap section is tied to the
bottom surface of the concrete slab to guarantee compatibility in the
deformations and a correct stress transmission between the two elements.
Using the tie interaction, the degrees of freedom of the nodes in the concrete
slab surface are constrained by the degrees of freedom of the nodes in the
steel cap surface.

82
Figure 3-40 Steel Cap Part in Abaqus Model
- Stiffeners and diaphragms. Stiffeners have to be added to the model to
prevent the failure of the steel plates due to instabilities when subjected to
compressive stresses. Three types of stiffeners have been included:
diaphragms at support locations, girder stiffeners at girder locations and
interior stiffeners distributed along the length of the member. In all the cases,
stiffeners are modeled as 3D deformable homogeneous shells. The correct
interaction between the steel cap section and the stiffeners is achieved by
merging both stiffeners and steel cap section. After the merging process, the
combination of the different elements behaves as a single part.

83
Figure 3-41 Stiffeners and Diaphragms Parts in Abaqus Model
3.4.2 Element Types
For this model, three different types of elements have been used: 3D deformable
homogeneous solid, 3D wires with truss sections and 3D deformable shells. The first two
types have been previously described. For the 3D shell elements, like for the rest of the
element types to be used in structural analyses, Abaqus library includes two types of
finite elements (FE): linear (constant strain elements) and quadratic (linear strain
elements). Although the level of mesh refinement needed is usually smaller if quadratic
elements are used, only linear elements have been utilized in the development of the
model due to the fact that they are more accurate when modelling plastic behavior
(Dassault Systemes Simulia Corp, Abaqus 6.9 Theory Manual).
For a 3D conventional shell element, Abaqus library includes two main types of
elements: triangular and rectangular. Triangular elements have been used in this model

84
due to their ability to better adapt to any member geometry. With that into consideration,
the 3D shells that form the steel cap, the stiffeners and the diagrams have been modeled
using the linear FE S3.
Figure 3-42 Abaqus Naming Convention for
Conventional Shell Elements
Figure 3-43 Abaqus 3 Nodes 3D Conventional Shell Element S3
3.4.3 Mesh Generation
Following the same procedure described for the post-tensioned cap model,
meshes varying from 15 to 3 inches (381 to 76.2 mm) have been investigated. The
computer utilized reached its computational capacity limit for the 3 inches (76.2 mm)
model, for a total of approximately 93,000 nodes. The following table summarizes the
main characteristics of the meshes analyzed.
S 3
Conventional shell
Number of nodes

85
Table 3-9 Composite Bent Cap Model. Mesh Characteristics
The following figure represents how the number of nodes in the model varies
when decreasing the maximum element size. As can be observed, the number of nodes
and therefore the computational cost and the accuracy of the model, grow exponentially
as the maximum mesh size decreases.
Figure 3-44 Composite Cap Model. Number of Nodes vs. Mesh Size
Mesh size (in)
Mesh size (mm)
Number of nodesNumber of 3D truss elements
Number of 3D shell elements
Number of 3D continuum elements
15 381.0 4,675 1,534 5,139 2,062
14 355.6 5,153 1,664 5,746 2,211
13 330.2 5,479 1,768 5,895 2,609
12 304.8 6,517 1,924 7,445 3,014
11 279.4 7,187 2,106 7,902 3,839
10 254.0 8,600 2,314 9,547 5,416
9 228.6 10,134 2,574 11,110 7,876
8 203.2 12,812 2,886 13,794 12,453
7 177.8 16,089 3,302 16,627 18,402
6 152.4 20,456 3,848 21,030 24,900
5 127.0 30,332 4,628 33,079 38,735
4 101.6 49,154 5,798 50,679 82,148
3 76.2 93,025 7,722 93,336 185,470
0
10,000
20,000
30,000
40,000
50,000
60,000
70,000
80,000
90,000
100,000
15 14 13 12 11 10 9 8 7 6 5 4 3
Number of nodes
Mesh size (in)NOTE: 1 in = 25.4 mm

86
Figure 3-45 Composite Cap Model. 3 Inches (76.2 mm) Mesh Detail
3.4.4 FEM Validation
Following the same procedure outlined for the previous model, the composite
cap model will be validated by the determination of the bending stresses using alternative
methods. The following figures show the bending stresses distribution in both the
concrete slab and the steel section.

87
Figure 3-46 Bending Stresses (psi) Distribution in Concrete Slab.
3 Inches (76.2 mm) Mesh Model
Figure 3-47 Bending Stresses (psi) Distribution in Steel Section.
3 Inches (76.2 mm) Mesh Model

88
Simplified hand calculations to check the accuracy of the model developed have
been performed with the following assumptions:
- The structure behaves elastically and, therefore, the superposition principle
is applicable. Also, this assumption allows the consideration of a
homogeneous section after the transformation of the concrete slab into an
equivalent structural steel section.
- Straight sections before deformation remain straight after deformation
(Bernoulli’s hypothesis).
- The contribution of the longitudinal steel to the section strength will be
neglected.
The calculations performed under these hypotheses are included in Appendix E.
The results obtained are shown in the following table. There are small differences due to
simplifications adopted in the hand calculations. As can be seen, the model developed
adequately simulates the structural behavior of the bent cap.
Table 3-10 Composite Cap Model. Validation Analysis. US Units
Max. Bottom Fiber Stress.
Model (psi)
Max. Bottom Fiber Stress.
Hand Calculations (psi)Difference (psi)
52,930.0 49,908.6 3,021.4
Max. Top Fiber Stress.
Model (psi)
Max. Top Fiber Stress.
Hand Calculations (psi)Difference (psi)
‐5,356.0 ‐5,099.4 256.6
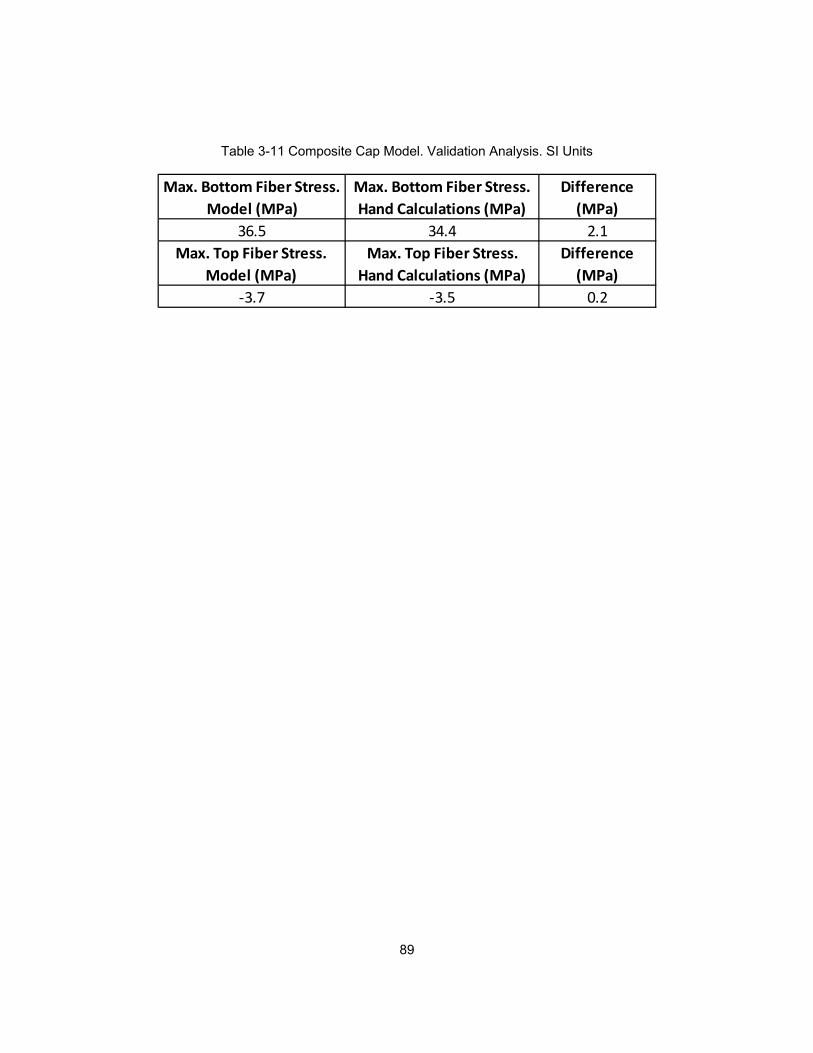
89
Table 3-11 Composite Cap Model. Validation Analysis. SI Units
Max. Bottom Fiber Stress.
Model (MPa)
Max. Bottom Fiber Stress.
Hand Calculations (MPa)
Difference
(MPa)
36.5 34.4 2.1
Max. Top Fiber Stress.
Model (MPa)
Max. Top Fiber Stress.
Hand Calculations (MPa)
Difference
(MPa)
‐3.7 ‐3.5 0.2

90
Chapter 4
COST ESTIMATE AND SCHEDULE
This chapter describes the methods followed in the estimation of the cost and
construction time of the two structural typologies described. First, the materials and
activities involved are identified. In the second part of the chapter, actual unit costs for the
LBJ project are applied to obtain the corresponding estimates. Finally, the time required
for the construction of the two solutions and the time the traffic will be impacted for both
of them are determined.
4.1. Materials and Activities Identified
4.1.1 Post-Tensioned Bent Cap
The following materials are to be used in the construction of the post-tensioned
concrete bent cap:
- Concrete with a nominal compressive strength of 6,000 psi (41.37 MPa).
- Grade 60 reinforcing steel.
- Grade 270 low relaxation prestressing steel.
- Other materials and elements, such as grout, plastic ducts and end
anchorages.
The construction process for the post-tensioned concrete bent cap consists of
the following activities:

91
- Shoring structure placement. A shoring structure will be required to resist the
self-weight of the post-tensioned cap until the moment it has enough strength
to become a self-supporting structure. A long term closure to traffic has to be
performed in the roadway below the bent cap. This closure will extend up to
the end of the bent cap construction process.
- Form work. This activity consists of the placement of the forms that will
provide the concrete element the desired shape.
- Rebar placement. Working inside the forms previously placed to layout the
rebar will be difficult and time consuming. For that reason, the cage formed
by the rebar is prepared at ground level ant then lifted to its final position
inside the forms. This activity is performed simultaneously to the previous
one.
- Placement of additional elements for prestressing tendons (ducts and end
anchorages). This activity is performed simultaneously to the previous one.
- Concrete pouring. After the rebar, ducts and end anchorages are placed, the
concrete is poured and vibrated. Enough curing time has to be provided for
the concrete to achieve the minimum required strength to perform the
following activity. For typical concretes fabricated with cement Type I and
moist-cured, the variation of strength with time is defined by (Wight &
MacGregor, 2012):
. . (37)
where
f’ci is the concrete strength at time t (psi).
t is the curing time (days).
92
f’c is the nominal concrete strength (psi).
Solving for t in the previous equation,
. (38)
Considering a nominal concrete strength of 6,000 psi (41.37 MPa) and a required
strength at jacking of 5,000 psi (34.47 MPa), the stressing of the tendons cannot
occur before 12 days after pouring of the concrete.
- Tendons placement, stressing and ducts grouting. Once the concrete has
achieved the required strength, tendons are placed in the ducts. After
tensioning them to its final stress, the ducts are grouted to prevent corrosion
and ensure adherence between tendons and ducts and the surrounding
concrete.
- Form work and shoring structure removal. After tensioning the tendons, the
structure is ready to sustain its own self-weight. Both forms and auxiliary
structure are removed, and traffic can be restored in the roadway below the
bent cap.
4.2.2 Composite Bent Cap
The following materials are to be used in the construction of the composite bent
cap:
- Concrete with a nominal compressive strength of 6,000 psi (41.37 MPa).

93
- Grade 60 reinforcing steel.
- A709 Grade 50 structural steel.
The construction process of the composite bent cap comprises a lower number
of activities when compare with the post-tensioned concrete cap process. The activities
identified are:
- Concrete slab form work. After the delivery of the steel section to the
construction site, the forms that will allow the pouring of the concrete slab are
placed. This activity is performed at ground level prior to the placement of the
cap on its final location, so traffic is not impacted.
- Rebar placement. The concrete slab reinforcement is placed. This activity is
also performed prior the lifting and placement of the pier cap on top of the
columns.
- Concrete pouring. After the rebar is placed, the concrete is poured and
vibrated. Enough curing time has to be provided prior to removing the form
work. This activity is performed at ground level. To proceed with the lifting
and placement activity, a minimum concrete strength in the slab is required
so the section is capable of supporting its self-weight. Considering a
minimum required strength of 3,000 psi (20.68 MPa) and a nominal concrete
strength of 6,000 psi (41.37 MPa), following the same procedure outlined
before, the lifting and placement of the cap cannot occur before 4 days after
pouring the concrete slab.
- Form work removal. Once the concrete slab has developed enough form
work can be removed. This is the last activity to be performed at ground

94
level. After the form work is removed, the pier cap is ready to be place on its
final position.
- Lifting and placement of the composite cap in place supported by the already
built cast in place columns. IH35E shall be closed to traffic during this
operation, but it can be restored after finishing the operation. Because of the
short time required to place the cap on its final position, only a night closure
of IH35E is required.
Figure 4-1 Composite Bent Cap Ready to be Placed

95
Figure 4-2 Lifting of Composite Bent Cap
4.2. Unit Costs and Cost Estimate
The cost of developing a project can be obtained as the summation of the
following costs for each of the materials and activities identified:
- Direct cost. It can be defined as the cost of material, labor and equipment
directly used for the construction of a unit measurement of the activities
identified for the project. This cost, provided that the construction processes
are optimized, should not significantly vary depending on the company
performing the work.

96
- Indirect cost or general expenses. It is included in this category the cost of all
the auxiliary items that the contractor needs to properly develop his activity
but that are not specifically related to any of the construction activities
identified for the project. This cost may greatly vary depending on the
construction company policies and internal methods of operation.
To make the results obtained independent from the company performing the
activities, only direct cost will be evaluated. Two set of values are needed in order to
estimate the direct cost of the bent cap construction:
- Unit cost for each of the materials and activities identified. A problem that the
cost estimator has to face when approaching the development of a cost
estimate for a given project is the lack of accurate unit costs. The main
reason for this lack of information is the construction companies’ refusal to
make public their costs of operation in a highly competitive market. The unit
costs used in this study are actual costs
- Quantity takeoff for each of the materials and activities. Quantities have been
calculated based on the project drawings. A summary of the values obtained
is shown in Appendix F.
For cost estimation purposes, the previously described activities have been
grouped in some cases. The direct cost consequence of the time the IH35E freeway shall
be closed for the construction of both solutions (lane rentals) and the indirect cost caused
to the city economic activity have not been considered in the estimates. However, the
time during which traffic will be affected has been determined as explained in the

97
following subchapter. Considering that these direct and indirect costs are proportional to
the time the traffic is impacted, a comparison can be established.
Maintenance cost for the two alternatives analyzed has not been considered. In
general, because of the need of restoring the corrosion protective coating in the steel
section, the composite cap will have a higher maintenance cost during its life cycle than
the post-tensioned solution. However, an accurate actual unit cost for the replacement of
such coating was not available.
A total direct cost of $207,373.36 have been obtained for the post-tensioned bent
cap compare to a total of $199,867.37 calculated for the composite solution. Detailed
calculations are shown in Appendix F.
4.3 Activities Duration
Different construction scheduling techniques with varying accuracy and
complexity were identified during the literature review phase of this research. Because of
the short amount of time and reduced number of operations that the construction of the
two proposed solutions imply, the bar (Gantt) chart technique has been used.
The duration of the activities to be performed for the construction of both
solutions have been obtained by directly surveying construction engineers working on the
project.
Because of the importance of the roadway affected by the bridge construction, it
has been assumed that the work is performed during the seven days of the week. In
order to estimate the time in which the traffic on IH35E will be impacted during the
construction of the two solutions, activities that imply a conflict with the traffic below the

98
bridge have been differentiated from those that do not. The following Gantt charts show
the time required for the construction of each of the solutions proposed.

99
Figure 4-3 Post-Tensioned Bent Cap Construction Schedule
Figure 4-4 Composite Bent Cap Construction Schedule
ACTIVITY 1 2 3 4 5 6 7 8 9 10 11 12 13 14 15 16 17 18 19 20 21 22 23
Shoring structure placement
Form work
Rebar work
Post‐tensioning additional elements
Concrete pouring
Tendons placement, stressing and grouting
Form work removal
Shoring structure removal
Activities requirring traffic closure
Activities not requirring traffic closure
DAYS
CURING TIME
ACTIVITY 1 2 3 4 5 6 7 8 9 10
Concrete slab form work
Rebar placement
Concrete pouring
Form work removal
Lifting and placement
Activities requirring traffic closure
Activities not requirring traffic closure
CURING TIME
DAYS
100
Based on the results obtained, the construction of the post-tensioned solution
requires 23 days and affects the traffic below during the complete construction time.
However, the composite solution requires only 10 days to be finished once the steel
section have arrived to the site, with only one day (actually, a few hours during a night)
impacting the IH-35E traffic. Therefore, the alternative proposed improves the
construction time required a limits to the minimum the interferences with traffic on the
existing roadway.
101
Chapter 5
SUMMARY AND RESULTS DISCUSSION
A summary of the topic investigated in this research is included in this chapter
together with a description and analysis of the results obtained. In the first part of the
chapter, a summary of the case under study and the analysis performed is presented.
The second part describes the modelling techniques and validation methods used. Also,
results obtained are discussed and the main differences between the two structures
modeled are established. The third part presents the results obtained in the cost
estimation performed. Finally, the construction schedules and times of impact to traffic
are compared.
5.1 Summary
Bridges constitute one of the most important elements in transportation projects
because of their impact in the cost and schedule of such projects. Properly determining
the most appropriate structural typology in the design of a bridge involves the contribution
of skilled and experienced professionals with different backgrounds. As a result, bridge
design can be optimized to obtain the expected outcome in terms of quality, safety, cost
and schedule.
The increasing competitiveness scenario construction companies have to deal
with due to the current market conditions have made the design optimization even more
important for the project’s success. In that sense, the availability of comprehensive and
detailed guidance documents describing the new processes, techniques and structural

102
typologies is extremely important to ensure that engineers properly comply with their
commitment with the society.
The evolution of pier typologies is a consequence of the intensive use of bridges
caused by the changes in our transportation infrastructures (Zhao & Tonias, 2012). The
evolution of the urban areas and consequently the increase in their population, translates
into increasing traffic volumes that, eventually, may overcome the existing transportation
infrastructures capacity. The construction of new projects to increase the capacity of the
transportation system in consolidated urban areas generates conflicts with existing
infrastructures that requires the development of new construction processes, techniques
and structural typologies to limit the impact on the traffic.
Structural prefabricated systems have been successfully used in different
structure typologies with the well-known advantages:
- Reduction of the construction time and the number of operations to be
performed in situ.
- Improved in plant quality control.
- Work zone safety improvement.
- Lower environmental impact.
The development of bridge substructure prefabricated structural systems will add
to the previously exposed advantages a reduction in the number and time of traffic
detours and closures.
Researches proposing different bridge substructure precast systems using
concrete as main material are available, and different systems have been already used in
actual projects. For example, precast post-tensioned simply supported bent caps with an
inverted T section and with spans up to 58 ft. (17.68 m.) have been successfully used for
the u-section bridges along the managed lanes in the LBJ project. However, there is a

103
practical limit for the span length of these precast elements due to their self-weight to
allow for their safely lifting and placement.
The IH-635 Managed Lanes Project is located in North Dallas (Texas) and
comprises works on both IH-35 and IH-635 freeways. Started in early 2011, it is expected
to be completed and opened to public on summer 2015. After its completion, expected for
the end of summer 2015, it will increase noticeably the traffic capacity of this important
east-west corridor in Dallas.
Because of its complexity and the extensive use of bridges, the IH-35 IH-635
interchange became one of the major landmarks of the project. To provide direct access
from both Loop 12 to the new managed lanes, a new Loop 12-IH 635 WB direct
connector has been built. Its crossing over IH-35E has been solved with the construction
of Bridge 4.
The IH-35 and its existing interchange with IH-635 is a major traffic corridor in
Dallas area, supporting high traffic volumes, particularly during peak hours. The
construction of a new bridge using conventional design and construction methodologies
over this important corridor may imply closing the highway to the traffic and, therefore,
seriously impacting the traffic and overall economic activity in this important area of the
Metroplex.
The solution to be adopted may have to be prefabricated and simply supported
on the columns to limit to the minimum the impact to the traffic. With spans varying from
74.5 ft. to 86 ft. (22.71 to 26.21 m.) between supports, a precast prestressed concrete
bent cap would have been too heavy to be safely lifted. A composite steel-concrete bent
cap, consisting of a rectangular shaped section of steel with a top compression concrete
slab, was designed and built as a lighter alternative complying with the previously
mentioned requirements.

104
Two pier cap typologies have been presented in this dissertation. The first one
consist of the use of cast in place posttensioned concrete pier cap with a rectangular
section, and simply supported on concrete columns built at both sides of the affected
roadway. In this case, the pier cap will work as a prestressed concrete girder simply
supported at both ends. The original design of Bridge 4 used this typology in the crossing
over IH-35E in the LBJ project.
The second proposed typology tries to solve the weight problem that concrete
has as a material when used to fabricate substructure precast systems. This is achieved
by using a different material applied to the same structural concept: the use of a
composite steel-concrete section, constituted by a rectangular steel section topped by a
cast in place concrete slab to resist the top compression, and again simply supported at
both ends. This solution has also the advantage of simplifying the construction process
by changing the always arduous construction process of a post-tensioned concrete cap
on site on an elevated position by simply lifting and placing the steel-concrete section
once the concrete slab has reached enough strength to support its self-weight.
5.2 FEM Modelling and Results
Finite element models have been developed using the commercial software
Abaqus with the objective of accurately simulating the theoretical structural behavior of
both solutions reducing the computational cost to the minimum. These two models have
been developed under the following hypotheses:

105
- The concrete have been modeled as an elastic-plastic material with damage
simulation by using the concrete damage plasticity model (CDP model)
available in Abaqus.
- Three different types of steel have been used in the two models developed:
reinforcing steel, prestressing steel and structural steel. The three of them
have been modeled as elastic-plastic materials.
- Linear finite elements have been used in both models following the software
developer recommendations when modeling structures in which plastic
behavior may be encountered. Using linear elements improves the
convergence of the model and, therefore, reduces the computational cost.
- The contact surfaces between different elements and materials in the two
models have been modeled by directly constraining the degrees of freedom
of the nodes in contact to guarantee the deformation compatibility and an
adequate stress transfer between elements. Modeling these surfaces with
the method described reduces considerably the computational resources
required to run the model and does not affect noticeably the accuracy of the
model developed.
- In the case of the post-tensioned bent cap model, the prestressing tendons
have not been included in the model because of their low contribution to the
total stiffness of the section (Saiedi, 2007). Tendons overall effects on the
structure have been simulated by properly determining an equivalent set of
forces. In addition to a compressive force, a vertical force has been
determined by the application of the load balancing method. The equivalent
forces obtained using this procedure have been proof adequate to be used in
the modelling of post-tensioned bent cap structures.
106
The models developed with the previously described assumptions have been
validated by comparing the results obtained to alternative hand calculations. The
parameters chosen to validate the model were the bending stresses. This selection
allows reducing the time required for the validation process. The small differences
obtained are caused by the simplifications assumed in the hand calculations, like
neglecting the contribution of the rebar working in compression to the overall bending
capacity of the section.
Therefore, based on the results obtained, the models developed are considered
adequate to accurately simulate the structural behavior of the two alternative solutions
proposed.
The results obtained show that, for the post-tensioned concrete bent cap
alternative, the concrete section remains in the elastic range. Therefore, for the given
loading case and with the objective of optimizing the computational cost of running the
model, only the elastic behavior of the material needs to be considered. However, if
future lab tests are performed to determine the postfailure performance of the solution,
the concrete damage plasticity model is proposed to be used to account for the plastic
behavior of the material.
On the other hand, both concrete and steel sections are found to be working in
the plastic range in the composite bent cap model for the given loading case, so the
material properties cannot be simplified.
In terms of structural strength, both solutions show the capability of properly
resisting the imposed loads. The main difference in the structural response of the two
solutions is related to deformations. For that reason, the structural behavior comparison
has been performed in terms of serviceability instead of in terms of strength.

107
Figure 5-1 Post-Tensioned Cap Model. Deflections (inches)
Figure 5-2 Composite Cap Model. Deflections (inches)

108
Figures 5-1 and 5-2 show the deflection obtained for the two alternative
solutions. Maximum deflections values of 2.864 inches (72.75 mm) and 0.426 inches
(10.82 mm) are obtained, respectively, for the composite and post-tensioned solutions.
Based on the results obtained for the vertical displacement, it can be seen how the
composite bent cap design has a more flexible behavior that the post-tensioned cap
alternative.
Complying with the serviceability provisions about maximum deflection
(AASHTO, 2012) may not be a problem when using the post-tensioned solution.
However, the design of the composite bent cap solution has to account for that issue by
providing the steel section with a camber to counteract the deflection caused by the
loads.
5.3 Cost and Schedule Comparison
The cost of developing a project can be divided in two types. The first one, direct
cost, is defined as the cost of material, labor and equipment directly used for the
construction of a unit measurement of the construction activities identified for the project.
Since this cost is established directly by the market based on the supply and demand
rules, it is intrinsically independent from the company developing the project. The second
one, indirect cost, is defined as the cost of all auxiliary items the contractor needs to
perform the works but that are not specifically related to any of the construction activities
identified for the project. This cost, unlike direct cost, depends on particular structure and
methods of operation of the company in charge of developing the project.

109
To make the results obtained independent from the company performing the
activities, only direct cost have been evaluated. The cost of the two solutions proposed
have been obtained using real unit cost of the LBJ project and the quantities determined
based on the project drawings. Also, as stated before, the cost incurred by the possible
impacts on IH35E traffic have not been considered in the determination of the detailed
estimates shown in Appendix F, although the time of impact on the traffic has been
determined. Finally, the maintenance cost for the structural typologies studied has not
been considered because of a lack of actual unit costs. Due to the requirement of
replacing the corrosion protective coating of the steel section, the maintenance cost
during the life cycle of the composite solution will be higher than for the post-tensioned
alternative.
A total direct cost of $207,373.36 have been obtained for the post-tensioned bent
cap compare to a total of $199,867.37 calculated for the composite solution. The results
obtained show that, if traffic impact cost is not considered, the direct cost is very similar
for the two proposed solutions. However, for the particular project in hand, the lane rental
cost of closing IH35E makes the cast in place option unviable.
The main difference between the uses of one of the proposed alternatives is
found after evaluating the construction time required and the duration of the traffic closure
needed. A total of 23 days are required to build the post-tensioned solution, with a traffic
closure needed for the total duration of the construction activities. However, and provided
that the steel section is delivered to the site at the proper timing, casting the concrete
slab and lifting the bent cap to its final position only takes 10 days, with only one night
impacting the traffic on IH-35E.
Therefore, after the evaluation of the direct cost, construction schedule and traffic
impacts, the proposed composite structural typology is considered a valid alternative to

110
be used as a prefabricated system in long span bridge substructure elements to limit
impact caused to existing transportation structures.

111
Chapter 6
CONCLUSIONS AND RECOMMENDATIONS FOR FUTURE RESEARCH
6.1 Conclusions
The following conclusions can be drawn from the research conducted:
- The modelling techniques applied during the performance of this dissertation
are adequate and serve to the purpose of accurately modeling the structural
behavior of the two structural typologies analyzed.
- The composite prefabricated bent cap has a more flexible behavior than the
post-tensioned cast in place one. Special attention needs to be paid to the
serviceability limits in the design of such bent cap typology.
- In the cases in which no conflicts with traffic are expected, the construction
cost (maintenance cost has not been considered) is very similar for the two
solutions proposed.
- The construction time for the composite alternative (10 days), provided that
the steel section has been ordered in advance and has been delivered as
required, is half of the time required to finish the construction of the cast in
place solution (23 days).
- While the construction of the post-tensioned solution requires closing IH-35E
for 23 days, with the traffic closure associated cost and impacts on the traffic,
the prefabricated composite alternative limits it to one night.
- Based on the results obtained, the composite bent cap typology presented in
this research is considered adequate to be proposed as a bridge
112
substructure prefabricated system to limit the impact on existing
transportation infrastructures for the use in cases in which the span length
required impedes the use of concrete based solutions.
6.2 Recommendations for Future Research
The following recommendations are presented as proposal for future researches
about bridge substructure elements in general and about the two pier caps typologies
analyzed in this study in particular:
1. The concrete damage plasticity model have been used in the
development of the two finite element models included in this research
because of its capability of modeling the inelastic behavior of concrete
both in tension and compression. The accuracy of the parameters used
to define the concrete material model is essential to properly simulate the
structural behavior of the element under analysis. Developing a database
of values to be used as a function of the concrete nominal strength in the
application of the CDP model will be useful for future researches.
2. Bridge substructure precast systems have been widely analyzed in
previous researches. However, all the solutions found are based on the
use of concrete as main construction material. Concrete precast
elements, although easier to implement as standardized systems, have
as a counterpart their weight, that limits the size of element that can be
safely lifted and placed. Lighter solutions may be explored in order to
propose prefabricated or semi-prefabricated systems capable of
113
spanning longer distances to be used in beyond the limits of application
of such precast systems. The composite section analyzed in this
research is proposed as an economic feasible alternative to be further
investigated in future studies about prefabricated bridge substructure
systems.
3. The connection between the post-tensioned concrete cap and the cast in
place columns has been modeled as a pin support. Releasing the
rotation at both ends of the member minimizes the moment transferred to
the columns. Typically, the idealized pin support is achieved in actual
structures by the use of elastomeric bearing pads. However, the design
and construction of a connection system that behaves similarly to the
idealized pin support and that, at the same time, allows for the
application of the prestress force in situ is not always easy. The
connection detail proposed by the project design team could not be
included in the model developed because of the computation limitations
of the computer used. In order to confirm the adequacy of the system
proposed, and to improve it if possible, further analyses should be
performed. Additional information regarding the proposed connection can
be found in Appendix A.

114
Figure 6-1 Post-Tensioned Cap. End and Support Detail
Figure 6-2 Post-Tensioned Cap. Detail A

115
Figure 6-3 Post-Tensioned Cap. Transverse Section at Support
4. Determining the most suitable structural typology for a given case is a
difficult task that involves the participation of skilled and experienced
professionals with different backgrounds. The importance of properly
selecting the bridge substructure typology to be used for the success of a
project has been sufficiently justified in the research conducted. Example
of factors that may determine the optimum design are: superstructure
typology, height of the pier cap, availability of space for the pier cap
foundation, possible impacts to traffic in existing roadways and
scheduling and cost constraints. In order to help the Structural Engineer
in taking such important decisions, the development of a comprehensive
database and selection model for optimum bridge substructure design
and construction is proposed for future researches.

116
5. The main disadvantage of the composite bent cap solution proposed is
the flexibility of the element. The development of large deflections under
the application of the design loads requires the fabrication of the steel
section with a predefined camber in order to comply with the
serviceability limits established in the applicable codes provisions. In
those cases in which different structural typologies are used in the two
pier caps supporting a span, the difference in the deflection developed at
each end can generate additional stresses in the bridge superstructure
and slab joints. This effect can be amplified in cases in which, like in the
span 7 of the bridge studied, the exterior girders are alternatively located
at the point of maximum deflection of the bent cap. The analysis of the
importance of the torsional stresses introduced in the bridge
superstructure and slab joints is proposed for a future research.

117
Appendix A
Bridge 4 Drawings

118
The following drawings show the preliminary design of the post-tensioned
concrete bent cap and the final design for the composite steel-concrete bent cap. All
names and initials have been removed from the sheets for privacy purposes.
Unit conversion factors: 1 ft. = 0.30 m.
1 in = 25.40 mm

119
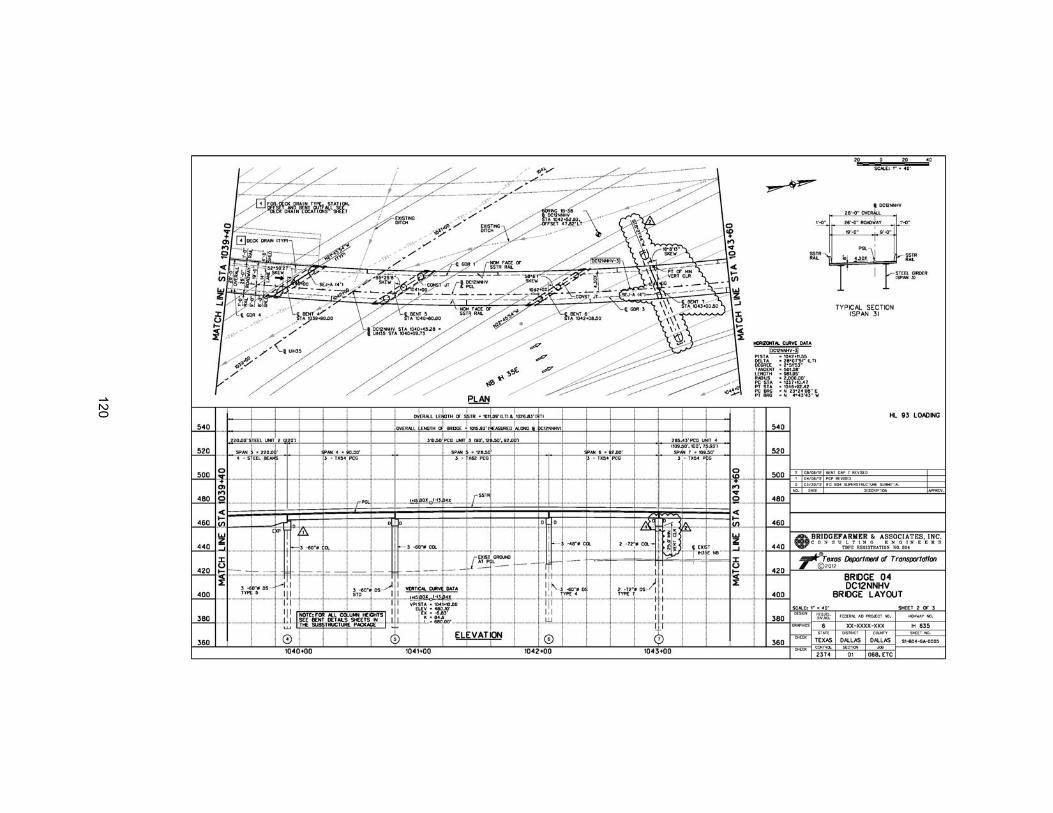
120

121

122

123

124

125

126

127
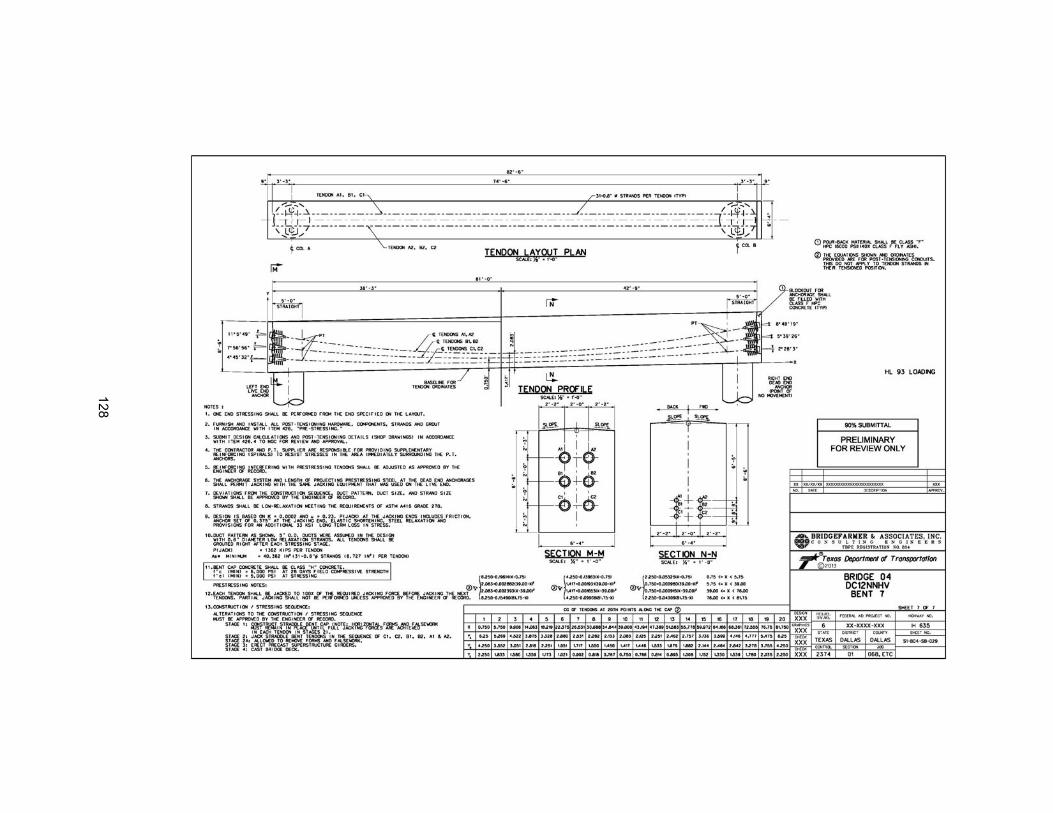
128
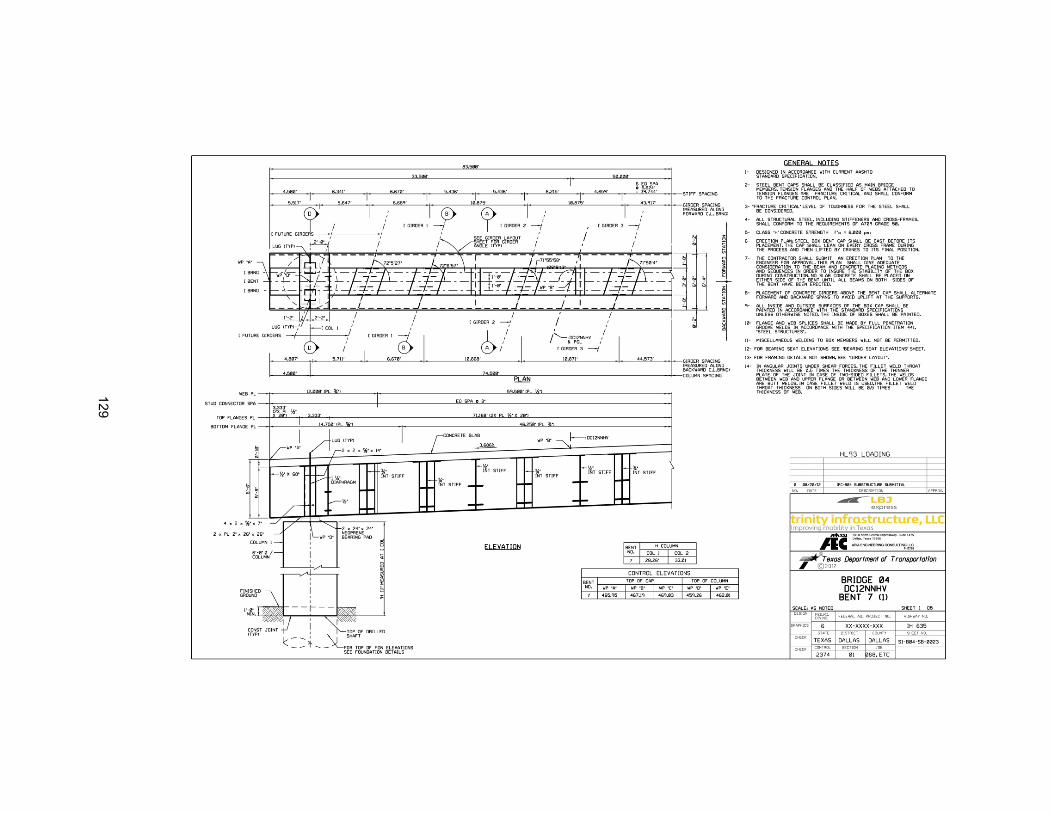
129

130

131

132

133

134
Appendix B
Load Calculations

135
The following pages have been extracted from the Bridge Analysis Reports for
each girder line in the Bridge 4 model generated using the software PGSUPER. Only the
pages regarding to the calculation of girder lines reactions are reproduced in this
Appendix.
Unit conversion factor: 1 kip = 4.448 kN.
136

137
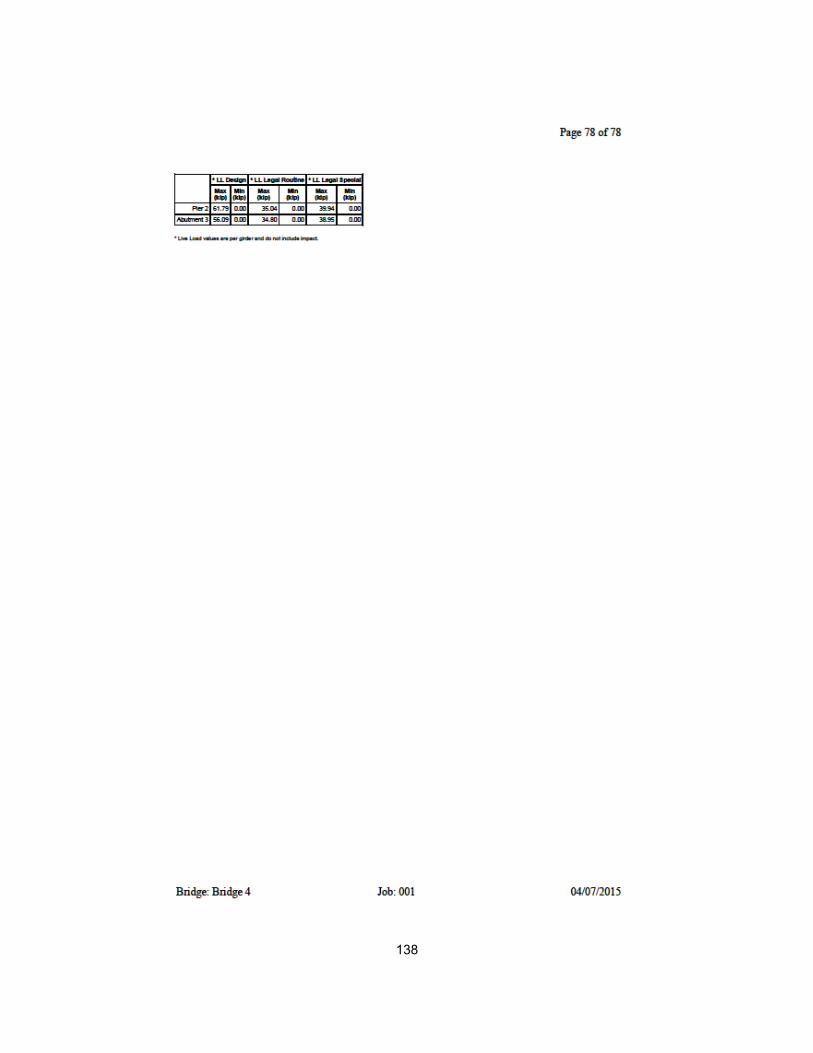
138
139

140

141

142

143

144

145

146

147

148

149
Appendix C
Prestress Loss Calculations

150

151
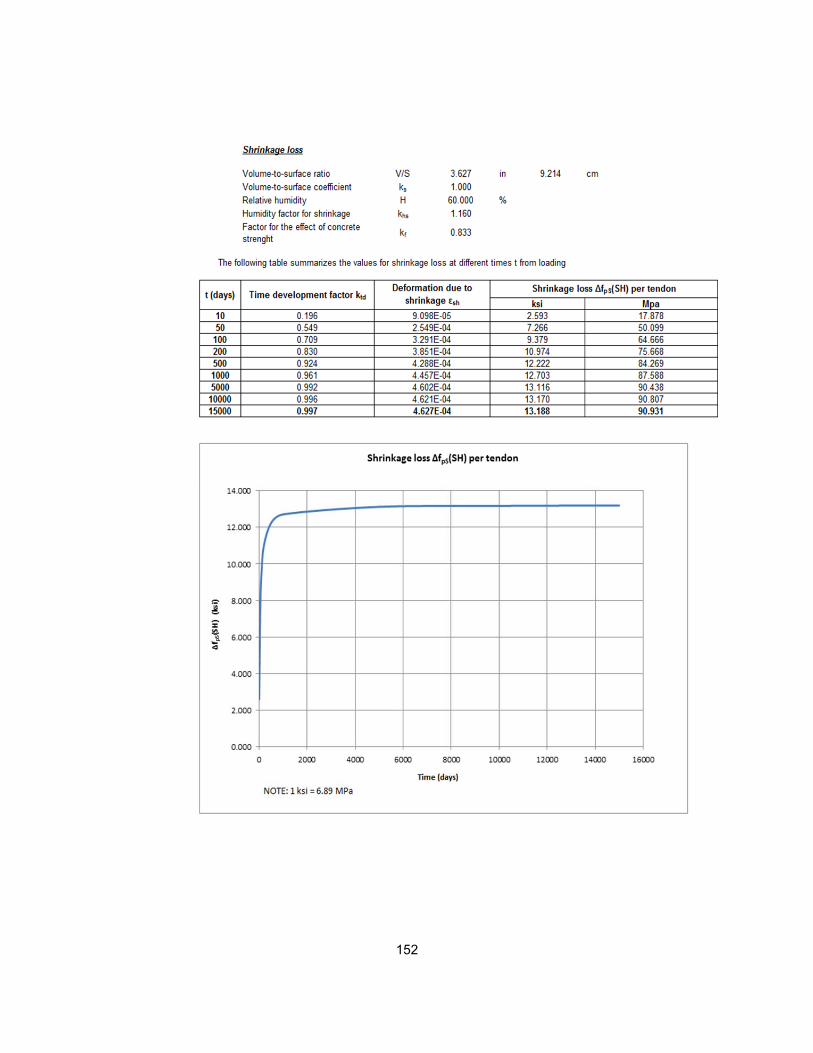
152

153

154
Appendix D
Post-Tensioned Concrete Cap Model.
Validation Calculations

155
Since the section behaves elastically, the superposition principle is applicable. The
calculations will be performed for three different loading cases:
- Case 1. Simply supported beam subjected to a uniform compressive force equal to
the total effective prestress force (after losses).
- Case 2. Simply supported beam subjected to the concentrated loads applied by the
beams.
- Case 3. Simply supported beam subjected to a constant distributed load result of
the summation of the load-balancing force caused by the prestressing tendons and
the concrete cap self-weight.
CASE 1
The compressive force applied to the member is equal to the total effective prestressing
force, so:
6 972,971 5,837,826 25,523.12
Under that load, the stress in the member is constant and with a value of (negative for
compressive stress):
76 102 7,752 5.001
753.07 5.192 (compression)
753.07 5.192 (compression)
P P
L=74.5 ft (22.708 m)
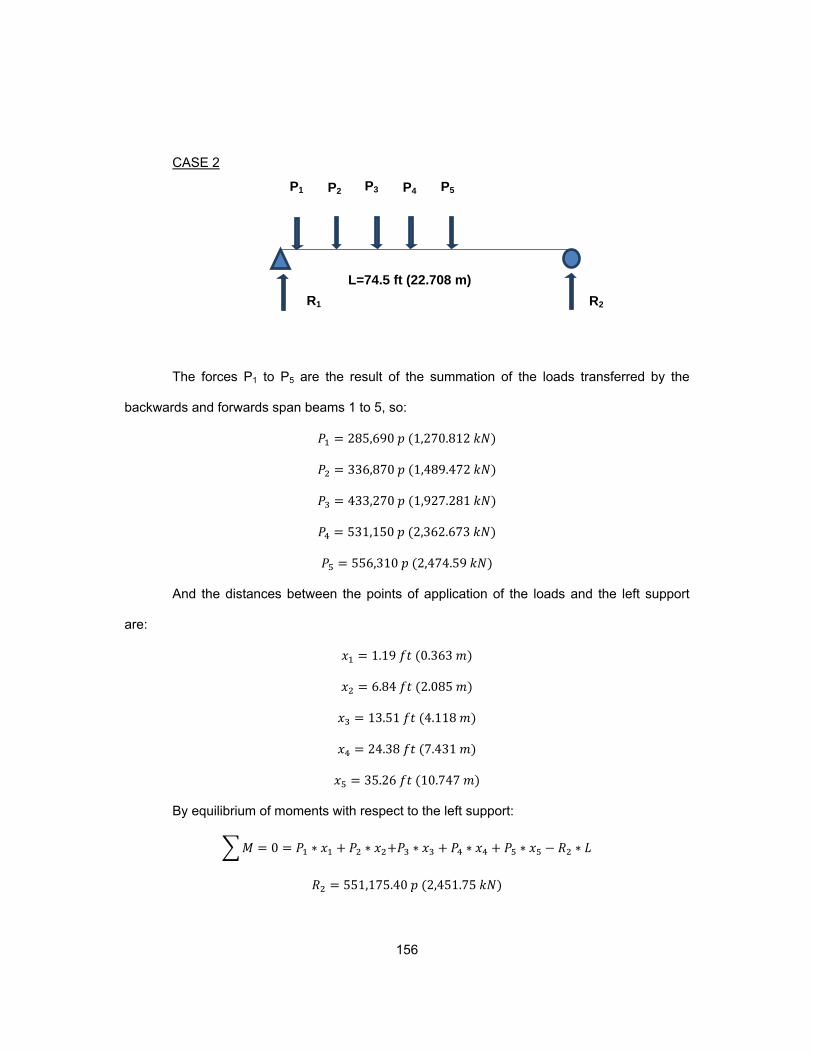
156
CASE 2
The forces P1 to P5 are the result of the summation of the loads transferred by the
backwards and forwards span beams 1 to 5, so:
285,690 1,270.812
336,870 1,489.472
433,270 1,927.281
531,150 2,362.673
556,310 2,474.59
And the distances between the points of application of the loads and the left support
are:
1.19 0.363
6.84 2.085
13.51 4.118
24.38 7.431
35.26 10.747
By equilibrium of moments with respect to the left support:
0 ∗ ∗ ∗ ∗ ∗ ∗
551,175.40 2,451.75
P1 P2 P3 P4 P5
R1 R2
L=74.5 ft (22.708 m)

157
The maximum moment section is located at the point of application of the force P5. The
moment at that section is:
∗
259,537,471.70 29,323.783
So the stresses caused by the bending action are:
1276 ∗ 102
126,720,984 2.796
251 1.295
∗1,969.42psi 13.579MPa compression
∗1,969.42psi 13.579MPa tension
CASE 3
The force w is the result of the summation of the factored self-weight of the cap and the
load-balancing force caused by the prestressing tendons:
1.25 ∗ ∗ 813.11 ⁄ 142.294 ⁄
1,680.69 ⁄ 294.121 ⁄
867.58 ⁄ 151.827 ⁄
0 ∗2
∗
w
R1 R2
L=74.5 ft (22.708 m)

158
387,808.26 1,725.057
So the moment at a section located 35.26 ft (10.747 m) from the left support is:
∗35.26 ∗ 12
2∗ 35.26 ∗ 12
86,427,775.45 9,765.023 ⁄
And the bending stresses are:
∗655.83psi 4.522MPa tension
∗655.83psi 4.522MPa compression
TOTAL STRESSES:
Applying the superposition principle, the total compressive and tensile stresses due to
bending and prestressing are:
2,066.66 14.249
560.52 3.865
.

159
Appendix E
Steel-Concrete Composite Cap Model.
Validation Calculations
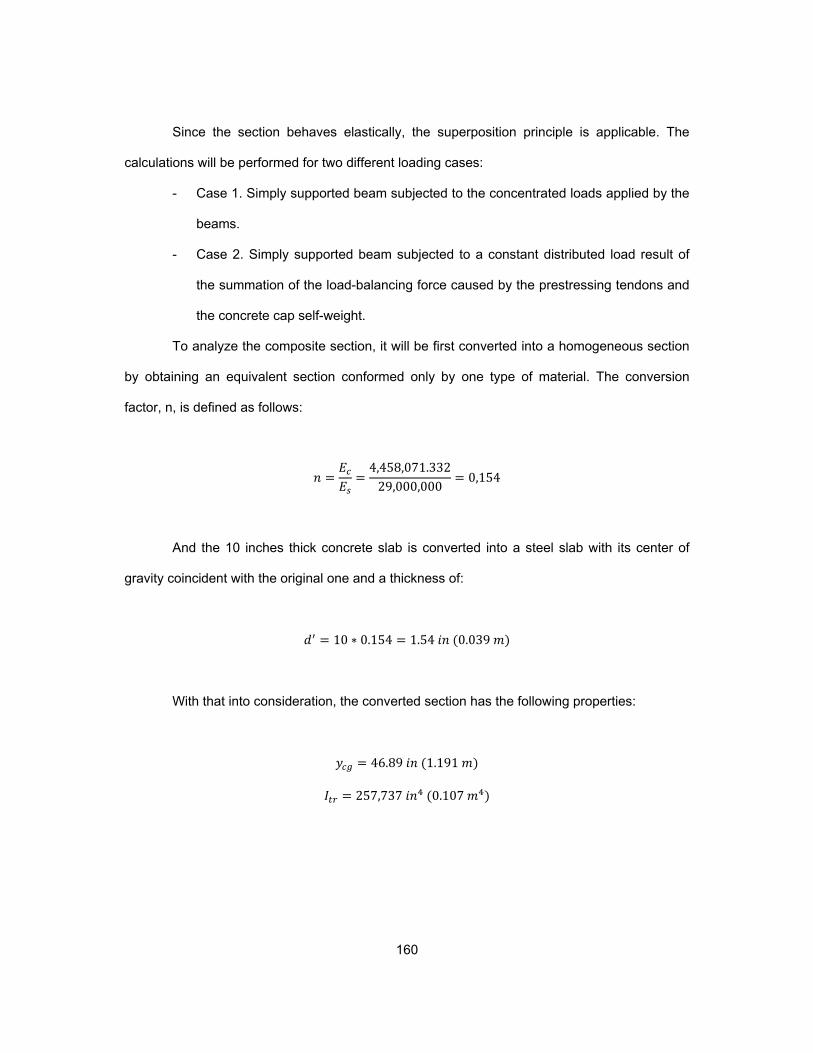
160
Since the section behaves elastically, the superposition principle is applicable. The
calculations will be performed for two different loading cases:
- Case 1. Simply supported beam subjected to the concentrated loads applied by the
beams.
- Case 2. Simply supported beam subjected to a constant distributed load result of
the summation of the load-balancing force caused by the prestressing tendons and
the concrete cap self-weight.
To analyze the composite section, it will be first converted into a homogeneous section
by obtaining an equivalent section conformed only by one type of material. The conversion
factor, n, is defined as follows:
4,458,071.33229,000,000
0,154
And the 10 inches thick concrete slab is converted into a steel slab with its center of
gravity coincident with the original one and a thickness of:
10 ∗ 0.154 1.54 0.039
With that into consideration, the converted section has the following properties:
46.89 1.191
257,737 0.107

161
CASE 1
The forces P1 to P5 are the result of the summation of the loads transferred by the
backwards and forwards span beams 1 to 5, so:
285,690 1,270.812
336,870 1,489.472
433,270 1,927.281
531,150 2,362.673
556,310 2,474.59
And the distances between the points of application of the loads and the left support
are:
1.19 0.363
6.84 2.085
13.51 4.118
24.38 7.431
35.26 10.747
By equilibrium of moments with respect to the left support:
0 ∗ ∗ ∗ ∗ ∗ ∗
551,175.40 2,451.75
The maximum moment section is located at the point of application of the force P5. The
moment at that section is:
P1 P2 P3 P4 P5
R1 R2
L=74.5 ft (22.708 m)

162
∗
259,537,471.70 29,323.783 ⁄
So the stresses caused by the bending action are:
∗31,327.30psi 215.994MPa compression
∗ 4,824.41 33.263
∗47,217.56psi 325.554MPa tension
CASE 2
The force w is the result of the summation of the factored self-weight of the steel cap
and the top concrete slab:
1.25 ∗ ∗
72 ∗34
2 ∗ 68 ∗34
76 ∗12
194 0.125
1.25 ∗ 0.490 ∗100012
∗ 194 68.76 ⁄ 12.033 ⁄
1.25 ∗ ∗
1.25 ∗ 0.145 ∗100012
∗ 76 ∗ 10 79.72 ⁄ 13.951 ⁄
68.76 79.72 148.48 ⁄ 25.984 ⁄
w
R1 R2
L=74.5 ft (22.708 m)

163
Because of the symmetry of the loading case, the reactions at supports are equal with a
value of
266,370.56 295.231
So the moment at a section located 35.26 ft from the left support is:
∗35.26 ∗ 12
2∗ 35.26 ∗ 12
14,791,484.47 1,671.213
And the bending stresses are:
∗1,785.40psi compression
∗ 274,95
∗2,590.50psi tension
TOTAL STRESSES:
Applying the superposition principle, the total compressive and tensile stresses are:
5,099.36 35.159
49,908.56 344.107
.

164
Appendix F
Cost Estimation

165
ITEM DESCRIPTION
Concrete f'c 6,000 psi
(material)Only material UNIT QUANTITY LENGTH (ft) WIDTH (ft) HEIGTH (ft) TOTAL QUANTITY UNIT PRICE TOTAL COST ($)
CY 1.00 82.50 6.33 8.50 164.40
CY 1.00 82.50 3.17 0.04 0.40
SUBTOTAL 164.81 86.35 14,231.14
Concrete f'c 6,000 psi
(placement)
Includes form work and shoring
tower placement and removal, and
concrete pouring
UNIT QUANTITY LENGTH (ft) WIDTH (ft) HEIGTH (ft) TOTAL QUANTITY UNIT PRICE TOTAL COST ($)
CY 1.00 82.50 6.33 8.50 164.40
CY 1.00 82.50 3.17 0.04 0.40
SUBTOTAL 164.81 806.17 132,862.98
Grade 60 Reinforcing Steel Includes material and labor UNIT QUANTITY LENGTH (ft) DIAMETER (ft)UNIT WEIGTH
(LB/FT3)TOTAL QUANTITY UNIT PRICE TOTAL COST ($)
Bars A (#11) LB 8.00 95.00 0.12 490.00 4,038.08
Bars B (#11) LB 8.00 91.50 0.12 490.00 3,889.31
Bars T (#8) LB 18.00 87.50 0.12 490.00 8,368.40
Bars K1 (#4) LB 44.00 3.75 0.04 490.00 110.24
Bars K2 (#4) LB 16.00 5.00 0.04 490.00 53.45
Bars K3 (#4) LB 16.00 2.58 0.04 490.00 27.62
Bars K4 (#4) LB 22.00 6.00 0.04 490.00 88.19
Bars K5 (#4) LB 15.00 6.79 0.04 490.00 68.07
Bars M1 (#5) LB 28.00 9.46 0.05 490.00 276.48
Bars M2 (#5) LB 26.00 11.54 0.05 490.00 313.27
Bars S1 (#6) LB 108.00 29.79 0.06 490.00 4,836.87
Bars S2 (#5) LB 78.00 23.58 0.05 490.00 1,920.36
Bars S3 (#6) LB 60.00 22.25 0.06 490.00 2,006.91
Bars U (#6) LB 271.00 7.94 0.06 490.00 3,233.69
Bars V2 (#10) LB 32.00 10.00 0.11 490.00 1,379.37
Bars Z2 (#3) LB 4.00 104.72 0.03 490.00 157.43
SUBTOTAL 30,767.74 0.47 14,460.84
Grade 270 Low‐Lax
Prestressing Steel
31‐0.6 in dia. tendon, including all
additional elements, grout and
tendon tensioning
UNIT QUANTITY LENGTH (ft) WIDTH (ft) HEIGTH (ft) TOTAL QUANTITY UNIT PRICE TOTAL COST ($)
Tendons A LFT 2.00 85.00 1.00 1.00 170.00
Tendons B LFT 2.00 85.00 1.00 1.00 170.00
Tendons C LFT 2.00 85.00 1.00 1.00 170.00
SUBTOTAL 510.00 89.84 45,818.40
TOTAL 207,373.36
POST‐TENSIONED BENT CAP ESTIMATE
QUANTITY COST

166
.
ITEM DESCRIPTION
Concrete f'c 6,000 psi
(material)Only material UNIT QUANTITY LENGTH (ft) WIDTH (ft) HEIGTH (ft) TOTAL QUANTITY UNIT PRICE TOTAL COST ($)
CY 1.00 83.50 6.33 0.83 16.32
SUBTOTAL 16.32 86.35 1,409.41
Concrete f'c 6,000 psi
(placement)
Includes form work and shoring
tower placement and removalUNIT QUANTITY LENGTH (ft) WIDTH (ft) HEIGTH (ft) TOTAL QUANTITY UNIT PRICE TOTAL COST ($)
CY 1.00 83.50 6.33 0.83 16.32
SUBTOTAL 16.32 567.78 9,267.31
Grade 60 Reinforcing Steel Includes material and labor UNIT QUANTITY LENGTH (ft) DIAMETER (ft)UNIT WEIGTH
(LB/FT3)TOTAL QUANTITY UNIT PRICE TOTAL COST ($)
Bars A (#4) LB 13.00 84.58 0.12 490.00 5,842.38
Bars B (#4) LB 13.00 84.58 0.12 490.00 5,842.38
Bars S (#4) LB 168.00 13.83 0.12 490.00 12,348.03
SUBTOTAL 24,032.80 0.47 11,295.41
A709 Grade 50 SteelA709 Grade 50 Steel in finished
steel cap section including liftingUNIT QUANTITY LENGTH (ft) WIDTH (ft) THICKNESS (ft) TOTAL QUANTITY UNIT PRICE TOTAL COST ($)
Bottom flange LB 1.00 46.25 6.00 0.06 8,498.44
LB 1.00 14.75 6.00 0.05 2,258.59
LB 1.00 22.50 6.00 0.05 3,445.31
Top flange LB 2.00 3.33 1.67 0.04 226.83
LB 1.00 3.33 6.33 0.05 538.72
LB 2.00 71.17 1.67 0.04 4,843.38
LB 1.00 2.33 6.33 0.05 377.09
LB 2.00 3.33 1.67 0.04 226.83
LB 5.00 3.25 3.00 0.04 995.31
LB 7.00 1.00 3.00 0.04 428.75
Webs LB 4.00 12.00 5.75 0.06 8,452.50
LB 2.00 59.50 5.75 0.04 13,970.10
Diagonals LB 2.00 83.50 1.42 0.04 4,830.24
Diaphragm Column 1 LB 4.00 5.67 1.17 0.05 674.88
LB 8.00 5.67 0.58 0.05 674.88
LB 1.00 6.00 5.67 0.10 1,735.42
LB 1.00 6.00 5.67 0.04 694.17
Diaphragm Column 2 LB 4.00 5.67 1.17 0.05 674.88
LB 8.00 5.67 0.58 0.05 674.88
LB 1.00 6.00 5.67 0.06 1,041.25
Girder Stiffener LB 5.00 6.00 5.67 0.06 5,206.25
LB 40.00 5.67 0.67 0.04 3,085.19
Interior Stiffener LB 7.00 6.00 5.67 0.04 4,859.17
LB 28.00 5.67 0.42 0.04 1,349.77
SUBTOTAL 69,762.84 2.55 177,895.23
TOTAL 199,867.37
QUANTITY COST
COMPOSITE BENT CAP ESTIMATE

167
References
AASHTO. (2012). AASHTO LRFD Bridge Design Specifications. American Association of
State Highway and Transportation Officials.
Alenius, M. (2003). Finite Element Modelling of Composite Bridge Stability. Stockholm:
Royal Institute of Technology.
Ales, J. M. (1994). The Connection Between an Integral Steel Cap Girder and a Concrete
Pier. University of Texas at Austin.
Al-Mashta, S. (2010). Integrated Cost Budgeting and Cost Estimation Model for Building
Projects. Concordia University.
AZDOT. (ND). LRFD Substructure Example 3. Hammerhead Pier on Spread Footing.
Arizona Department of Transportation.
Barker, R. M., & Puckett, J. A. (2013). Design of Highway Bridges. An LRFD Approach.
Wiley.
Barr, P. J., Halling, M. W., Huffaker, C., & Boyle, H. (2013). Behavior and Analysis of an
Integral Abutment Bridge. Utah State University.
Bhargava, A. (2009). A Probabilistic Evaluation of Highway Project Costs. Purdue
University.
Billington, S. L. (1994). Behavior of Two-Span Continuous Pier Caps With Varying Levels
of Prestress. The University of Texas at Austin.
Billington, S., Barnes, R., & Breen, J. (1998). A Precast Substructure Design for Standard
Bridge Systems. Center for Transportation Research. The University of Texas at
Austin.
Birtel, V., & Mark, P. (2006). Parameteised Finite Element Modeling of RC Beam Shear
Failure. Ruhr-University Bochum.
168
Bracci, J. M., Keating, P. B., & Hueste, M. B. (2000). Cracking in RC Bent Caps. Texas
Department of Transportation.
Chen, W.-F., & Duan, L. (2014). Bridge Engineering Handbook: Substructure Design.
CRC Press.
Clifford J. Youngberg, R. J., & Bergson, P. M. (2003). Fatigue Evaluation of Steel Box-
Girder Pier Caps. Minessota Department of Transportation.
Coletti, D., & Puckett, J. (2012). Steel Bridge Design Handbook: Structural Analysys.
Federal Highway Administration.
Colleti, D., & Sheahan, J. (2012). Steel Bridge Design Handbook: Substructure Design.
Federal Highway Administration.
Collins, M. P., Mitchell, D., & MacGregor, J. G. (1993). Structural Design Considerations
for High-Strength Concrete. American Conctere Institute.
Construction, A. I. (2012). Steel Construction Manual. American Instutute of Steel
Construction.
Dassault Systemes Simulia Corp. (n.d.). Abaqus 6.9 Abaqus/CAE User's Guide. Dassault
Systemes Simulia Corp.
Dassault Systemes Simulia Corp. (n.d.). Abaqus 6.9 Analyis User's Manual. Dassault
Systemes Simulia Corp.
Dassault Systemes Simulia Corp. (n.d.). Abaqus 6.9 Example Problems Manual.
Dassault Systemes Simulia Corp.
Dassault Systemes Simulia Corp. (n.d.). Abaqus 6.9 Theory Manual. Dassault Systemes
Simulia Corp.
De, S. (n.d.). Abaqus Handout. Rensselaer Polytechnic Institute.
Denio, R. J., Yura, J. A., & Kreger, M. E. (1995). Behaviour of Reinforced Concrete Pier
Caps Under Concentrated Bearing Loads. Texas Deparment of Transportation.

169
Estimation, A. T. (2006). A Guide for Cost Estimation. AASHTO.
Ferley, R. F. (2013). Finite Element Analysis of Reinforced Concrete Pile Caps To Cast-
In-Shell Steel Piles. Tennessee Technological University.
FHWA. (2003). LRFD Design Example for Steel Girder Superstructure Bridge. Federal
Highway Administration.
Furlong, R. W., Ferguson, P. M., & Ma, J. S. (1971). Shear and Anchorage Study of
Reinforcement in Inverted T-Beam Bent Cap Girders. Center for Highway
Research. The University of Texas at Austin.
Gandiaga, L. (2009). Serviceability Limits and Economical Bridge Design. University of
Wyoming.
Hueste, M. B., Adil, M. S., & Keating, P. B. (2006). Impact of LRFD Specifications on
Design of Texas Bridges. Texas Transportation Institute.
Hutchings, J. F. (2004). Project Scheduling Handbook. Marcel Dekker, Inc.
Johansoon, B., & Reitzel, P. (2011). Numerical Analysis of a Reinforced Concrete Beam
in Abaqus 6.10. Aalborg University.
Kim, S., Bai, Y., & Yang-Ki Jung, D. Y. (2014). Highway Construction Productivity
Measurement With A Wireless Real-Time Productivity Measurement System.
Journal of the Transportation Research Board.
King, S., & Richards, T. (2013). Solving Contact Problems with Abaqus. Simulia.
Kmiecik, P., & Kaminski, M. (2011). Modelling of Reinforced Concrete Structures and
Composite Structures with Concrete Strenght Degradation Taken Into
Consideration. Wroclaw University of Technology.
Lebet, J.-P., & Hirt, M. A. (2013). Steel Bridges. Conceptual And Structural Design of
Steel and Steel-Concrete Composite Bridges. EPFL Press.

170
Lee, G. C., & Sternberg, E. (2015). Bridges. Their Engineering and Planning. State
University of New York Press.
Logan, D. L. (2012). A First Course in the Finite Element Method. CENGAGE Learning.
Matsumoto, E. E., Waggoner, M. C., Sumen, G., Kreger, M. E., Wood, S. L., & Been, J.
E. (2001). Development of a Precast Bent Cap System. Center for Transportation
Research. The Unversity of Texas at Austin.
Menesi, W. (2010). Construction Scheduling Using Critical Path Analysis with Separate
Time Segments. University of Waterloo.
Mertz, D. (2012). Steel Bridge Design Handbook: Limit States. Federal Highway
Administration.
Mertz, D. (2012). Steel Bridge Design Handbook: Loads and Load Combination. Federal
Highway Administration.
Mubarak, S. (2010). Construction Project Scheduling and Control. Wiley.
Naaman, A. E. (2012). Prestressed Concrete Analysis and Design. Techno Press 3000.
Nawy, E. G. (2010). Prestressed Concrete. A Fundamental Approach. Prentice Hall.
Newitt, J. S. (2009). Construction Scheduling. Principles and Practices. Pearson.
Nicholas, T., Barth, K. E., & Boyajian, D. M. (2011). A Simplified Approach to Bridge
Substructure Design. Geothectnical and Geological Engineering.
Nikravan, N. (2013). Structural Design Issies for Integral Abutment Bridges. Ryerson
University.
Nilson, A. H., Darwin, D., & Dolan, C. W. (2004). Design of Concrete Structures. McGraw
hill.
Owens, J. A. (2010). Project Management for Complex Transportation Projects. Iowa
State University.

171
Patel, K. N. (1990). Construction Cost Estimating in Project Management. New Jersey
Institute of Technology.
Patel, P. (2009). LRFD Design of Double Composite Box Girder Bridges. University of
South Florida.
Pawar, R. (2007). Predicting Bid Prices in Construction Projects Using Non-Parametric
Statistical Models. Texas A&M University.
Pereira, R. M. (1994). Behavior of Structural Concrete Cantilever Piers Using T-Headed
Reinforcing Bars and Varied Prestressing Design Criteria. The University of
Texas at Austin.
Pratt, D. (2011). Fundamentals of Construction Estimating. DELMAR CENGAGE
Learning.
Rombach, G. A. (2004). Finite Element Design Of Concrete Structures. Thomas Telford.
Saiedi, R. (2007). Load-deflection response of a prestressed concrete T-beam. Queen's
Univsity, Canada.
Salmon, C. G., Johnson, J. E., & Malhas, F. A. (2009). Steel Structures. Design and
Behavior. PEARSON Prentice Hall.
Samphaongoen, P. (2009). A Visual Approach To Construction Cost Estimating.
Marquette University.
Shepherd, J. F. (2006). Hexahedral Mesh Generation Constraints. University of Utah.
Thiagarajan, G. (2005). Finite Element Modeling or Reinforced Concrete Bridge Decks
with Abaqus. U.S. Department of Transportation.
Till, R. (2002). Investigation of Steel Box Girder Pier Caps on S05 of 63103. Mitchigan
Department of Transportation.
TxDOT. (2010). Inverted Tee Bent Cap Design Example. Texas Department of
Transportation.
172
TxDOT. (2010). Rectangular Bent Cap Design Example. Texas Department of
Transportation.
TxDOT. (2013). Bridge Design Manual - LRFD. Texas Department of Transportation.
TxDOT. (2015). Preferred Practices for Steel Bridge Design, Fabrication, and Erection.
Texas Department of Transportation.
Unly, D. (2010). Rapid Bridge Construction Technology: Precast Elements for
Substructures. University of Wisconsin-Madison.
Wahalathantri, B. L., Thambiratnam, D. P., Chan, T. H., & Fawzia, S. (2011). A Material
Model for Flexural Crack Simulation in Reinforced Concrete Elements Using
Abaqus. Queensland University of Technology.
Wassef, W. G., & Davis, D. (2004). NCHRP REPORT 527. Integral Steel Box-Beam Pier
Caps. Transportation Research Board of the National Academies.
Wassef, W. G., Smith, C., Clancy, C. M., & Smith, M. J. (2003). Comprehensive Design
Exmaple for Prestressed Concrete (PSC) Girder Superstructure Bridge with
Commentary. Federal Highway Administration.
Wekezer, J., Li, H., Kwasniewski, L., & Malachowski, J. (2004). Analytical and
Experimental Evaluation of Existing Florida Dot Bridges. Florida Department of
Transportation.
White, D. (2012). Steel Bridge Design Handbook: Structural Behaviour of Steel. Federal
Highway Administration.
Wight, J. K., & MacGregor, J. G. (2012). Reinforced Concrete. Mechanics & Design.
Pearson.
Zhao, J. Z., & Tonias, D. E. (2012). Bridge Engineering: Design, Rehabilitation, and
Maintenance of Modern Highway Bridges. McGraw-Hill.
173
Biographical Information
Francisco David Berrocal Ruiz was born in Estepona (Malaga, Spain) on the 27th
of November of 1980. He obtained his Civil Engineering degree from the University of
Granada (Spain) in 2007. He started his professional career as an intern in the Spanish
company IDOM Servicios Integrales de Ingenieria S.L. in July 2006. After finishing his
degree, he was hired as an engineer by this company. In September 2007, he was
offered a position in the technical department of a complex highway project in the south
of Spain developed by Ferrovial-Agroman. In 2012 he was transferred to the US to
collaborate in the development of the LBJ project in Dallas. Supported by his company,
the author was admitted to the graduate program in Structural and Applied Mechanics at
the University of Texas at Arlington in spring 2013.