Comparison of Organic and Inorganic Solar Photovoltaic Systems
60
Comparison of Organic and Inorganic Solar Photovoltaic Systems Khulan Orgil Senior Project Electrical Engineering Department California Polytechnic State University San Luis Obispo December 2018
Transcript of Comparison of Organic and Inorganic Solar Photovoltaic Systems
Comparison of Organic and Inorganic
Solar Photovoltaic Systems
Khulan Orgil
Senior Project
Electrical Engineering Department California Polytechnic State University
San Luis Obispo December 2018
i
DISCLAIMERS: This work is partially based on the statistics developed by the International Energy Agency, © OECD/IEA 2017 but the resulting work has been prepared by Khulan Orgil and does not necessarily reflect the views of the International Energy Agency. This work is partially based on the Data developed by the U.S. Department of Energy (DOE)/NREL/ALLIANCE, but the resulting work has been prepared by Khulan Orgil and does not necessarily reflect the views of the U.S. Department of Energy (DOE)/NREL/ALLIANCE.
ii
Table of Contents
Abstract 1
I.Introduction 2
II.Background 51.InorganicPhotovoltaicSystems 72.OrganicPhotovoltaicSystems 8
III.MaterialPropertiesandStructure 101.InorganicPhotovoltaicCells 112.OrganicPhotovoltaicCells 123.Hybrid 15
IV.Manufacturing 161.CrystallineSiliconPhotovoltaicPanelManufacturing 162.OrganicPhotovoltaicPanelManufacturing 18
V.Cost 201.Breakdown 202.FinancialComparison 213.EnergyComparison 23
VI.Environmental 251.GreenhouseGasEmissions 253.HeavyMetalEmissions 264.RecyclingandReuse 275.LandUse 28
VII.Sustainability 301.Pollution 302.JobCreation 303.Waste 314.MaterialUse 31
VIII.Safety 321.Manufacturing 322.InstallationandOperation 323.DecommissioningandRecycling 33
IX.FutureChanges 341.PossibleInorganicPhotovoltaicSystemChanges 342.PossibleOrganicPhotovoltaicSystemChanges 34
X.Summary/Conclusion 35
AppendixA:AcronymsandAbbreviations 36
iii
AppendixB:ABETSeniorProjectAnalysis 39
AppendixC:SolarPanelManufacturing 46
AppendixD:References 47
AppendixE:AccumulatedData 53
Table of Figures Figure1:Renewableenergycapacitygrowth..............................................................................................................2Figure2:Bestefficienciesofdifferentphotovoltaiccelldesigns..........................................................................3Figure3:ProductLifeCycle................................................................................................................................................4Figure4:Theaveragesolarresource..............................................................................................................................6Figure5:ExampleIVcurvesandnumericaldata........................................................................................................7Figure6Mono-crystallinesiliconphotovoltaicarray...............................................................................................8Figure7OrganicPhotovoltaicCell...................................................................................................................................9Figure8:GlobalSpectralIrradiance.............................................................................................................................10Figure9Basicsiliconsolarcellstructuredemonstratingelectronholepaircreation...............................11Figure10Differentelectronacceptoranddonorjunctions..................................................................................13Figure11:OPVIUScurvedceilingapplication............................................................................................................14Figure12OverviewofsiliconandCdTePVsystemproduction..........................................................................17Figure13:Energyconsumedpersquaremeter........................................................................................................18Figure14NRELCostBenchmark....................................................................................................................................21Figure15:Thecostperwattforsiliconandorganicphotovoltaicsystems.....................................................22Figure16:Levelizedcostofelectricity.........................................................................................................................23Figure17:Energypaybacktimes...................................................................................................................................24Figure18:Greenhousegasemissions...........................................................................................................................25Figure19:Comparisonofgreenhousegasemissions..............................................................................................26Figure20:GanttChartdetailingtheprojecttimelineduringEE460..................................................................41Figure21:GanttChartdetailingtheprojecttimelineduringEE461..................................................................41Figure22:GanttChartdetailingtheprojecttimelineduringEE462..................................................................42
Table of Tables Table1:PhotovoltaicSystemComparisonRequirementsandSpecification..................................................39Table2:BasicDatacollectedaboutphotovoltaicsystems....................................................................................53Table3:CollectedEnergyReturnonEnergyInvestedData..................................................................................53Table4:EnergyPaybackTimeData..............................................................................................................................54Table5:CollectedGreenhouseGasEmissionsData.................................................................................................55Table6:CollectedDataonProductionEnergy..........................................................................................................55Table7:CollectedDataontheLevelizedCostsofElectricity................................................................................56
1
Abstract This senior project report addresses the consumer’s need for accurate and easily accessible information when making a solar panel purchasing decision. Thus, the project analyzes and compares the costs and benefits of organic and inorganic photovoltaic systems during their life cycle. The cost comparison includes analysis of the environmental and economic costs of materials, production, installation, and disposal. The benefit comparison includes analysis of the economic, environmental, and social benefits accrued during the system’s lifetime. With the project’s data, consumers can make more informed decisions to fit their specific needs.
2
I. Introduction Photovoltaic systems dominate a large share of the renewables market due to their
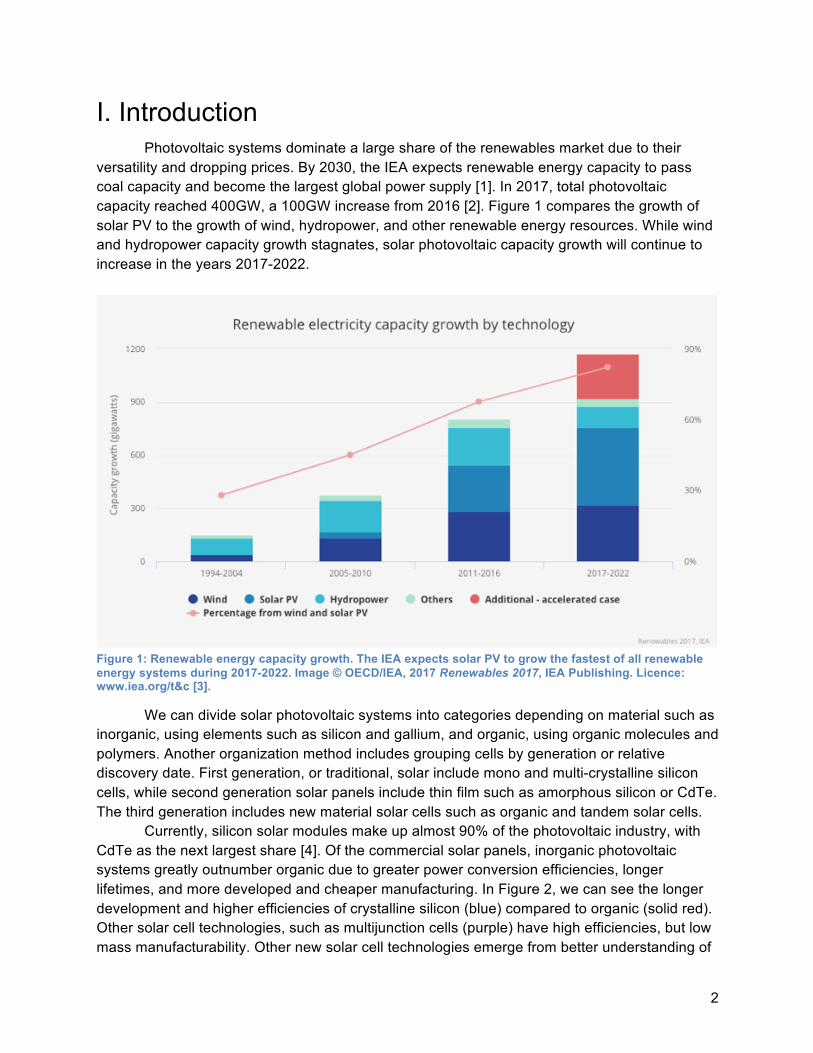
versatility and dropping prices. By 2030, the IEA expects renewable energy capacity to pass coal capacity and become the largest global power supply [1]. In 2017, total photovoltaic capacity reached 400GW, a 100GW increase from 2016 [2]. Figure 1 compares the growth of solar PV to the growth of wind, hydropower, and other renewable energy resources. While wind and hydropower capacity growth stagnates, solar photovoltaic capacity growth will continue to increase in the years 2017-2022.
Figure 1: Renewable energy capacity growth. The IEA expects solar PV to grow the fastest of all renewable energy systems during 2017-2022. Image © OECD/IEA, 2017 Renewables 2017, IEA Publishing. Licence: www.iea.org/t&c [3].
We can divide solar photovoltaic systems into categories depending on material such as inorganic, using elements such as silicon and gallium, and organic, using organic molecules and polymers. Another organization method includes grouping cells by generation or relative discovery date. First generation, or traditional, solar include mono and multi-crystalline silicon cells, while second generation solar panels include thin film such as amorphous silicon or CdTe. The third generation includes new material solar cells such as organic and tandem solar cells.
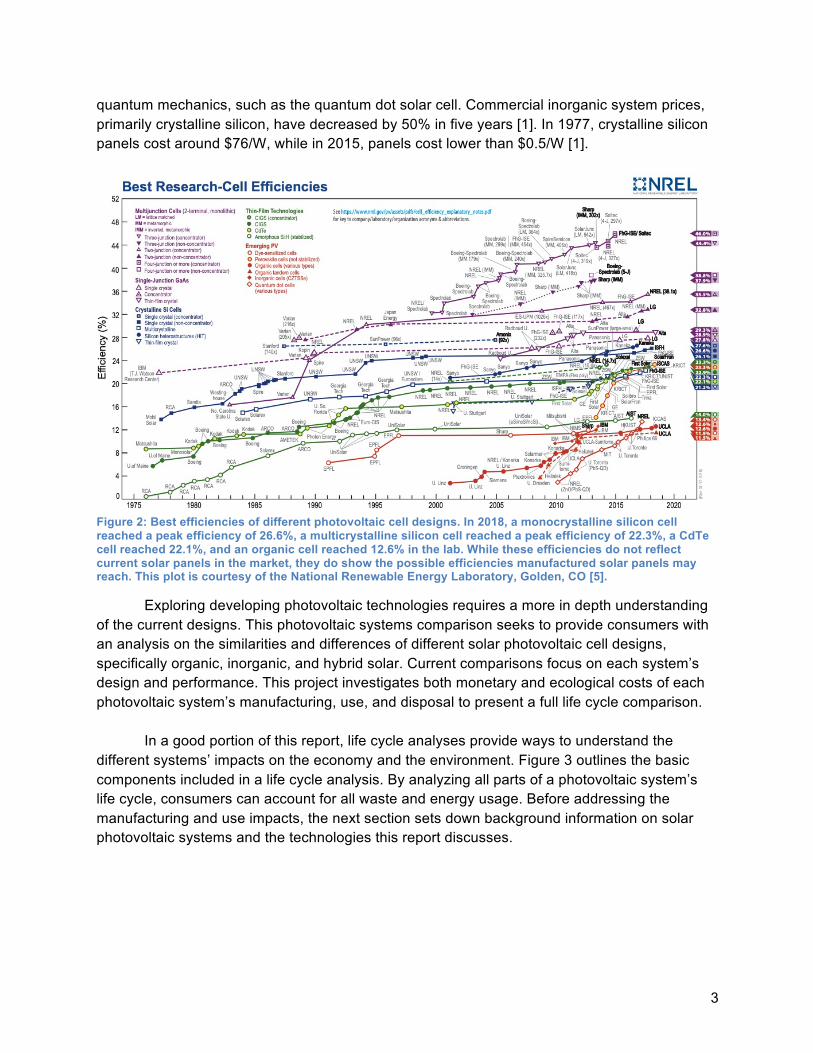
Currently, silicon solar modules make up almost 90% of the photovoltaic industry, with CdTe as the next largest share [4]. Of the commercial solar panels, inorganic photovoltaic systems greatly outnumber organic due to greater power conversion efficiencies, longer lifetimes, and more developed and cheaper manufacturing. In Figure 2, we can see the longer development and higher efficiencies of crystalline silicon (blue) compared to organic (solid red). Other solar cell technologies, such as multijunction cells (purple) have high efficiencies, but low mass manufacturability. Other new solar cell technologies emerge from better understanding of
3
quantum mechanics, such as the quantum dot solar cell. Commercial inorganic system prices, primarily crystalline silicon, have decreased by 50% in five years [1]. In 1977, crystalline silicon panels cost around $76/W, while in 2015, panels cost lower than $0.5/W [1].
Figure 2: Best efficiencies of different photovoltaic cell designs. In 2018, a monocrystalline silicon cell reached a peak efficiency of 26.6%, a multicrystalline silicon cell reached a peak efficiency of 22.3%, a CdTe cell reached 22.1%, and an organic cell reached 12.6% in the lab. While these efficiencies do not reflect current solar panels in the market, they do show the possible efficiencies manufactured solar panels may reach. This plot is courtesy of the National Renewable Energy Laboratory, Golden, CO [5].
Exploring developing photovoltaic technologies requires a more in depth understanding of the current designs. This photovoltaic systems comparison seeks to provide consumers with an analysis on the similarities and differences of different solar photovoltaic cell designs, specifically organic, inorganic, and hybrid solar. Current comparisons focus on each system’s design and performance. This project investigates both monetary and ecological costs of each photovoltaic system’s manufacturing, use, and disposal to present a full life cycle comparison.
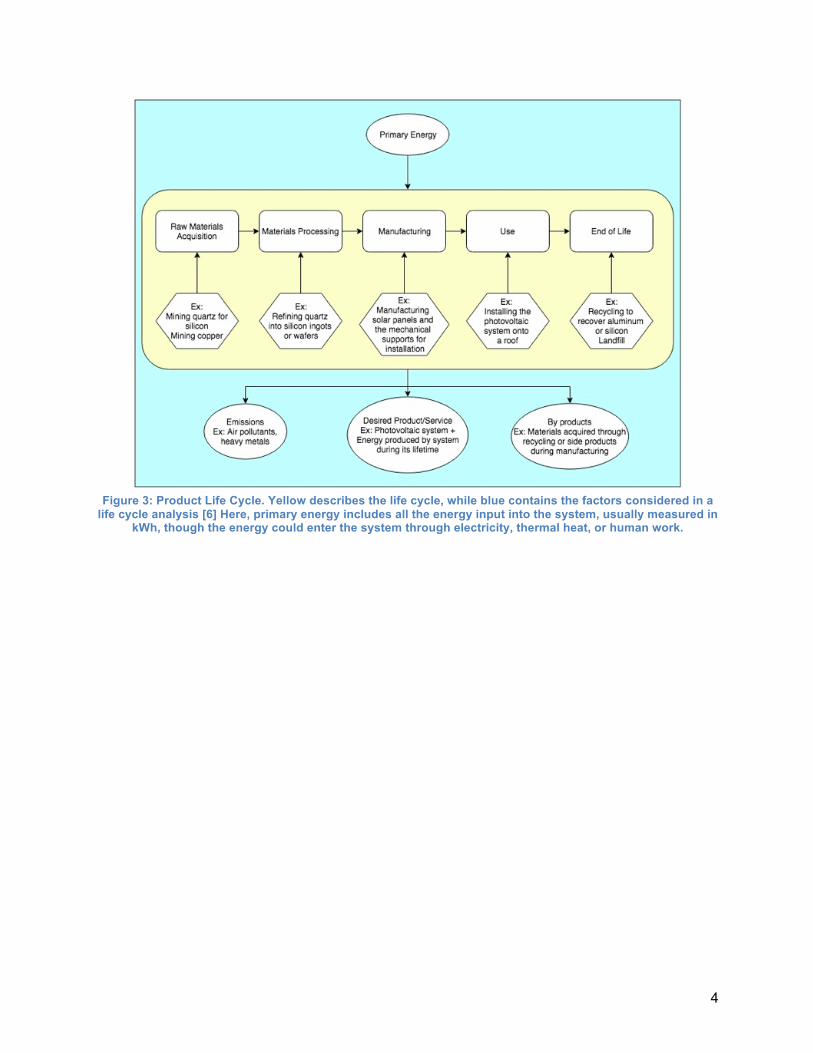
In a good portion of this report, life cycle analyses provide ways to understand the different systems’ impacts on the economy and the environment. Figure 3 outlines the basic components included in a life cycle analysis. By analyzing all parts of a photovoltaic system’s life cycle, consumers can account for all waste and energy usage. Before addressing the manufacturing and use impacts, the next section sets down background information on solar photovoltaic systems and the technologies this report discusses.
4
Figure 3: Product Life Cycle. Yellow describes the life cycle, while blue contains the factors considered in a
life cycle analysis [6] Here, primary energy includes all the energy input into the system, usually measured in kWh, though the energy could enter the system through electricity, thermal heat, or human work.
5
II. Background This section explores the basic differences between the systems and defines some
terms used in future sections. Both inorganic and organic photovoltaic systems include the modules and the BoS (balance of system) components, which include inverters, cables, and mechanical support, to produce useful energy. The mechanical support differs due to different weight and size modules and install location, but the modules and the cells contribute the largest differences in function.
Photovoltaic module quality measures include efficiency and lifetime. A panel’s lifetime describes how fast it deteriorates. Under the sunlight, a panel slowly degrades in efficiency. Manufacturers define a panel’s lifetime as how long a panel stays above at least 80% of its maximum power conversion efficiency [7]. Commercial solar panels usually last longer than their rated lifetime or manufacturer’s warranty but produce energy less efficiently than when new.
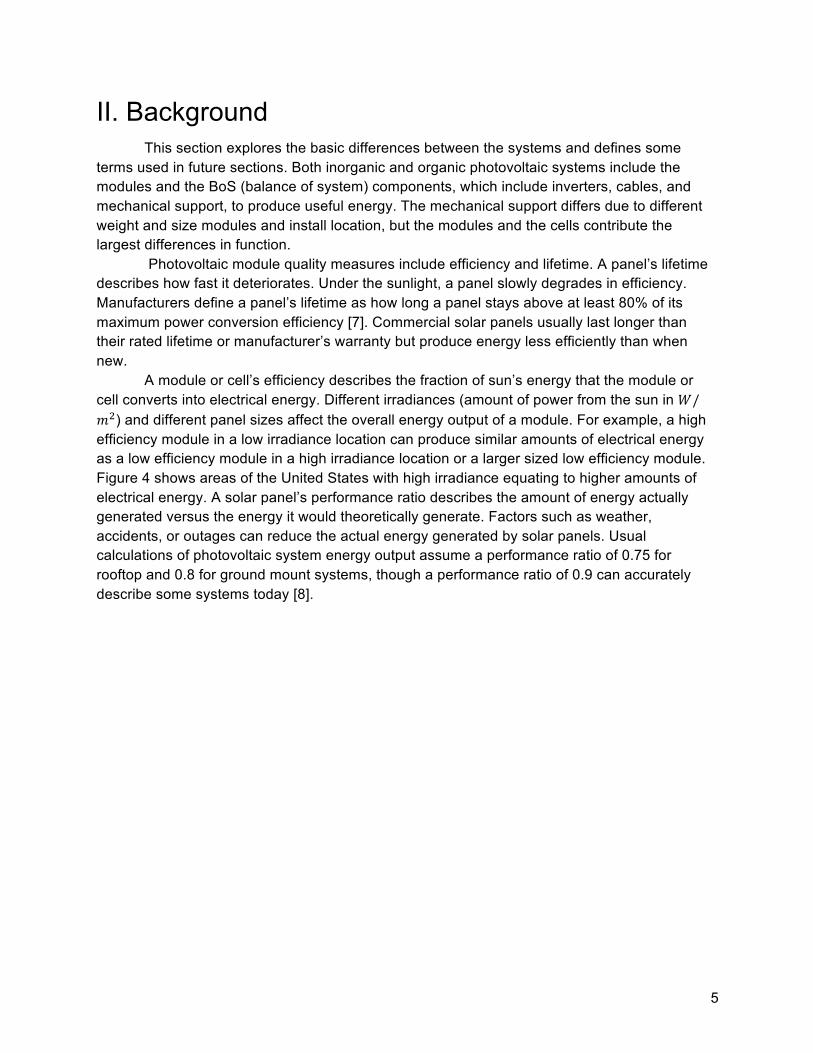
A module or cell’s efficiency describes the fraction of sun’s energy that the module or cell converts into electrical energy. Different irradiances (amount of power from the sun in 𝑊/𝑚!) and different panel sizes affect the overall energy output of a module. For example, a high efficiency module in a low irradiance location can produce similar amounts of electrical energy as a low efficiency module in a high irradiance location or a larger sized low efficiency module. Figure 4 shows areas of the United States with high irradiance equating to higher amounts of electrical energy. A solar panel’s performance ratio describes the amount of energy actually generated versus the energy it would theoretically generate. Factors such as weather, accidents, or outages can reduce the actual energy generated by solar panels. Usual calculations of photovoltaic system energy output assume a performance ratio of 0.75 for rooftop and 0.8 for ground mount systems, though a performance ratio of 0.9 can accurately describe some systems today [8].
6
Figure 4: The average solar resource, shown in kWh per square meter per day, shown for different areas of the United States. Many sites in Nevada, Arizona, and New Mexico house large solar energy plants for the large amounts of solar energy available. This map is courtesy of the National Renewable Energy Laboratory, Golden, CO [9].
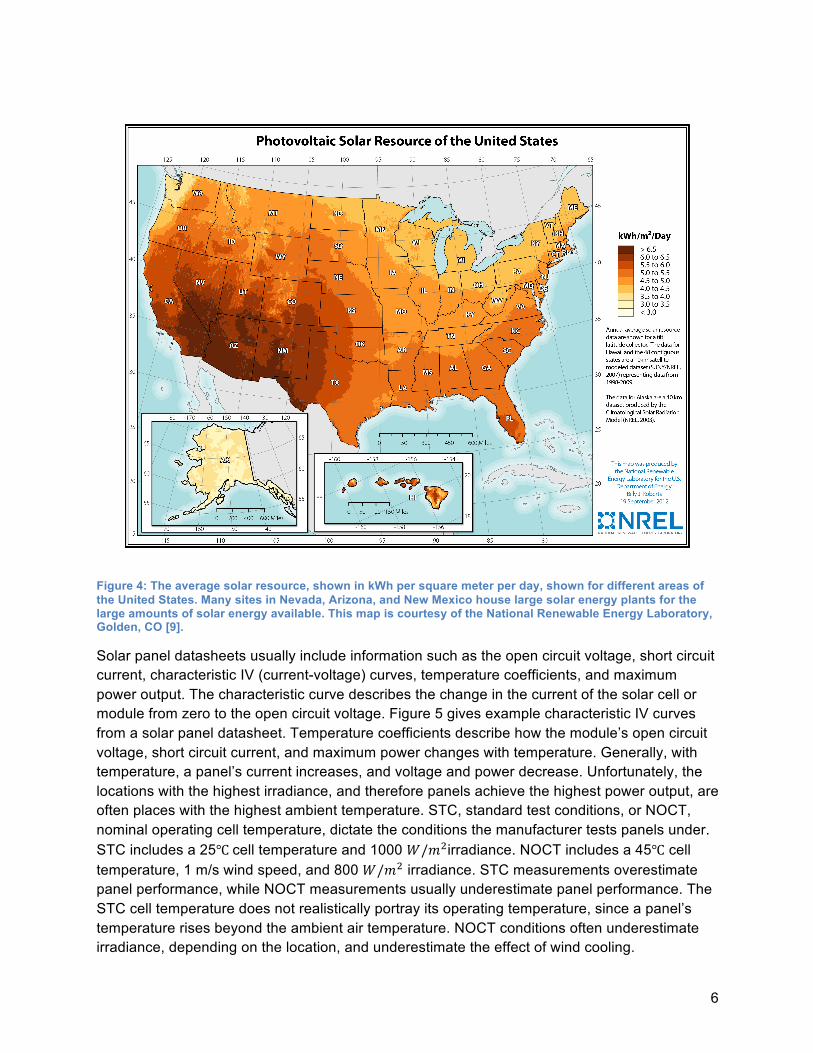
Solar panel datasheets usually include information such as the open circuit voltage, short circuit current, characteristic IV (current-voltage) curves, temperature coefficients, and maximum power output. The characteristic curve describes the change in the current of the solar cell or module from zero to the open circuit voltage. Figure 5 gives example characteristic IV curves from a solar panel datasheet. Temperature coefficients describe how the module’s open circuit voltage, short circuit current, and maximum power changes with temperature. Generally, with temperature, a panel’s current increases, and voltage and power decrease. Unfortunately, the locations with the highest irradiance, and therefore panels achieve the highest power output, are often places with the highest ambient temperature. STC, standard test conditions, or NOCT, nominal operating cell temperature, dictate the conditions the manufacturer tests panels under. STC includes a 25℃ cell temperature and 1000 𝑊/𝑚!irradiance. NOCT includes a 45℃ cell temperature, 1 m/s wind speed, and 800 𝑊/𝑚! irradiance. STC measurements overestimate panel performance, while NOCT measurements usually underestimate panel performance. The STC cell temperature does not realistically portray its operating temperature, since a panel’s temperature rises beyond the ambient air temperature. NOCT conditions often underestimate irradiance, depending on the location, and underestimate the effect of wind cooling.
7
Figure 5: Example IV curves and numerical data from a SunPower monocrystalline silicon solar panel. © SunPower Corporation [10] Along the IV curve there’s a point of peak power. Inverters use maximum power point tracking (MPPT) to maximize power output no matter the tilt of the panel or irradiance from the sun.
Around 60 to 128 cells encapsulated together usually make up a module, which connect in either series or parallel to produce the systems total voltage and current. Usually designs wire panel cells in series to generate higher voltage and lower current so less power loss occurs in the wires. The module array contains strings of photovoltaic panels. The mechanical support, or balance of system (BOS), depends on the location of system installation. The BOS usually includes the racks used to mount the panels, whether on a roof or on the ground.
The materials used to create the BoS, which includes inverters, mounting structures, cables, and connectors, also use energy to produce. Solar photovoltaic power plants have a high BOS cost because of the concrete, space, and utility vehicles and buildings needed to set up and maintain a large capacity plant. For example, for the Springerville Generating System, concrete makes up 46.6% of its balance of system [6].
The size of a photovoltaic system can vary greatly from a small one home system to a large utility scale system spanning several acres. The system size determines the classification. Residential systems, or small-scale rooftop, usually measure around 3-10kW. Industrial scale systems, or large-scale rooftop, usually measure between 10kW and 2MW. Utility scale, or large ground mounted solar power plants, usually size larger than 2MW [11]. These sizes often affect the price per watt of a solar system due to different installation costs and permit cost to watts installed ratios.
Despite the systems’ similarities in operation and use, their histories and physical
properties generate many differences in characteristics.
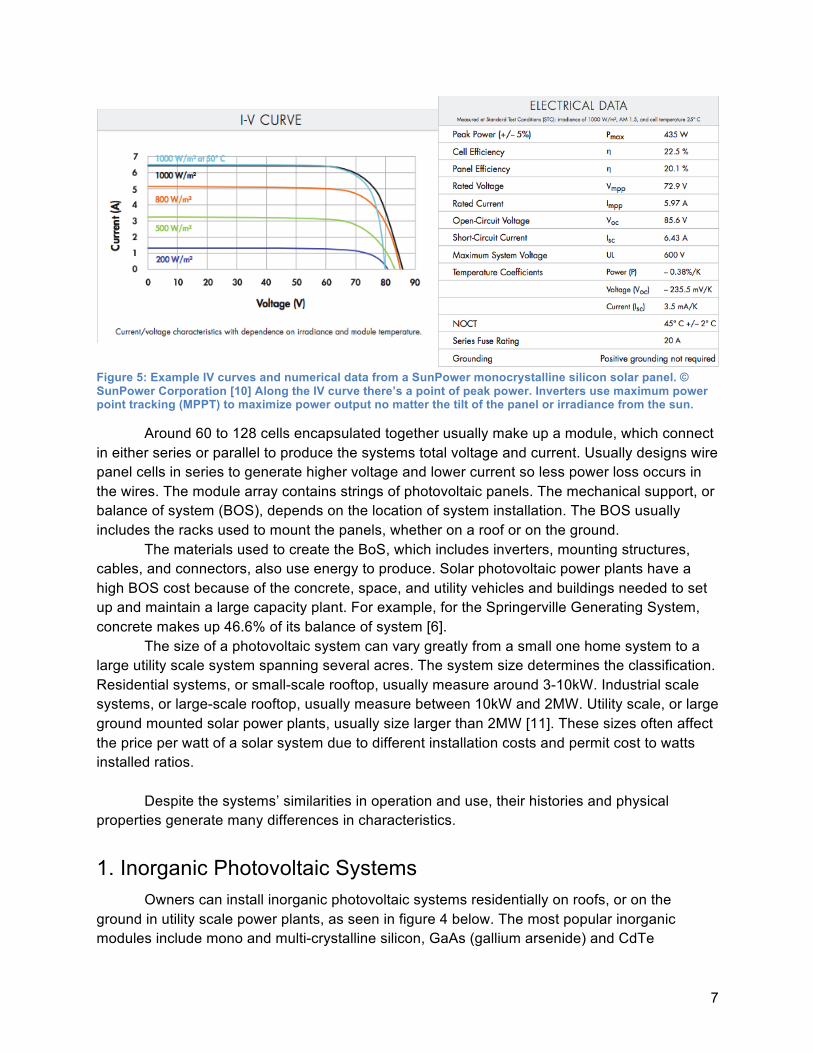
1. Inorganic Photovoltaic Systems Owners can install inorganic photovoltaic systems residentially on roofs, or on the
ground in utility scale power plants, as seen in figure 4 below. The most popular inorganic modules include mono and multi-crystalline silicon, GaAs (gallium arsenide) and CdTe
8
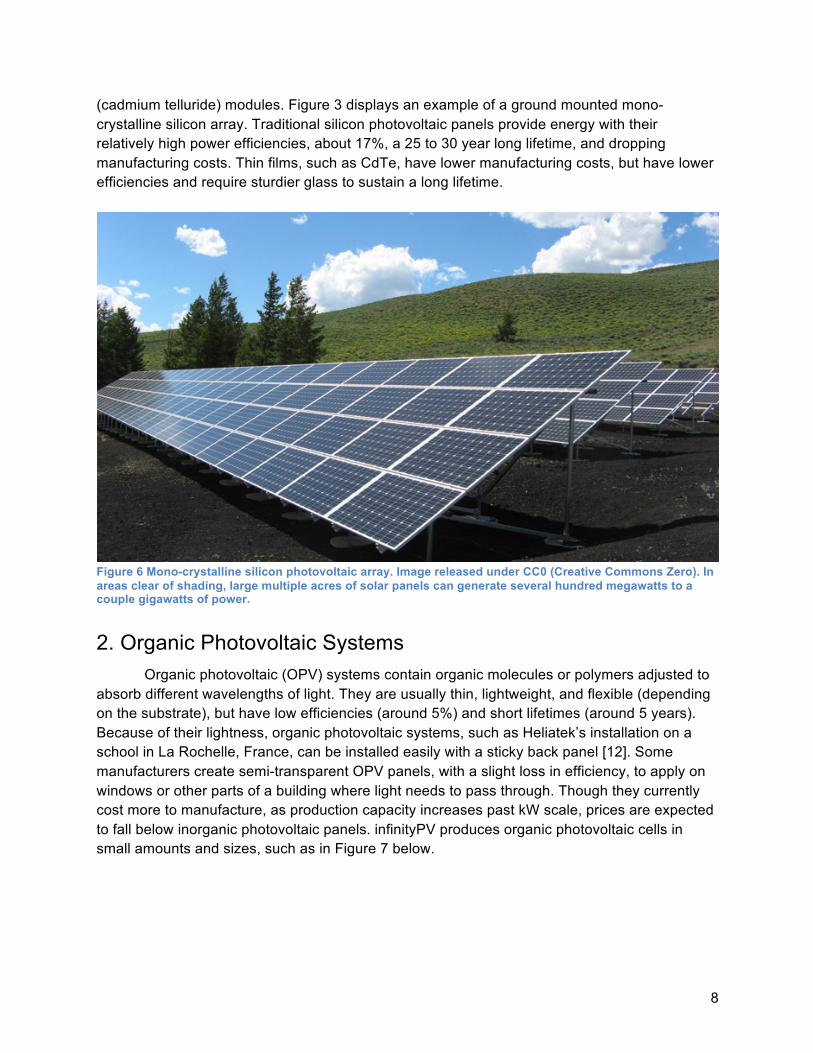
(cadmium telluride) modules. Figure 3 displays an example of a ground mounted mono-crystalline silicon array. Traditional silicon photovoltaic panels provide energy with their relatively high power efficiencies, about 17%, a 25 to 30 year long lifetime, and dropping manufacturing costs. Thin films, such as CdTe, have lower manufacturing costs, but have lower efficiencies and require sturdier glass to sustain a long lifetime.
Figure 6 Mono-crystalline silicon photovoltaic array. Image released under CC0 (Creative Commons Zero). In areas clear of shading, large multiple acres of solar panels can generate several hundred megawatts to a couple gigawatts of power.
2. Organic Photovoltaic Systems Organic photovoltaic (OPV) systems contain organic molecules or polymers adjusted to
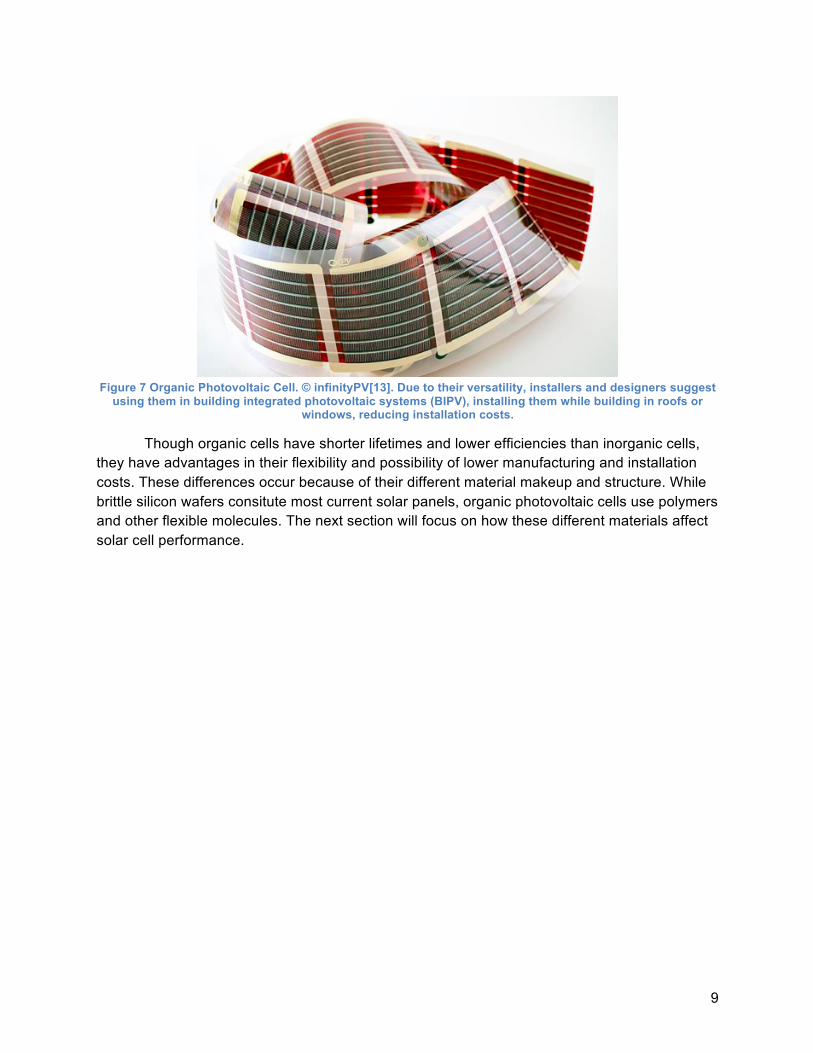
absorb different wavelengths of light. They are usually thin, lightweight, and flexible (depending on the substrate), but have low efficiencies (around 5%) and short lifetimes (around 5 years). Because of their lightness, organic photovoltaic systems, such as Heliatek’s installation on a school in La Rochelle, France, can be installed easily with a sticky back panel [12]. Some manufacturers create semi-transparent OPV panels, with a slight loss in efficiency, to apply on windows or other parts of a building where light needs to pass through. Though they currently cost more to manufacture, as production capacity increases past kW scale, prices are expected to fall below inorganic photovoltaic panels. infinityPV produces organic photovoltaic cells in small amounts and sizes, such as in Figure 7 below.
9
Figure 7 Organic Photovoltaic Cell. © infinityPV[13]. Due to their versatility, installers and designers suggest
using them in building integrated photovoltaic systems (BIPV), installing them while building in roofs or windows, reducing installation costs.
Though organic cells have shorter lifetimes and lower efficiencies than inorganic cells, they have advantages in their flexibility and possibility of lower manufacturing and installation costs. These differences occur because of their different material makeup and structure. While brittle silicon wafers consitute most current solar panels, organic photovoltaic cells use polymers and other flexible molecules. The next section will focus on how these different materials affect solar cell performance.
10
III. Material Properties and Structure Though both system types produce electricity using the photoelectric effect, where low
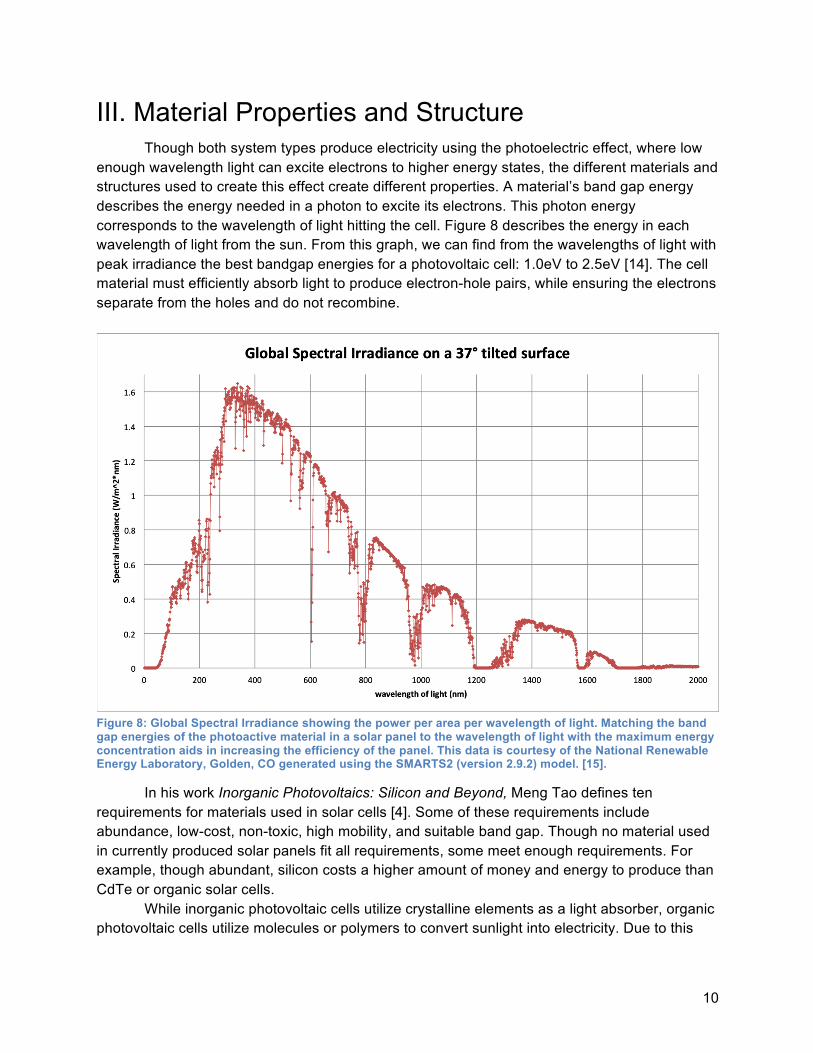
enough wavelength light can excite electrons to higher energy states, the different materials and structures used to create this effect create different properties. A material’s band gap energy describes the energy needed in a photon to excite its electrons. This photon energy corresponds to the wavelength of light hitting the cell. Figure 8 describes the energy in each wavelength of light from the sun. From this graph, we can find from the wavelengths of light with peak irradiance the best bandgap energies for a photovoltaic cell: 1.0eV to 2.5eV [14]. The cell material must efficiently absorb light to produce electron-hole pairs, while ensuring the electrons separate from the holes and do not recombine.
Figure 8: Global Spectral Irradiance showing the power per area per wavelength of light. Matching the band gap energies of the photoactive material in a solar panel to the wavelength of light with the maximum energy concentration aids in increasing the efficiency of the panel. This data is courtesy of the National Renewable Energy Laboratory, Golden, CO generated using the SMARTS2 (version 2.9.2) model. [15].
In his work Inorganic Photovoltaics: Silicon and Beyond, Meng Tao defines ten requirements for materials used in solar cells [4]. Some of these requirements include abundance, low-cost, non-toxic, high mobility, and suitable band gap. Though no material used in currently produced solar panels fit all requirements, some meet enough requirements. For example, though abundant, silicon costs a higher amount of money and energy to produce than CdTe or organic solar cells.
While inorganic photovoltaic cells utilize crystalline elements as a light absorber, organic photovoltaic cells utilize molecules or polymers to convert sunlight into electricity. Due to this
11
difference, inorganic and organic cells behave differently mechanically and require different structures to support electricity generation.
1. Inorganic Photovoltaic Cells Inorganic photovoltaic cells utilize semiconducting elements to absorb light [4]. P-type
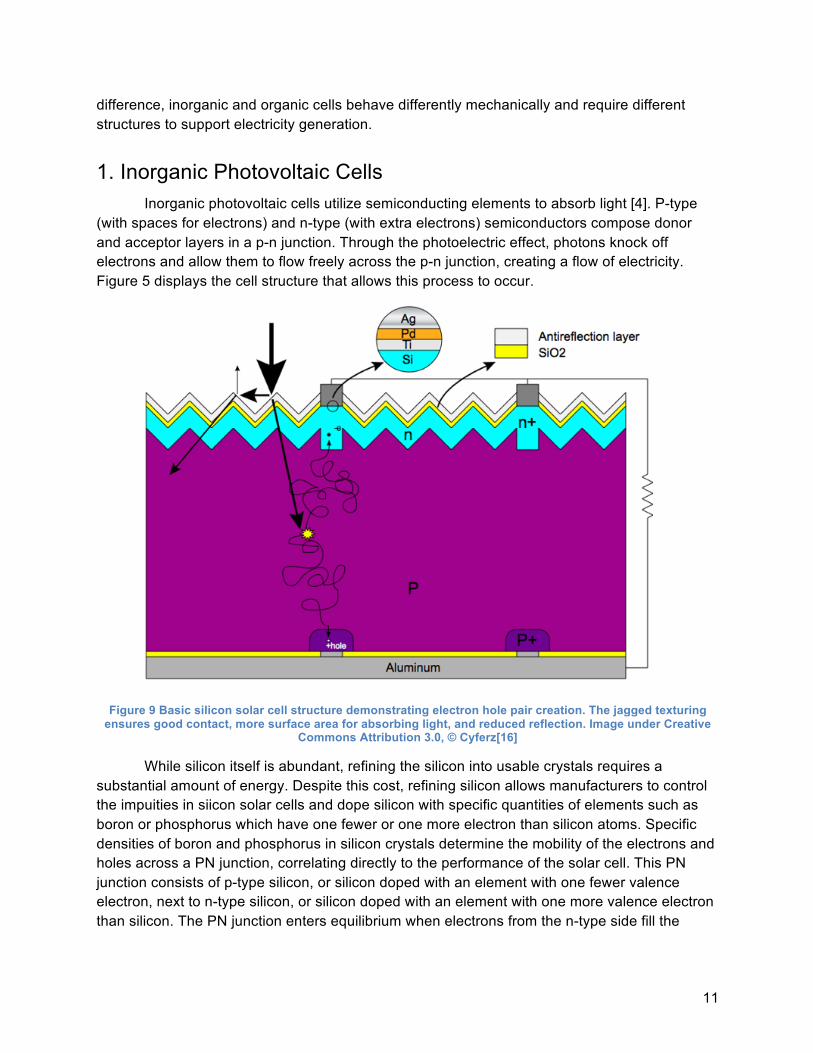
(with spaces for electrons) and n-type (with extra electrons) semiconductors compose donor and acceptor layers in a p-n junction. Through the photoelectric effect, photons knock off electrons and allow them to flow freely across the p-n junction, creating a flow of electricity. Figure 5 displays the cell structure that allows this process to occur.
Figure 9 Basic silicon solar cell structure demonstrating electron hole pair creation. The jagged texturing
ensures good contact, more surface area for absorbing light, and reduced reflection. Image under Creative Commons Attribution 3.0, © Cyferz[16]
While silicon itself is abundant, refining the silicon into usable crystals requires a substantial amount of energy. Despite this cost, refining silicon allows manufacturers to control the impuities in siicon solar cells and dope silicon with specific quantities of elements such as boron or phosphorus which have one fewer or one more electron than silicon atoms. Specific densities of boron and phosphorus in silicon crystals determine the mobility of the electrons and holes across a PN junction, correlating directly to the performance of the solar cell. This PN junction consists of p-type silicon, or silicon doped with an element with one fewer valence electron, next to n-type silicon, or silicon doped with an element with one more valence electron than silicon. The PN junction enters equilibrium when electrons from the n-type side fill the
12
empty spaces in the p-type side. The electric field generated by the junction separates electrons and holes and allows them to drift in opposite directions as an electric current. To reduce reflection and increase light absorption, manufacturers add a textured surface and an antireflectant coating as seen above in Figure 8. The cell’s cathode and anodes consist of an aluminum backsheet and a grid of silver bus bars running over the light absorbing side of the cell. Copper electrically connects the cells to form panels. Crystalline silicon solar cells have band gaps around 1.1eV, which lies within the 1.0eV to 2.5eV ideal range of band gaps defined above. Unfortunately, silicon has an indirect band gap, which means valence band electrons must also absorb enough momentum as well as energy from photons to ascend to the conduction band [14]. Since absorbing momentum and energy simultaneously is unlikely, silicon solar cells often absorb photons of higher energy. This requires crystalline silicon solar cells to have much thicker light absorbing layers than GaAs, CdTe, and organic solar cells, which have direct band gaps. Thanks to their high light absorption due to their direct band gaps, thin films can absorb light just as efficiently as silicon cells with thinner semiconducting layers. The most popular thin film, CdTe, consists of encapsulation, a transparent conductor, a CdS (cadmium sulfide) layer, the CdTe layer, a conducting back contact. Current CdTe layers only measure about 3 microns, in comparison to a silicon wafer’s width of about 150 microns [17, 18]. Due to this difference in material, a standard 60 cell silicon panel often weighs about 18 kg, while a CdTe panel weighs about 12kg.
Because silicon forms crystalline sheets, without ample protection, the cell remains brittle and easily breakable. The most commonly produced cell structure, aluminum back-surface field, includes an aluminum frame, anti-reflective glass, EVA sheets to prevent breakage, and a TPT backsheet.
Inorganic solar panels, such as crystalline silicon and CdTe, require a large amount of glass to provide protection to the solar cells. Due to absorption from iron impurities and reflections from surface imperfections, commercial glass only transmits 83.7% of the sun’s energy [19]. Solar grade glass, with low iron content and low reflection, transmit greater than 89% of the sun’s energy [19]. The low iron content reduces reflections in the glass and allows more light to reach the light absorbing layer.
We usually use the PN junction and band gap model to understand inorganic
photovoltaic cell operation. Due to the different material structure, we use the HOMO/LUMO (highest occupied and lowest unoccupied molecular orbitals) model to understand how electrons flow in organic photovoltaic cells.
2. Organic Photovoltaic Cells Organic photovoltaic cells usually include a bulk heterojunction made up of a solution
mix of an electron donor, an n-conjugated polymer semiconductor such as P3HT (poly3-hexylthiophene), and an electron acceptor, a fullerene such as PCBM (a more soluble fullerene) in a photoactive layer [20]. Unlike in a silicon photovoltaic cell, layers of the material do not allow for electron transport; because of the bound electrons and holes, the electrons and holes can
13
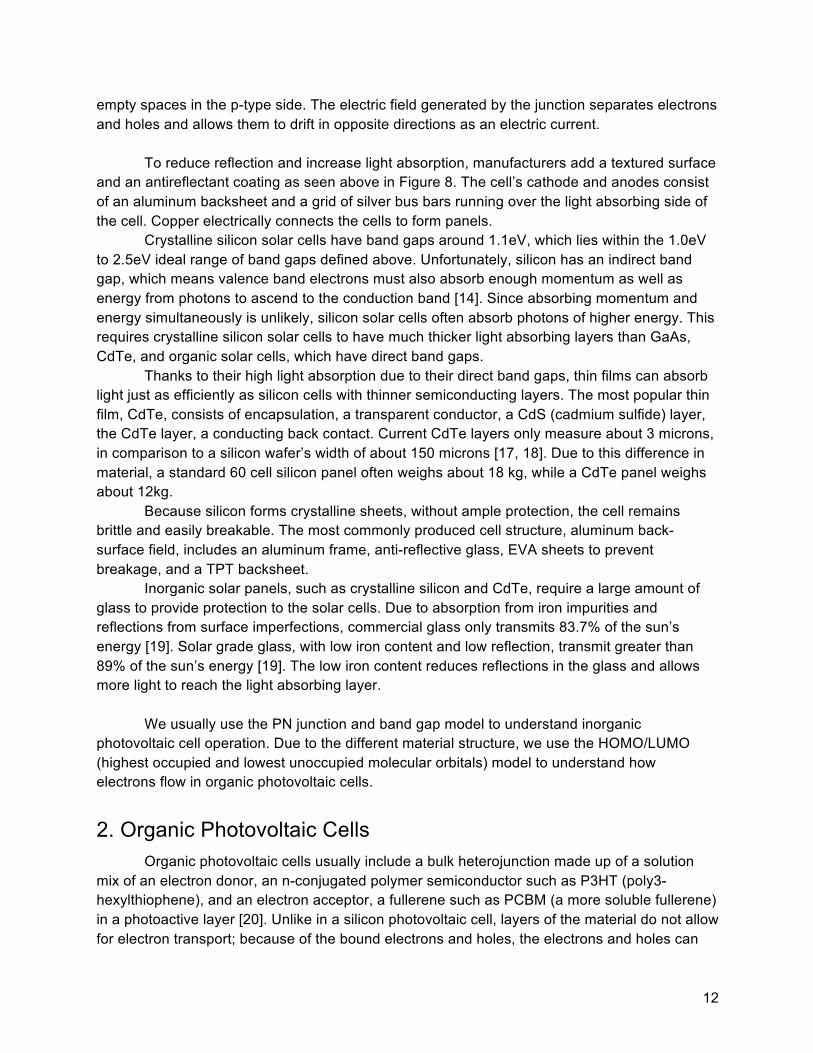
only travel a few hundred nanometers before recombining with each other. To remedy this, extremely thin layers would allow electrons to separate from holes, though this would cause difficulties in manufacturing. Figure 6 demonstrates the differences between the possible layer structures.
Figure 10 Different electron acceptor and donor junctions. a) the typical bilayer used in silicon photovoltaic cells, b) the bulk heterojunction used for organic photovoltaic cells, c) an idealized comb nanostructure [21]
Image released under CCO © ConditionalKO
The bulk heterojunction provides a random mix of acceptor and donor molecules allowing short distances for electrons and holes to diffuse, providing another solution to the reduced mobility of electrons and holes in organic molecules. The bulk heterojunction structure leads to organic photovoltaic systems having a better absorption of light at different angles and diffuse light. Oftentimes, another layer, such as a PEDOT layer, can aid in increasing the mobility of holes. Using different molecules in the bulk heterojunction results in different efficiencies, open circuit voltages, and physical properties for the organic solar cell.
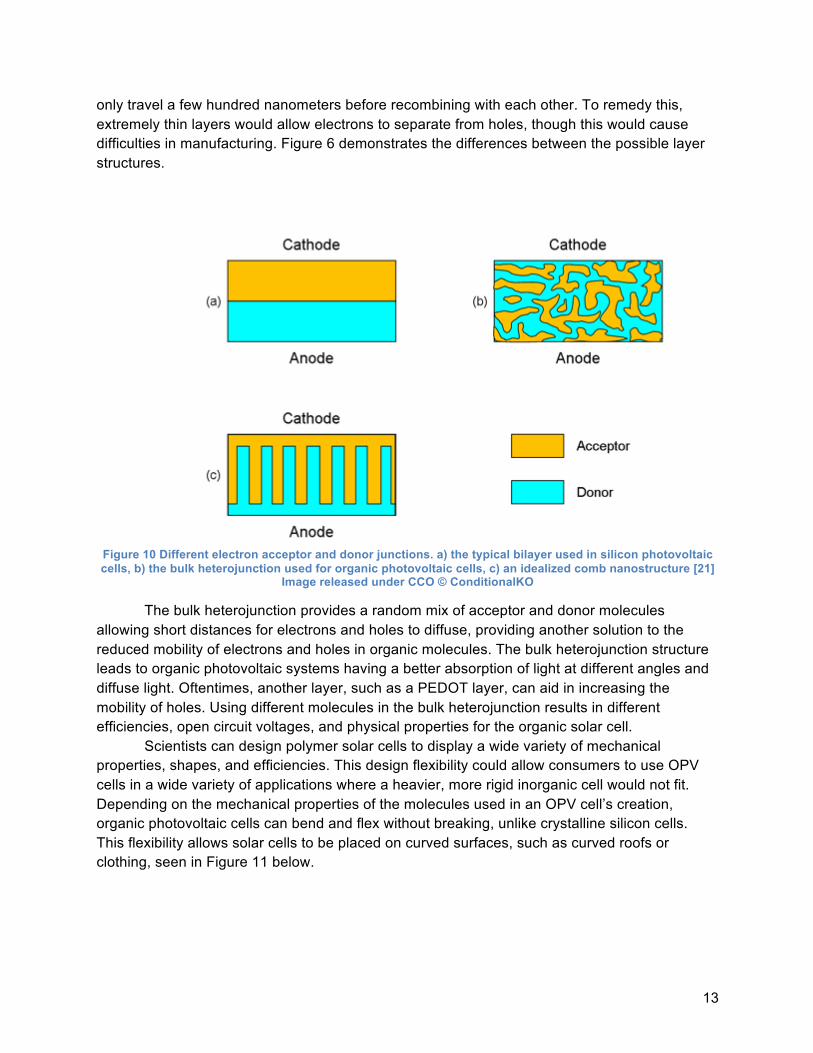
Scientists can design polymer solar cells to display a wide variety of mechanical properties, shapes, and efficiencies. This design flexibility could allow consumers to use OPV cells in a wide variety of applications where a heavier, more rigid inorganic cell would not fit. Depending on the mechanical properties of the molecules used in an OPV cell’s creation, organic photovoltaic cells can bend and flex without breaking, unlike crystalline silicon cells. This flexibility allows solar cells to be placed on curved surfaces, such as curved roofs or clothing, seen in Figure 11 below.
14
Figure 11: OPVIUS curved ceiling application[22]. Organic photovoltaic cells, due to their flexibility and easy to change design, can fit many different applications where inflexible (both mechanically and in design) inorganic photovoltaic panels will not. Image from © OPVIUS.
Organic solar cells require a small, compared to inorganic cells, amount of material. The photoactive layer only measures 0.2 microns thick, almost 1000 times thinner than silicon wafers [23]. Some cells contain more than one photoactive layer, with each layer optimized to absorb a different wavelength of light, allowing the cell to have a greater power conversion efficiency.
To aid in generating electricity, OPV cells often have extra layers besides the photoactive layer to help with light absorption or hole mobility. Some of these layers help guide light to the light absorbing layer, while others help keep holes and electrons moving and prevent them from recombining. Some processes added to OPV production also help manage light. Sol gel coatings and UV curing alter or add microstructures that help guide light so that the photoactive layer can absorb its energy more efficiently.
Water, air, and light degrade organic solar cells, reducing their lifetimes. Protecting the semiconducting layers requires several layers of encapsulation. The encapsulation layer is often the thickest layer in an OPV cell, measuring around 65µm [24]. Some layers can include a UV light absorber to protect the substrate from yellowing, and inorganic and organic layers to resist water and oxygen entrance into the cell. Building OPV cells into buildings, specifically the glass windows, can increase the panel’s lifetime. The glass serves as a barrier to particles that degrade the cell. Depending on the cell design, these encapsulation layers may change to better protect the cell by increasing the reduction of water, oxygen, and UV light that enters and degrades the cell.
Three types of organic solar cells include small molecule (SM), polymer, and dye-sensitized organic solar cells, a hybrid of an inorganic titanium oxide acceptor with organic molecule absorber dyes [20]. Manufacturing processes differ between these three types. SM
15
solar cells require vapor deposition, while polymer solar cells require spin coating or roll-to-roll manufacture.
3. Hybrid Hybrid photovoltaic cells contain both inorganic and organic materials. Some hybrid materials include dye-sensitized cells and certain perovskite structured materials. Tandem photovoltaic cells include layers of multiple photovoltaic cell types. Tandem cells often include a perovskite or organic layer along with a silicon back layer. In this way, the tandem cell gains both the silicon’s durability and the extra efficiency from the organic or perovskite layer. A tandem cell developed by Oxford PV includes silicon and perovskite layers. Perovskites are defined as a molecule with a perovskite structure. This structure allows them to be good absorbers of photons and easy to manufacture, but also reduces their lifetime when exposed to moisture. This tandem cell benefits from the silicon’s long lifetime and steady market and the extra efficiency from the perovskite. While the best silicon PV cells obtain a 22-23% efficiency, this tandem cell reaches 25% [25]. The different material properties and structures lead to different manufacturing processes. Purifying and doping silicon into the silicon wafers necessary for silicon solar panels and creating and applying polymer solution to substrate require different amounts of energy, tools, and time. The next section adds some impacts the different manufacturing processes have on a solar panel’s environmental and cost impact.
16
IV. Manufacturing The differences in materials and structures discussed in the previous section lead to different steps to acquire materials, refine those materials, and manufacture a single photovoltaic cell or panel. Any improvements in manufacturing processes can reduce a system’s price and environmental impact.
For inorganic modules such as silicon and CdTe, the largest energy usage comes from the mining and refining the materials for the module. For organic photovoltaic (OPV) systems, the encapsulation used to protect the cell requires the most material and energy usage, almost 20% of the cumulative energy demand (CED) [24].
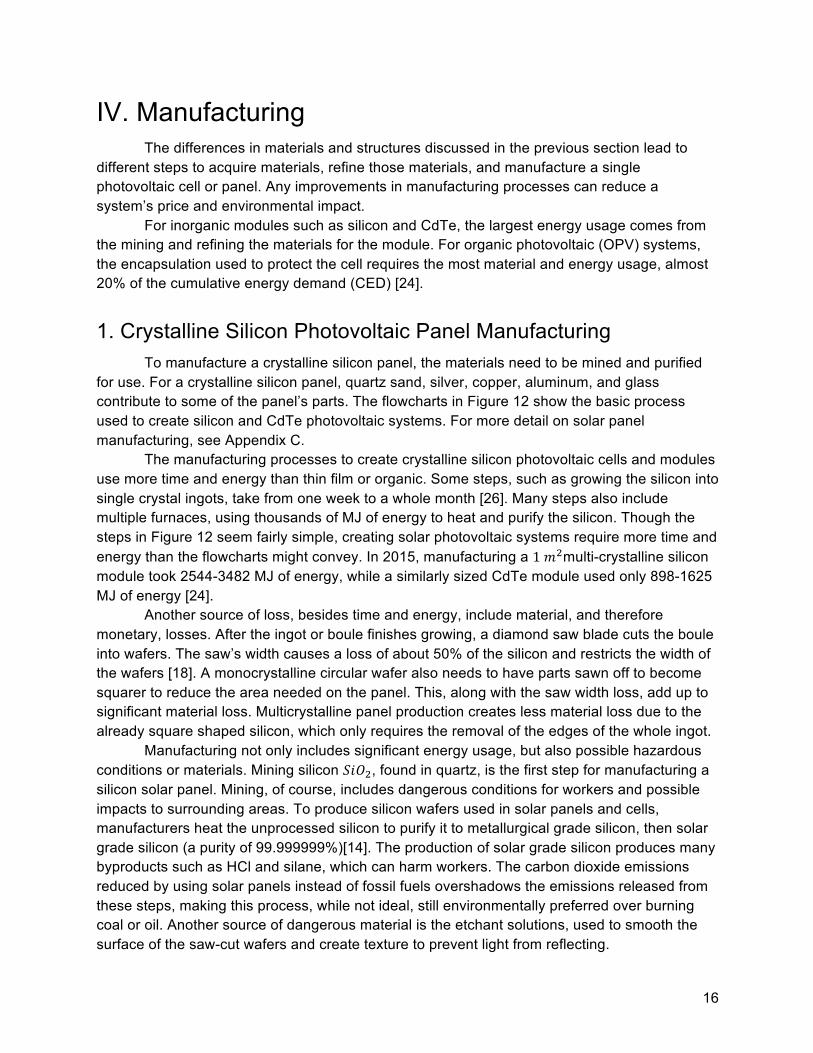
1. Crystalline Silicon Photovoltaic Panel Manufacturing To manufacture a crystalline silicon panel, the materials need to be mined and purified for use. For a crystalline silicon panel, quartz sand, silver, copper, aluminum, and glass contribute to some of the panel’s parts. The flowcharts in Figure 12 show the basic process used to create silicon and CdTe photovoltaic systems. For more detail on solar panel manufacturing, see Appendix C.
The manufacturing processes to create crystalline silicon photovoltaic cells and modules use more time and energy than thin film or organic. Some steps, such as growing the silicon into single crystal ingots, take from one week to a whole month [26]. Many steps also include multiple furnaces, using thousands of MJ of energy to heat and purify the silicon. Though the steps in Figure 12 seem fairly simple, creating solar photovoltaic systems require more time and energy than the flowcharts might convey. In 2015, manufacturing a 1 𝑚!multi-crystalline silicon module took 2544-3482 MJ of energy, while a similarly sized CdTe module used only 898-1625 MJ of energy [24].
Another source of loss, besides time and energy, include material, and therefore monetary, losses. After the ingot or boule finishes growing, a diamond saw blade cuts the boule into wafers. The saw’s width causes a loss of about 50% of the silicon and restricts the width of the wafers [18]. A monocrystalline circular wafer also needs to have parts sawn off to become squarer to reduce the area needed on the panel. This, along with the saw width loss, add up to significant material loss. Multicrystalline panel production creates less material loss due to the already square shaped silicon, which only requires the removal of the edges of the whole ingot.
Manufacturing not only includes significant energy usage, but also possible hazardous conditions or materials. Mining silicon 𝑆𝑖𝑂!, found in quartz, is the first step for manufacturing a silicon solar panel. Mining, of course, includes dangerous conditions for workers and possible impacts to surrounding areas. To produce silicon wafers used in solar panels and cells, manufacturers heat the unprocessed silicon to purify it to metallurgical grade silicon, then solar grade silicon (a purity of 99.999999%)[14]. The production of solar grade silicon produces many byproducts such as HCl and silane, which can harm workers. The carbon dioxide emissions reduced by using solar panels instead of fossil fuels overshadows the emissions released from these steps, making this process, while not ideal, still environmentally preferred over burning coal or oil. Another source of dangerous material is the etchant solutions, used to smooth the surface of the saw-cut wafers and create texture to prevent light from reflecting.
17
Figure 12 Overview of silicon and CdTe PV system production [6].
Thin film production includes multiple purification and distillation steps to obtain
semiconductor grade powders of elements such as Cd and Te. Depositions of layers of these materials on glass or stainless steel combined with encapsulation procedures creates the total thin film panel. This deposition process uses fewer materials and requires less energy than crystalline silicon manufacturing.
Manufacturing solar panels require chemicals for use in cleaning, etching, and doping that can have hazardous effects on both humans and the environment. For example, producing enough silicon for one square meter of solar panel requires 3.5 kg of hydrochloric acid during the manufacturing process [27].
18
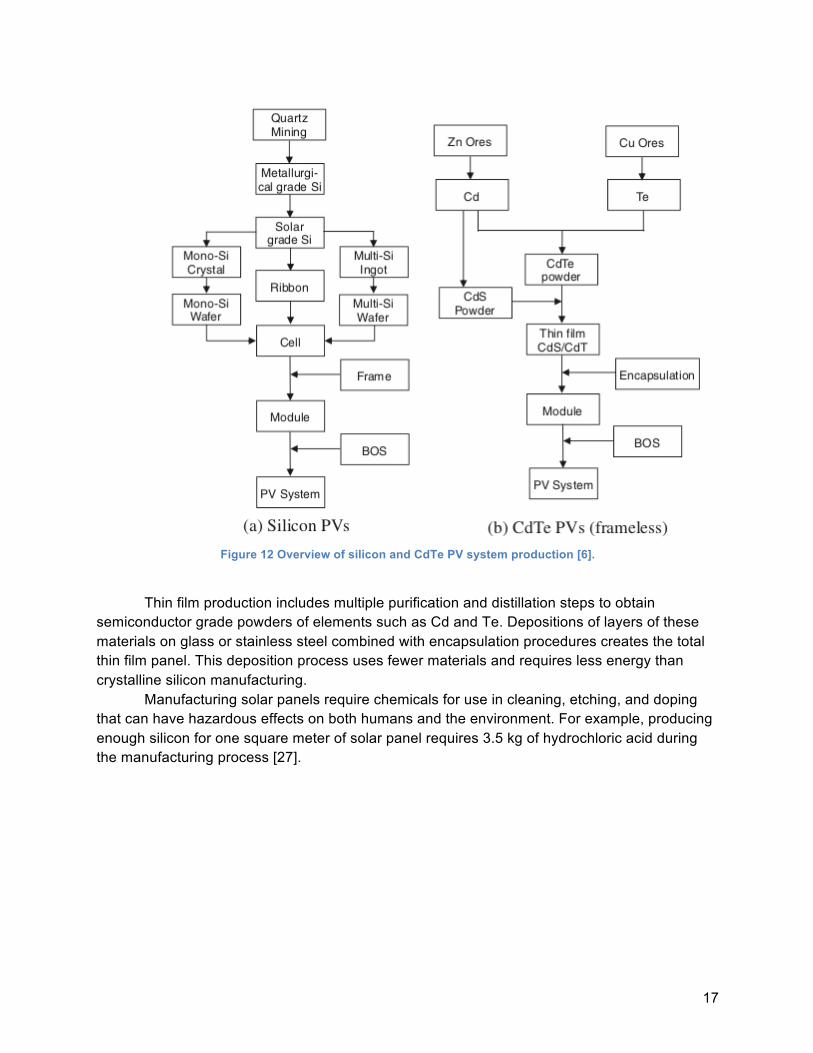
Figure 13: Energy consumed per square meter of manufactured solar panel with a range of values depending
on manufacturing process [1, 6, 24, 28].
2. Organic Photovoltaic Panel Manufacturing Organic photovoltaic cell manufacturers use roll-to-roll manufacturing, greatly reducing
the difficulty, total duration, and energy cost of manufacturing. The low temperature manufacturing allows flexible substrates, appropriate for roll-to-roll manufacturing. Since the active layer polymers easily print onto substrates in solution form, other printing methods can also create OPVs and require less time and energy than inorganic photovoltaic cells and modules. For example, the Technical University of Denmark achieved a printing speed of one 14 layer organic solar cell per second[29]. In comparison, growing a silicon boule takes from a week to a month depending on the size and quality of the boule.
Producing an organic solar cell begins with a substrate, usually a plastic like PET or glass. Then depositing or etching an electrode, usually a clear tin oxide to allow light to pass through. Roll to roll manufacturing or other printing methods deposit the layers of polymer. Finally, vaccuum deposition allows the cathode (calcium, aluminum, or silver) to be placed on the cell in a specific pattern and with few defects[30]. Due to the many different designs of organic photovoltaic cells, this manufacturing process only contains the basic elements of producing an OPV cell.
The low heat processes of creating an organic solar panel allow plastic, flexible substrates and reduce the required amount of energy. Manufacturing a 1𝑚!OPV panel only requires 108-112 MJ of energy [31]. Figure 13 shows that producing an OPV panel consumes 50-100 times less energy than crystalline silicon and around 20 times less energy than CdTe solar panels. This high reduction in energy cost makes OPV panels attractive for future use and development.
Due to the ease of manufacturing, researchers and manufacturers can add more layers to increase the efficiency of the organic solar cell by taking energy from multiple photon energy levels. Since the thin layers require a low amount of materials and a small amount of time to
19
manufacture, optimized manufacturing processes and designs can easily scale up to match demand.
These manufacturing and performance differences result in differences in cost. Equipment cost and energy requirements add to the cost of solar panels. The energy, worker, and equipment intensive processes of silicon photovoltaic manufacturing lead to high costs, though due to improvements in manufacturing and subsidies, the cost has dropped to allow energy from silicon to compete with the cost to produce energy from oil or natural gas. Despite the greater ease of manufacturing, the current cost of organic solar panels exceeds silicon solar panel costs. The next section explores reasons for this difference and possible future pricing.
20
V. Cost Before discussing cost, some terms should be defined before using them to compare organic and inorganic photovoltaic systems. The Levelized Cost of Electricity (LCOE) metric allows consumers to compare the cost of electricity produced by different sources. LCOE represents the cost per kWh using the total price of the system over the lifetime energy generation. It also considers the time value of money and inflation affects energy costs. If the levelized cost of electricity produced by photovoltaic systems decreases to lower than the commercial cost of electricity, the consumer could install photovoltaic panels to their own economic gain.
In the U.S., consumers pay around 12.55 cents per kWh, but the cost can vary to as low as 9.34 cents in Louisiana to as high as 27.47 cents in Hawaii, depending on the state’s electricity mix. Between 1990 and 2015, the average price of electricity has risen from 7.83 cents to 12.65 cents per kWh [32]. These rising costs combined with the lowering cost of photovoltaic modules result in solar power becoming more cost effective.
Demand for utility scale photovoltaic systems depends highly on cost. Cost per watt for large systems dictates whether the system’s owner profits or not. Slight changes in the price can shift the profit from low, close to break even, to worth the trouble of installing [33]. Tariffs on solar panels added sufficient cost that companies canceled many planned solar projects [34]. Despite these cost barriers, the cost of photovoltaic systems becomes more affordable, especially with the rising cost of nonrenewable energy sources.
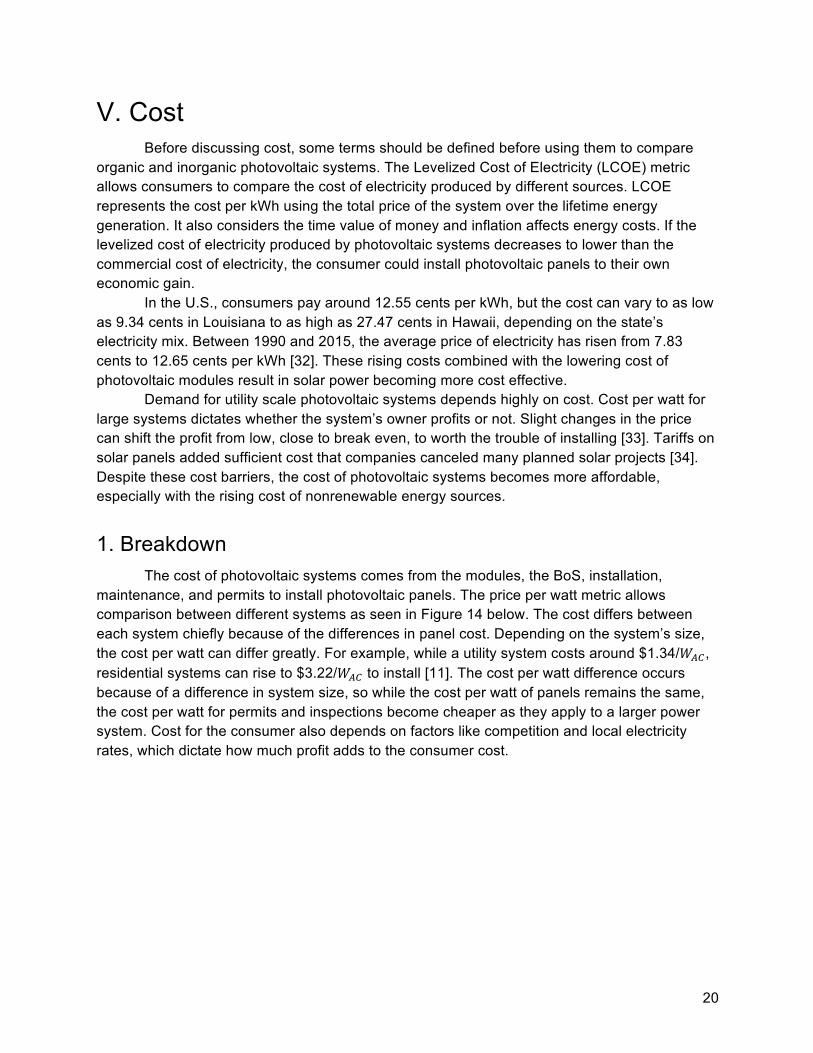
1. Breakdown The cost of photovoltaic systems comes from the modules, the BoS, installation, maintenance, and permits to install photovoltaic panels. The price per watt metric allows comparison between different systems as seen in Figure 14 below. The cost differs between each system chiefly because of the differences in panel cost. Depending on the system’s size, the cost per watt can differ greatly. For example, while a utility system costs around $1.34/𝑊!", residential systems can rise to $3.22/𝑊!" to install [11]. The cost per watt difference occurs because of a difference in system size, so while the cost per watt of panels remains the same, the cost per watt for permits and inspections become cheaper as they apply to a larger power system. Cost for the consumer also depends on factors like competition and local electricity rates, which dictate how much profit adds to the consumer cost.
21
Figure 14 NREL Cost Benchmark for the year 2017 displaying the cost breakdowns to install differently sized systems ©NREL [11]
2. Financial Comparison The cost differences between organic and inorganic systems come from the differences
in panel, BoS, installation, and maintenance costs. Other cost factors such as inverter and permits do not apply to differences between systems since both systems require identical inverters and permits, but do not share identical efficiencies, required mechanical support structures, or ease of maintenance and installation. Another cause of current cost differences includes a difference in production numbers. Crystalline silicon’s longer history cumulates in more refined production processes than organic photovoltaic panels and larger production numbers, which allows for a lower pricing on the market.
Due to reducing module, inverter, and installation costs, the total cost of a silicon photovoltaic system dropped 56% from 2009 to 2015[1]. For multi-crystalline Si solar panels, the price in 2017 dropped to $0.73/W for U.S. manufactured panels, while imported panels, due to subsidies and higher production number fell under $0.50/W. These prices include supply chain costs such as shipping and handling, historical inventory, and tax. Historical inventory increases price because of a price lag between the cost of the panels in the installer’s inventory and the price of currently manufactured panels.
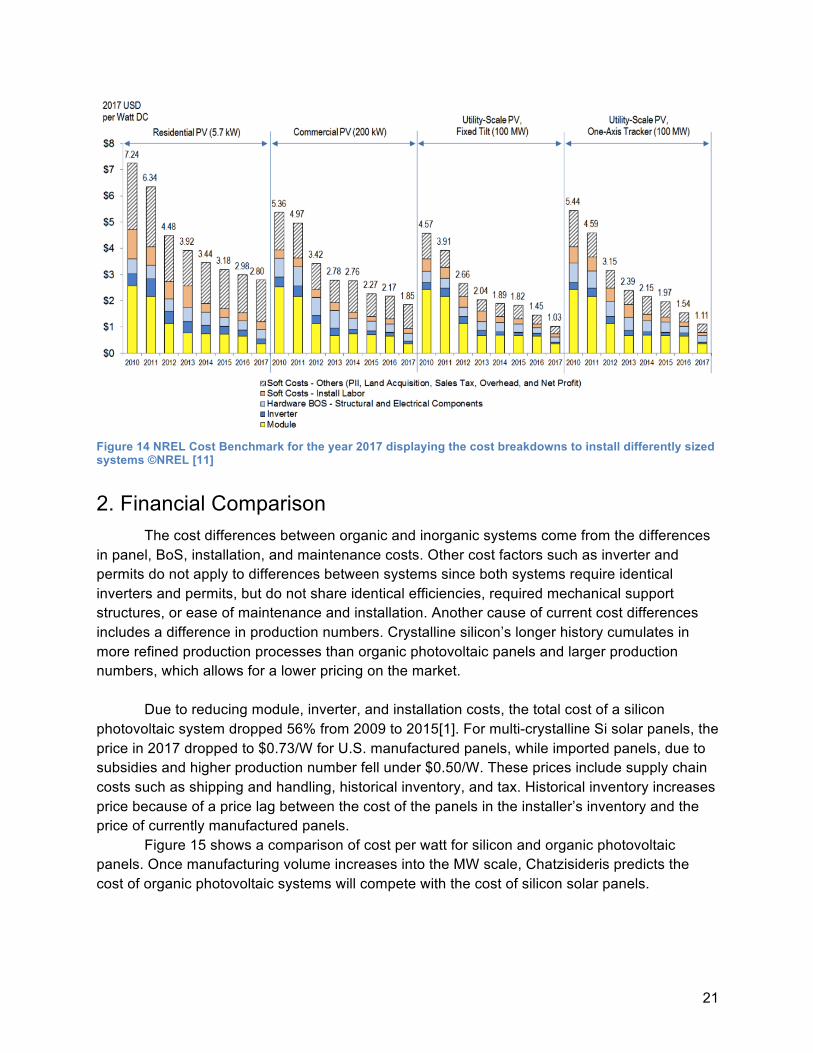
Figure 15 shows a comparison of cost per watt for silicon and organic photovoltaic panels. Once manufacturing volume increases into the MW scale, Chatzisideris predicts the cost of organic photovoltaic systems will compete with the cost of silicon solar panels.
22
Figure 15: The cost per watt for silicon and organic photovoltaic systems. The large scale OPV shows what
happens to the price of OPV panels when manufacturing volume increases. The current kW scale manufacturing, due to small product outputs and large equipment inputs, result in a higher cost per watt for
currently produced organic photovoltaic systems[11, 35, 36].
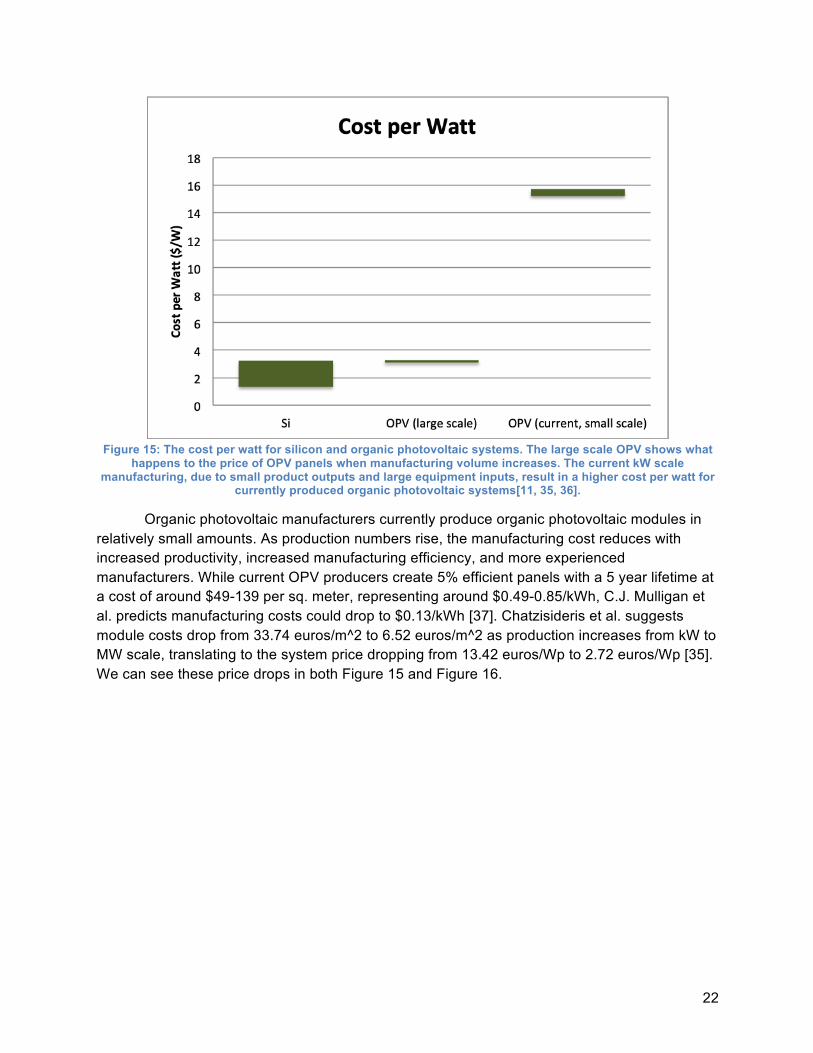
Organic photovoltaic manufacturers currently produce organic photovoltaic modules in relatively small amounts. As production numbers rise, the manufacturing cost reduces with increased productivity, increased manufacturing efficiency, and more experienced manufacturers. While current OPV producers create 5% efficient panels with a 5 year lifetime at a cost of around $49-139 per sq. meter, representing around $0.49-0.85/kWh, C.J. Mulligan et al. predicts manufacturing costs could drop to $0.13/kWh [37]. Chatzisideris et al. suggests module costs drop from 33.74 euros/m^2 to 6.52 euros/m^2 as production increases from kW to MW scale, translating to the system price dropping from 13.42 euros/Wp to 2.72 euros/Wp [35]. We can see these price drops in both Figure 15 and Figure 16.
23
Figure 16: Levelized cost of electricity for silicon PV, OPV and nonrenewable energy sources such as coal. Current OPV designs result in a wide range of costs per kWh based on their manufacturing cost, efficiency,
and lifetime. Also shown in Figure 14, increasing the scale of manufacturing lowers the cost to produce, lowering an organic photovoltaic system’s levelized cost of electricity[24, 36, 37].
Though currently, organic PV systems cannot compete with other electricity generators in price, they have a high potential for lower costs, reduced environmental impact, lower production time, and a wider variety of uses. The lower cost potential stems from lower installation difficulty and time, which results in lower installation costs for a system, and from low energy and material usage. Compared to silicon and other inorganic photovoltaic systems, OPV systems require much less energy to produce. The following section looks more closely at the differences in energy costs between these photovoltaic systems.
3. Energy Comparison The total energy used to produce, transport, and maintain a photovoltaic system also measures a cost. To offset costs and produce profit, the system must generate more energy than it consumes during its lifetime. Metrics for comparing the energy consumed and the energy generated include the energy payback time (EPBT) and the energy return on energy invested (EROI).
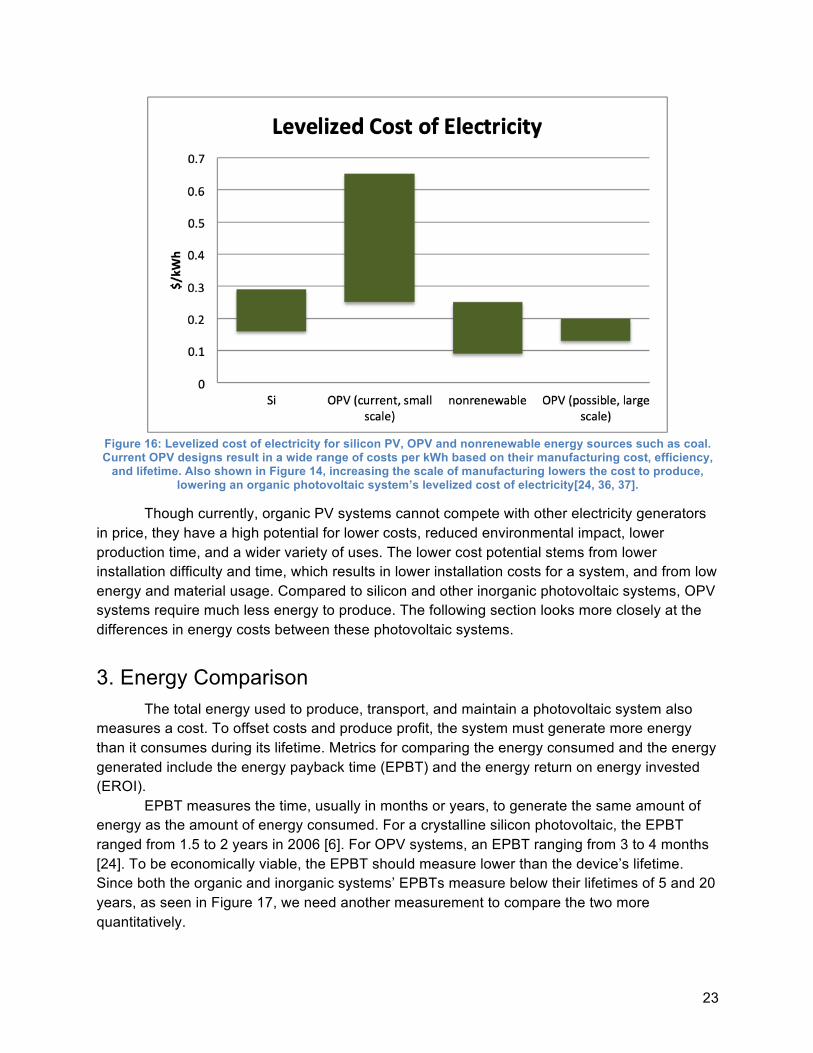
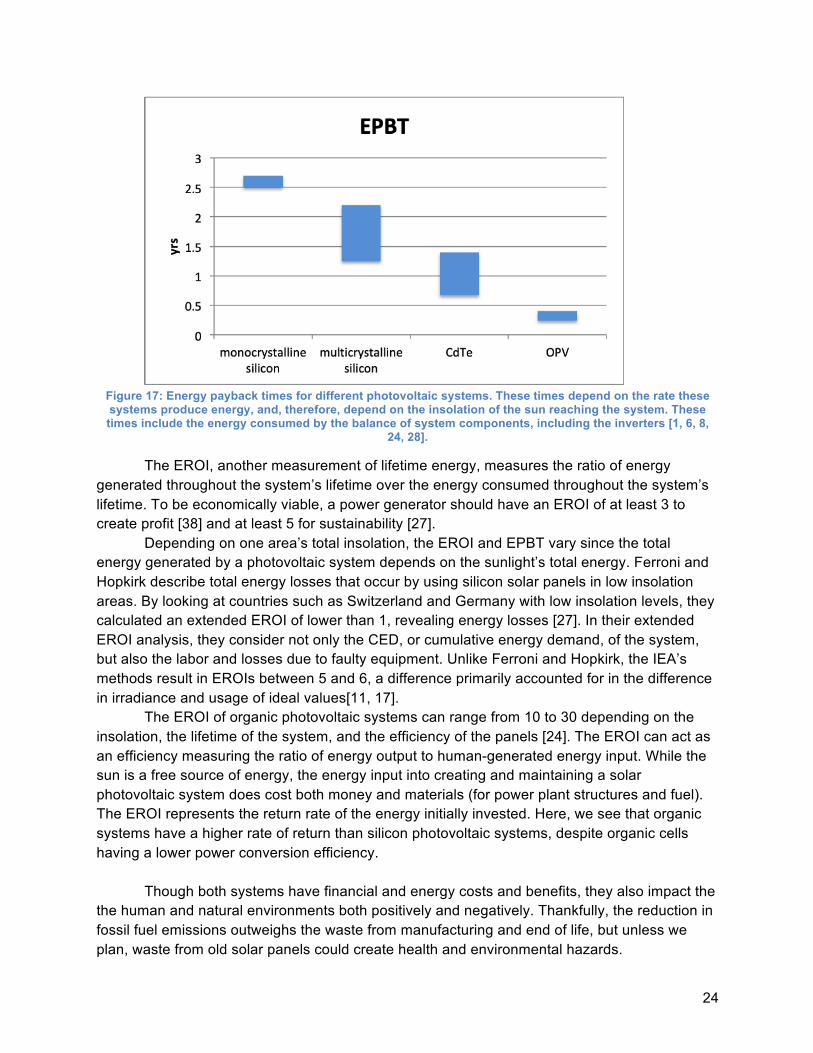
EPBT measures the time, usually in months or years, to generate the same amount of energy as the amount of energy consumed. For a crystalline silicon photovoltaic, the EPBT ranged from 1.5 to 2 years in 2006 [6]. For OPV systems, an EPBT ranging from 3 to 4 months [24]. To be economically viable, the EPBT should measure lower than the device’s lifetime. Since both the organic and inorganic systems’ EPBTs measure below their lifetimes of 5 and 20 years, as seen in Figure 17, we need another measurement to compare the two more quantitatively.
24
Figure 17: Energy payback times for different photovoltaic systems. These times depend on the rate these systems produce energy, and, therefore, depend on the insolation of the sun reaching the system. These times include the energy consumed by the balance of system components, including the inverters [1, 6, 8,
24, 28].
The EROI, another measurement of lifetime energy, measures the ratio of energy generated throughout the system’s lifetime over the energy consumed throughout the system’s lifetime. To be economically viable, a power generator should have an EROI of at least 3 to create profit [38] and at least 5 for sustainability [27].
Depending on one area’s total insolation, the EROI and EPBT vary since the total energy generated by a photovoltaic system depends on the sunlight’s total energy. Ferroni and Hopkirk describe total energy losses that occur by using silicon solar panels in low insolation areas. By looking at countries such as Switzerland and Germany with low insolation levels, they calculated an extended EROI of lower than 1, revealing energy losses [27]. In their extended EROI analysis, they consider not only the CED, or cumulative energy demand, of the system, but also the labor and losses due to faulty equipment. Unlike Ferroni and Hopkirk, the IEA’s methods result in EROIs between 5 and 6, a difference primarily accounted for in the difference in irradiance and usage of ideal values[11, 17].
The EROI of organic photovoltaic systems can range from 10 to 30 depending on the insolation, the lifetime of the system, and the efficiency of the panels [24]. The EROI can act as an efficiency measuring the ratio of energy output to human-generated energy input. While the sun is a free source of energy, the energy input into creating and maintaining a solar photovoltaic system does cost both money and materials (for power plant structures and fuel). The EROI represents the return rate of the energy initially invested. Here, we see that organic systems have a higher rate of return than silicon photovoltaic systems, despite organic cells having a lower power conversion efficiency.
Though both systems have financial and energy costs and benefits, they also impact the
the human and natural environments both positively and negatively. Thankfully, the reduction in fossil fuel emissions outweighs the waste from manufacturing and end of life, but unless we plan, waste from old solar panels could create health and environmental hazards.
25
VI. Environmental The main environmental impacts of photovoltaic systems stem from the materials and
processes used to manufacture them. Materials used in modules or to produce modules include silane, lead, arsenic, and different acids including hydrochloric acid and hydrofluoric acid, which could harm workers in production or release into the environment if not properly contained or disposed. Indirectly, the manufacturing of photovoltaic systems releases particles into the air during the generation of energy used to power the production. Depending on where the manufacturing occurs, the primary sources of electricity generation could include coal or oil.
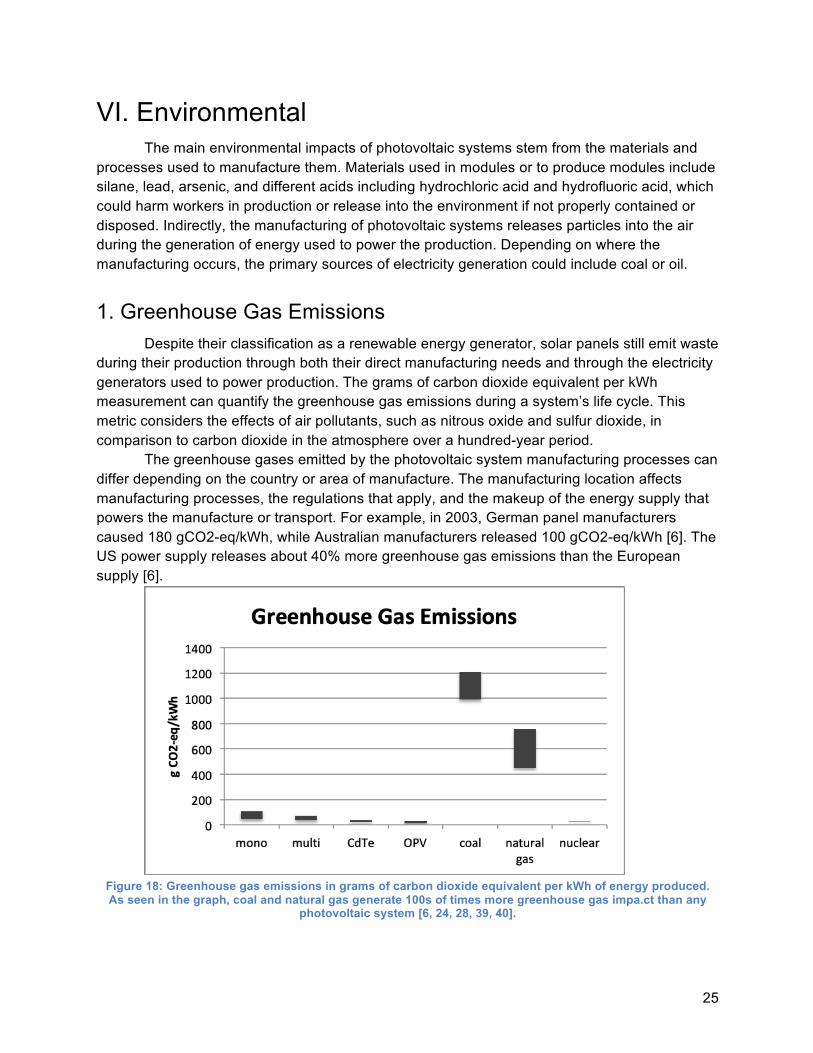
1. Greenhouse Gas Emissions Despite their classification as a renewable energy generator, solar panels still emit waste during their production through both their direct manufacturing needs and through the electricity generators used to power production. The grams of carbon dioxide equivalent per kWh measurement can quantify the greenhouse gas emissions during a system’s life cycle. This metric considers the effects of air pollutants, such as nitrous oxide and sulfur dioxide, in comparison to carbon dioxide in the atmosphere over a hundred-year period.
The greenhouse gases emitted by the photovoltaic system manufacturing processes can differ depending on the country or area of manufacture. The manufacturing location affects manufacturing processes, the regulations that apply, and the makeup of the energy supply that powers the manufacture or transport. For example, in 2003, German panel manufacturers caused 180 gCO2-eq/kWh, while Australian manufacturers released 100 gCO2-eq/kWh [6]. The US power supply releases about 40% more greenhouse gas emissions than the European supply [6].
Figure 18: Greenhouse gas emissions in grams of carbon dioxide equivalent per kWh of energy produced. As seen in the graph, coal and natural gas generate 100s of times more greenhouse gas impa.ct than any
photovoltaic system [6, 24, 28, 39, 40].
26
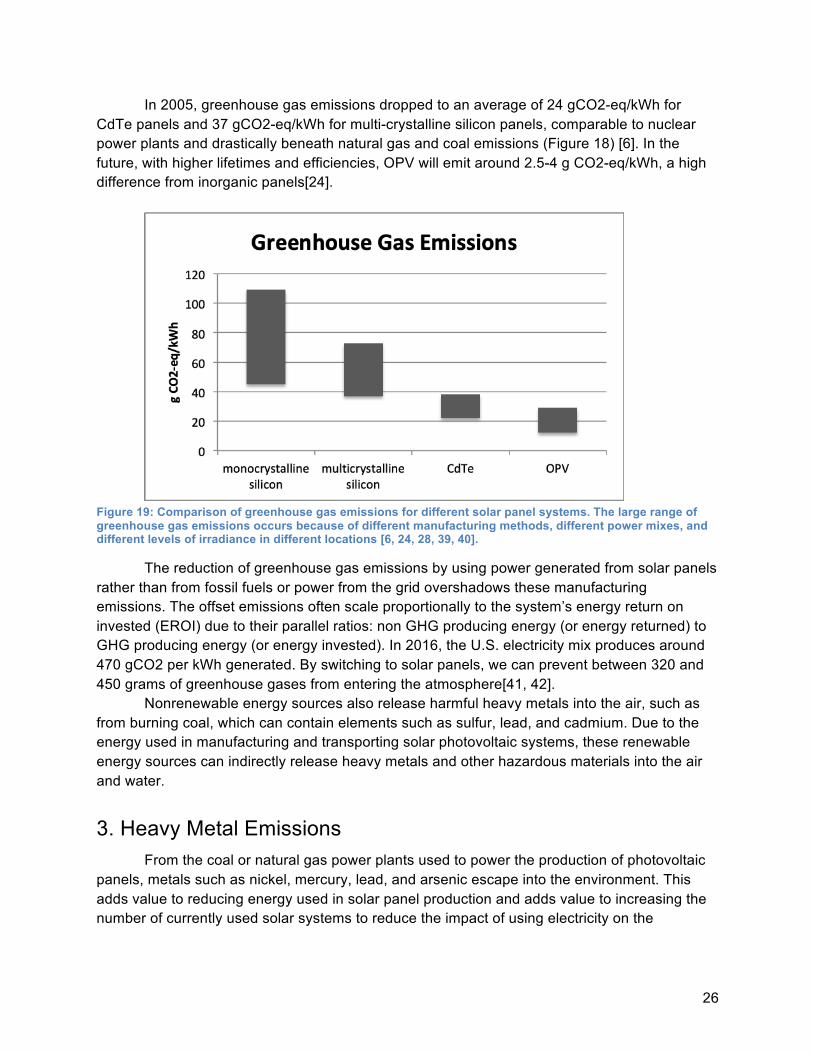
In 2005, greenhouse gas emissions dropped to an average of 24 gCO2-eq/kWh for CdTe panels and 37 gCO2-eq/kWh for multi-crystalline silicon panels, comparable to nuclear power plants and drastically beneath natural gas and coal emissions (Figure 18) [6]. In the future, with higher lifetimes and efficiencies, OPV will emit around 2.5-4 g CO2-eq/kWh, a high difference from inorganic panels[24].
Figure 19: Comparison of greenhouse gas emissions for different solar panel systems. The large range of greenhouse gas emissions occurs because of different manufacturing methods, different power mixes, and different levels of irradiance in different locations [6, 24, 28, 39, 40].
The reduction of greenhouse gas emissions by using power generated from solar panels rather than from fossil fuels or power from the grid overshadows these manufacturing emissions. The offset emissions often scale proportionally to the system’s energy return on invested (EROI) due to their parallel ratios: non GHG producing energy (or energy returned) to GHG producing energy (or energy invested). In 2016, the U.S. electricity mix produces around 470 gCO2 per kWh generated. By switching to solar panels, we can prevent between 320 and 450 grams of greenhouse gases from entering the atmosphere[41, 42].
Nonrenewable energy sources also release harmful heavy metals into the air, such as from burning coal, which can contain elements such as sulfur, lead, and cadmium. Due to the energy used in manufacturing and transporting solar photovoltaic systems, these renewable energy sources can indirectly release heavy metals and other hazardous materials into the air and water.
3. Heavy Metal Emissions From the coal or natural gas power plants used to power the production of photovoltaic
panels, metals such as nickel, mercury, lead, and arsenic escape into the environment. This adds value to reducing energy used in solar panel production and adds value to increasing the number of currently used solar systems to reduce the impact of using electricity on the
27
environment. Some other dangerous metals show up during solar panel production, such as for CdTe and GaAs.
During manufacture or disposal, heavy metals found in panels or in the production of panels can be released into the environment. CdTe panels contain cadmium, which can be released in a fire, though only in small amounts of 0.4-0.6% as revealed by Brookhaven National Laboratory. Damaged CdTe solar panels can result in Cd leaking out in the rain. Despite this danger, often the harm from any fire that causes the panels to break outweighs any harm from touching the Cd in the solar panel [14]. Burning oil and coal releases 10 to 100 times more cadmium into the air per GWh of energy produced than cadmium released during CdTe production and use [6]. While we should have caution when dealing with the manufacturing and disposal of these solar panels, it does not pose as much of a risk as oil or coal.
Beyond these risks, the solar panels entering the waste stream in around 30 years can cause the same problems as other electronic waste. Before this happens, we must find a way to recycle or reuse old solar panels.
4. Recycling and Reuse At the end of a panel’s lifetime, owners can dispose of them in a dump, recycle them, or
reuse them. If left in a dump, the chance of broken panels releasing more emissions increases. Though the current amount of decommissioned photovoltaic panels weighs only around tons. In 2017, the total installed PV capacity in the world reached at least 96 GW. SEIA, IEA, and IRENA expect this number to grow, resulting in 78 million metric tons of waste in the year 2050 [43]. The WEEE directive prevents the waste of electronics, including PV panels, in Europe. By increasing the availability of recycling, a lower amount of e-waste will enter landfills.
Recycling can lower the total amount of waste, redirect more materials back into the market, and create profits and jobs. IRENA estimates a total value of $450 million of material extracted from all the recycled solar panels in 2030 can create around 60 million new solar panels or about 18GW of power [17].
Some challenges to recycling inorganic photovoltaic modules include the poor quality of
silicon recovered from used panels and the presence of heavy metals that prevent clean extraction of other elements. The low-quality silicon, while not of use in more panels, can contribute to aluminum or steel alloys used in construction or other manufacturing. Some companies operate a return program for used panels such as First Solar, who recycles their CdTe panels that customers return. For more companies to invest and focus on PV recycling, recycling must be profitable. Currently, research progresses into methods for extracting the most amount of resources with the least amount of energy.
Some challenges in increasing recycling profit include safety and transportation. Ensuring proper extraction of harmful components often raises costs. The alternative of just recycling the most profitable portions of a solar panel could result in chemicals leaching, especially for countries without regulations on environmental impact. Transporting heavy inorganic solar panels to a recycling plant also raises the cost of recycling and reduces its profitability. Some Chinese officials, for example, consider reuse more viable option [44].
28
Recycling parts or materials used during manufacturing can also reduce energy consumption. For example, recycling the slurry used in sawing wafers reduced the energy payback time of solar panels by 10% [6].
The FRELP, Full Recovery End of Life Photovoltaic, project aims to recycle solar panels in Europe. Research includes a process that can recover 93% of materials in a module, though this process also releases some nitrous oxides and other components [45]. Meng Tao designed another process, called electrowinning, extracting $13 worth of materials, which could allow recycling companies to profit from operations [45]. The low production of organic photovoltaic systems results in less research and interest in recycling them, though some research aims to design an easily recyclable OPV design by using cellulose instead of plastic[46].
Since most end of life silicon panels still work, just below their rated power, reuse can
extract the remaining potential for power generation from the old panels. With increasing panel efficiencies, an end of lifetime panel at an efficiency good for 30 years ago might not produce sufficient energy to match the cost to reinstall or keep installed. Selling old solar panels can result in some profit for the seller and cheap solar panels for the buyer. While the used solar panels operate at a lower efficiency than new panels, they can still offer the buyer reasonably good energy output for a lower priced panel.
The organic photovoltaic degradation at their end of life reduces the likelihood of this option in organic photovoltaic waste stream possibilities.
The cost to recycle or properly dispose of solar panels must go somewhere and policy
makers remain undecided on whom the cost should go to. Since many photovoltaic panel companies go bankrupt, the cost to recycle solar panels could put a greater burden on them and reduce their ability to profit and grow. On the other hand, since OPV panels weigh much less, they have a lower impact in the total amount of waste. Since OPV panels recently entered the market, they have a substaintial amount of room to re-design for a lower impact on the environment or a lower cost to recycle.
The largest number of solar panels entering the waste streams come from gigawatt
scale utility solar power plants. The biggest contain more than 2 million solar panels and often cover more than 2,000 acres[47]. Compared to nuclear or natural gas, solar power requires a higher amount of land to produce the same amount of energy. This can have both financial costs (for land) and the cost of taking the ability to use that land for another use.
5. Land Use When installing utility scale solar power plants in previously un-built land, the power plant instruction impacts the land and wildlife living in the area by reducing habit and degrading land. While crystalline silicon and CdTe ground mount solar plants exist, organic photovoltaic power plants do not and are unlikely to exist in the future due to their low durability and low weight optimizing them for building usage. Solar panel power systems require more land than most to produce power. A silicon crystalline power plant requires around 8 acres of area per MW of energy [48]. They require
29
more space than other energy sources, such as nuclear and wind[49]. This land requirement has a larger impact in countries with high population densities and lower amounts of land area. Though inorganic solar power plants do require a significant amount of land (especially for countries with a low area per capita), many installers find ways to increase the productivity of the land by overlapping solar power generation with another use. For example, the Solarwise Garden in Minnesota overlaps a solar farm with 15 beehives and small bee-friendly plants to produce energy and honey as well as supporting the bee population [50]. Other solar farms, such as the GoldTree Farm at Cal Poly, San Luis Obispo, rotate grazing animals onto the land to reduce grass height and add productivity to the land area[51]. Another classic way to overlap land use with solar panels is installing the panels on a building. A lower efficiency panel such as organic photovoltaic cells would need to use more space per MW of energy, but since they primarily reside on buildings, installers do not need to use the land solely for solar panels. The ability to match the architecture allows greater use for OPVs on buildings than inorganic panels which consumers often do not use because of their lack of aesthetically pleasing designs. Finding productive uses for land so people in the future can grow food, build houses, and generate energy is a component of sustainability. Sustainable photovoltaic system production and use should continue without affecting the way people live. This includes minding the health of both the human population, the environments, and the economy.
30
VII. Sustainability In earlier sections, we considered some aspects of the sustainability of these photovoltaic systems, including their return on energy, recycling and reuse, greenhouse gas emissions, and cost. Both organic and inorganic photovoltaic systems, due to their similar reduction of greenhouse gases and energy generation methods, aid in improving human health and social wellbeing.
1. Pollution All solar photovoltaic systems reduce pollution due to reducing fuel use. This reduction
in greenhouse gases, heavy metals, and other harmful chemicals, aids in reducing environmental factors detrimental to the health of humans and the environment. Pollution causes many diseases such as asthma, lung diseases, and heart diseases, as well as cancer[52]. Many air pollutants are also greenhouse gases, which cause global warming.
Global warming affects local weather, animal and plant life, and global temperatures. In some places, higher temperatures due to climate change increase pollen and mold levels, which can affect people with allergies and asthma[52]. Natural disasters such as hurricanes and wildfires also show a link to global warming. Another effect of global warming includes rising sea levels, which will reduce land area and destroy many coastal communities. These effects of greenhouse gases cost the U.S. about $360 billion between 2007 and 2017[53]. By reducing greenhouse gases and pollution through organic and inorganic photovoltaic systems, we can reduce the economic burden placed on governments and improve the health of the population.
2. Job Creation The photovoltaic industry improves the lives of people in another way by adding jobs and
careers. Since the solar photovoltaic industry grows faster than either coal or natural gas, careers in solar energy also grow. Solar energy careers include not only manufacturing or installation, but also policy-making, education, and research. Compared to natural gas, coal, or even hydroelectric, solar photovoltaic energy systems are a recent addition to commercial use.
The installation, maintenance, and decommissioning of a silicon photovoltaic system creates 7 times more jobs than the construction, operation, maintenance, and decommissioning of a nuclear power plant per MW [27]. Since organic solar systems require fewer installation hours and require more decommissioning due to their lower lifetimes, their labor requirements in comparison to silicon photovoltaic systems contain some uncertainty, especially since they are still under research.
Despite the good both photovoltaic systems generate in economic and human health, some externalities such as the effects of waste and rare material use need work in their prevention.
31
3. Waste Though solar panels create positive externalities such as reduced pollution and healthier people, the waste they create can negatively impact the people and the environment. Many countries have not yet decided how to handle solar panel waste. As with other electronic waste, poorer countries often face the risk of dumping. This dumping could release toxic substances in the soil and air, reducing the health of both the people and the environment. In 2014, the total added e-waste weighed 41.8 million metric tonnes. IRENA and the IEA predict that by 2050, consumers will add about 4 million metric tons of PV panels to the e-waste total annually [17]. This number does not include the waste due to inverters, mounting systems, or wires, the other components in a photovoltaic system. This greatly increases the total waste number especially since inverters have a relatively short lifespan and often fail earlier than expected. Due to the low material use of OPV, they will most likely makeup a low percentage of the total photovoltaic waste. If a larger portion of the installed solar panels consist of OPV panels, this could reduce the total amount of waste. We can reduce waste by recycling the photovoltaic systems or reducing the material usage in the first place. Rarer materials such as indium need recycling or reducing to preserve their supply in the future.
4. Material Use To ensure manufacturers can continue to produce solar panels in the future, the materials they use need to replenish at a rate faster than the manufacturers use them. Higher lifetimes, higher efficiencies, and lower material usage can reduce the number of solar panels needed to power daily life. Reusing or recycling solar panels can increase the rate the materials replenish. The overall material flow only measures the total materials used and does not account for rarity, difficulty to obtain, or recycling of materials. The American Physical Society (APS) and the Materials Research Society (MRS) account for rarity, either natural or through monopoly, in their definition of energy critical elements. Energy critical elements (ECEs) include elements needed in large quantities in large scale energy technologies such as wind or solar [54]. Some energy critical elements used in solar panels include tellurium (in CdTe), Gallium (in GaAs), and silver (as a conductor). To reduce vulnerability to material scarcity, solar panels should require as few energy critical elements as possible. ECEs do not include other elements used in large quantities in solar panels, such as aluminum, since they have stable markets. Extracting an element more efficiently or recycling an old product must produce an economic advantage, otherwise the likelihood a company undertakes sourcing or recycling without government subsidy lowers. For example, current production of tellurium occurs as a by-product of copper, but the tellurium available in the copper cannot support more than half a gigawatt of CdTe solar panels per year [54]. Production of CdTe solar cells cannot increase without higher production of Cd and Te refinement. The lowering silicon cost, while good for manufacturing and encouraging companies to find more efficient ways of extracting the silicon, reduces the profitability of recycling.
32
VIII. Safety Although a photovoltaic system’s life cycle has lower risks than those of other fuel
sources using the probabilistic safety assessment (PSA), these risks still remain [55]. Safety concerns during the life cycle of photovoltaic systems occur during the systems’ manufacturing, installation, operation, and end of life. Some chemicals associated with the production of photovoltaic systems include lead, arsenic, silane, cadmium, and strong acids. While no large accidents have occurred (no explosions or large numbers of fatalities), risk of chronic health problems due to exposure to chemicals or non-ergonomic work conditions exists.
1. Manufacturing Due to the high material demand of inorganic photovoltaic panels (in comparison to
organic PV), manufacturers keep higher amounts of any hazardous materials, including those not in the final product and by-products. For example, the production of a single 125mm x 125mm polysilicon module includes 22.6kg of trichlorosilane, a flammable substance [6]. The mining of silicon can also produce hazards. Silica dust (𝑆𝑖𝑂!) puts workers at risk for silicosis, which causes lung damage and weight loss, and lung cancer[56].
Other possibly hazardous materials include acids such as HF and HCl used for etching processes in both panels. In comparison to use in silicon wafer manufacturing, HF in petroleum refineries exist in higher concentrations and has caused 108 out of 165 accidents caused by HF acid between 1994 and 2004 [6]. EDOT, a precursor to PEDOT (often used in organic solar cells), can cause skin and eye irritation[57].
By-products such as silicon tetrachloride can affect both people and the environment if not properly disposed of or stored. China manufactures most silicon solar panels, but does not regulate waste disposal. This can lead to by-products affecting the surroundings if the companies do not regulate themselves.
2. Installation and Operation Installation safety hazards include falling related accidents for roof-top installed systems,
and muscle strain and electrical danger for both rooftop and ground mounted systems. Other hazards could arise from the installation building or area, such as asbestos in buildings for roof-top installations. Organic photovoltaic system installation could provide fewer hazards than inorganic due to ease of installation. The sticker like modules could easily be installed with minimal roof adjustments or muscle strains.
Operation concerns include safety during natural disasters or module breakage. Natural disasters, such as fires, hurricanes, earthquakes, or hail storms, could cause breaks in panels, resulting in leakage of potentially hazardous materials depending on the panel type. For example, in 2015 a tornado broke 200,000 CdTe solar panels in the solar farm Desert Sunlight [43]. A fire can release the cadmium in a CdTe module, but only in small amounts (0.4-0.6%) [6]. The risk of fire due to arcing or an overloaded circuit due from damaged wires should also
33
be considered. Rooftop modules could present a hazard to firefighters when impeding putting out a fire.
For safety during operation, some states in the US require rapid-shutdown codes, such as NEC 2014, which set limits for the voltage and current running through conductors after grid shutdown to prevent grid workers from harm from current still running through PV systems [1]. Other standards include UL 1741 and IEEE 1547 which include testing and specifications for grid-connected photovoltaic systems to protect grid workers and firefighters during the event of a fire[58, 59]. These safety standards apply to both organic and inorganic systems.
3. Decommissioning and Recycling End of life concerns include safely disposing of photovoltaic system components,
especially modules, where most of the rare metals and harmful elements reside. In landfills, like other electronics, breakage and degradation could cause harmful components to release into the environment. The current total OPV cell waste remains low, but due to their short lifetime, they enter the waste streams more quickly than inorganic photovoltaic modules.
Recycling solar panels using currently researched methods will not produce the profit to make it economically advantageous, according to an IRENA study [43]. Government regulation must ensure the panels go to the proper waste or reuse streams, though whether solar companies or consumers bear the cost has not been determined. If companies pay for the recycling, this could fail to reach the panels of companies that have gone bankrupt, or cause bankruptcy or lower growth for other companies. On the other hand, recycling can divert processing or mining of certain raw materials to using materials extracted during the recycling process.
The main problem with waste from solar panels includes the different waste classifications, preventing certain parts from re-use due to their classification as a hazardous material. Improving designs can prevent contamination of certain materials in a solar panel, allowing them to remain non-hazardous and be reused.
34
IX. Future Changes As research progresses, solar photovoltaic system manufacturing processes, materials,
and design will change, affecting system price, performance, environmental impact, and safety. For both module types, as the installed capacity of renewable energies increases, the environmental impact of manufacturing both system types decreases, as the primary electricity used for manufacture has a reduction in emissions. As production of these solar panels increases in quality, their efficiencies will increase to match the efficiencies achieved in laboratories. For both systems, increases in reliability and durability of the balance of system, especially the inverter, will reduce the total cost paid for the system by reducing the number of inverters bought to replace old or broken inverters. This will reduce both the cost but also the material usage and environmental impact of the system.
1. Possible Inorganic Photovoltaic System Changes Some proposed changes in either structure or manufacturing processes of silicon cells
or panels will increase efficiency and cost. A shift to an ion-implanted interdigitated back contact design would increase cell efficiency, decrease cell width, increase the cost per watt by 11%, increase total energy generated by 2%, and lower the levelized cost of electricity by 11-13% due to lower BOS costs and higher energy yield[60]. Another change includes a shift to a heterojunction structure for silicon solar panels which would increase the panel’s efficiency by reducing shadow from bus bars.
Reducing the material usage in solar panels or increasing the efficiency of a solar cell aids in increasing the productivity (in g/W) of a material to produce power. A shift to thinner wafers using improved manufacturing methods could reduce silicon use and waste by 20% [17]. Increasing the ability to screen print silver and increasing the efficiency of the cell can decrease the grams of silver used per watt by almost 50% by 2020 [17].
For thin film panels, such as CdTe, the main driver of changes in material use include a reduction of glass usage, and thinner semiconducting layers. Better manufacturing and design can reduce the glass needed to protect the thin films and reduce the thickness of semiconducting layer needed to produce the same amount of power.
2. Possible Organic Photovoltaic System Changes If organic photovoltaic system demand increases and drives a manufacturing capacity
increase, the manufacturing cost could drop by more than 50% from finding more efficient manufacturing processes[60]. If manufacturing increases with planning, researchers could design OPV panels with the highest power outputs for the least amount of materials and cost. Since polymers can be created to have many different mechanical and electrical properties, these properties can fit many different needs, including designs made to increase efficiency, increase lifetime or durability, reduce cost, and reduce material usage.
35
X. Summary/Conclusion Despite possible accidents and pollution from manufacturing these solar panels, the benefits they provide through their clean energy generation and health benefits from reduced pollution far outweigh the costs. Thought both organic and inorganic systems have their downsides (organic’s low efficiency and lifetime and inorganic’s complicated manufacturing), both have strengths in locations they work best in. Organic photovoltaic systems, with their flexibility and design customization, have a future in building integrated photovoltaic systems (BIPV). Silicon and other inorganic solar panels have their place in solar power plants and rooftops. In the future, the reduction in the costs of materials, energy, and money to produce these photovoltaic systems will allow solar panel use to continue into the far future. With research and testing, efficiencies of different types of solar cells increase, providing more power and more benefits.
36
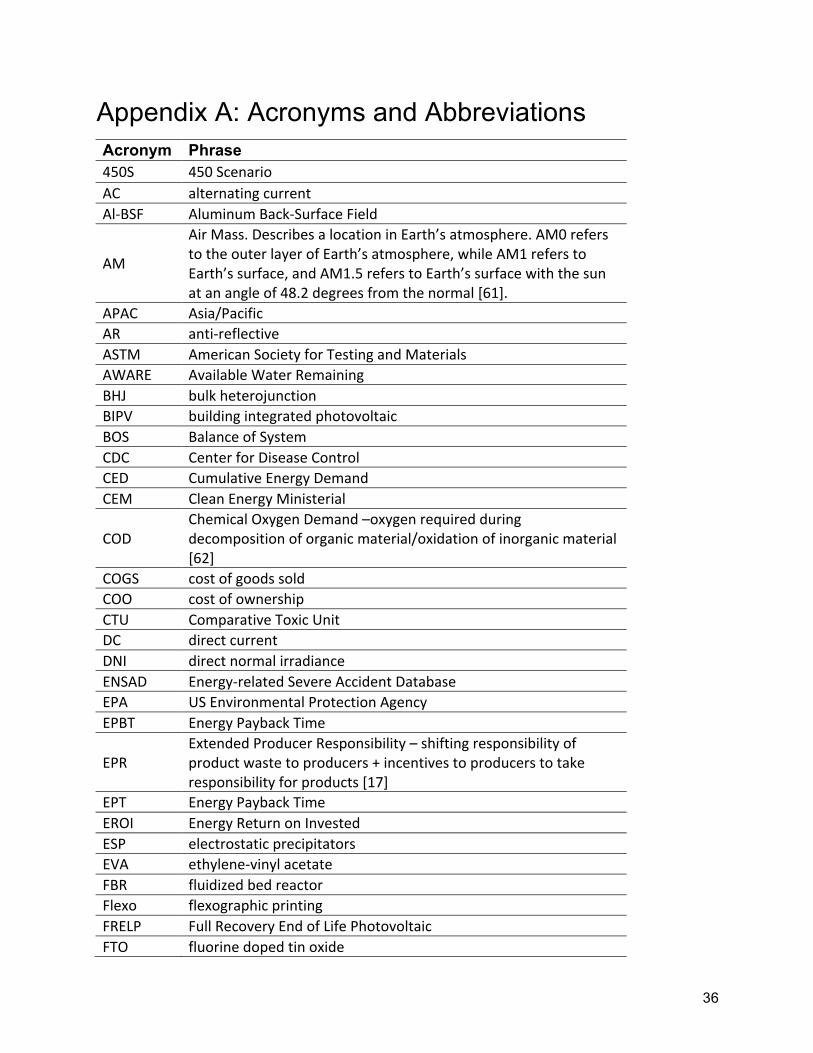
Appendix A: Acronyms and Abbreviations Acronym Phrase 450S 450ScenarioAC alternatingcurrentAl-BSF AluminumBack-SurfaceField
AM
AirMass.DescribesalocationinEarth’satmosphere.AM0referstotheouterlayerofEarth’satmosphere,whileAM1referstoEarth’ssurface,andAM1.5referstoEarth’ssurfacewiththesunatanangleof48.2degreesfromthenormal[61].
APAC Asia/PacificAR anti-reflectiveASTM AmericanSocietyforTestingandMaterialsAWARE AvailableWaterRemainingBHJ bulkheterojunctionBIPV buildingintegratedphotovoltaicBOS BalanceofSystemCDC CenterforDiseaseControlCED CumulativeEnergyDemandCEM CleanEnergyMinisterial
CODChemicalOxygenDemand–oxygenrequiredduringdecompositionoforganicmaterial/oxidationofinorganicmaterial[62]
COGS costofgoodssoldCOO costofownershipCTU ComparativeToxicUnitDC directcurrentDNI directnormalirradianceENSAD Energy-relatedSevereAccidentDatabaseEPA USEnvironmentalProtectionAgencyEPBT EnergyPaybackTime
EPRExtendedProducerResponsibility–shiftingresponsibilityofproductwastetoproducers+incentivestoproducerstotakeresponsibilityforproducts[17]
EPT EnergyPaybackTimeEROI EnergyReturnonInvestedESP electrostaticprecipitatorsEVA ethylene-vinylacetateFBR fluidizedbedreactorFlexo flexographicprintingFRELP FullRecoveryEndofLifePhotovoltaicFTO fluorinedopedtinoxide
37
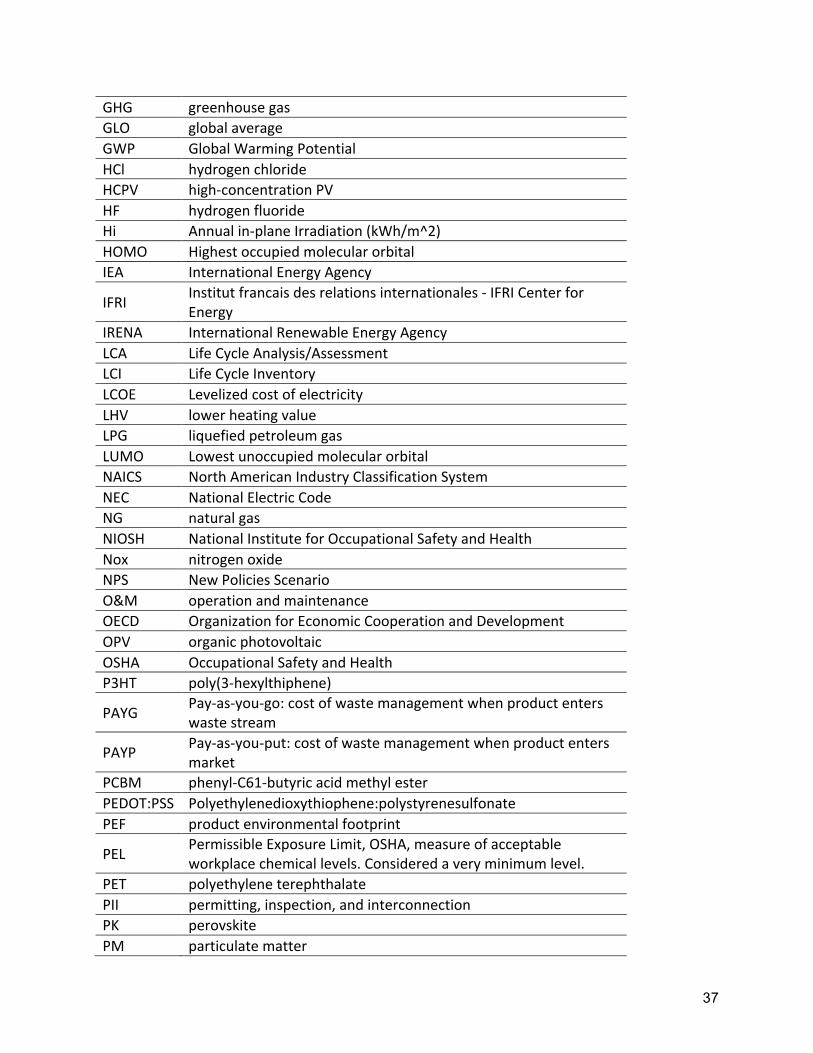
GHG greenhousegasGLO globalaverageGWP GlobalWarmingPotentialHCl hydrogenchlorideHCPV high-concentrationPVHF hydrogenfluorideHi Annualin-planeIrradiation(kWh/m^2)HOMO HighestoccupiedmolecularorbitalIEA InternationalEnergyAgency
IFRI Institutfrancaisdesrelationsinternationales-IFRICenterforEnergy
IRENA InternationalRenewableEnergyAgencyLCA LifeCycleAnalysis/AssessmentLCI LifeCycleInventoryLCOE LevelizedcostofelectricityLHV lowerheatingvalueLPG liquefiedpetroleumgasLUMO LowestunoccupiedmolecularorbitalNAICS NorthAmericanIndustryClassificationSystemNEC NationalElectricCodeNG naturalgasNIOSH NationalInstituteforOccupationalSafetyandHealthNox nitrogenoxideNPS NewPoliciesScenarioO&M operationandmaintenanceOECD OrganizationforEconomicCooperationandDevelopmentOPV organicphotovoltaicOSHA OccupationalSafetyandHealthP3HT poly(3-hexylthiphene)
PAYG Pay-as-you-go:costofwastemanagementwhenproductenterswastestream
PAYP Pay-as-you-put:costofwastemanagementwhenproductentersmarket
PCBM phenyl-C61-butyricacidmethylesterPEDOT:PSS Polyethylenedioxythiophene:polystyrenesulfonatePEF productenvironmentalfootprint
PEL PermissibleExposureLimit,OSHA,measureofacceptableworkplacechemicallevels.Consideredaveryminimumlevel.
PET polyethyleneterephthalatePII permitting,inspection,andinterconnectionPK perovskitePM particulatematter
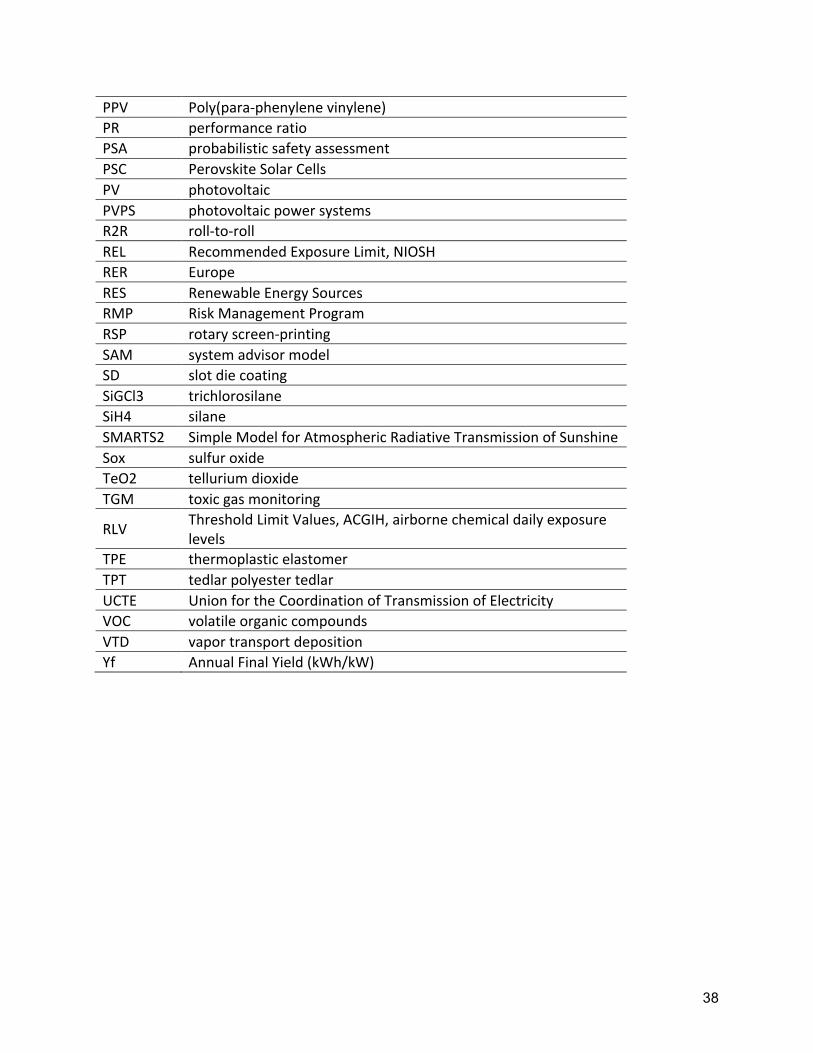
38
PPV Poly(para-phenylenevinylene)PR performanceratioPSA probabilisticsafetyassessmentPSC PerovskiteSolarCellsPV photovoltaicPVPS photovoltaicpowersystemsR2R roll-to-rollREL RecommendedExposureLimit,NIOSHRER EuropeRES RenewableEnergySourcesRMP RiskManagementProgramRSP rotaryscreen-printingSAM systemadvisormodelSD slotdiecoatingSiGCl3 trichlorosilaneSiH4 silaneSMARTS2 SimpleModelforAtmosphericRadiativeTransmissionofSunshineSox sulfuroxideTeO2 telluriumdioxideTGM toxicgasmonitoring
RLV ThresholdLimitValues,ACGIH,airbornechemicaldailyexposurelevels
TPE thermoplasticelastomerTPT tedlarpolyestertedlarUCTE UnionfortheCoordinationofTransmissionofElectricityVOC volatileorganiccompoundsVTD vaportransportdepositionYf AnnualFinalYield(kWh/kW)
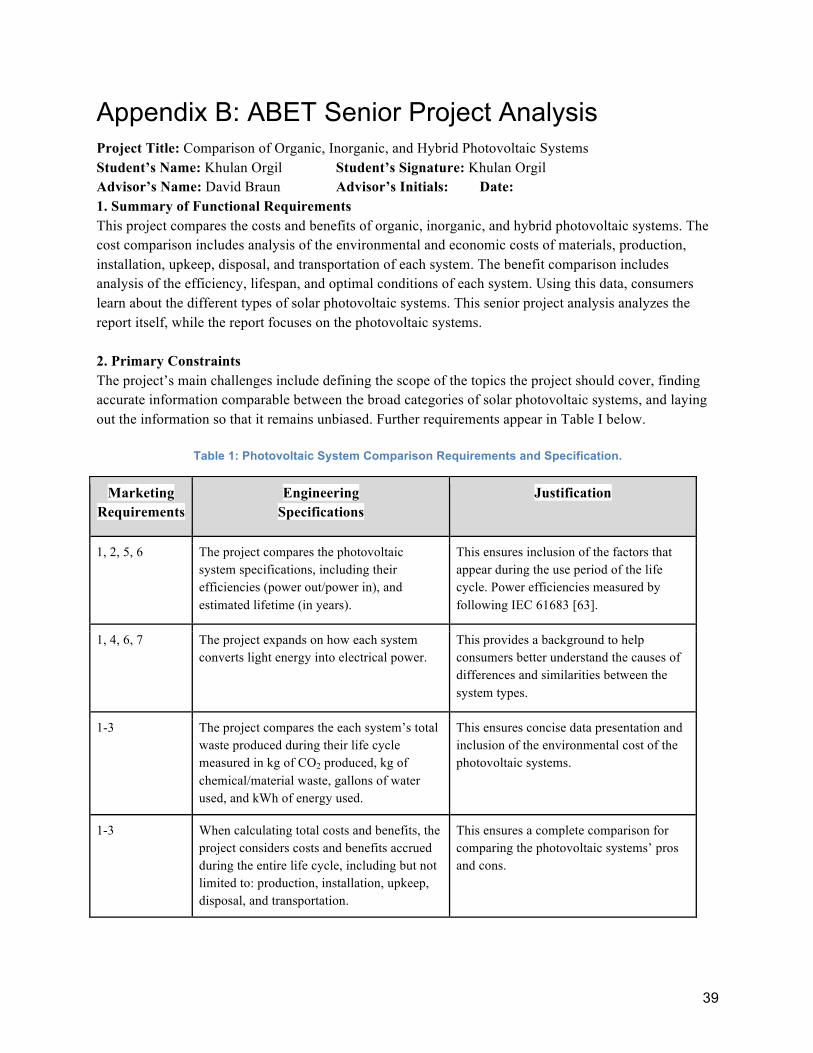
39
Appendix B: ABET Senior Project Analysis Project Title: Comparison of Organic, Inorganic, and Hybrid Photovoltaic Systems Student’s Name: Khulan Orgil Student’s Signature: Khulan Orgil Advisor’s Name: David Braun Advisor’s Initials: Date: 1. Summary of Functional Requirements This project compares the costs and benefits of organic, inorganic, and hybrid photovoltaic systems. The cost comparison includes analysis of the environmental and economic costs of materials, production, installation, upkeep, disposal, and transportation of each system. The benefit comparison includes analysis of the efficiency, lifespan, and optimal conditions of each system. Using this data, consumers learn about the different types of solar photovoltaic systems. This senior project analysis analyzes the report itself, while the report focuses on the photovoltaic systems. 2. Primary Constraints The project’s main challenges include defining the scope of the topics the project should cover, finding accurate information comparable between the broad categories of solar photovoltaic systems, and laying out the information so that it remains unbiased. Further requirements appear in Table I below.
Table 1: Photovoltaic System Comparison Requirements and Specification.
Marketing Requirements
Engineering Specifications
Justification
1, 2, 5, 6 The project compares the photovoltaic system specifications, including their efficiencies (power out/power in), and estimated lifetime (in years).
This ensures inclusion of the factors that appear during the use period of the life cycle. Power efficiencies measured by following IEC 61683 [63].
1, 4, 6, 7 The project expands on how each system converts light energy into electrical power.
This provides a background to help consumers better understand the causes of differences and similarities between the system types.
1-3 The project compares the each system’s total waste produced during their life cycle measured in kg of CO2 produced, kg of chemical/material waste, gallons of water used, and kWh of energy used.
This ensures concise data presentation and inclusion of the environmental cost of the photovoltaic systems.
1-3 When calculating total costs and benefits, the project considers costs and benefits accrued during the entire life cycle, including but not limited to: production, installation, upkeep, disposal, and transportation.
This ensures a complete comparison for comparing the photovoltaic systems’ pros and cons.
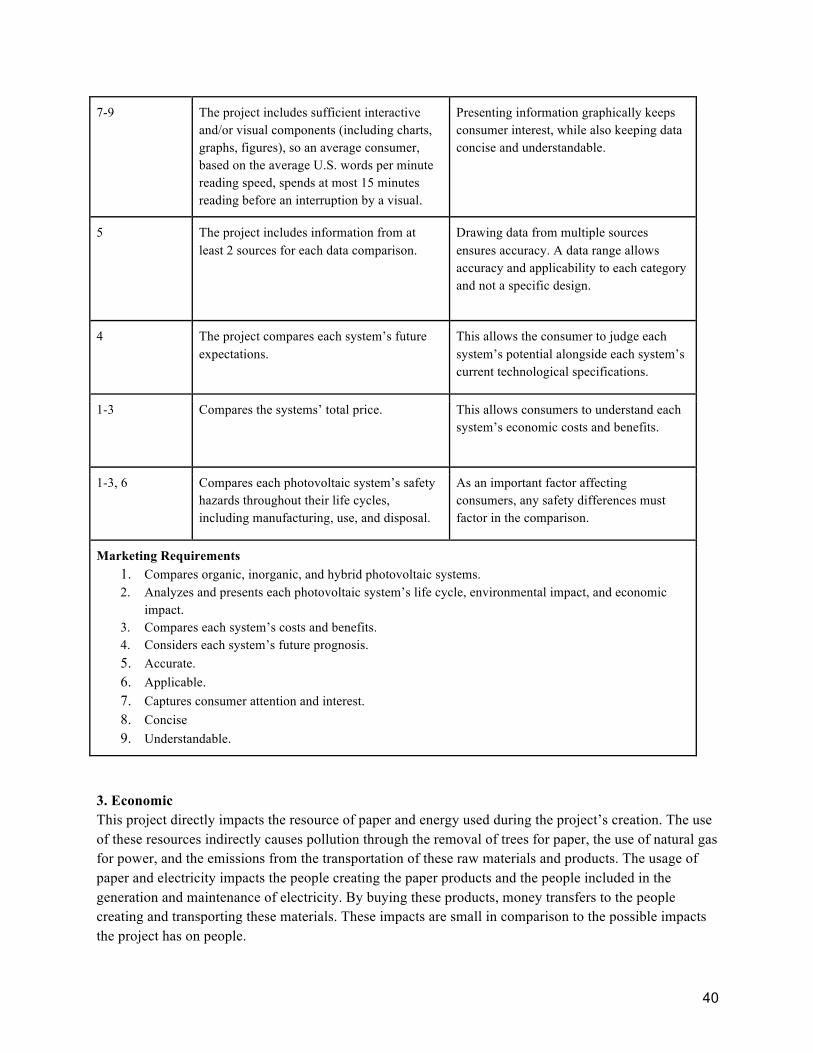
40
7-9 The project includes sufficient interactive and/or visual components (including charts, graphs, figures), so an average consumer, based on the average U.S. words per minute reading speed, spends at most 15 minutes reading before an interruption by a visual.
Presenting information graphically keeps consumer interest, while also keeping data concise and understandable.
5 The project includes information from at least 2 sources for each data comparison.
Drawing data from multiple sources ensures accuracy. A data range allows accuracy and applicability to each category and not a specific design.
4 The project compares each system’s future expectations.
This allows the consumer to judge each system’s potential alongside each system’s current technological specifications.
1-3 Compares the systems’ total price. This allows consumers to understand each system’s economic costs and benefits.
1-3, 6 Compares each photovoltaic system’s safety hazards throughout their life cycles, including manufacturing, use, and disposal.
As an important factor affecting consumers, any safety differences must factor in the comparison.
Marketing Requirements 1. Compares organic, inorganic, and hybrid photovoltaic systems. 2. Analyzes and presents each photovoltaic system’s life cycle, environmental impact, and economic
impact. 3. Compares each system’s costs and benefits. 4. Considers each system’s future prognosis. 5. Accurate. 6. Applicable. 7. Captures consumer attention and interest. 8. Concise 9. Understandable.
3. Economic This project directly impacts the resource of paper and energy used during the project’s creation. The use of these resources indirectly causes pollution through the removal of trees for paper, the use of natural gas for power, and the emissions from the transportation of these raw materials and products. The usage of paper and electricity impacts the people creating the paper products and the people included in the generation and maintenance of electricity. By buying these products, money transfers to the people creating and transporting these materials. These impacts are small in comparison to the possible impacts the project has on people.
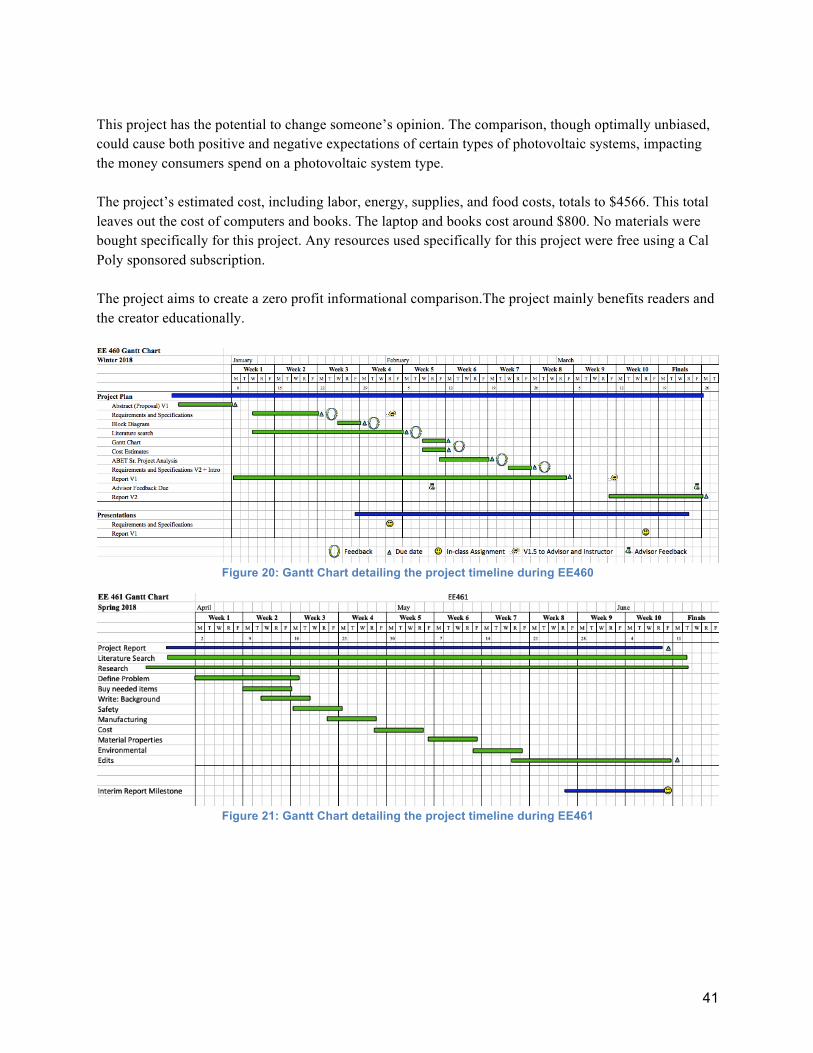
41
This project has the potential to change someone’s opinion. The comparison, though optimally unbiased, could cause both positive and negative expectations of certain types of photovoltaic systems, impacting the money consumers spend on a photovoltaic system type. The project’s estimated cost, including labor, energy, supplies, and food costs, totals to $4566. This total leaves out the cost of computers and books. The laptop and books cost around $800. No materials were bought specifically for this project. Any resources used specifically for this project were free using a Cal Poly sponsored subscription. The project aims to create a zero profit informational comparison.The project mainly benefits readers and the creator educationally.
Figure 20: Gantt Chart detailing the project timeline during EE460
Figure 21: Gantt Chart detailing the project timeline during EE461
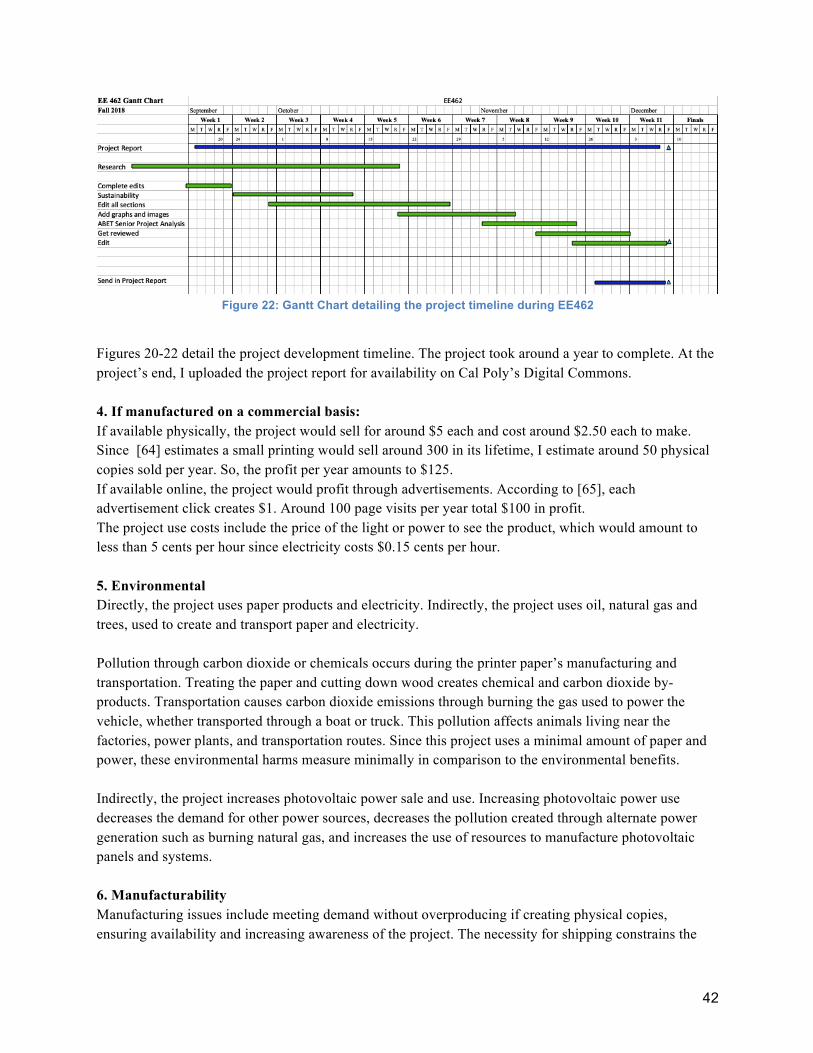
42
Figure 22: Gantt Chart detailing the project timeline during EE462
Figures 20-22 detail the project development timeline. The project took around a year to complete. At the project’s end, I uploaded the project report for availability on Cal Poly’s Digital Commons. 4. If manufactured on a commercial basis: If available physically, the project would sell for around $5 each and cost around $2.50 each to make. Since [64] estimates a small printing would sell around 300 in its lifetime, I estimate around 50 physical copies sold per year. So, the profit per year amounts to $125. If available online, the project would profit through advertisements. According to [65], each advertisement click creates $1. Around 100 page visits per year total $100 in profit. The project use costs include the price of the light or power to see the product, which would amount to less than 5 cents per hour since electricity costs $0.15 cents per hour. 5. Environmental Directly, the project uses paper products and electricity. Indirectly, the project uses oil, natural gas and trees, used to create and transport paper and electricity. Pollution through carbon dioxide or chemicals occurs during the printer paper’s manufacturing and transportation. Treating the paper and cutting down wood creates chemical and carbon dioxide by-products. Transportation causes carbon dioxide emissions through burning the gas used to power the vehicle, whether transported through a boat or truck. This pollution affects animals living near the factories, power plants, and transportation routes. Since this project uses a minimal amount of paper and power, these environmental harms measure minimally in comparison to the environmental benefits. Indirectly, the project increases photovoltaic power sale and use. Increasing photovoltaic power use decreases the demand for other power sources, decreases the pollution created through alternate power generation such as burning natural gas, and increases the use of resources to manufacture photovoltaic panels and systems. 6. Manufacturability Manufacturing issues include meeting demand without overproducing if creating physical copies, ensuring availability and increasing awareness of the project. The necessity for shipping constrains the
43
use of physical copies and impacts cost and the environment. 7. Sustainability To maintain the product’s use, electricity needs to power the computer or light used to view the product. The product generally uses unsustainably generated electricity, such as natural gas, unless generated through a renewable source, such as through solar panels or hydroelectric. To improve the product’s design by making it more sustainable, using recycled paper would reduce resource use, but also increase the total printing price. A library could hold the product, which would reduce the needed amount of printed products, but also decrease the total profit. 8. Ethical When creating this project, I ensure no inclusion of bias or false information, ensure inclusion of any needed warnings, ensure clearly labeled estimates, and ensure clearly referenced sources. The IEEE Code of Ethics bases itself on technological professionalism and respect [66]. The four ethical implications stated above relate to the IEEE Code of Ethics’ various tenets. According to the IEEE Code of Ethics’ first tenet, I must put safety first and ensure I disclose unsafe factors, which relates to the needed warnings inclusion. According to the second tenet, I must avoid conflicts of interest, so I should avoid working for a photovoltaic company to reduce a chance to create bias in me before the project’s completion, which applies to no inclusion of bias. According to the third tenet, estimates and claims need realism and honesty, so any estimates need a strong basis on fact and honestly disclosed. Tenet four emphasizes the rejection of bribery, which applies to no inclusion of bias. Tenet five requests the information to include detail of technology’s potential consequences, which applies to the project’s inclusion of the photovoltaic system cost analysis. Tenet six emphasizes the need for experience, or disclosure of limitations, which relates to inclusion of any needed warnings. Tenet seven emphasizes the need to properly credit other information sources, which applies to ensuring clearly referenced sources. Eight emphasizes treating all people fairly, so I must ensure the project does not harm or benefit any specific group of people. Tenet nine demands no injury to anyone or their reputation, which applies to no inclusion of false information. Tenet ten requests professional assistance to colleagues, which I have done in providing feedback to others’ project plans. Using the psychological egoism ethical framework, the project follows the first paragraph’s declarations stated to avoid legal consequences for misinformation, intellectual property infringement, or damage due to a lack of disclosures. This project also seeks to keep consumers informed, possibly leading them to make choices that reduce negative impact on their environment or leading to more investment on underfunded technological research, which reduces negative impact on everyone’s health. If the project projects an opinion to consumers, this could lead to a technology that had potential to not receive the investments or awareness that it requires to improve energy production or reveal an important breakthrough to researchers. Improving information flows as in leverage point 5 in [67] also improves feedback in both the economy and technological research that improves the system humans live in. The project stays ethical under the ethical principlism framework as well. The project supports consumer’s autonomy, the first tenet of ethical principlism, through presenting unbiased, truthful
44
information and allowing them to form their own opinions and make their own decisions. Non-maleficence shows by keeping the project unbiased and non-harmful to the reputations of , therefore avoiding the purposeful and accidental misleading of consumers. Beneficence shows through the presentation of information and support of self-advancement through education. The project supports justice by keeping transparency of technological innovations. If, instead, the project presents false or biased information, it would violate all four tenets of ethical principlism. The first, because untruthful information could falsely lead the consumer to a decision instead of allowing them to autonomously form their own opinions. False information could harm a manufacturer’s or photovoltaic system type’s reputation, which would violate the second tenet of ethical principlism, non-maleficence. This would also violate the beneficence tenet through planting false information in a consumer’s mind. False information would also avoid justice by preventing transparency between manufacturers and consumers. In these ways the project offers ethical presentation of knowledge as long as it continues to follow the above tenets. 9. Health and Safety Health and safety concerns of the project include danger to consumers during system installation, electrical safety from the photovoltaic panels, chemical danger from harmful components during manufacture, and fire safety during use of the panels. [55] describes some harmful components used sometimes in production of photovoltaic systems. To promote the consumer’s health and safety, the project includes warnings about manufacturing and installation safety. 10. Social and Political The project impacts direct stakeholders which include Cal Poly and myself. Since Cal Poly makes the project report available online, a false or unethical report reflects inability and untrustworthiness on both myself and Cal Poly. A well created project presents myself as a strong learner and a student worthy of a degree and presents Cal Poly as a correctly accredited educational institution. The project impacts indirect stakeholders such as investors in photovoltaic technologies, manufacturers, researchers, and consumers. Depending on the data they absorb from this project, they can change their decision on where to spend their money and where to invest their money or time. The project can benefit someone invested in a photovoltaic presented favorably in the product, and harm someone invested in a photovoltaic presented unfavorably. This project also has the potential to harm people invested in other energy sources, if it convinces potential investors to invest in solar photovoltaic energy instead. For example, a decreased consumer base or lower demand might harm a large natural gas company or electricity company. Other indirect stakeholders include other people and certain countries that contain the resources needed to produce the different photovoltaic system’s parts. People who do not purchase solar panels would still benefit from globally improved environmental quality and reduced reliance on nonrenewable energies. Governments that control the raw resources needed to build solar photovoltaic modules both impact the type of photovoltaic system manufacturers decide to produce and the system manufacturers decide to produce affects the economy of the country that owns the materials through increased or decreased exports.
45
11. Development During this project, I learned about different types of photovoltaic systems beyond the classic inorganic silicon panels and how they operate and different ways of manufacturing them. See the References in Appendix D for a list of sources used for the project. The references used in this project expand on manufacturing processes, including inputs and outputs, different life cycle analyses, current technologies, and possible design improvements. To obtain complete accuracy, the project needs more consolidation of multiple types of each photovoltaic system. In the future, this report could improve through more data and a wider range of comparisons, for example, including other solar photovoltaic systems.
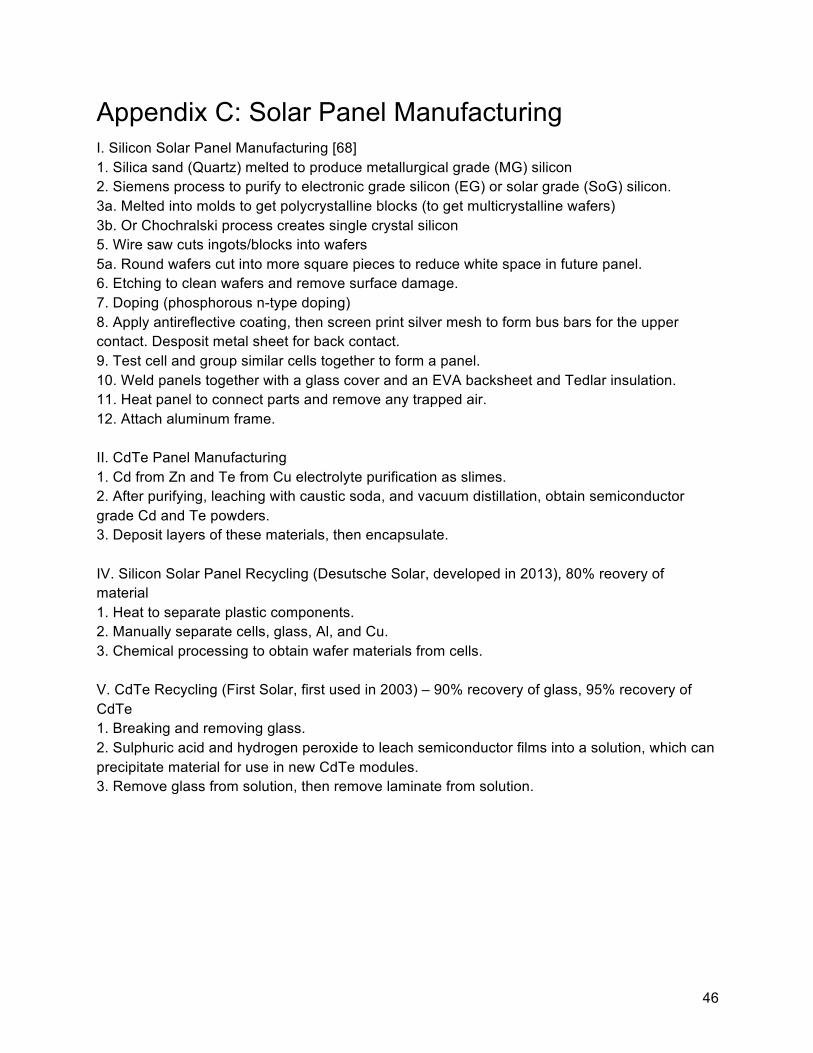
46
Appendix C: Solar Panel Manufacturing I. Silicon Solar Panel Manufacturing [68] 1. Silica sand (Quartz) melted to produce metallurgical grade (MG) silicon 2. Siemens process to purify to electronic grade silicon (EG) or solar grade (SoG) silicon. 3a. Melted into molds to get polycrystalline blocks (to get multicrystalline wafers) 3b. Or Chochralski process creates single crystal silicon 5. Wire saw cuts ingots/blocks into wafers 5a. Round wafers cut into more square pieces to reduce white space in future panel. 6. Etching to clean wafers and remove surface damage. 7. Doping (phosphorous n-type doping) 8. Apply antireflective coating, then screen print silver mesh to form bus bars for the upper contact. Desposit metal sheet for back contact. 9. Test cell and group similar cells together to form a panel. 10. Weld panels together with a glass cover and an EVA backsheet and Tedlar insulation. 11. Heat panel to connect parts and remove any trapped air. 12. Attach aluminum frame. II. CdTe Panel Manufacturing 1. Cd from Zn and Te from Cu electrolyte purification as slimes. 2. After purifying, leaching with caustic soda, and vacuum distillation, obtain semiconductor grade Cd and Te powders. 3. Deposit layers of these materials, then encapsulate. IV. Silicon Solar Panel Recycling (Desutsche Solar, developed in 2013), 80% reovery of material 1. Heat to separate plastic components. 2. Manually separate cells, glass, Al, and Cu. 3. Chemical processing to obtain wafer materials from cells. V. CdTe Recycling (First Solar, first used in 2003) – 90% recovery of glass, 95% recovery of CdTe 1. Breaking and removing glass. 2. Sulphuric acid and hydrogen peroxide to leach semiconductor films into a solution, which can precipitate material for use in new CdTe modules. 3. Remove glass from solution, then remove laminate from solution.
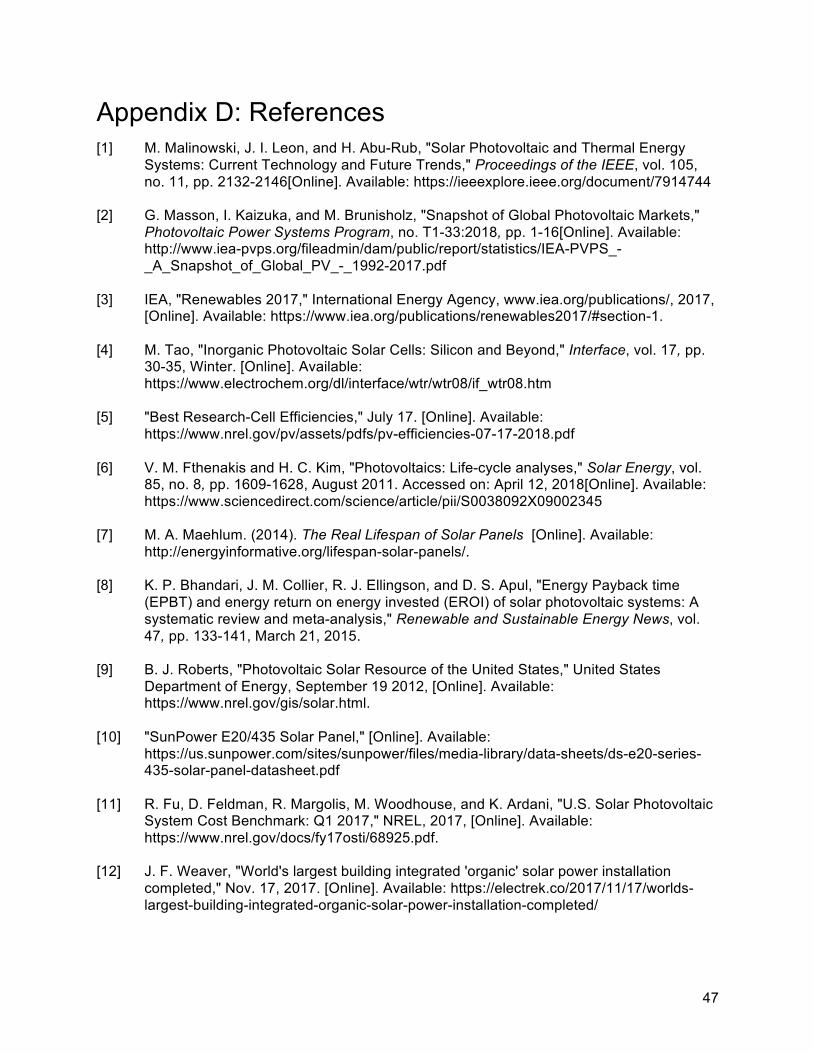
47
Appendix D: References [1] M. Malinowski, J. I. Leon, and H. Abu-Rub, "Solar Photovoltaic and Thermal Energy
Systems: Current Technology and Future Trends," Proceedings of the IEEE, vol. 105, no. 11, pp. 2132-2146[Online]. Available: https://ieeexplore.ieee.org/document/7914744
[2] G. Masson, I. Kaizuka, and M. Brunisholz, "Snapshot of Global Photovoltaic Markets,"
Photovoltaic Power Systems Program, no. T1-33:2018, pp. 1-16[Online]. Available: http://www.iea-pvps.org/fileadmin/dam/public/report/statistics/IEA-PVPS_-_A_Snapshot_of_Global_PV_-_1992-2017.pdf
[3] IEA, "Renewables 2017," International Energy Agency, www.iea.org/publications/, 2017,
[Online]. Available: https://www.iea.org/publications/renewables2017/#section-1. [4] M. Tao, "Inorganic Photovoltaic Solar Cells: Silicon and Beyond," Interface, vol. 17, pp.
30-35, Winter. [Online]. Available: https://www.electrochem.org/dl/interface/wtr/wtr08/if_wtr08.htm
[5] "Best Research-Cell Efficiencies," July 17. [Online]. Available:
https://www.nrel.gov/pv/assets/pdfs/pv-efficiencies-07-17-2018.pdf [6] V. M. Fthenakis and H. C. Kim, "Photovoltaics: Life-cycle analyses," Solar Energy, vol.
85, no. 8, pp. 1609-1628, August 2011. Accessed on: April 12, 2018[Online]. Available: https://www.sciencedirect.com/science/article/pii/S0038092X09002345
[7] M. A. Maehlum. (2014). The Real Lifespan of Solar Panels [Online]. Available:
http://energyinformative.org/lifespan-solar-panels/. [8] K. P. Bhandari, J. M. Collier, R. J. Ellingson, and D. S. Apul, "Energy Payback time
(EPBT) and energy return on energy invested (EROI) of solar photovoltaic systems: A systematic review and meta-analysis," Renewable and Sustainable Energy News, vol. 47, pp. 133-141, March 21, 2015.
[9] B. J. Roberts, "Photovoltaic Solar Resource of the United States," United States
Department of Energy, September 19 2012, [Online]. Available: https://www.nrel.gov/gis/solar.html.
[10] "SunPower E20/435 Solar Panel," [Online]. Available:
https://us.sunpower.com/sites/sunpower/files/media-library/data-sheets/ds-e20-series-435-solar-panel-datasheet.pdf
[11] R. Fu, D. Feldman, R. Margolis, M. Woodhouse, and K. Ardani, "U.S. Solar Photovoltaic
System Cost Benchmark: Q1 2017," NREL, 2017, [Online]. Available: https://www.nrel.gov/docs/fy17osti/68925.pdf.
[12] J. F. Weaver, "World's largest building integrated 'organic' solar power installation
completed," Nov. 17, 2017. [Online]. Available: https://electrek.co/2017/11/17/worlds-largest-building-integrated-organic-solar-power-installation-completed/
48
[13] "infinityPV Panels," infinityPV. Available: https://infinitypv.com/products/opv [14] R. Messenger and H. A. Abtahi, Photovoltaic Systems Engineering, 4th ed. Florida:
Taylor & Francis Group, LLC, 2017, p. 504. [15] "ASTM G173-03 Reference Spectra Derived from SMARTS v. 2.9.2," NREL, [Online].
Available: https://www.nrel.gov/grid/solar-resource/spectra-am1.5.html. [16] Cyferz, "Working mechanism of a solar cell,"
Silicon_Solar_cell_structure_and_mechanism.svg, Ed., ed. English Wikipedia, 2007. [17] S. Weckend, A. Wade, and G. Heath, "End-of-Life Management: Solar Photovoltaic
Panels," IRENA, IEA-PVPS 2016, [Online]. Available: http://www.irena.org/-/media/Files/IRENA/Agency/Publication/2016/IRENA_IEAPVPS_End-of-Life_Solar_PV_Panels_2016.pdf.
[18] "Low-cost wafers for solar cells," Research News, 2015. [Online]. Available:
https://www.fraunhofer.de/en/press/research-news/2015/october/low-cost-wafers-for-solar-cells.html
[19] "Solar Glass & Mirrors," [Online]. Available: www.greenrhinoenergy.com/solar
/technologies/ [20] "Basics of OSC," Organic Solar Cells, [Online]. Available:
https://www.iapp.de/iapp/agruppen/osol/?Research:Organic_Solar_Cells:Basics_of_OSC
[21] H. F. Dam and T. T. Larsen-Olsen, "How do polymer solar cells work," [Online].
Available: http://plasticphotovoltaics.org/lc/lc-polymersolarcells/lc-how.html [22] "OPVIUS Image Gallery," [Online]. Available: http://www.opvius.com/en/photo-
gallery.html [23] V. D. Mihailetchi, "Device physics of organic bulk heterojunction solar cells," Materials
Science Thesis Series, vol. 14, p. 127[Online]. Available: https://www.rug.nl/research/portal/files/2893809/thesis.pdf
[24] D. Hengevoss, C. Baumgartner, G. Nisato, and C. Hugi, "Life Cycle Assessment and
eco-efficiency of prospective, flexible, tandem organic photovoltaic module," Solar Energy, vol. 137, pp. 317-327, August 27, 2016.
[25] M. Peplow, "Perovskite progress pushes tandem solar cells closer to market," Solar
Power, vol. 96, no. 24, June 11, 2018. [Online]. Available: https://cen.acs.org/energy/solar-power/Perovskite-progress-pushes-tandem-solar/96/i24
[26] "Silicon Ingot," [Online]. Available: https://www.svmi.com/silicon-ingot/ [27] F. Ferroni and R. J. Hopkirk, "Energy Return on Energy Invested (ERoEI) for
photovoltaic systems in regions of moderate insolation," Energy Policy, vol. 102, pp.
49
377-384, March 2017. [Online]. Available: https://www.sciencedirect.com/science/article/pii/S0301421516301379
[28] N. Espinosa and F. C. Krebs, "Life cycle analysis of organic tandem solar cells: When
are they warranted?," Solar Energy Materials & Solar Cells, no. 120, pp. 692-700, October 23, 2013.
[29] W. Bergius, "Organic solar cells reach manufacturing milestone," June 19. [Online].
Available: https://www.chemistryworld.com/news/organic-solar-cells-reach-manufacturing-milestone/7439.article
[30] M. Tuomikoski et al., "Roll-to-Roll Manufacturing of Organic Photovoltaic Modules,"
presented at the European Microelectronics and Packaging Conference, 2009. [Online]. Available: https://ieeexplore.ieee.org/stamp/stamp.jsp?tp=&arnumber=5272879.
[31] D. M. Bassani, G. W. Sonnemann, and M. P. Tsang, "Life-cycle assessment of cradle-to-
grave opportunities and environmental impacts of organic photovoltaic solar panels compared to conventional technologies," Solar Energy Material & Solar Cells, vol. 156, pp. 37-48, November 2016. Accessed on: April 15, 2018[Online]. Available: https://www.sciencedirect.com/science/article/pii/S0927024816300381
[32] EIA-861, "Average Price by State by Provider (EIA-861)," in Excel vol. 212 KB,
avgprice_annual.xlsx, Ed., ed. https://www.eia.gov/electricity/data/state/: EIA, 2017. [33] D. M. Powell, M. T. Winkler, A. Goodrich, and T. Buonassisi, "Modeling the Cost and
Minimum Sustainable Price of Crystalline Silicon Photovoltaic Manufacturing in the United States," IEEE Journal of Photovoltaics, vol. 3, no. 2, pp. 662-668
[34] N. Groom, "Billions in U.S. solar projects shelved after Trump panel tariff," Business
News, Business News. [Online]. Available: https://www.reuters.com/article/us-trump-effect-solar-insight/billions-in-u-s-solar-projects-shelved-after-trump-panel-tariff-idUSKCN1J30CT
[35] M. D. Chatzisideris, A. Laurent, G. C. Christoforidis, and F. C. Krebs, "Cost-
competitiveness of organic photovoltaics for electricity self-consumption at residential buildings: A comparative study of Denmark and Greece under real market conditions," Applied Energy, vol. 208, pp. 471-479
[36] "Historical Exchange Rates," OANDA, 2018. [Online]. Available:
https://www.oanda.com/fx-for-business/ historical -rates [37] C. J. Mulligan, C. Bilen, X. Zhou, W. J. Belcher, and P. C. Dastoor, "Levelised cost of
electricity for organic photovoltaics," Solar Energy Materials & Solar Cells, vol. 133, pp. 26-31, November 20, 2014.
[38] I. Celik et al., "Energy Payback Time (EPBT) and Energy Return on Energy Invested
(EROI) of Perovskite Tandem Photovoltaic Solar Cells," IEEE Journal of Photovoltaics, vol. 8, no. 1, pp. 305-309
50
[39] C. Jones and P. Gilbert, "Determining the consequential life cycle greenhouse gas emissions of increased rooftop photovoltaic deployment," Journal of Cleaner Production no. 184 pp. 211-219, February 14, 2018.
[40] P. Wu, X. Ma, J. Ji, and Y. Ma, "Review on life cycle assessment of greenhouse gas
emission profit of solar photovoltaic systems," presented at the The 8th International Conference on Applied Energy ICAE2016, 2017.
[41] "U.S. Electric Power Industry Estimated Emissions by State," in "Detailed State Data,"
U.S. Department of Energy: Energy Information Administration, 2016, [Online]. Available: https://www.eia.gov/electricity/data/state/.
[42] "Net Generation by State by Type of Producer by Energy Source," in Detailed State
Data, U. D. o. E. E. I. Administration, Ed., ed: EIA, 2016. Available: https://www.eia.gov/electricity/data/state/
[43] M. Shellenberger, "If Solar Panels Are So Clean, Why Do They Produce So Much Toxic
Waste?," Energy, Energy. [Online]. Available: https://www.forbes.com/sites/michaelshellenberger/2018/05/23/if-solar-panels-are-so-clean-why-do-they-produce-so-much-toxic-waste/#1a41cd5d121c
[44] S. Chen, "China's ageing solar panels are going to be a big environmental problem,"
Society, Accessed on: July 30, 2017[Online]. Available: https://www.scmp.com/news/china/society/article/2104162/chinas-ageing-solar-panels-are-going-be-big-environmental-problem
[45] M. M. Bomgardner and A. Scott, "Recycling renewables," Renewables, vol. 96, no. 15,
April 9. [Online]. Available: https://cen.acs.org/energy/renewables/Recycling-renewables/96/i15
[46] Y. Zhou et al., "Recyclable organic solar cells on cellulose nanocrystal substrates,"
Scientific Reports, vol. 3, pp. 1-5, March 25. [Online]. Available: https://www.nature.com/articles/srep01536
[47] S. Evans, "The world's biggest solar power plants," Power Technology, August 15.
[Online]. Available: https://www.power-technology.com/features/the-worlds-biggest-solar-power-plants/
[48] S. Ong, C. Campbell, P. Denholm, R. Margolis, and G. Heath, "Land-Use Requirements
for Solar Power Plants in the United States," U.S. Department of Energy Office of Energy Efficiency & Renewable Energy, NREL, 2013, [Online]. Available: https://www.nrel.gov/docs/fy13osti/56290.pdf.
[49] D. MacKay, "A reality check on renewables," TEDxWarwick, [Online]. Available:
https://www.ted.com/talks/david_mackay_a_reality_check_on_renewables/up-next [50] C. Nunez, "Beekeepers Sweeten Solar Sites With the 'Tesla of Honey'," June 24.
[Online]. Available: https://news.nationalgeographic.com/2017/06/chasing-genius-solar-honey-pollinator-friendly-energy/
51
[51] "Renewable Energy," Sustainability, California Polytechnic State University[Online]. Available: https://afd.calpoly.edu/sustainability/campus-action/energy/renewable-energy
[52] "Air Pollution," National Institute of Environmental Health Sciences [Online]. Available:
https://www.niehs.nih.gov/health/topics/agents/air-pollution/index.cfm [53] S. Leahy, "Hidden Costs of Climate Change Running Hundreds of Billions a Year,"
National Geographic, September 27. [Online]. Available: https://news.nationalgeographic.com/2017/09/climate-change-costs-us-economy-billions-report/
[54] R. Jaffe et al., "Energy Critical Elements: Securing Materials for Emerging
Technologies," APS (American Physical Society), MRS (Materials Research Society), www.aps.org/, [Online]. Available: https://www.aps.org/policy/reports/popa-reports/upload/elementsreport.pdf.
[55] E. Y. Ngai, "Photovoltaic Specialty Materials Safety," in Photovoltaic Specialists
Conference (PVSC), Austin, TX, USA, 2012, vol. 38: IEEE, pp. 619-624. [56] C. Nunez, "Preventing Silicosis," Center for Disease Control. Available:
https://www.cdc.gov/features/preventing-silicosis/index.html [57] "3,4-Ethylenedioxythiophene," Sigma Aldrich, 2018. [Online]. Available:
https://www.sigmaaldrich.com/catalog/product/aldrich/483028?lang=en®ion=US [58] "Drive innovation and streamline advanced distributed energy resource market
acceptance," UL, 2018, [Online]. Available: https://industries.ul.com/wp-content/uploads/sites/2/2016/08/UL-1741-SA-Advanced-Inverters.pdf.
[59] "IEEE 1547-2018 - IEEE Standard for Interconnection and Interoperability of Distributed
Energy Resources with Associated Electric Power Systems Interfaces," IEEE Standards, February 02, 2018. [Online]. Available: https://standards.ieee.org/standard/1547-2018.html
[60] P. A. Basore, "Understanding Manufacturing Cost Influence on Future Trends in Silicon
Photovoltaics," IEEE Journal of Photovoltaics, vol. 4, pp. 1477-1482, November 2014. [61] C. Riordan and R. Hulstrom, "What is an Air Mass 1.5 Spectrum?," IEEE Conference on
Photovoltaic Specialists, vol. 2, pp. 1085-1088, August 06, 2002. [Online]. Available: https://ieeexplore.ieee.org/stamp/stamp.jsp?arnumber=111784
[62] M. Scholz, Wetlands for Water Pollution Control, 2 ed. Elsevier, 2016. [63] "IEC 61683:1999," IEC Webstore, November. [Online]. Available:
https://webstore.iec.ch/preview/info_iec61683%7Bed1.0%7Den.pdf [64] L. Michel, "Everything You Wanted to Know about Book Sales (But Were Afraid to Ask),"
Electric Lit, June 30. [Online]. Available: https://electricliterature.com/everything-you-wanted-to-know-about-book-sales-but-were-afraid-to-ask-1fe6bc00aa2d
52
[65] "How Much Does It Cost to Advertise Online," WebFX. [Online]. Available: https://www.webpagefx.com/internet-marketing/how-much-does-it-cost-to-advertise-online.html
[66] "IEEE Code of Ethics," IEEExplore. [Online]. Available:
https://www.ieee.org/about/corporate/governance/p7-8.html [67] D. Meadows, "Places to Intervene in a System," Whole Earth, pp. 78-84, Winter, 1997. [68] D. Sica, O. Malandrino, S. Supino, M. Testa, and M. C. Lucchetti, "Management of end-
of-life photovoltaic panels as a step towards a circular economy," Renewable and Sustainable Energy Reviews, vol. 82, pp. 2934-2945, November 06, 2017.
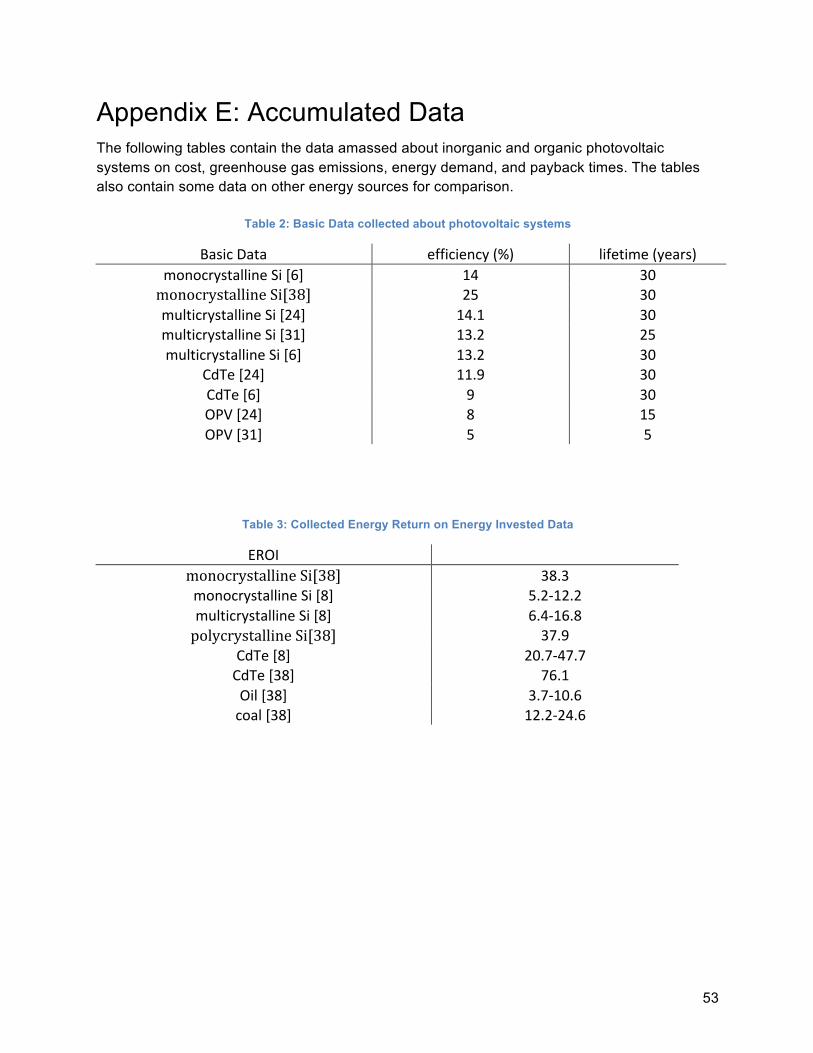
53
Appendix E: Accumulated Data The following tables contain the data amassed about inorganic and organic photovoltaic systems on cost, greenhouse gas emissions, energy demand, and payback times. The tables also contain some data on other energy sources for comparison.
Table 2: Basic Data collected about photovoltaic systems
BasicData efficiency(%) lifetime(years)monocrystallineSi[6] 14 30monocrystallineSi[38] 25 30multicrystallineSi[24] 14.1 30multicrystallineSi[31] 13.2 25multicrystallineSi[6] 13.2 30
CdTe[24] 11.9 30CdTe[6] 9 30OPV[24] 8 15OPV[31] 5 5
Table 3: Collected Energy Return on Energy Invested Data
EROI monocrystallineSi[38] 38.3monocrystallineSi[8] 5.2-12.2multicrystallineSi[8] 6.4-16.8polycrystallineSi[38] 37.9
CdTe[8] 20.7-47.7CdTe[38] 76.1Oil[38] 3.7-10.6coal[38] 12.2-24.6
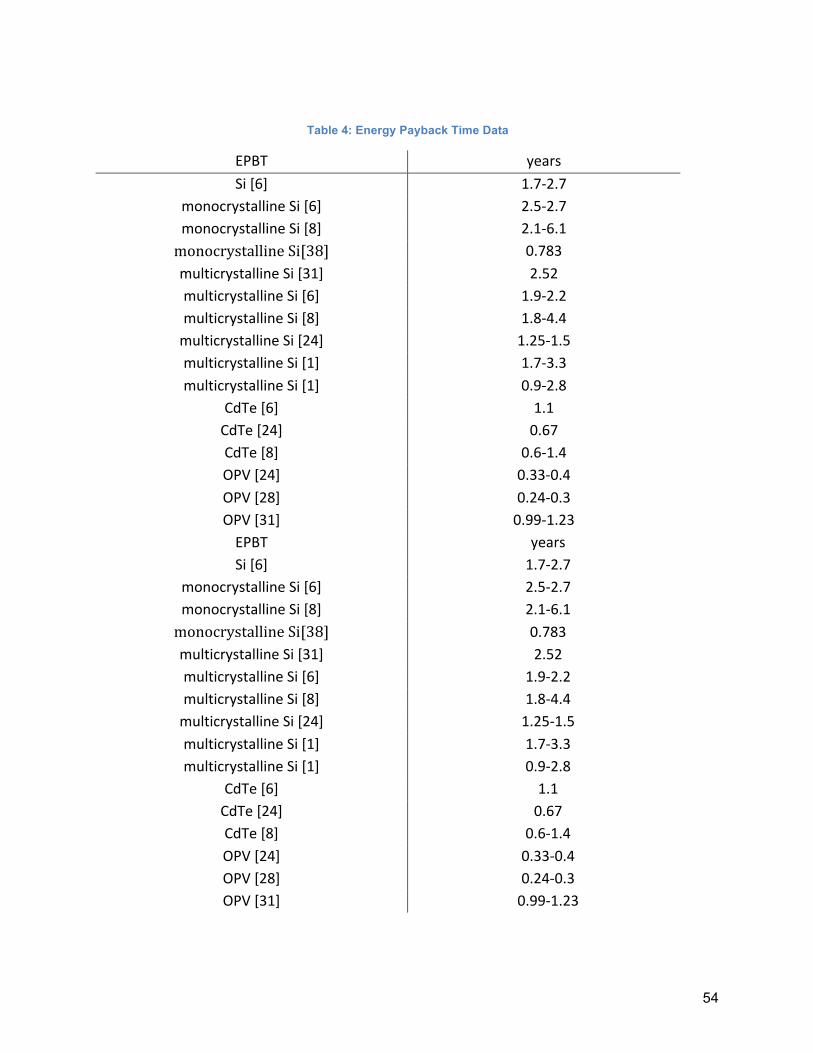
54
Table 4: Energy Payback Time Data
EPBT yearsSi[6] 1.7-2.7
monocrystallineSi[6] 2.5-2.7monocrystallineSi[8] 2.1-6.1monocrystallineSi[38] 0.783multicrystallineSi[31] 2.52multicrystallineSi[6] 1.9-2.2multicrystallineSi[8] 1.8-4.4multicrystallineSi[24] 1.25-1.5multicrystallineSi[1] 1.7-3.3multicrystallineSi[1] 0.9-2.8
CdTe[6] 1.1CdTe[24] 0.67CdTe[8] 0.6-1.4OPV[24] 0.33-0.4OPV[28] 0.24-0.3OPV[31] 0.99-1.23EPBT yearsSi[6] 1.7-2.7
monocrystallineSi[6] 2.5-2.7monocrystallineSi[8] 2.1-6.1monocrystallineSi[38] 0.783multicrystallineSi[31] 2.52multicrystallineSi[6] 1.9-2.2multicrystallineSi[8] 1.8-4.4multicrystallineSi[24] 1.25-1.5multicrystallineSi[1] 1.7-3.3multicrystallineSi[1] 0.9-2.8
CdTe[6] 1.1CdTe[24] 0.67CdTe[8] 0.6-1.4OPV[24] 0.33-0.4OPV[28] 0.24-0.3OPV[31] 0.99-1.23
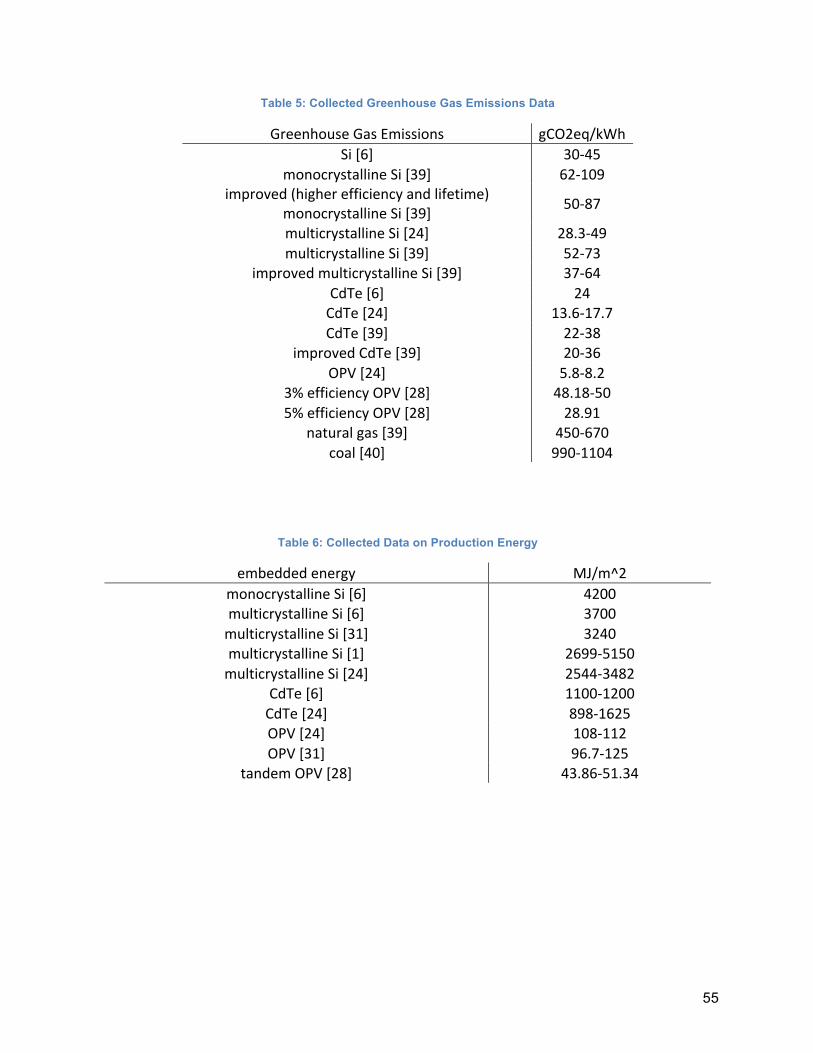
55
Table 5: Collected Greenhouse Gas Emissions Data
GreenhouseGasEmissions gCO2eq/kWhSi[6] 30-45
monocrystallineSi[39] 62-109improved(higherefficiencyandlifetime)
monocrystallineSi[39] 50-87
multicrystallineSi[24] 28.3-49multicrystallineSi[39] 52-73
improvedmulticrystallineSi[39] 37-64CdTe[6] 24CdTe[24] 13.6-17.7CdTe[39] 22-38
improvedCdTe[39] 20-36OPV[24] 5.8-8.2
3%efficiencyOPV[28] 48.18-505%efficiencyOPV[28] 28.91
naturalgas[39] 450-670coal[40] 990-1104
Table 6: Collected Data on Production Energy
embeddedenergy MJ/m^2monocrystallineSi[6] 4200multicrystallineSi[6] 3700multicrystallineSi[31] 3240multicrystallineSi[1] 2699-5150multicrystallineSi[24] 2544-3482
CdTe[6] 1100-1200CdTe[24] 898-1625OPV[24] 108-112OPV[31] 96.7-125
tandemOPV[28] 43.86-51.34
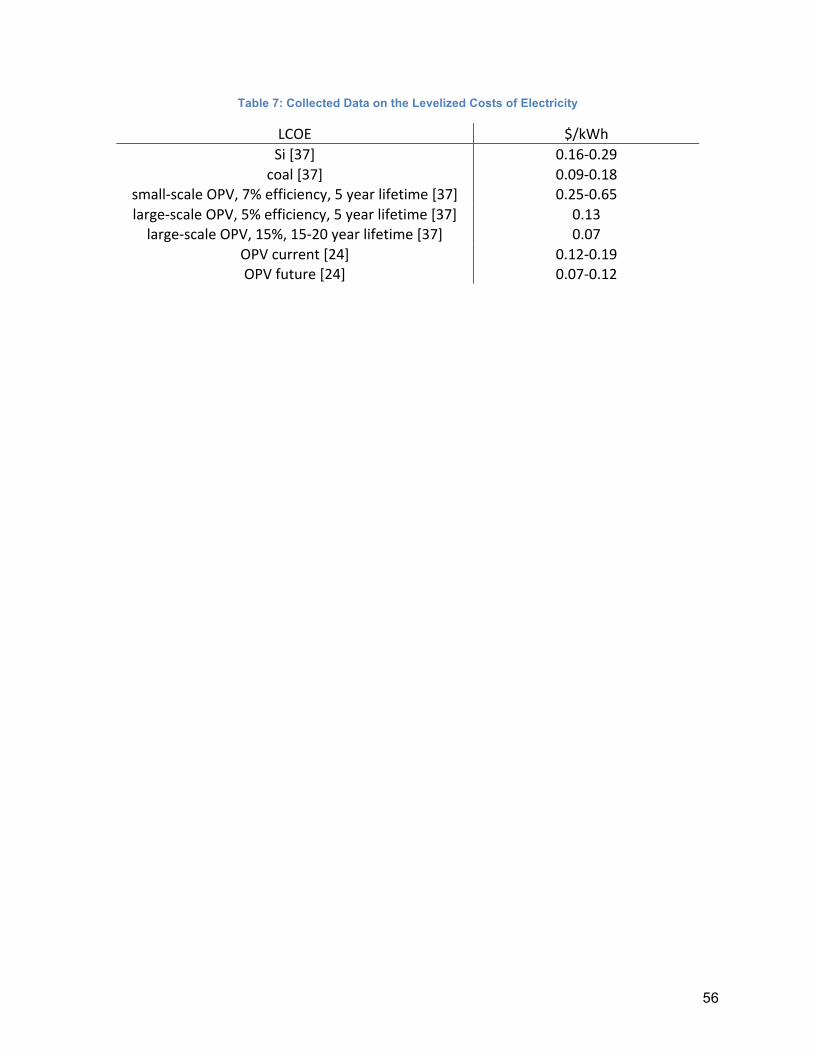
56
Table 7: Collected Data on the Levelized Costs of Electricity
LCOE $/kWhSi[37] 0.16-0.29coal[37] 0.09-0.18
small-scaleOPV,7%efficiency,5yearlifetime[37] 0.25-0.65large-scaleOPV,5%efficiency,5yearlifetime[37] 0.13large-scaleOPV,15%,15-20yearlifetime[37] 0.07
OPVcurrent[24] 0.12-0.19OPVfuture[24] 0.07-0.12