Comparison of nutritional quality between cow and goat...
16
U N I K A S S E L V E R S I T Ä T Bogor Agricultural University Indonesia Comparison of nutritional quality between cow and goat dairy products: A meta-analysis Palupi E 1,3 , Jayanegara A 2 , Setiawan B 1 , Sulaeman A 1 1 Department of Community Nutrition Faculty of Human Ecology, IPB, Indonesia 2 Department of Nutrition and Feed Technology Faculty of Animal Science, IPB, Indonesia 3 Department of Organic Food Quality and Food Culture Faculty of Organic Agricultural Sciences Kassel University, Germany 11.04.12 The 1 st Asia Dairy Goat Conference, Malaysia
Transcript of Comparison of nutritional quality between cow and goat...

U N I K A S S E L V E R S I T Ä T Bogor Agricultural University
Indonesia
Comparison of nutritional quality between cow and goat dairy products: A meta-analysis
Palupi E1,3, Jayanegara A2, Setiawan B1, Sulaeman A1
1Department of Community Nutrition
Faculty of Human Ecology, IPB, Indonesia
2Department of Nutrition and Feed Technology
Faculty of Animal Science, IPB, Indonesia
3Department of Organic Food Quality and Food Culture
Faculty of Organic Agricultural Sciences
Kassel University, Germany
11.04.12
The 1st Asia Dairy Goat Conference, Malaysia
2/16 Palupi et al 2012: Cow vs goat dairy product
Bogor Agricultural University, Indonesia
Kassel University, Germany
Content 1 Introduction
1.1 Background
1.2 Aim and objectives
2 Methodology
2.1 Literature search and selection
2.2 Studies coding
2.3 Statistical analysis
3 Results and discussion
3.1 Cow vs goat dairy products
3.2 Suitability of meta-analysis
4 Conclusion
References
Dairy products → all type of milk based products, including milk and other food products made from milk, like yoghurt, cream, cheese, ice cream, etc.

3/16 Palupi et al 2012: Cow vs goat dairy product
Bogor Agricultural University, Indonesia
Kassel University, Germany
1 Introduction
1.1 Background
Goat milk and undernourished communities
• Harsh climate condition
• Cowmilk-allergenicity and gastrointestinal problems
• Nutritional properties
1.2 Aim and objectives
• Analyse the comparison of nutritional quality between cow and goat dairy products
by summarising the previous studies using the meta-analytic technique
• Out come → an additional scientific reference in the quality of goat dairy products
Sources: Amigo and Fontecha 2011, Haenlein 2004, Silanikove 2000, Morand-Fehr 2005, Park 1994, Ceballos et al
2009a, Haenlein 2004, Ceballos et al 2009b, Silanikove et al 2010, Alferez et al 2006.
1 Introduction 2 Methodology 3 Results and discussion 4 Conclusions

4/16 Palupi et al 2012: Cow vs goat dairy product
Bogor Agricultural University, Indonesia
Kassel University, Germany
2 Methodology 2.1 Literature search and selection
Search: EBSCO Information Services (http://search.ebscohost.com/) and
Science Direct (http://www.sciencedirect.com/)
using key words and names of the major authors in the field
Criteria:
• Published in English as full text articles
• Peer-reviewed published journals
• Direct comparison between cow and goat dairy products
• Comparing the nutritional quality including macro- and micro- nutrients
Table 1: Summary of literature search and screening process
1 Introduction 2 Methodology 3 Results and discussion 4 Conclusions
Process Number of selected/eliminated
articles
Number of remaining
articles
Initial literature search +3120 3120
Initial screening -2659 461
Title evaluation -411 50
Abstract evaluation -23 27
Parameter evaluation -10 17
Insufficient data for statistical analysis -2 15
5/16 Palupi et al 2012: Cow vs goat dairy product
Bogor Agricultural University, Indonesia
Kassel University, Germany
2 Methodology
1 Introduction 2 Methodology 3 Results and discussion 4 Conclusions
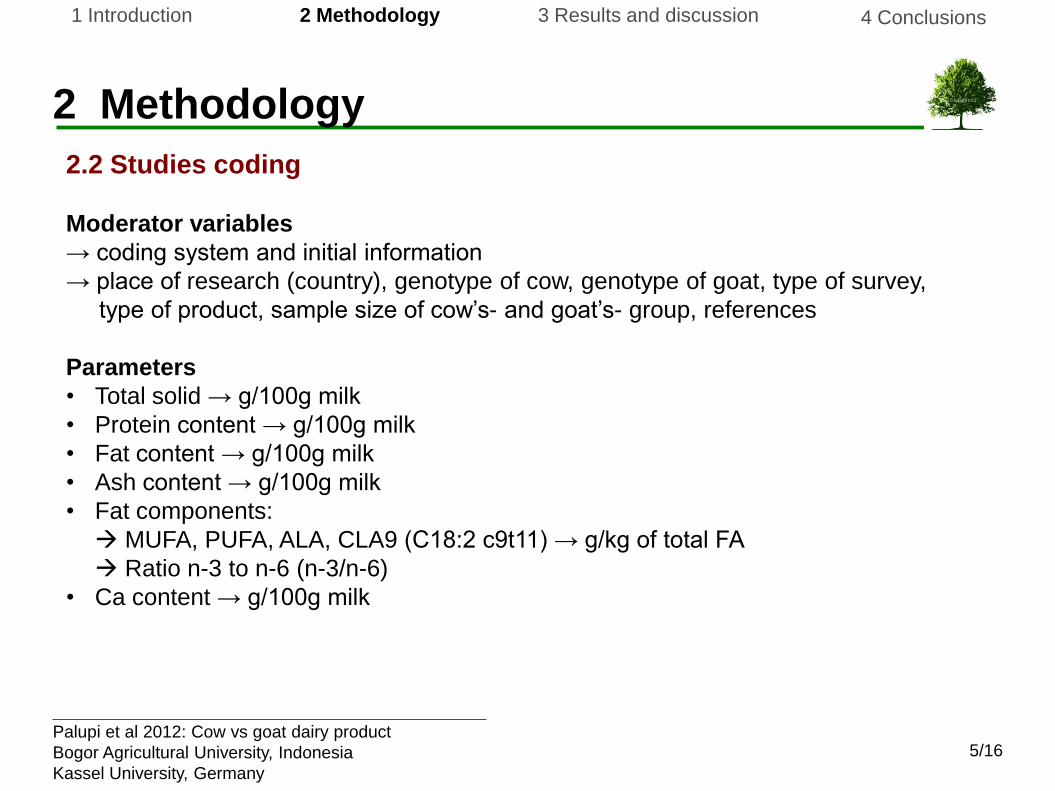
2.2 Studies coding
Moderator variables
→ coding system and initial information
→ place of research (country), genotype of cow, genotype of goat, type of survey,
type of product, sample size of cow’s- and goat’s- group, references
Parameters
• Total solid → g/100g milk
• Protein content → g/100g milk
• Fat content → g/100g milk
• Ash content → g/100g milk
• Fat components:
MUFA, PUFA, ALA, CLA9 (C18:2 c9t11) → g/kg of total FA
Ratio n-3 to n-6 (n-3/n-6)
• Ca content → g/100g milk

6/16 Palupi et al 2012: Cow vs goat dairy product
Bogor Agricultural University, Indonesia
Kassel University, Germany
2.2 Studies coding (continued)
Table 2: List of comparison studies used in meta-analysis
1 Introduction 2 Methodology 3 Results and discussion 4 Conclusions
Studies
coding
Expt.
no.
Country Cow
Goat
Place of
sampling Type of product
Additional
variable
Nc Ng References
1 1 Spain Holstein Freisian Granadina
Farm Fresh milk -
30 30 Ceballos et al. 2009
2 2 Spain Mix Mix Basket Fermented products - 34 8 Navarro-Alarcon et al. 2011
3 3 Germany - -
Farm Fresh milk Pasture 8 8 Jahreis et al. 1999
3 4 Germany - -
Farm Fresh milk Indoor 8 8 Jahreis et al. 1999
4 5 Belgia - - Farm Fresh milk Colostrum 2 2 Benemariya et al. 1993
4 6 Belgia - - Farm Fresh milk Mature 19 5 Benemariya et al. 1993
5 7 Cyprus - Damascus Farm Fresh milk - 861 721 Hadjipanayiotou 1995
6 8 Italy - - Farm Fresh milk - 5 5 Blasi et al. 2008
7 9 New Zealand - - Basket Milk infant formula - 2 2 Rutherfurd et al. 2006
8 10 USA Holstein Alpine Farm Fresh milk - 25 25
Park 1992
8 11 USA Jersey Nubian Farm Fresh milk - 25 25
Park 1992
9 12 Turkey Konya Konya Farm Yayik butter - 2 2 Sagdic et al. 2004
10 13 Spain - Andalusian Basket Semi-skimmed
sterilized milk
10 10 Olalla et al. 2009
10 14 Spain - Andalusian Farm and basket Raw goat milk - 10 10 Olalla et al. 2009
11 15 Poland - - Farm Yoghurt - 3 3 Domagala 2009
12 16 Tunisia Cimentale Malti Farm Fresh milk - 2 2 Bornaz et al. 2009
12 17 Tunisia Cimentale Malti Farm Whey - 2 2 Bornaz et al. 2009
13 18 Greece Friesian race Local native Farm Teleme cheese - 3 3 Mallatou and Pappa 2005
14 19 Czech
Republic
Holstein and Czech
Pied
White
Shorthaired
Farm Fresh milk - 30 30 Janstova et al. 2009
15 20 New Zealand - - Basket Whole milk powder - 2 4
Prosser et al. 2008
15 21 New Zealand - - Basket Infant formula - 4 3
Prosser et al. 2008
15 22 New Zealand - - Basket Follow-on formula - 4 3
Prosser et al. 2008
13 references 29 comparisons 9 moderator variables 23 parameters
15 references 22 comparisons 7 moderator variables 10 parameters → mean & SD

7/16 Palupi et al 2012: Cow vs goat dairy product
Bogor Agricultural University, Indonesia
Kassel University, Germany
2.3 Statistical analysis
- Effect size as the “Hedges' d” was applied Cow group→ control group (C) Goat group → experimental group (E)
d =( X̄
E− X̄
C)
SJ
(∑i= 1
n
wi d i)
(∑i= 1
n
w i)
Sources: Rosenberg et al. 2000, p. 16ff; Sanchez-Meca and Marin-Martinez 2010, p. 276ff; SPSS 13 2007.
Nfs > 5N+10 - Fail-safe number (N
fs) → Orwin's method
- Precision → 95% of CI (Confidence Interval) = ± 1.96 x sd+
- How large the d? → Cohen's benchmarks 0.2 → small effect size 0.5 → medium effect size 0.8 → large effect size
- Software → MetaWin 2.0
- Additional parameters → Mixed effect model of weighted paired-samples t-test with 95% of CI → ANOVA with Tukeys' honest test using SPSS version 13
- Cumulative effect size (d+)
J = 1−3
(4( NC+ N
E− 2)− 1)
S= √((NE− 1)(s
E)
2+ ( N
C− 1)(s
C)2)
(NE+ N
C− 2)
w i=1
v d
1 Introduction 2 Methodology 3 Results and discussion 4 Conclusions
8/16 Palupi et al 2012: Cow vs goat dairy product
Bogor Agricultural University, Indonesia
Kassel University, Germany
3 Results and discussion
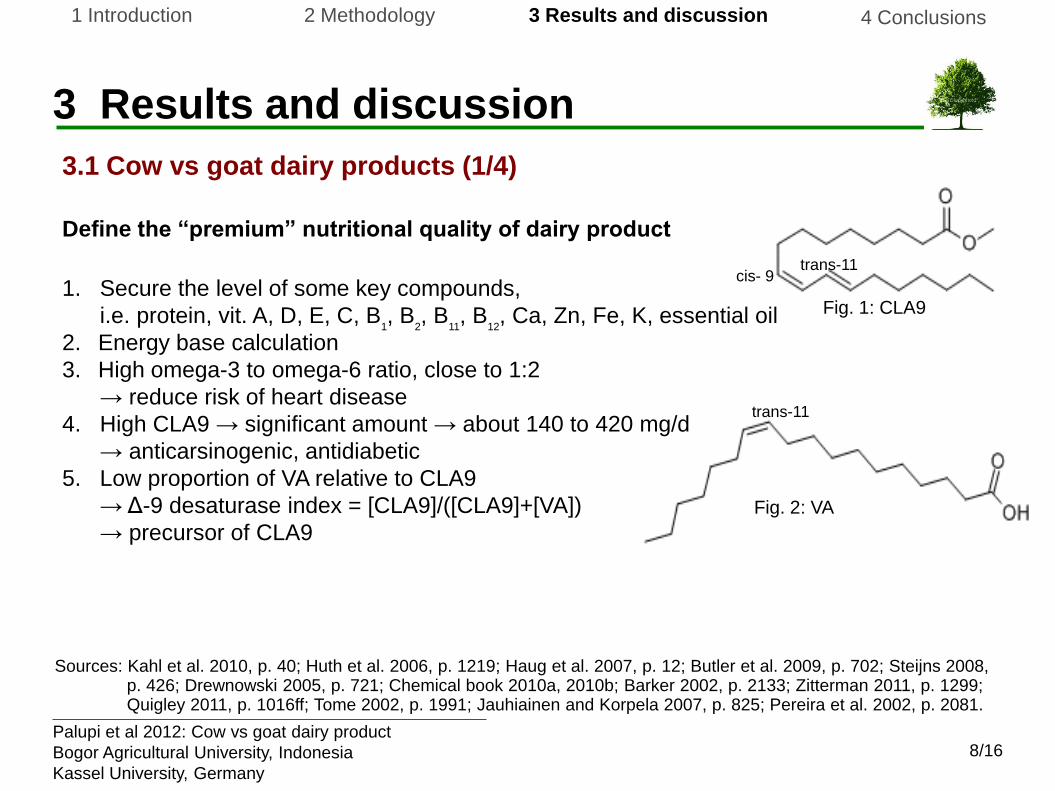
3.1 Cow vs goat dairy products (1/4)
Define the “premium” nutritional quality of dairy product
1. Secure the level of some key compounds,
i.e. protein, vit. A, D, E, C, B1, B
2, B
11, B
12, Ca, Zn, Fe, K, essential oil
2. Energy base calculation
3. High omega-3 to omega-6 ratio, close to 1:2
→ reduce risk of heart disease
4. High CLA9 → significant amount → about 140 to 420 mg/d
→ anticarsinogenic, antidiabetic
5. Low proportion of VA relative to CLA9
→ Δ-9 desaturase index = [CLA9]/([CLA9]+[VA])
→ precursor of CLA9
Sources: Kahl et al. 2010, p. 40; Huth et al. 2006, p. 1219; Haug et al. 2007, p. 12; Butler et al. 2009, p. 702; Steijns 2008, p. 426; Drewnowski 2005, p. 721; Chemical book 2010a, 2010b; Barker 2002, p. 2133; Zitterman 2011, p. 1299; Quigley 2011, p. 1016ff; Tome 2002, p. 1991; Jauhiainen and Korpela 2007, p. 825; Pereira et al. 2002, p. 2081.
trans-11 cis- 9
Fig. 1: CLA9
trans-11
Fig. 2: VA
1 Introduction 2 Methodology 3 Results and discussion 4 Conclusions

9/16 Palupi et al 2012: Cow vs goat dairy product
Bogor Agricultural University, Indonesia
Kassel University, Germany
Fig. 3: Forest plot of cumulative effect size and 95% CI of some parameters as the prediction for comparing the nutritional quality of cow and goat dairy products
The evidence
3.1 Cow vs goat dairy products (2/4)
1 Introduction 2 Methodology 3 Results and discussion 4 Conclusions
Tend to dairy goat’s group
CLA9 (-1.19R, ±0.98)
ALA (4.95R, ±2.67)
PUFA (1.95R, ±0.83)
Ash content (1.63R, ±0.25)
Total solid (1.66R, ±0.18)
Tend to dairy cow’s group
Fat content (0.98R, ±0.17)
MUFA (-0.07, ±0.66)
Protein content (2.06R, ±0.15)
Ca (0.07, ±0.92)
√ √
√ √
√ √

10/16 Palupi et al 2012: Cow vs goat dairy product
Bogor Agricultural University, Indonesia
Kassel University, Germany
Fig. 4: Weighted mean value n-3/n-6
a
b
√
The evidence
3.1 Cow vs goat dairy products (3/4)
1 Introduction 2 Methodology 3 Results and discussion 4 Conclusions
Protein, fat, PUFA, α-LNA, Ca, n-3/n-6
0,097
0,194
0
0.05
0.1
0.15
0.2
0.25
Cow Goat
11/16 Palupi et al 2012: Cow vs goat dairy product
Bogor Agricultural University, Indonesia
Kassel University, Germany
Circulating blood
Intestine Adipose fat
tissue Rumen
Feeding SFA UFA
C16:0 & C18:0
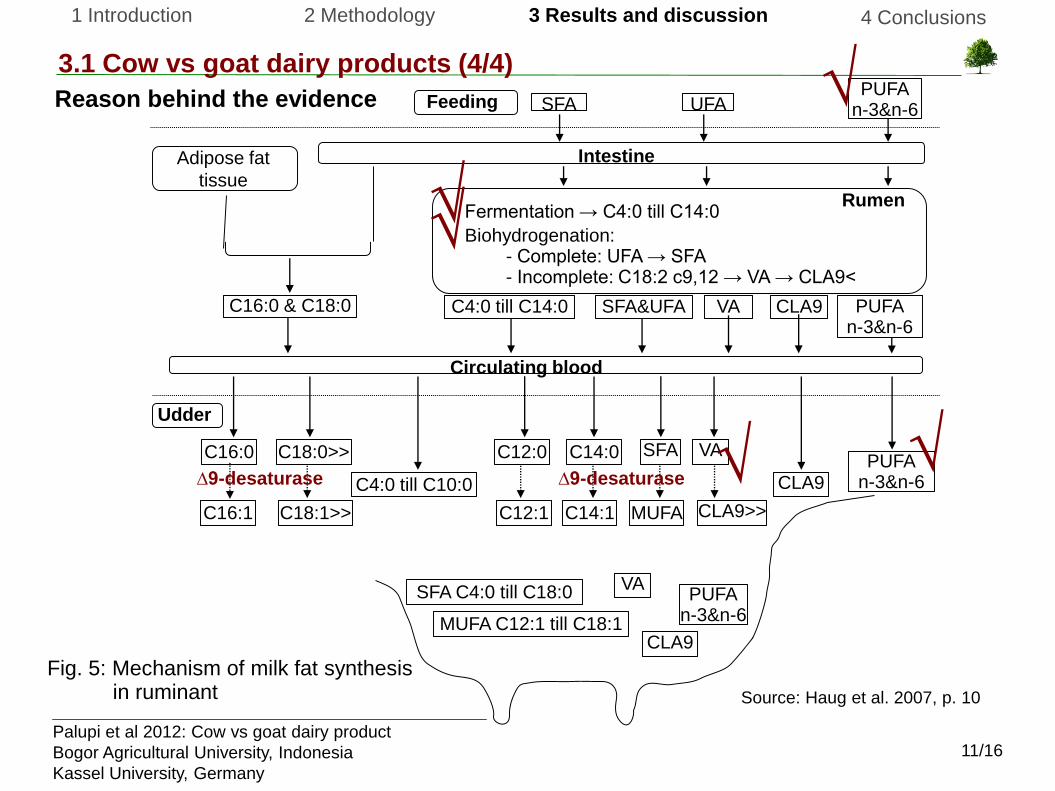
Fermentation → C4:0 till C14:0
Biohydrogenation: - Complete: UFA → SFA - Incomplete: C18:2 c9,12 → VA → CLA9<
C4:0 till C14:0 VA CLA9
Udder
C16:0
C4:0 till C10:0
C18:0>> C12:0 C14:0
C18:1>> C16:1 C12:1 C14:1 MUFA
PUFA n-3&n-6 ∆9-desaturase ∆9-desaturase
SFA C4:0 till C18:0
MUFA C12:1 till C18:1
PUFA n-3&n-6
SFA&UFA
CLA9
CLA9>>
CLA9
VA
SFA VA
PUFA n-3&n-6
PUFA n-3&n-6
Fig. 5: Mechanism of milk fat synthesis in ruminant Source: Haug et al. 2007, p. 10
√ √
√
√
Reason behind the evidence
3.1 Cow vs goat dairy products (4/4)
1 Introduction 2 Methodology 3 Results and discussion 4 Conclusions
√
12/16 Palupi et al 2012: Cow vs goat dairy product
Bogor Agricultural University, Indonesia
Kassel University, Germany
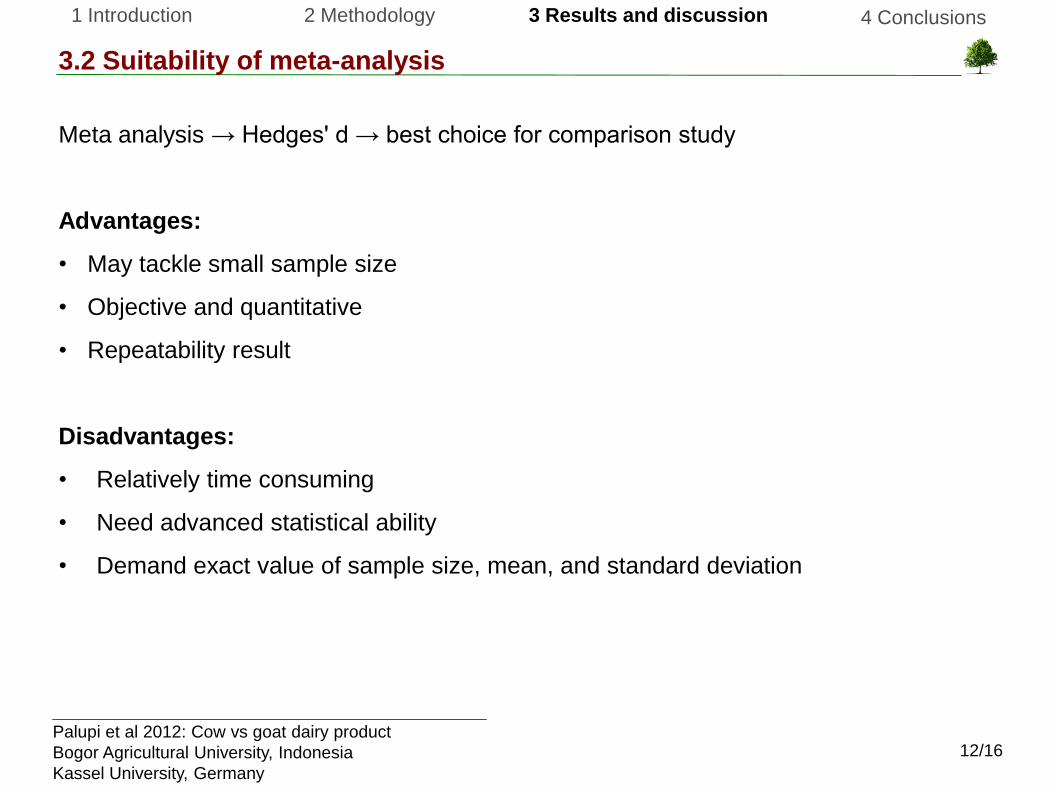
3.2 Suitability of meta-analysis
Meta analysis → Hedges' d → best choice for comparison study
Advantages:
• May tackle small sample size
• Objective and quantitative
• Repeatability result
Disadvantages:
• Relatively time consuming
• Need advanced statistical ability
• Demand exact value of sample size, mean, and standard deviation
1 Introduction 2 Methodology 3 Results and discussion 4 Conclusions
13/16 Palupi et al 2012: Cow vs goat dairy product
Bogor Agricultural University, Indonesia
Kassel University, Germany
4 Conclusions
• Goat dairy products have different nutritional qualities from the cow dairy
products
• The unique nutritional feature of goat dairy products is that it may be
good for supporting human health
• Further identical meta-analysis may be best applicable for analyzing and
summarizing the comparison between cow and goat dairy products
by employing more parameters
1 Introduction 2 Methodology 3 Results and discussion 4 Conclusions

14/16 Palupi et al 2012: Cow vs goat dairy product
Bogor Agricultural University, Indonesia
Kassel University, Germany
References (1/2) Alferez, M.J.M., I. Lopez-Aliaga, T. Nestares, J. Diaz-Castro, M. Barrionuevo, P.B. Ros and M.S. Campos, 2006. Dietary
goat milk improves iron bioavailability in rats with induced ferropenic anemia in comparison with cow milk. Int. Dairy J. 16:813-821.
Amigo, L. and J. Fontecha, 2011. Goat milk. Encyclopedia of Dairy Science (Second Edition): 484-493. Ceballos, L.S., M.R.S. Sampelayo, F.G. Extremera and M.R. Osorio, 2009a. Evaluation of the allergenicity of goat milk,
cow milk, and their lactosera in a guinea pig model. J. Dairy Sci. 92:837-846. Ceballos, L.S., E.R. Morales, G. de la T. Adarve, J.D. Castro, L.P. Martinez and M.R.S. Sampelayo, 2009b. Composition
of goat and cow milk produced under similar conditions and analyzed by identical methodology. J. Food Comps. Anal. 22:322-329.
Drewnowski, A., 2005. Concept of a nutritious food: Toward a nutrient density score. The Am. J. Clin. Nutr. 82:721-732. Haenlein, G.F.W., 2004. Goat milk in human nutrition. Small Ruminant Research 51: 155-163. Haug, A., A.T. Hostmark and O.M. Harstad, 2007. Bovine milk in human nutrition – A review. Lipids Health Dis. 6(25):1-
16.Hedges, L.V. and I. Olkin, 1985. Statistical methods for meta-analysis. Academic Press, London, UK. Huth, P.J., D.B. DiRienzo and G.D. Miller, 2006. Major scientific advances with dairy foods in nutrition and health. Am.
Dairy Sci. Assoc. 86:1207-1221. Morand-Fehr, P., 2005. Recent developments in goat nutrition and application: A review. Small Ruminant Res. 60:25-43. Park, Y.W., 1994. Hypo-allergenic and therapeutic significance of goat milk. Small Ruminant Res. 14:151-159. Rosenberg, M.S., D.C. Adams and J. Gurevitch, 2000. MetaWin: Statistical software for meta-analysis: Version 2.0.
Sinauer Associates, Inc., State University of New York, Iowa State University. Sunderland, Massachusetts. Sanchez-Meca, J. and F. Marin-Martinez, 2010. Meta analysis. International Encyclopedia of Education, 3rd ed., pp.
274-282. Silanikove, N. 2000. The physiologiyal basis of adaptation in goats to harsh environments. Small Ruminant Res. 3th
edition. 35(3): 181 – 193. Silanikove, N., G. Leitner, U. Merin and C.G. Prosser, 2010. Recent advances in exploiting goat’s milk: Quality, safety
and production aspects. Small Ruminant Res. 89:110-124. Steijns, J. M., 2008. Dairy products and health: Focus on their constituents or on the matrix? Int. Dairy J. 18:425-435.

15/16 Palupi et al 2012: Cow vs goat dairy product
Bogor Agricultural University, Indonesia
Kassel University, Germany
References (2/2) Navarro-Alarcon M, Cabrera-Vique C, Ruiy-Lopey MD, Olalla M, Artacho R, Gimeney R, Quintana V and Bergillos T.
2011. Lavels of Se, Zn, Mg and Ca in commercial goat and cow milk fermented products, Relationship with their chemical composition and probiotic starter culture. In Food Chemistry 129: 1126-1131.
Jahreis G, Fritsche J, Mickel P, Schone F, Moller U and Steinhart H. 1999. The potential anticarcinogenic conjugated linoleic acid, cis-9, trans-11, C18:2, in milk of different species: cow, goat, ewe, sow, mare, woman. In Nutrition Research 19 (10): 1541-1549.
Benemariya H, Robberecht H and Deelstra H. 1993. Zinc, copper and selenium in milk and organs of cow and goat from Burundi, Africa. In The Science of the Total Environment 128: 83-98.
Hadjipanayiotou M. 1995. Composition of ewe, goat and cow milk and of colostrum of ewes and goats. In Small Ruminats Research 18:255-262.
Blasi F, Montesano D, De Angelis M, Maurizi A, Ventura F, Cossignani L, Simonetti MS and Damiani P. 2008. Results of stereospecific analzsis of triacylglycerol fraction from donkey, cow, ewe, goat and buffalo milk. In Journal of Food Composition and Analysis 21: 1-7.
Rutherfurd SM, Darragh AJ, Hendriks, Prosser CG and Lowry D. 2006. True ileal amino acid digestibility of goat and cow milk infant formulas. In J. Dairy Sci. 89: 2408-2413.
Park YW. 1992. Comparison of buffering components in goat and cow milk. In Small Ruminant Research 8: 75-81. Sagdic O, Donmez M, Demirci M. 2004. Comparison of characteristics and fatty acid profiles of traditional Turkish yayik
butters produced from goats’, ewes’, or cows’ milk. In Food Control 15: 485-490. Olalla M, Ruiz-Lopez MD, Navarro M, Artacho R, Cabrera C, Gimenez R, Rodriguez C and Mingorance R. 2009.
Nitrogen fractions of Andalusian goat milk compared to similar types of commercial milk. In Food Chemistry 113: 835-838.
Bornaz S, Sahli A, Attalah A and Attia H. 2009. Physicochemical characteristic and renneting properties of camel‘s milk: a comparison with goats‘, ewes‘ and cows‘ milks. In Society of Dairy Technology 64 (4): 505-5013.
Mallatou H and Pappa EC. 2005. Comparison of characteristics of teleme cheese made from ewe‘s, goat‘s and cow‘s milk or a mixture of ewe‘s and goat‘s milk. In International Journal of Dairy Technology 58 (3): 158-163.
Janstova B, Navratilova P, Drackova M, Pridalova H and Lenka V. 2009. Impact of heat treatment of the freezing points of cow and goat milk. In ACTA VET. BRNO 78: 679-684.
Prosser CG, McLaren RD, Frost D, Agnew M and Lowry DJ. 2008. Composition of the non-protein fraction of goat whole milk powder and goat milk-based infant and follow-on formulae. In International Journal of Food Sciences and Nutrition 59 (2): 123-133.

Thank you very
much...