Silvical Characteristics of Monterey Pine (Pinus radiata D. Don)

Journal of Environmental Management (1991) 32, 383-395
Comparison of Monterey Pine Stress in Urban and Natural Forests
David J. Nowak
USDA Forest Service, Northeastern Forest Experiment Station, c/o 5 Moon Library, State University of New York, College of Environmental Science and Forestry, Syracuse, New York 13210, U.S.A.
and Joe R. McBride
Department of Forestry and Resource Management, University of California, Berkeley, California 94720, U.S.A.
Received 16 March 1990
Monterey pine street trees within Carmel, California and its immediate vicinity, �9 as well as forest-grown Monterey pine within adjacent natural stands, were sampled with regard to visual stress characteristics, and various environmental and biological variables. Two stress indices were computed, one hypothesized before data collection was based on relative foliage retention and color; the other was derived through principal component analysis of 10 visual stress characteristics. Both indices were highly correlated (r = 0"89). The more closed and generally denser forest stands led to increased plant competition that induced higher levels of stress for forest trees less than 50 cm in diameter when compared with urban street trees of comparable diameters. Urban tree stress generally increased with tree size due to increased internal shading of branches and loss of shade tolerance associated with aging. Differences in stress levels and stress factors are discussed from the standpoint of landscape ecology and implications for tree management are presented.
Keywords: urban forestry, tree stress, landscape ecology, urban-wildland interface, Pinus radiata.
1. Introduction
Condit ions in u rban and natural forest ecosystems influence tree stress. The level o f tree stress in these ecosystems can be an impor tan t factor in insect /pathogen/tree interactions and tree mortali ty. Tree stress may also be an impor tan t condi t ion influencing ecosystem inpu t -ou tpu t relationships where u rban forests are adjacent to natural forests that support similar tree species. Areas o f high tree stress can act as reservoirs for various stress dependent insects and pathogens. A n unfor tuna te ou tpu t f rom a stressed natural forest ecosystem may be insects which invade an adjacent u rban forest ecosystem. By
383
0301-4797/91/040383+ 13 803.00/0 �9 1991 Academic Press Limited

384 Monterey pine stress
understanding factors influencing tree stress, management can be directed toward mitigating these factors and reducing or eliminating unfavorable ecosystem outputs.
The urban tree environment has generally been considered more stressful than the forest tree environment. The stresses are certainly different, but studies as to which environment is actually more stressful have not been conducted. The urban environment exhibits different types and intensities of stresses, but also has large inputs of energy, through various maintenance practices, to mitigate these stress factors.
"Stress results in an aberrant change in physiological processes brought about by one or a combination of environmental and biological factors", all having the potential to produce injury (Hale and Orcutt, 1987). These factors include, but are not limited to: air; water and soil pollution; light, temperature and moisture extremes; soil compaction; mechanical damage; plant competition; insect pests; and disease agents.
As used in this study, stress is defined as (Lillesand et al., 1979):
"any disturbance of the normal growth cycle of a tree brought about by any living entity or environmental factor which interferes with the manufacture, translocation, or utilization of food, mineral nutrients, and water in such a way that the affected tree changes in appearance."
Stresses that change the appearance of a tree include both external stresses (e.g. insufficient light, water and/or nutrients) and internal stresses of the maturation process. The appearance change of stressed trees will include: increased numbers of dead branches; reduced foliage retention; and more chlorotic, smaller foliage.
The main objectives of this study were to devise a visual stress index to test whether trees planted in a street tree environment have, on average, been subject to more stress than trees grown in a forest environment, and what environmental and biological factors are associated with increased stress.
2. Methods
Carmel-by-the-Sea, California was chosen as the site for this study because of the dominance of Monterey pine (Pinus radiata D. Don) in the street tree population and the presence of adjacent natural Monterey pine forests. Cannel was incorporated in 1916 at the edge of the largest of three mainland native stands of Monterey pine (Roy, 1966; Donley et al., 1979).
It is a city of 235 ha with a population of 4990 (D'Ambrosio, 1974; Fay et al., 1987). Predominantly a residential community, it has a center city commercial district which attracts and sustains a large tourist population. Other commercial and residential areas also exist immediately adjacent to Carmel. Carmel and its urban vicinity are not under the same intensity of urban stress factors (e.g. pollution, human population density) as large metropolitan areas, but Carmel can be considered comparable to small urban areas and suburban/exurban areas.
Carmel's urban forest is dominated by Monterey pine, both on public and private lands. Pines (90-95% Monterey pines) comprise 40% of the city tree population (11 069 city trees) and 16% of the privately owned trees (20 879 private trees) (Kelly, pers. comm. 1988). The adjacent natural forest, approximately 4000 ha, occurs to the north and east of the city (Roy, 1966). Within Carmel there is a general uphill gradient away from the ocean (west) toward and into the natural forest.
In the natural stands, Monterey pine generally reaches 20 to 35 m in height and 0-6 to 0.9 m in diameter at maturity. Monterey pine is short-lived, averaging not more than 80 to 90 years, and rarely living beyond 150 years. Mature tree roots are superficial and are

D. J. Nowak and J. R. McBride 385
normally found in the top 30 cm of soil. They generally do not penetrate deeper than 60 cm. Monterey pine is judged as intermediate in tolerance to competition, the middle class in a scale of five broad divisions (Fowells, 1965).
Many Monterey pine street trees within Carmel were planted by city personnel. These trees were obtained from local nurseries but were not selected for genetic traits enhancing performance in urban environments. Street trees outside Carmel are a combination of county and citizen planted trees of unknown origin and remnants of the natural stand.
2.1. SAMPLE DESIGN
Natural stands were sampled using a stratified random sampling design. Forested areas were stratified by: (1) direction from Carmel; (2) distance from Carmel; and (3) aspect. Three 0.04 ha plots were randomly located within each possible direction-distance- aspect combination (72 plots). Due to inaccessibility of some private lands, only 60 plots were measured (518 Monterey pine). All Monterey pine 10 cm or greater were measured. For all other trees greater than 10 cm, species and diameter were noted.
Monterey pine street trees greater than 10 cm in diameter were sampled in Carmel and immediately adjacent communities using a systematic sampling design of five trees per block. Alternate city blocks were measured throughout the urban/suburban areas of Carmel (178 blocks; 783 trees).
2.2. SAMPLE DATA COLLECTION
The urban and natural forest Monterey pine were sampled in two temporal stages during the summer of 1987. During the first stage, variables that do not change significantly over a data collection period were measured.
These variables include: ground cover type; soil compaction (g/cm 2 pressure to penetrate top inch of soil); adjacent land use; relative traffic flow; curbing; planting strip width; distance of tree from road; lateral root disruption (0,1,5,9 scale: none to high); surface root impact (1,5,9 scale: light to severe); root surface covering (number of sides of tree with roots covered by impervious layers); decay (0,1,5,9 scale: none to advanced); trunk wounds (per cent of trunk circumference girdled by wounds); diameter; height (estimated to nearest 3 m); crown closure (number of crown sides touching adjacent tree crowns); elevation; distance from coast; and distance from nearest urban area or forest stand. The 0,1,5,9 scales were chosen with reference to Lillesand et aL (1978) and scale values were selected to represent actual difference observed on the ground. Variables measured specifically for forest trees include: canopy position (dominant or co- dominant, intermediate, suppressed and young-open: small trees grown in the open); aspect; and tree density.
Crown variables were measured during the second data stage. These variables are thought to change rapidly over short periods of time and are most indicative of a tree's stress condition.
Crown variables include: average needle retention (number of years); primary and secondary foliage color [numerically indexed (1) blue green; (2) yellow green; (3) yellow; (4) red; (5) brown]; per cent of foliage exhibiting secondary color; crown ratio (per cent of height above lowest branch); crown shape (1-9 scale: full crown to dead tree) (Lillesand et al., 1978); foliage, trunk and general conditions (0,1,4,6,8,9 scale: excellent health to dead tree) (Lillesand et al., 1978); per cent large and small dead limbs; per cent

386 Monterey pine stress
natural crown pruning; and per cent maintenance crown pruning. Limb and pruning percentages were based on the potential crown volume above the lowest branch. Per cent of stem below the lowest branch that was maintenance pruned was also noted.
These crown variables were measured during early August because this time period was considered to be most stressful, with minimal average monthly rainfall (0.3 cm) and maximum average monthly temperature (15-6"C) (NOAA, 1986). Fog drip during this time of the year car; add up to 1-4 cm of additional moisture per week, but averages around 0.5 cm in the sample area (McDonald, 1957).
2.3. VISUAL STRESS INDICES
Ideally, if a conifer tree was never stressed by any factor, including maturation processes, it would retain all of its needles throughout its life, and all of these needles would be healthy and green. This is not the case though, and tree needles change color, trees shed needles, and dead branches appear or are pruned away.
This "ideal" non-stressed tree was used as a base for our first stress index (STRESS). This index was derived prior to data collection and is based on the amount of foliage retained relative to the tree size and foliage color. An index value of 0 represents this "ideal" tree in which the entire theoretical crown volume (i.e. volume occupied if all branches and foliage were retained since germination) is composed of green, healthy needles. At the other end of the index, a value of 1 represents a tree with no needles (dead).
The more needles retained and the healthier the color of foliage, the lower the index value. This index is calculated by: 1 - [(per cent of theoretical crown volume occupied by foliage/100)x(foliage color weighting value/100)]. The foliage color weighting value= [(per cent primary color/primary color index) + (per cent secondary color/ secondary color index)]. The color index = (1) blue green; (2) yellow green; (3) yellow; (4) red; and (5) brown.
To aid in quantifying Monterey pine stress, a second stress index (PCSTRS) was devised through the use of principal component analysis. Ten crown variables (Table 1) indicative of tree stress were input such that larger values indicate increased stress. By principal component analysis, three components were found to adequately express all of the original variables (Table 1). These three components represented: (1) a general condition component composed of general, foliage and trunk condition, foliage color, needle loss and per cent large dead limbs; (2) a limb loss component formed by per cent natural pruning, crown shape and dead crown ratio; and (3) a small dead limb component composed of per cent small dead limbs.
These three components were combined to yield a singular visual stress index that ranges from 0 (non-stressed) to 1 (highly stressed/dead). This index is calculated by multiplying the variables (standardized to the same mean and standard deviation) by component values above 0.4 and summing to yield three components scores (Comrey, 1973). These component scores are individually equilibrated on a 0--1 scale by subtract- ing the theoretical minimum score and dividing by the theoretical range of possible scores. These equilibrated scores are weighted by their corresponding eigenvalue and divided by the sum of the three eigenvalues. These weighted scores are added together and divided by the maximum score to yield a singular stress index ranging from 0 to 1.

D. J. Nowak and J. R. McBride
TABLE 1. Results of principal components analysis for visual stress index
387
Component
Tree stress symptoms 1 2 3
Needle losst 0"650 0-185 0.108 Foliage colors 0"817 - 0.280 - 0.047 Per cent large dead limbs 0"452 -0.382 -0.385 Per cent small dead limbs 0" 138 -0-232 0-877 Per cent natural crown pruning 0.318 0.790 -0-170 Dead crown ratio w 0'277 0"477 0.353 Crown shape 0.388 0"597 - 0.023 Foliage condition 0"890 - 0.222 0-001 Trunk condition 0"801 0.017 0.002 General condition 0"932 - 0-127 - 0 .018 Per cent of total variance 39% 16% 11% Eigenvalues 3-945 1.587 1-087
Bold scores are above the cut-off point (0"400). Component 1, General condition component; Component 2, Limb loss component; Component 3, Small
dead limb component. t Maximum needle retention (3 years) minus average needle retention. :~ (primary color index x primary color per cent) + (secondary color index x secondary color per cent). w Per cent of theoretical crown volume below the lowest branch and maintenance pruned above the lowest
branch.
2.4. URBAN VERSUS NATURAL FOREST STRESS
Street tree populations are biased toward a less visually stressed population than natural forest stands because highly strained, dying and dead trees are removed from the urban population through maintenance programs. Dying and dead forest trees, on the other hand, can remain standing for years.
To alleviate this problem, all trees with the worst general condition codes of severe injuries, dying or dead were removed from both the street tree population (1%) and forest tree population (10%). Trees within these general condition classes would likely be removed from street tree populations because of safety liabilities, whereas trees of lesser general conditions codes would not warrant removal. This selective population reduc- tion was only performed for urban vs. natural forest comparisons and was done to make these comparisons equitable.
2.5. URBAN STRATIFICATION
To understand differences within the street tree population, the urban/suburban area was divided into four zones: (1) CBD--centra l business district; (2) Ci ty-urban areas (exclusive of CBD) within Monterey pine's native range; (3) Forest--street trees within Monterey pine's native range but outside the urban areas (highly forested suburban/ exurban-type environment); and (4) Exterior--street trees outside Monterey pines native range (urban and suburban areas).
2.6. STATISTICS
Spearman's correlation was used to test for significant correlations among stress and environmental and biological variables. KruskaU-Wallis tests, with individual Wilcoxon
388 Monterey pine stress
ranks sum tests to separate the means, were used to test for differences between the urban and natural forest, and for differences among various categories within the urban and natural forest. Because of the multitude of tests, individual alpha levels were held quite small so that the combined overall alpha level for each test was approximately 0.05 (Bonferroni test).
3. Results
3.1. STRESS INDICES
The two stress indices (PCSTRS and STRESS) were strongly correlated ( r= 0.89). This strong correlation is not surprising considering all seven of the variables used to devise STRESS are included in the 10 variables used to make up PCSTRS. However general condition, the variable that gives a broad indication of tree stress, was not used in the derivation of STRESS. General condition was strongly correlated with STRESS (r=0.59) indicating that both STRESS and PCSTRS are measuring tree stress as we have defined it. General condition was also strongly correlated with PCSTRS (r = 0.71). In the following discussions, most stress comparisons will be made using the PCSTRS index.
3.2. URBAN AREAS
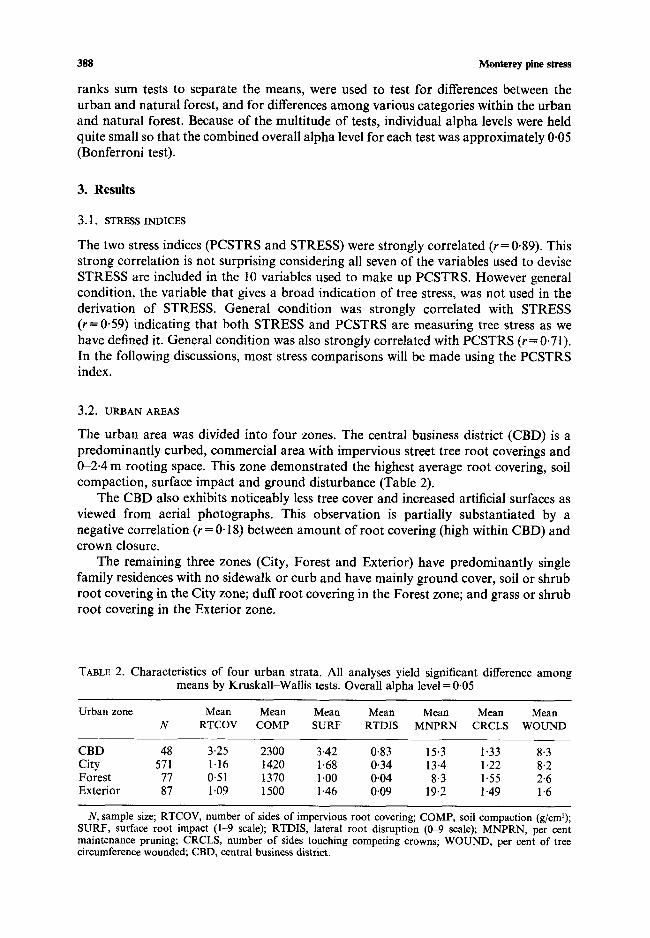
The urban area was divided into four zones. The central business district (CBD) is a predominantly curbed, commercial area with impervious street tree root coverings and 0-2.4 m rooting space. This zone demonstrated the highest average root covering, soil compaction, surface impact and ground disturbance (Table 2).
The CBD also exhibits noticeably less tree cover and increased artificial surfaces as viewed from aerial photographs. This observation is partially substantiated by a negative correlation (r--0-18) between amount of root covering (high within CBD) and crown closure.
The remaining three zones (City, Forest and Exterior) have predominantly single family residences with no sidewalk or curb and have mainly ground cover, soil or shrub root covering in the City zone; duff root covering in the Forest zone; and grass or shrub root covering in the Exterior zone.
TABLE 2. Characteristics of four urban strata. All analyses yield significant difference among means by Kruskall-Wallis tests. Overall alpha level = 0-05
Urban zone Mean Mean Mean Mean Mean Mean Mean N R T C O V COMP SURF RTDIS MNPRN CRCLS WOUND
CBD 48 3-25 2300 3.42 0.83 15.3 1.33 8-3 City 571 1.16 1420 1.68 0.34 13.4 1.22 8.2 Forest 77 0.51 1370 1.00 0.04 8.3 1.55 2.6 Exterior 87 1.09 1500 1.46 0.09 19-2 1-49 1.6
N, sample size; RTCOV, number of sides of impervious root covering; COMP, soil compaction (g/cm2); SURF, surface root impact 0-9 scale); RTDIS, lateral root disruption (0-9 scale); MNPRN, per cent maintenance pruning; CRCLS, number of sides touching competing crowns; WOUND, per cent of tree circumference wounded; CBD, central business district.
D. J. Nowak and J. R. McBride 389
T h e F o r e s t ( s u b u r b a n - t y p e ) z o n e a v e r a g e d t h e l ea s t a m o u n t o f m a i n t e n a n c e p r u n i n g ,
r o o t c o v e r i n g , soi l c o m p a c t i o n , s u r f a c e i m p a c t a n d g r o u n d d i s t u r b a n c e ( T a b l e 2). T h e
F o r e s t a n d E x t e r i o r z o n e s e x h i b i t e d t h e m o s t c r o w n c l o s u r e a n d l ea s t a m o u n t o f
w o u n d i n g .
T h e a m o u n t o f r o o t c o v e r i n g , so i l c o m p a c t i o n , s u r f a c e i m p a c t , m a i n t e n a n c e p r u n i n g
a n d g r o u n d d i s t u r b a n c e a r e g e n e r a l l y p o s i t i v e l y c o r r e l a t e d a m o n g t h e m s e l v e s a n d
n e g a t i v e l y c o r r e l a t e d w i t h d i s t a n c e to r o a d ( T a b l e 3). T h e s e v a r i a b l e s g e n e r a l l y i n c r e a s e
( d i s t a n c e to r o a d d e c r e a s e s ) as o n e ge ts c l o s e r to t h e o c e a n , r e f l ec t i ng t h e f a c t t h a t t h e
C B D g e n e r a l l y r a t e d h i g h in al l t h e s e v a r i a b l e s a n d is r e l a t i v e l y c lose t o t h e o c e a n .
3.3. URBAN VERSUS NATURAL FOREST AREAS
I n c o m p a r i s o n w i t h f o r e s t t r ees , t h e u r b a n t r ees a v e r a g e d s i g n i f i c a n t l y m o r e w o u n d i n g
(6.7 vs. 5 . 9 % ) , s m a l l d e a d l i m b s (11.5 vs. 10 -1%) , n e e d l e r e t e n t i o n (2 .4 vs. 2 .2 yea r s ) ;
s i g n i f i c a n t l y l a r g e r d i a m e t e r s (50-7 vs. 37 .9 c m ) a n d s m a l l e r h e i g h t s (9-4 vs. 11-5 m) ; a n d
e x p e r i e n c e d g r e a t e r soi l c o m p a c t i o n (1480 vs. 750 g/cm2).
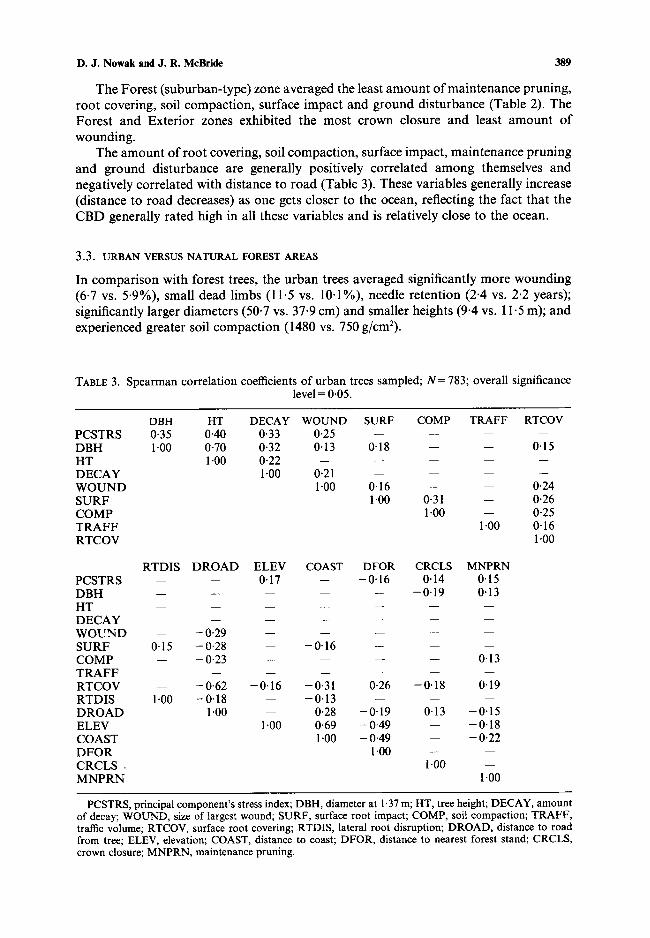
TABLE 3. Spea rman corre la t ion coefficients of u r b a n trees sampled; N = 783; overall significance level = 0'05.
DBH HT DECAY WOUND SURF COMP TRAFF RTCOV P C S T R S 0'35 0-40 0'33 0"25 . . . . D B H 1-00 0-70 0"32 0-13 0"18 - - - - 0"15 H T 1-00 0-22 . . . . . D E C A Y 1"00 0"21 . . . . W O U N D 1"00 0-16 - - - - 0"24 S U R F 1"00 0"31 - - 0"26 C O M P 1 "00 - - 0-25 T R A F F 1"00 0-16 R T C O V 1 "00
R T D I S D R O A D E L E V COAST DFOR CRCLS MNPRN P C S T R S - - - - 0.17 - - - 0 . 1 6 0.14 0.15 D B H . . . . . . 0-19 0.13 H T . . . . . . . D E C A Y . . . . . . . W O U N D - - - 0-29 . . . . . S U R F 0.15 - 0 . 2 8 - - - 0 - 1 6 - - - - - - C O M P - - - 0 . 2 3 . . . . 0.13 T R A F F . . . . . . . R T C O V - - - 0 - 6 2 - 0 . 1 6 - 0 . 3 1 0-26 - 0 . 1 8 0.19 R T D I S 1.00 - 0 - 1 8 - - - 0 . 1 3 - - - - - - D R O A D 1.00 - - 0.28 - 0 - 1 9 0.13 - 0 . 1 5 E L E V 1.00 0.69 - 0 - 4 9 - - - 0 . 1 8 C O A S T 1.00 - 0.49 - - - 0.22 D F O R 1-00 - - - - C R C L S . 1.00 - - M N P R N 1.00
PCSTRS, principal component's stress index; DBH, diameter at 1.37 m; HT, tree height; DECAY, amount of decay; WOUND, size of largest wound; SURF, surface root impact; COMP, soil compaction; TRAFF, traffic volume; RTCOV, surface root covering; RTDIS, lateral root disruption; DROAD, distance to road from tree; ELEV, elevation; COAST, distance to coast; DFOR, distance to nearest forest stand; CRCLS, crown closure; MNPRN, maintenance pruning.

390 Monterey pine stress
The forest trees averaged significantly more stress (0.23 vs. 0.18 PCSTRS and 0" 84 vs. 0-71 STRESS ), crown closure (2.0 vs. 1-3 sides), large dead limbs (18.5 vs. 5.8%) and natural pruning (33.7 vs. 25.2%); and significantly worse ratings of foliage (0.42 vs. 0.27), trunk (0-82 vs. 0.51) and general (0.66 vs. 0-36) condition codes, decay (0.38 vs. 0.34), foliage color (1.5 vs 1.4) and crown shape (2-6 vs. 2.1). There was no difference in crown ratio between forest and urban trees.
Similar results of urban vs. forest tree comparisons were found when analysed within crown closure classes (0, 1-2, and 3-4 sides). However, most significant differences were limited to the 1-2 sides class because of its preponderance of the sample (70%).
Considering that the forest and urban tree samples had differing diameter distribu- tions, further urban/forest comparisons were made by 20 cm diameter classes. PCSTRS was significantly higher for forest trees 10-30 cm (0-22 vs. 0.13) and 30-50 cm (0-24 vs. 0" 18). Forest and urban trees in diameter classes greater than 50 cm showed no difference in PCSTRS (0.22 vs. 0.21).
Forest trees exhibited significantly greater height in every diameter class and greater crown closure and large dead limbs in every class except 90 + cm. Forest trees also had the most natural pruning for diameter classes less than 70 cm and small dead limbs for trees 10-30 cm.
Urban trees had more needle retention for trees less than 50 cm; a greater crown ratio for trees 30.50 cm; more wounding for trees 50-70 cm; and more small dead limbs for trees 70-90 cm. No significant difference was exhibited in amount of decay for any diameter class.
3.4. U R B A N TREE STRESS
Urban tree stress was positively correlated with decay, wounds, diameter, height, elevation, crown closure and maintenance pruning; but was negatively correlated with distance to nearest forest stand (Table 3).
Stress also differed significantly by adjacent use, city zone, strip width, curbing and type of root covering (Table 4). Trees on vacant lots (wild or natural areas) generally exhibited the most stress while trees adjacent to apartments (mostly in the CBD) exhibited the least (Table 4). The CBD had significantly less stressed trees than the City strata. This difference was due to differences in diameter distributions with the CBD exhibiting more trees less than 50 cm than the City zone (65 vs. 52%).
No significant difference in PCSTRS was found among the zones when analysed by broad diameter classes (10-50 cm and 50+ cm). However, the CBD still averaged the lowest PCSTRS for both diameter classes (10-50cm: CBD=0.14 , City=0.17, Forest=0.17, Exterior=0.16; 50+ cm: CBD=0-18, City=0.21, Forest=0.22, Exterior = 0.22).
Curbed trees exhibited less stress than non-curbed trees but most curbed trees are found within the CBD with its relatively small diameter trees. Urban trees with a shrub understorey were also generally the most stressed (Table 4).
Decay and wounding were positively correlated and positively related to diameter. Crown closure was negatively correlated with diameter but positively correlated with distance from road (Table 4).
3.5. N A T U R A L FOREST TREE STRESS
Forest stress was only positively correlated with elevation (r = 0.22). Trees within the

D. J. Nowak and J. R. McBride 391
TABLE 4. Individual Wilcoxon rank sum tests to test for differences in PCSTRS by various categories of data. All categories show significant difference among means at overall alpha = 0.05
(Kruskall-Wallis test)
Adjacent use N Mean Sign. City zone N Mean Sign.
Single family 652 0.193 A CBD 48 0' 151 Apartment 9 0.079 AB City 571 0.194 Institutional 23 0-147 C Forest 77 0' 174 Commercial 48 0" 149 D Exterior 87 0-196 Parking 5 0-218 Vacant 46 0.222 BCD
Strip width N Mean Sign. Curbing N Mean
A A
Sign.
0-1'2 m 58 0"167 No 675 0"193 A 1.2-2"4 m 21 0-127 Yes 108 0.165 A >2.4 m 4 0.184 No sidewalk 678 0.195 Past sidewalk 22 0-137
Urban covertype N Mean Sign. Canopy position N Mean Sign.
Hard covert 40 0-145 AB Co/dominant:~ 239 0.266 A Duff 138 0.175 C Intermediate 104 0.234 B Grass 104 0"192 Suppressed 135 0.342 AB Ground cover 183 0.179 D Young-open 40 0" 140 AB Soil 160 0' 198 A Shrubs 158 0.214 BCD
t Brick, concrete or stone covering. $ Co-dominant and dominant trees. Sign., category means with the same letter are significantly different at overall significance level of 0.05.
Forest zone are found at the same elevation as natural forest trees, but still exhibited significantly less P C S T R S for trees less than 50 cm (0.17 vs. 0.23). Elevat ion and distance f rom the coast were strongly correlated ( r=0 .58 ) but were uncorre la ted with distance f rom urban areas because regardless o f where forest plots were located, they were in close proximity to housing in the Forest zone.
A significant difference in stress was found a m o n g trees based on canopy posi t ion (Table 4) but not by aspect o r roo t covertype. Suppressed trees exhibited the mos t stress, followed by co -dominan t /dominan t and intermediate, then y o u n g - o p e n trees (small diameter trees with little c rown competi t ion). N o significant difference was found between co-dominan t and intermediate trees.
Decay was positively correlated with wound ing (r = 0.18), diameter ( r - -0 .26) and height (r = 0.18). Diameter and height were positively correlated (r = 0.77). Plot density (all species) was positively correlated with distance f rom nearest u rban / suburban area (r--0.39) and negatively correlated with diameter ( r = -0 .31 ) .
4. D i s c u s s i o n
4.1. STRESS
The general and principal componen t stress indices were very similar. STRESS proved

392 Monterey pine stress
better for determining dead trees because all dead trees have a singular index score of 1. PCSTRS was preferred for an overall stress index because it utilizes the various components which comprise the tree's visual stress symptoms, rather tha~n using just relative foliage volume and color.
Of the three components that adequately described visual stress, the general condition component, comprised of the subjective condition ratings which were most strongly correlated with needle loss, foliage color and large dead limbs, is the best single descriptor of visual stress. Other components that added further information about tree stress were the amount of limbs lost and amount of small dead limbs.
Considering that PCSTRS's strongest component is general condition, and that STRESS was also strongly correlated with general condition ( r= 0-59), it appears that the general condition codes are adequate for a quick, broad, subjective measurement of stress. This type of measurement could be easily, and likely is, used by urban foresters. For more refined and less subjective measures of stress, the stress indices are more useful.
Stress generally increases with tree size due to increased internal shading of branches and loss of shade tolerance associated with aging (Roy, 1966; Kozlowski, 1979). This increased shading effect is sufficient to increase the stress levels of large urban trees to levels comparable to forest trees. Forest tree stress does not increase with tree size because of increased plant competition on small trees. Most small forest trees are suppressed, while most (94%) large forest trees are co-dominant or dominant in canopy position, and are thus under less light competition than more suppressed smaller trees.
4.2. URBAN AREAS
There is a general gradation from a more urban environment to a more forest-like environment as one proceeds uphill, away from the ocean in Carmel (i.e. CBD to City to Forest zones). The more forest-like areas are typified by increased vacant lots and duff and shrub understorey, while the CBD has predominantly hard, impervious root coverings. In general, the more forest-like the urban environment, the more stress can be expected.
The CBD appeared the least stressful due to its predominance of small diameter trees. There is a combination of three probable reasons why the CBD contains smaller trees. First, this downtown area was originally planted from 1900-1920, but further large scale plantings were not done until the 1970s when Carmel recruited an official forestry staff. The rest of the city was planted throughout the twentieth century as the city developed. Second, most of the CBD has a confined growing space and the trees may not attain great size. Finally, removal rates may be significantly higher in this area of concentrated urban activity.
The more open environment of the CBD also appears to influence stress. The CBD averaged lower stress levels than the other urban zones for both broad diameter classes (10-50 cm and 50+ cm). This difference indicates the more open environment of the CBD may reduce stress levels.
However, with the high concentration of activity in the CBD, trees in this area tend to be more vulnerable to mortality and are noted to exhibit more wounding (Kelly, pers. comm., 1988). The noted increase in wounding may cause a more drastic type of injury that requires tree removal, whereas most wounds noted in this study are more subtle injuries not usually necessitating tree removal. Therefore, even though the CBD has lower stress levels, it may have increased mortality rates.
D. J. Nowak and J. R. McBride 393
4.3. URBAN VERSUS NATURAL FOREST AREAS
In the forest environment, trees in highly competitive canopy positions (suppressed) exhibit the highest stress levels. Along with canopy position, elevation influenced stress. Forest tree stress increased with elevation, indicating possible thin soils on upper ridges or increased moisture stress, though the higher elevations of the natural forest generally show the greatest amount of fog drip (McDonald, 1957). Urban trees of equal elevation showed reduced stress for trees less than 50 cm in diameter.
Differences in urban and natural forest structure appear to be the key reason for many of the differences exhibited in this study. Crown closure (number of live crown sides touching other crowns) was significantly higher in the forested environment, but even when adjusting for this difference with street trees, the forest trees still likely endure greater competition for light, nutrients and water.
Due to increased competition from surrounding plants for light, nutrients and water, smaller diameter forest trees, which are often in suppressed canopy positions (52% of trees < 30 cm), are under more stress than comparable urban trees. The linear array of street trees is generally under less direct plant competition because of increased amounts of artificial surfaces in the urban environment. Maintenance activities of watering and fertilization, which are performed on trees in Carmel for the first 2 years of establishment (Kelly, pers. comm., 1988), and may be additionally supplemented by homeowners, will also decrease stress levels in the urban environment.
Anthropogenic factors in the urban environment influence various components of the urban forest. The increased concentration of people and activity increases surface soil compaction around the tree. Soil compaction was not increased enough in this study to impact significantly visual tree stress. The amount of wounding also increased from such factors as vandalism and automobiles. Amount of decay was decreased within urban areas, most likely because of a decrease in innoculum through the selective removal of hazardous decayed trees. The more open and maintained urban environment also expressed itself in shorter street trees in relation to comparable forest trees.
Maintenance activities of pruning decrease the crown ratio, but, even with pruning, urban tree crown ratios were not significantly different from forest trees. Increased competition among forest trees and lack of maintenance pruning led to more live crown lost due to large dead limbs, small dead limbs, and natural pruning (62%) than urban trees (43%). Stand density has also been shown to determine the length of green crowns (Lindsay, 1932).
Maintenance pruning of dead branches will not affect the STRESS index and only affects the PCSTRS index by changing the stress symptoms. Maintenance pruning of dead limbs will reduce the amount of large and small dead limbs, but will increase the dead crown ratio and worsen the crown shape rating. Maintenance pruning of live limbs will increase STRESS by reducing the amount of leaf volume and will increase PCSTRS by increasing the dead crown ratio and worsening the crown shape rating.
4.4. MANAGEMENT IMPLICATIONS
The differences in tree stress between adjacent urban and natural forest ecosystems documented in this study have implications for the management of both systems. Management implications discussed here will be directed toward minimizing adverse effects of the input-output relationships between the two ecosystems, as well as recommendations to reduce tree stress in each forest ecosystem.

394 Monterey pine stress
The primary input-output relationship of concern to the management of the urban forest in Carmel is the output of insects and pathogens from the natural forest ecosystem. The natural forest ecosystem, with its increased tree stress and number of dying and dead trees, may allow stress-related insect and disease populations to build up and act as a reservoir of insects and/or innoculum to invade urban areas. Even though street trees are less stressed, mass attacks by bark beetles can kill even healthy trees (Smith, 1961).
Of particular concern to Monterey pine management is the red turpentine beetle (Dendroctonus valens). This insect reached epidemic proportions in plantations of Monterey pine adjacent to Orinda, California in 1976 and spread into the city, killing a large number of Monterey pine street trees in the following year (Dahlsten, pers. comm., 1978).
Thinning out moderately to severely stressed, dying and dead trees in an adjacent forest ecosystem could decrease stress-related insect and disease problems in urban areas. Likewise, management of the urban forest to minimize tree stress could reduce the chances of the urban forest ecosystem exporting insects and pathogens to the natural forest ecosystem. Maintaining the open character of the urban forest with younger age classes of trees could help insure lower levels of tree stress in the urban environment. Future studies are needed to understand better urban-natural forest insect and disease relationships.
A second input-output relationship of significance to the management of the natural forest ecosystem adjacent to Carmel is the use of the natural forest ecosystem for recreation by the residents of Carmel. Portions of the adjacent natural forest are within city and county parks and open spaces. Stressed trees in these forests are often characterized by dead limbs and weak root systems. Such trees present a safety hazard to recreationalists. Managers of natural forest parks and open spaces must recognize the link between tree stress and hazard. Management programs to reduce existing hazardous trees and promote the reduction of future tree stress are called for.
Tree stress within each forest type (urban and natural) has implications for future development of forest stands and management activities. The increased stress of small trees within the forest stands will likely lead to increased early mortality rates. Mortality is often hastened in stressed trees due to attacks by secondary agents (Houston, 1984). If optimal forest regeneration is desired, regeneration survival and growth rates are likely to be increased by thinning the forest stand and reducing competition with these young trees. Monterey pine roots and tops develop best when seedlings get full light (Roy, 1966).
Management of an urban tree population toward a more dosed forest-like environ- ment is conducive to increased tree stress. This increased stress may lead to higher mortality rates and increased incidences of stress-related insects and diseases in these areas.
5. Conclusion
The change in forest structure due to urbanization appears to significantly impact tree stress. Small diameter forest-grown Monterey pine are more stressed than comparable street trees, most likely because of increased competition for light, water and nutrients with surrounding vegetation. No difference in stress exists for larger diameter trees because, even though street trees are under less external competition, urban tree stress increases with diameter due to internal crown competition and loss of shade tolerance
D. J. Nowak and J. R. McBride 395
associated with aging, to eventually equal the stress levels exhibited by forest trees of all diameters. Urban forest maintenance activities of watering and fertilization have also reduced stress by reducing competition. Therefore, even though Carmel's street trees have been subject to different stresses than forest-grown trees, these stresses are not as important for inducing overall forest stress as plant competition.
Our study only examined Monterey pine in and around Carmel. If a tree species silvicultural attributes are significantly different from Monterey pine, and/or if a small urban area's physical environment significantly differs from that of Carmel, the stress relations between urban and natural forests may change. The amount of change based on tree species or environment is unknown and future studies need to analyse how these attributes influence urban and natural forest stress.
Our study also only examined more subtle type stresses or recently occurred drastic stresses. Most drastic stresses will necessitate tree removal. Therefore, to obtain a better understanding of stress in the urban or natural forest environment, more long-term studies are needed that assess not only stress factors, but how these factors influence mortality, life span and the input-output relationships between urban and natural forest ecosystems. Our study examined a small urban area and its adjacent natural forest. Future work is needed to look at larger urban forest ecosystems with their characteristic problems associated with increased human population densities and pollution.
We wish to thank the City of Carmel, especially their City Forester--Gary Kelly, for his assistance throughout this study. We also wish to thank Drs Wayne Zipperer, Gerald Walton and Richard Pouyat for their insightful reviews of earlier drafts of this manuscript.
References
Comrey, A. L. (1973). A First Course in Factor Analysis, p. 233. New York: Academic Press. D'Ambrosio, G. (1974). Carmel's computerized trees. Arborist's News 39, 150-152. Donley, M. W., Allan, S., Caro, P. and Patton, C. P. (Compilers). (1979). Atlas of California, p. 17. Culver
City, California: Pacific Book Center. Fay, J. S., Lipow, A. G. and Fay, S. W. (eds). (1987). California Almanac, pp. 1-21. Santa Barbara, California:
Pacific Data Resources. Fowells, H. A. (1965). Silvics of Forest Trees of the United States, pp. 390-397. U.S. Department of Agriculture
Forest Service, Agricultural Handbook No. 271. Hale, M. G. and Orcutt, D. M. (1987). The Physiology of Plants under Stress. New York: John Wiley and Sons. Houston, D. R. (1984). Stress related to diseases. Arboricultural Journal 8, 137-149. Kozlowski, T. T. (1979). Tree Growth and Environmental Stress. Seattle, Washington: University of
Washington Press. Lillesand T. M., Manion, P. D. and Eav, B. B. (1978). Quantification of Urban Tree Stress through
Microdensitometric Analysis of Aerial Photography. Syracuse, New York: SUNY College of Environmen- tal Science and Forestry.
Lillesand, T. M., Eav, B. B. and Manion, P. D. (1979). Quantifying urban tree stress through microdensito- metric analysis of aerial photography. Photogrammetric Engineering and Remote Sensing 45, 1401-1410.
Lindsay, A. D. (1932). Report on Monterey pine (Pinus radiata D. Don) in its native habitat. Commonwealth (Australia) Forestry Bureau Bulletin 10.
McDonald, J. B. (1957). An ecological study of Monterey pine in Monterey County, California. MS Thesis, University of California, Berkeley, California.
National Oceanic and Atmospheric Administration. (1986). Climatological Data Annual Summary, California 1986. Vol. 90, No. 13. Asheville, North Carolina: Department of Commerce.
Roy, D. F. (1966). Silvical Characteristics of Monterey Pine (Pinus radiata D. Don). U.S. Forest Service Research Paper PSW-31.
Smith, R. H. (1961). Red Turpentine Beetle. Forest Pest Leaflet No. 55. Washington, D.C.: U.S. Department of Agriculture.