Comparison of micro gas turbine heat recovery systems ... · PDF fileMGT exhaust gas heat ......
21
ORC 2017, September 13-15, Milano, Italy Thermal Power System Lab Comparison of micro gas turbine heat recovery systems using ORC and trans - critical CO 2 cycle focusing on off - design performance Suk Young Yoon, Min Jae Kim, In Seop Kim Graduate School, Inha University, Korea Tong Seop Kim* Dept. of Mechanical Engineering, Inha University, Korea IV International Seminar on ORC Power Systems September 13-15, 2017
Transcript of Comparison of micro gas turbine heat recovery systems ... · PDF fileMGT exhaust gas heat ......

ORC 2017, September 13-15, Milano, Italy
Thermal Power
System Lab
Comparison of micro gas turbine heat recovery
systems using ORC and trans-critical CO2 cycle
focusing on off-design performance
Suk Young Yoon, Min Jae Kim, In Seop Kim
Graduate School, Inha University, Korea
Tong Seop Kim*
Dept. of Mechanical Engineering, Inha University, Korea
IV International Seminar on ORC Power Systems
September 13-15, 2017
ORC 2017, September 13-15, Milano, Italy
Thermal Power
System LabContents
▪ Introduction
▪ System modeling
▪ Results
▪ Conclusion
2
ORC 2017, September 13-15, Milano, Italy
Thermal Power
System Lab
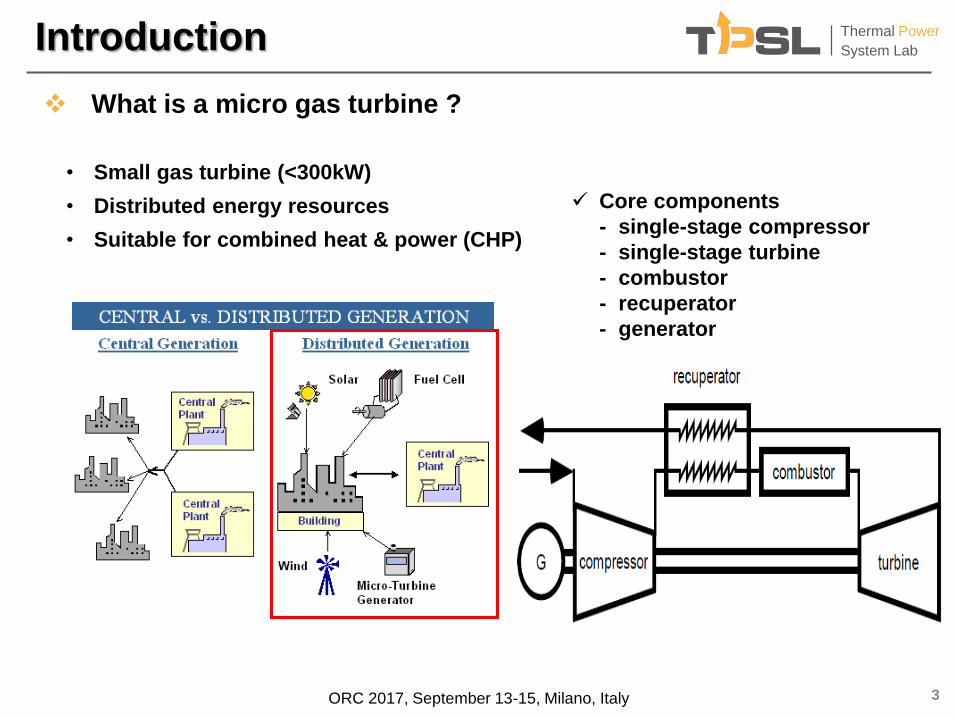
❖ What is a micro gas turbine ?
Introduction
• Small gas turbine (<300kW)
• Distributed energy resources
• Suitable for combined heat & power (CHP)
✓ Core components
- single-stage compressor
- single-stage turbine
- combustor
- recuperator
- generator
3

ORC 2017, September 13-15, Milano, Italy
Thermal Power
System Lab
❖ MGT exhaust gas heat recovery
Introduction
Component Parameter Value
CompressorPressure ratio [-] 3.6
Efficiency [%] 79.0
TurbineInlet temperature [oC] 828.1
Efficiency [%] 84.0
Recuperator
Gas outlet temperature [oC] 276.7
Gas outlet mass flow [kg/s] 0.31
PerformanceSystem power [kW] 28.0
Efficiency [%] 24.0
• Capstone C30
▪ The engine exhausts high temperature gas (276.7oC)
▪ Generally, the exhaust gas is used to satisfy the heat demandbut wasted when there is no heat demand
Possibility : supplementary power by adding a bottoming cycle
4
▲ Performance of Capstone C30 ▲ Capstone C30

ORC 2017, September 13-15, Milano, Italy
Thermal Power
System Lab
❖ Importance of off-design performance
▪ Increasing penetration of renewable energy
Introduction
▪ Impact of renewable energy sources
• Strong imbalance between demand &supply
• The other generators in the grid system including the MGT will operate at partial loads during a lot of their operating time.
Off-design performance of MGT/bottoming cycle package is Important
▲ Net load(normal load-renewable power generation) at California
5

ORC 2017, September 13-15, Milano, Italy
Thermal Power
System Lab
▪ Comparison between ORC and tCO2 is focused on low temperature applications
• Low grade heat recovery (<160oC)Li et al. “Thermodynamic analysis and comparison between CO2 transcritical power cycles and R245fa organic Rankine cycles for
low grade heat to power energy conversion”, Applied Thermal Engineering, August 2016
• Waste heat recovery from sCO2 cycle (~120oC)Wang et al. “Exergoeconomic analysis of utilizing the transcritical CO2 cycle and the ORC for a recompression supercritical CO2
cycle waste heat recovery: A comparative study”, Applied Energy, May 2016
▪ Most of the works are interested in design performance only.
▪ Selection of working fluid for High temperature heat source
• For recuperated GT exhaust gas heat (>350oC) (Toluene)Cao et al. “Optimum design and thermodynamic analysis of a gas turbine and ORC combined cycle with recuperators”,Energy
Conversion and Management, May 2016
• For externally fired GT exhaust gas heat(400oC) (Toluene)Camporeale et al. “Cycle configuration analysis and techno-economic sensitivity of biomass externally fired gas turbine with
Bottoming ORC” ,Energy Conversion and Management, November 2015
Introduction
6
❖ Previous works
Manufacturer Model namePower
outputWorking fluid
Heat source
temp.
Low
temp.
Electratherm Green machine 6500 > 110 R245fa 77-116
GE Clean energy 125 R245fa 121
High
temp.
Turboden TD 6 HR 600 Silicon oil 270
Triogen WB-1 170 Power 165 Toluene 350-530
▲ Specifications of commercial ORC
ORC 2017, September 13-15, Milano, Italy
Thermal Power
System Lab
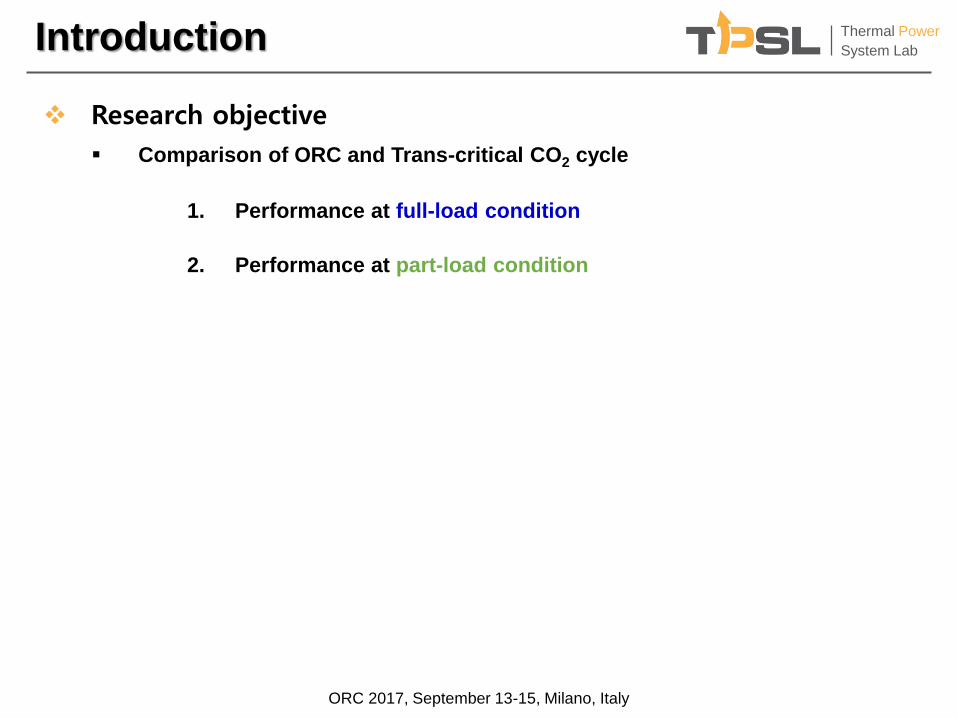
❖ Research objective
▪ Comparison of ORC and Trans-critical CO2 cycle
1. Performance at full-load condition
2. Performance at part-load condition
Introduction

ORC 2017, September 13-15, Milano, Italy
Thermal Power
System LabSystem modeling
❖ Design Modeling
▪ Organic Rankine Cycle
HRU
Turbine Generator
Condenser
Pump
Water
MGT
exhaust gas
(8)
Exhaust
(9)
1
24
5
T : 275.8 oC
m : 0.3089 kg/s
• Exhaust gas temperature : 100oC
• Working fluid : Toluene
• Turbine / pump efficiency : 85% / 85%
• Pinch point temperature difference in HRU : 4℃
• Condensation temperature : 25℃ (3.8 kPa)
• Turbine inlet is at saturated vapor
• Turbine inlet pressure is determined to maximize power output 6.1bar
(PR ~ 160)8
▲ T-S diagram of ORC ▲ Configuration of ORC
0
50
100
150
200
250
300
350
-1 -0.5 0 0.5 1 1.5
Tem
pe
ratu
re(o
C)
Entropy(kJ/kgK)
1
2
34
5
6
8
9

ORC 2017, September 13-15, Milano, Italy
Thermal Power
System LabSystem modeling
❖ Design Modeling
▪ Trans-critical CO2 Cycle
HRU
TurbineGenerator
MGT
exhaust gas
(8)
Exhaust
(9)
Recuperator
Condenser
Water
Pump
1
2
3
5
6
7
9
▲ T-S diagram of tCO2 ▲ Configuration of tCO2
• Working fluid : Carbon dioxide
• Turbine / pump efficiency : 85% / 85%
• Pinch point temperature difference in HRU : 4℃
• Condensation temperature : 25℃ (6,470 kPa)
• A regenerator is added to increase mass flow of CO2 larger tCO2 cycle power
• Turbine inlet pressure is determined to maximize power output 235.3 bar
(PR ~ 3.6)
0
50
100
150
200
250
300
350
0.8 1 1.2 1.4 1.6 1.8 2 2.2 2.4
Regenerative cycleSimple cycle
Te
mp
era
ture
(oC
) 1
2
345
6
7
8
9
Entropy(kJ/kgK)
9'

ORC 2017, September 13-15, Milano, Italy
Thermal Power
System LabSystem modeling
❖ Off-design Modeling
▪ Part load data of MGT : exhaust gas flow and temp.
– C30 simulation data1)
10
0.18
0.20
0.22
0.24
0.26
0.28
0.30
0.32
210
220
230
240
250
260
270
280
40 50 60 70 80 90 100
MGT mass flow rate [kg/s]MGT exhaust temperature [
oC]
MG
T m
as
s f
low
rate
[k
g/s
]
MG
T e
xh
au
st te
mp
era
ture
[ oC]
MGT load fraction [%]
▲ Mass flow rate and exhaust temperature variation of MGT with MGT load fraction
1) Min Jae Kim, Jeong Ho Kim, Tong Seop Kim, (2016). Program development and
simulation of dynamic operation of micro gas turbines, Applied Thermal Engineering,
Vol. 108, 2016, pp. 122-130.
Compressor map
Turbine map

ORC 2017, September 13-15, Milano, Italy
Thermal Power
System LabSystem modeling
❖ Off-design Modeling
▪ Heat exchanger
( ) , design designUA
Design
▶ Effectiveness-NTU method
, ,
, ,
Effectiveness : h i h o
h i c i
T T
T T
min
max
1 1Number of transfer unit : ln , where
1 1r
min r r
UA CNTU C
C C C C
0.8
( ) ( )off
off design
design
mUA UA
m
1 exp[ ( ) (1 )]
1 exp[ ( ) (1 )]
off r
off
r off r
NTU C
C NTU C
( )( )
off
off
min
UANTU
C
▶ Off-design analysis process
Off-design
11
▶ Number of segments
• tCO2 – single segment
• ORC – two segments (economizer(preheater)/evaporator)

ORC 2017, September 13-15, Milano, Italy
Thermal Power
System LabSystem modeling
❖ Off-design Modeling
▪ Turbine
, design designY
▶ Stodola’s ellipse
, ,
,
Flow coefficient : in design in design
design
in design
m T
P
2 2
, ,
2 2
,
Stodola's constant : in design out design
design
in design design
P PY
P
▶ Off-design analysis process
, ,
,
.off design
in off in off
off
in off
Y Y const
m T
P
2 2
, , , ,in off in off in off design out offP m T Y P
Design Off-design
12
▶ Turbine efficiency correction2)
0.1
, ,
, ,
sin 0.5in off in design
off design
in design in off
m
m
2) Keeley KR. A theoretical investigation of the part-load characteristics of LP steam turbine stages. CEGB memorandum
RD/L/ES0817/M88. Central Electrical Generating Board, UK; 1988.
ORC 2017, September 13-15, Milano, Italy
Thermal Power
System LabSystem modeling
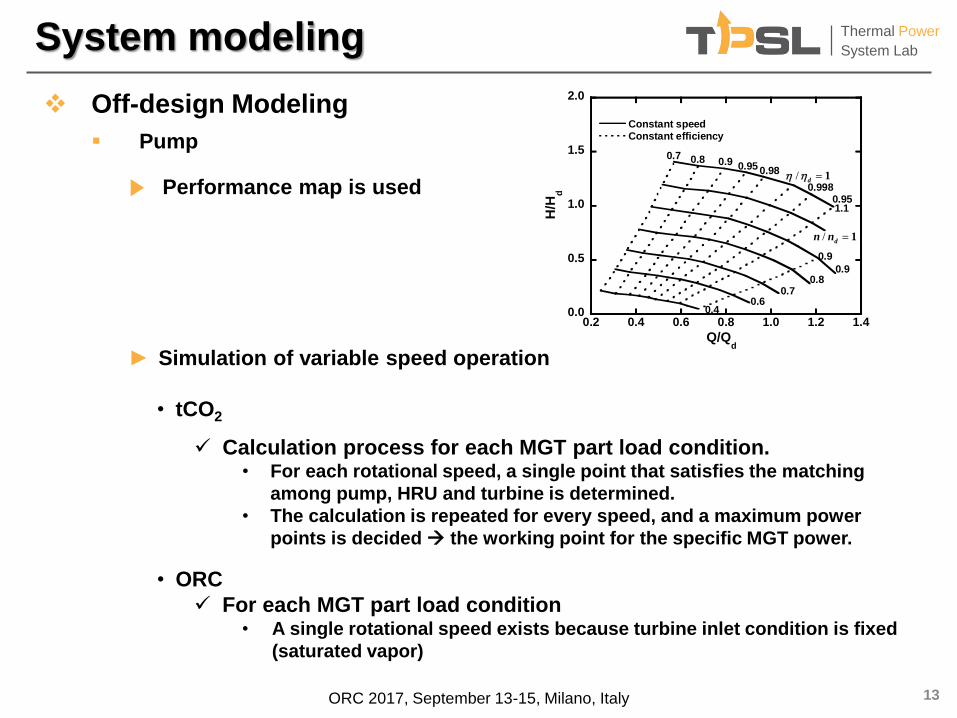
❖ Off-design Modeling
▪ Pump
▶ Performance map is used
Constant speed
H/H
d
Q/Qd
1.1
/ 1d
n n
0.90.8
0.70.6
0.4
0.7 0.8 0.9 0.95 0.98 / 1d
0.998
0.95
0.9
0.0
0.5
1.0
1.5
2.0
0.2 0.4 0.6 0.8 1.0 1.2 1.4
Constant efficiency
► Simulation of variable speed operation
• tCO2
✓ Calculation process for each MGT part load condition.• For each rotational speed, a single point that satisfies the matching
among pump, HRU and turbine is determined.
• The calculation is repeated for every speed, and a maximum power
points is decided the working point for the specific MGT power.
• ORC
✓ For each MGT part load condition• A single rotational speed exists because turbine inlet condition is fixed
(saturated vapor)
13

ORC 2017, September 13-15, Milano, Italy
Thermal Power
System LabSystem modeling
Design calculation Off-design calculation
Design performance
analysisOff-design calculation of MGT
Calculate turbine inlet pressure,
efficiency with Stodola’s equations
UA of heat exchanger
Off design
performance
No
Thermodynamic properties
of HRU Outlet
=Thermodynamic properties
of turbine inlet?
Assume :
Pump inlet mass flow
Calculate HRU’s outlet condition
(temperature)
Calculate pump outlet condition
with performance curve
Yes
❖ Performance analysis
▪ Simulation process
14
In Seop Kim, Tong Seop Kim, Jong Jun Lee, (2017).
Off-design performance analysis of organic Rankine
cycle using real operation data from a heat source
plant, Energy Conversion and Management, Vol. 133,
Issue 1, Feb. 2017, pp. 284-29.
• Modelling validation
ORC 2017, September 13-15, Milano, Italy
Thermal Power
System LabResults
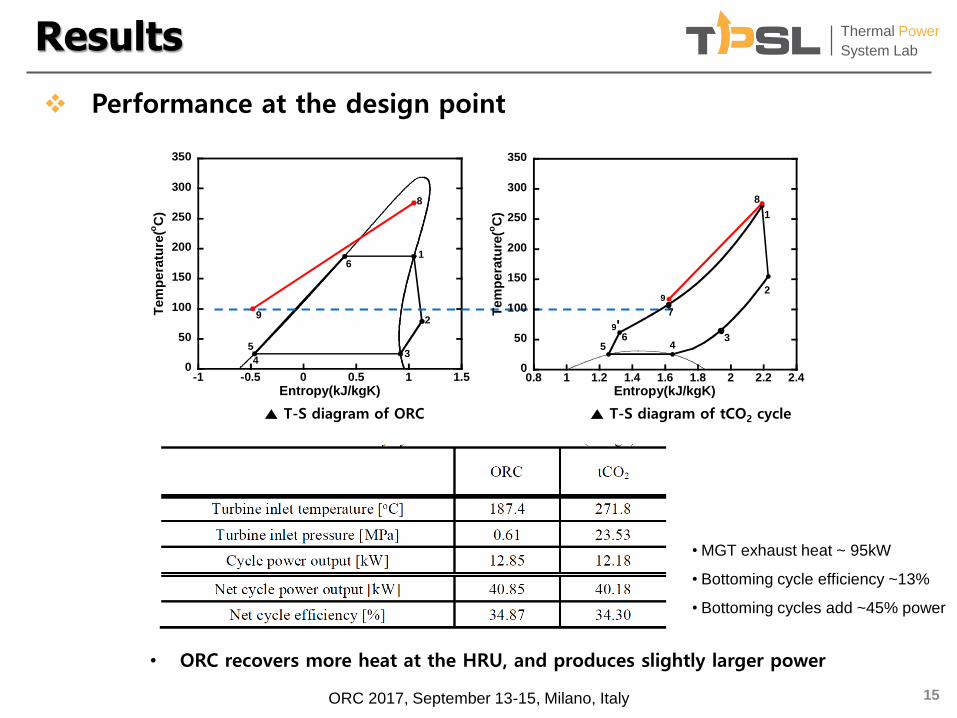
❖ Performance at the design point
0
50
100
150
200
250
300
350
-1 -0.5 0 0.5 1 1.5
Tem
pe
ratu
re(o
C)
Entropy(kJ/kgK)
1
2
34
5
6
8
9
▲ T-S diagram of ORC ▲ T-S diagram of tCO2 cycle
15
0
50
100
150
200
250
300
350
0.8 1 1.2 1.4 1.6 1.8 2 2.2 2.4
Tem
pera
ture
(oC
) 1
2
345
6
7
8
9
Entropy(kJ/kgK)
9'
• ORC recovers more heat at the HRU, and produces slightly larger power
• MGT exhaust heat ~ 95kW
• Bottoming cycle efficiency ~13%
• Bottoming cycles add ~45% power

ORC 2017, September 13-15, Milano, Italy
Thermal Power
System LabResults
❖ Performance at the off-design points
✓ General tendency
16
• MGT load fraction
MGT exhaust gas temp. & mass flow
Mass flow rate of the bottoming cycle
Turbine inlet pressure
Bottoming cycle power
0.4
0.5
0.6
0.7
0.8
0.9
1.0
40 50 60 70 80 90 100
PRoff/d
moff/d
RPMoff/d
Re
lati
ve
va
lue
[-]
MGT load fraction [%]
0.4
0.5
0.6
0.7
0.8
0.9
1.0
40 50 60 70 80 90 100
PRoff/d
moff/d
RPMoff/d
Re
lati
ve
va
lue
[-]
MGT load fraction [%]
▲ Variation of operating parameters of ORC
with MGT load fraction▲ Variation of operating parameters of tCO2
with MGT load fraction

ORC 2017, September 13-15, Milano, Italy
Thermal Power
System LabResults
▲ T-S diagram of ORC at 75% MGT load ▲ T-S diagram of tCO2 cycle at 75% MGT load
17
❖ Performance at the off-design points
✓ Comparison of operating point changes
▪ tCO2 shows a larger drop in the gas exit temperature (T9) at the HRU
0
50
100
150
200
250
300
350
-1 -0.5 0 0.5 1 1.5
Tem
pe
ratu
re(o
C)
Entropy(kJ/kgK)
1
2
34
5
6
8
9
8'
6' 1'
2'3'5'
4'
9'
0
50
100
150
200
250
300
350
0.8 1 1.2 1.4 1.6 1.8 2 2.2 2.4
Te
mp
era
ture
(oC
) 1
2
345
6
7
8
9
Entropy(kJ/kgK)
1''8''
9''
6''5''
4''
3''
2''

ORC 2017, September 13-15, Milano, Italy
Thermal Power
System Lab
• HRU exit gas temperature is reversed about at 75% MGT power
HRU heat recovery becomes larger for the tCO2 cycle
Results
80
85
90
95
100
105
110
115
40 50 60 70 80 90 100
ORC tCO
2
HR
U h
ot
sid
e o
utl
et
tem
pe
ratu
re [
oC
]
MGT load fraction [%]
18
❖ Performance at the off-design points
✓ Heat recovery performance
▲ HRU hot side outlet temperature

ORC 2017, September 13-15, Milano, Italy
Thermal Power
System Lab
• Power variation with MGT power is steeper for ORC
• Power production reversed about at 75% MGT power
Results
19
5.0
6.0
7.0
8.0
9.0
10.0
11.0
12.0
13.0
40 50 60 70 80 90 100
ORC power outouttCO
2 power output
Po
wer
ou
tpu
t [k
w]
MGT load fraction [%]
▲ Variation of power output of bottoming cycles with MGT load fraction
❖ Performance at the off-design points
✓ Bottoming cycle power

ORC 2017, September 13-15, Milano, Italy
Thermal Power
System LabConclusion
❖Design performance of an ORC using toluene and a recuperated tCO2 was compared: ORC produces slightly larger power (5.5%).
❖An operation simulation tool has been set up using off-design models for components (pump, HRU and turbine), and operation strategy was provided.
❖ The reduction rate of the heat recovery performance of the ORC is larger in comparison to tCO2; tCO2 produces more power in the MGT power range less than 75%.
❖A suitable system (ORC or tCO2) should be selected considering the operating environment (near full load or mostly at part loads).
20

ORC 2017, September 13-15, Milano, Italy
Thermal Power
System Lab
Thank you.
21