Automated Online Extraction and Chromatography with Supercritical Fluids

Ccs
DAS
a
ARRAA
KMdICUUC
1
hpM([
h0
Journal of Chromatography A, 1371 (2014) 244–256
Contents lists available at ScienceDirect
Journal of Chromatography A
jo ur nal ho me pag e: www.elsev ier .com/ locate /chroma
omparison of liquid chromatography and supercritical fluidhromatography coupled to compact single quadrupole masspectrometer for targeted in vitro metabolism assay
any Spaggiari, Florence Mehl, Vincent Desfontaine,lexandre Grand-Guillaume Perrenoud, Szabolcs Fekete, Serge Rudaz, Davy Guillarme ∗
chool of Pharmaceutical Sciences, University of Geneva, University of Lausanne, Boulevard d’Yvoy 20, 1211 Geneva 4, Switzerland
r t i c l e i n f o
rticle history:eceived 15 August 2014eceived in revised form 6 October 2014ccepted 19 October 2014vailable online 24 October 2014
eywords:S-supported automated method
evelopmentn vitro metabolismocktail approachHPLC–MSHPSFC–MSompact single quadrupole
a b s t r a c t
The goal of this study was to evaluate the combination of powerful chromatographic methods and com-pact single quadrupole MS device for simple in vitro cytochrome P450 (CYP) inhibition assay, insteadof more expensive triple quadrupole MS/MS detectors. For this purpose, two modern chromatographicapproaches (ultra-high pressure liquid chromatography (UHPLC) and ultra-high performance supercrit-ical fluid chromatography (UHPSFC)) were tested in combination with simple MS detector. To show theapplicability for an in vitro CYP-mediated metabolism assay using the cocktail approach, a method wasfirst developed in UHPLC–MS to separate a mixture of 8 probe substrates and 8 CYP-specific metabolites.A screening procedure was initially applied to determine the best combination of a column, an organicmodifier and a mobile-phase pH, followed by fine tuning of the conditions (i.e., gradient profile, temper-ature and pH) using HPLC modelling software. A similar sequential method development procedure wasalso evaluated for UHPSFC–MS. For method development, where peak tracking is necessary, the use ofsingle quadrupole MS was found to be extremely valuable for following the investigated analytes. Ulti-mately, a baseline separation of the 16 compounds was achieved in both UHPLC–MS and UHPSFC–MSwith an analysis time of less than 7 min. In a second series of experiments, sensitivity was evaluated,and LOQ values were between 2 and 100 ng/mL in UHPLC–MS, while they ranged from 2 to 200 ng/mLin UHPSFC–MS. Based on the concentrations employed for the current in vitro phase I metabolism assay,these LOQ values were appropriate for this type of application. Finally, the two analytical methods wereapplied to in vitro CYP-dependent metabolism testing. Two well-known phytochemical inhibitors, yohim-bine and resveratrol, were investigated, and reliable conclusions were drawn from these experiments
with both UHPLC–MS and UHPSFC–MS. At the end, the proposed strategy of optimized chromatographycombined with simple MS device has been shown to potentially compete with the widely used combi-nation of generic chromatography and highly selective MS/MS device for simple in vitro CYP inhibitionassays. In addition, our analytical method may be easier to use in a routine environment; the instrumentcost is significantly reduced and the two developed methods fit for purpose.© 2014 Elsevier B.V. All rights reserved.
. Introduction
To efficiently eliminate xenobiotic compounds from the body,epatic metabolism performs biochemical reactions to convertarent compounds into typically more hydrophilic metabolites.
any of these biotransformations are part of oxidative metabolismphase I) which involves the cytochrome P450 (CYP) subfamily1]. Environmental factors such as diet, drug therapy and toxic
∗ Corresponding author. Tel.: +41 22 379 34 63; fax: +41 22 379 68 08.E-mail address: [email protected] (D. Guillarme).
ttp://dx.doi.org/10.1016/j.chroma.2014.10.055021-9673/© 2014 Elsevier B.V. All rights reserved.
substances have a significant impact on CYP activities, causing ahigh inter-individual variability. In view of the key role of hepaticmetabolism in most marketed drugs, the inhibition or inductionof CYP activities may consequentially affect the therapeutic out-comes of the administered drug because of a severe impact onits pharmacokinetics. For example, when the activity of the majorCYP responsible for drug metabolism is reduced, the excretion ofthe drug could become problematic and exceed the plasmatic drug
concentrations to unexpectedly toxic levels [2]. Therefore, the eval-uation of the CYP interaction potential of drugs, new chemicalentities, toxic substances and phytochemicals must be performedto account for the existing risks during co-exposure.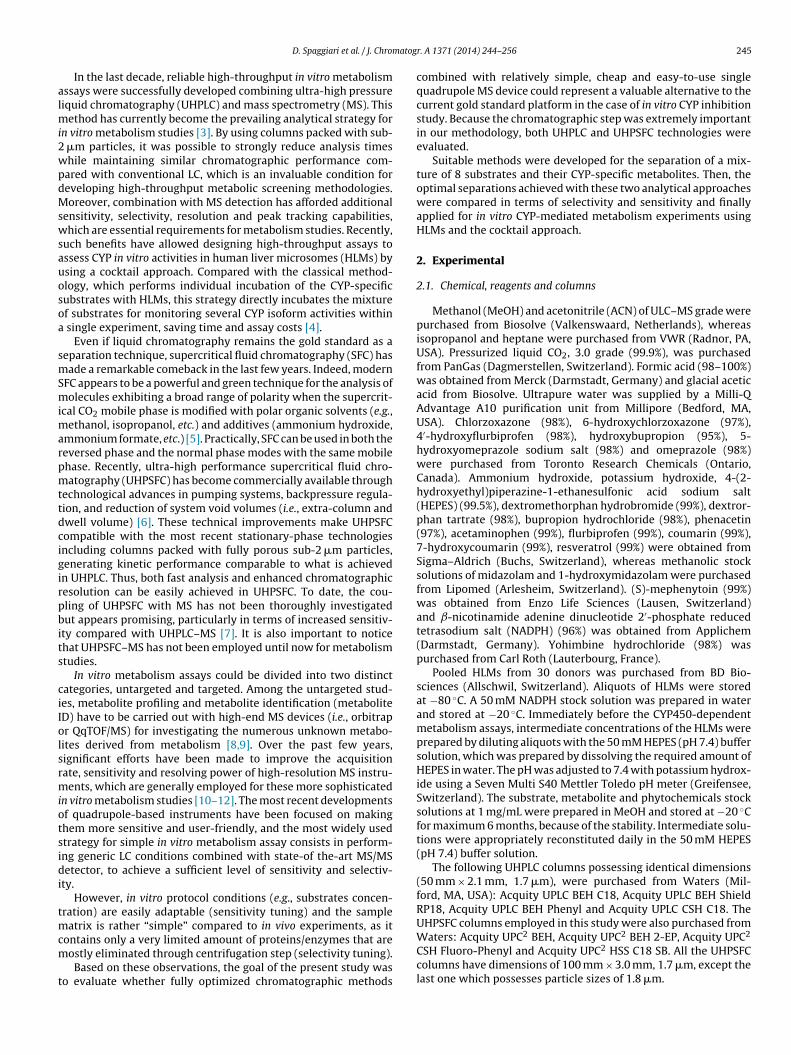
atog
almi2wpdMswsauosoa
smSmimarpmttdcigirpbits
ciIolsrmiotsidi
tmcm
t
D. Spaggiari et al. / J. Chrom
In the last decade, reliable high-throughput in vitro metabolismssays were successfully developed combining ultra-high pressureiquid chromatography (UHPLC) and mass spectrometry (MS). This
ethod has currently become the prevailing analytical strategy forn vitro metabolism studies [3]. By using columns packed with sub-
�m particles, it was possible to strongly reduce analysis timeshile maintaining similar chromatographic performance com-ared with conventional LC, which is an invaluable condition foreveloping high-throughput metabolic screening methodologies.oreover, combination with MS detection has afforded additional
ensitivity, selectivity, resolution and peak tracking capabilities,hich are essential requirements for metabolism studies. Recently,
uch benefits have allowed designing high-throughput assays tossess CYP in vitro activities in human liver microsomes (HLMs) bysing a cocktail approach. Compared with the classical method-logy, which performs individual incubation of the CYP-specificubstrates with HLMs, this strategy directly incubates the mixturef substrates for monitoring several CYP isoform activities within
single experiment, saving time and assay costs [4].Even if liquid chromatography remains the gold standard as a
eparation technique, supercritical fluid chromatography (SFC) hasade a remarkable comeback in the last few years. Indeed, modern
FC appears to be a powerful and green technique for the analysis ofolecules exhibiting a broad range of polarity when the supercrit-
cal CO2 mobile phase is modified with polar organic solvents (e.g.,ethanol, isopropanol, etc.) and additives (ammonium hydroxide,
mmonium formate, etc.) [5]. Practically, SFC can be used in both theeversed phase and the normal phase modes with the same mobilehase. Recently, ultra-high performance supercritical fluid chro-atography (UHPSFC) has become commercially available through
echnological advances in pumping systems, backpressure regula-ion, and reduction of system void volumes (i.e., extra-column andwell volume) [6]. These technical improvements make UHPSFCompatible with the most recent stationary-phase technologiesncluding columns packed with fully porous sub-2 �m particles,enerating kinetic performance comparable to what is achievedn UHPLC. Thus, both fast analysis and enhanced chromatographicesolution can be easily achieved in UHPSFC. To date, the cou-ling of UHPSFC with MS has not been thoroughly investigatedut appears promising, particularly in terms of increased sensitiv-
ty compared with UHPLC–MS [7]. It is also important to noticehat UHPSFC–MS has not been employed until now for metabolismtudies.
In vitro metabolism assays could be divided into two distinctategories, untargeted and targeted. Among the untargeted stud-es, metabolite profiling and metabolite identification (metaboliteD) have to be carried out with high-end MS devices (i.e., orbitrapr QqTOF/MS) for investigating the numerous unknown metabo-ites derived from metabolism [8,9]. Over the past few years,ignificant efforts have been made to improve the acquisitionate, sensitivity and resolving power of high-resolution MS instru-ents, which are generally employed for these more sophisticated
n vitro metabolism studies [10–12]. The most recent developmentsf quadrupole-based instruments have been focused on makinghem more sensitive and user-friendly, and the most widely usedtrategy for simple in vitro metabolism assay consists in perform-ng generic LC conditions combined with state-of the-art MS/MSetector, to achieve a sufficient level of sensitivity and selectiv-
ty.However, in vitro protocol conditions (e.g., substrates concen-
ration) are easily adaptable (sensitivity tuning) and the sampleatrix is rather “simple” compared to in vivo experiments, as it
ontains only a very limited amount of proteins/enzymes that areostly eliminated through centrifugation step (selectivity tuning).Based on these observations, the goal of the present study was
o evaluate whether fully optimized chromatographic methods
r. A 1371 (2014) 244–256 245
combined with relatively simple, cheap and easy-to-use singlequadrupole MS device could represent a valuable alternative to thecurrent gold standard platform in the case of in vitro CYP inhibitionstudy. Because the chromatographic step was extremely importantin our methodology, both UHPLC and UHPSFC technologies wereevaluated.
Suitable methods were developed for the separation of a mix-ture of 8 substrates and their CYP-specific metabolites. Then, theoptimal separations achieved with these two analytical approacheswere compared in terms of selectivity and sensitivity and finallyapplied for in vitro CYP-mediated metabolism experiments usingHLMs and the cocktail approach.
2. Experimental
2.1. Chemical, reagents and columns
Methanol (MeOH) and acetonitrile (ACN) of ULC–MS grade werepurchased from Biosolve (Valkenswaard, Netherlands), whereasisopropanol and heptane were purchased from VWR (Radnor, PA,USA). Pressurized liquid CO2, 3.0 grade (99.9%), was purchasedfrom PanGas (Dagmerstellen, Switzerland). Formic acid (98–100%)was obtained from Merck (Darmstadt, Germany) and glacial aceticacid from Biosolve. Ultrapure water was supplied by a Milli-QAdvantage A10 purification unit from Millipore (Bedford, MA,USA). Chlorzoxazone (98%), 6-hydroxychlorzoxazone (97%),4′-hydroxyflurbiprofen (98%), hydroxybupropion (95%), 5-hydroxyomeprazole sodium salt (98%) and omeprazole (98%)were purchased from Toronto Research Chemicals (Ontario,Canada). Ammonium hydroxide, potassium hydroxide, 4-(2-hydroxyethyl)piperazine-1-ethanesulfonic acid sodium salt(HEPES) (99.5%), dextromethorphan hydrobromide (99%), dextror-phan tartrate (98%), bupropion hydrochloride (98%), phenacetin(97%), acetaminophen (99%), flurbiprofen (99%), coumarin (99%),7-hydroxycoumarin (99%), resveratrol (99%) were obtained fromSigma–Aldrich (Buchs, Switzerland), whereas methanolic stocksolutions of midazolam and 1-hydroxymidazolam were purchasedfrom Lipomed (Arlesheim, Switzerland). (S)-mephenytoin (99%)was obtained from Enzo Life Sciences (Lausen, Switzerland)and ˇ-nicotinamide adenine dinucleotide 2′-phosphate reducedtetrasodium salt (NADPH) (96%) was obtained from Applichem(Darmstadt, Germany). Yohimbine hydrochloride (98%) waspurchased from Carl Roth (Lauterbourg, France).
Pooled HLMs from 30 donors was purchased from BD Bio-sciences (Allschwil, Switzerland). Aliquots of HLMs were storedat −80 ◦C. A 50 mM NADPH stock solution was prepared in waterand stored at −20 ◦C. Immediately before the CYP450-dependentmetabolism assays, intermediate concentrations of the HLMs wereprepared by diluting aliquots with the 50 mM HEPES (pH 7.4) buffersolution, which was prepared by dissolving the required amount ofHEPES in water. The pH was adjusted to 7.4 with potassium hydrox-ide using a Seven Multi S40 Mettler Toledo pH meter (Greifensee,Switzerland). The substrate, metabolite and phytochemicals stocksolutions at 1 mg/mL were prepared in MeOH and stored at −20 ◦Cfor maximum 6 months, because of the stability. Intermediate solu-tions were appropriately reconstituted daily in the 50 mM HEPES(pH 7.4) buffer solution.
The following UHPLC columns possessing identical dimensions(50 mm × 2.1 mm, 1.7 �m), were purchased from Waters (Mil-ford, MA, USA): Acquity UPLC BEH C18, Acquity UPLC BEH ShieldRP18, Acquity UPLC BEH Phenyl and Acquity UPLC CSH C18. TheUHPSFC columns employed in this study were also purchased from
Waters: Acquity UPC2 BEH, Acquity UPC2 BEH 2-EP, Acquity UPC2CSH Fluoro-Phenyl and Acquity UPC2 HSS C18 SB. All the UHPSFCcolumns have dimensions of 100 mm × 3.0 mm, 1.7 �m, except thelast one which possesses particle sizes of 1.8 �m.

2 matog
2
2
tscsainu3p3t1anam(
2
sfsmnadtwfkdm(eatm
a2
2
qfiptfi(m(tpwadfsom
46 D. Spaggiari et al. / J. Chro
.2. Instrumentation
.2.1. UHPLC systemExperiments were performed on an Acquity UPLC H-Class sys-
em from Waters (Milford, MA, USA). This low pressure mixingystem was equipped with a pumping device, autosampler andolumn oven, which includes an active preheater. The quaternaryolvent delivery pump was able to work up to pressure of 1000 barnd allows the selection of up to 4 different buffers or organic mod-fiers in any combination. The autosampler was a flow througheedle (FTN) injection system with 15 �L needle. The injection vol-me was 2 �L and the measured dwell volume of the system was75 �L. The mobile phase flow rate was set at 500 �L/min. Mobilehases were prepared as follows: ammonium formate 10 mM (pH.0) by adding an appropriate volume of formic acid and adjus-ing pH to 3.0 with ammonium hydroxide; ammonium acetate0 mM (pH 6.0) by adding an appropriate volume of acetic acidnd adjusting pH to 6.0 with ammonium hydroxide; and ammo-ium formate 10 mM (pH 9.0) by adding an appropriate volume ofmmonium hydroxide and adjusting pH to 9.0 with formic acid. Forodelling retention times, Drylab®2010 Plus modelling software
Molnar-Institute, Berlin, Germany) was employed.
.2.2. UHPSFC system and interface configurationThe Waters Acquity UPC2 system was equipped with a binary
olvent delivery pump, an autosampler that included a 10 �L loopor partial loop injection, a column oven and a two-step (pas-ive + active) backpressure regulator (BPR). The passive componentaintains pressure higher than 104 bar while the active compo-
ent allows further back pressure increase and fine backpressuredjustments. The injection volume was 2 �L and the measuredwell volume was 440 �L. The hyphenation interface and split-er for UHPSFC–MS are detailed in [7]. Briefly, the UHPSFC systemas hyphenated with the MS detector using the following inter-
ace configuration: pre-BPR-split + make-up pump. This interfaceit purchased from Waters was composed of two serial zero-ead-volume T-unions connected to column outlet. CO2 miscibleake-up liquid delivered by a Waters Isocratic Solvent Manager
ISM) make-up pump was added and mixed to the chromatographicffluent in the upstream T-union, while the downstream T-unioncted as a flow splitter. A fraction of the total flow was directed fromhe downstream T-union to the ESI source, while the remaining
obile phase was directed to the BPR.The different organic modifiers were prepared as follows:
mmonium formate 10 mM was added to methanol, methanol with% water, isopropanol and isopropanol with 2% water.
.2.3. QDa detectorBoth UHPLC and UHPSFC were combined with a single
uadrupole Acquity QDa detector (Waters, Milford, MA, USA)tted with a Z-spray electrospray (ESI) ionization source. Being are-optimized detector, various ESI parameters, such as desolva-ion and cone gas (nitrogen) flows were not adjustable and werexed at 1200 L/h and 150 L/h, respectively. A few ESI parametersdepending on compound and mobile phase flow rate) were
anually adjusted, i.e., probe temperature (up to 600 ◦C), capillary0.3–1.5 kV for positive ionization mode and 0.3–0.8 kV for nega-ive ionization mode) and cone voltage (0–100 V). In this study, therobe temperature was set at 600 ◦C, whereas the capillary voltageas set at 1.2 kV (1.0 kV for UHPSFC–MS) and 0.8 kV in ESI positive
nd negative ionization modes, respectively. In the first step, the MSevice was operated in scan mode (mass range m/z of 50–500 Da)
or selecting the most appropriate m/z of each analyte for furtheringle ion recording (SIR) detection. Then, the cone voltages wereptimized for each compound in the corresponding ESI polarityode for both UHPLC–MS and UHPSFC–MS experiments andr. A 1371 (2014) 244–256
values were reported in Table 1. During MS detection in SIR mode,data acquisition rate was automatically adjusted by the softwareto generate sufficient data acquisition points for each chromato-graphic peak, taking into account the number of SIR to monitorand the ESI polarity switching time (25 ms). The gain parameterwas fixed at 1. Data acquisition, data handling and instrumentcontrol were performed by the Empower v. 4.1 software (Waters,Milford, MA, USA).
2.3. Substrate cocktail incubation procedure
The cocktail approach for elucidating the impact of phytochem-icals towards CYP probe reactions was performed as describedin [13] with some minor modifications. Briefly, each incubationmixture (100 �L) contained 0.5 mg/mL proteins of pooled HLMs,50 mM HEPES (pH 7.4), 2 mM NADPH and 8 probe substrates formajor hepatic CYPs. The CYP probe substrates and their final con-centrations in the incubation were: phenacetin (CYP1A2, 50 �Mor 9710 ng/mL), coumarin (CYP2A6, 5 �M or 730 ng/mL), bupro-pion (CYP2B6, 5 �M or 1200 ng/mL), flurbiprofen (CYP2C9, 5 �Mor 1220 ng/mL), omeprazole (CYP2C19, 40 �M or 13,820 ng/mL),dextromethorphan (CYP2D6, 5 �M or 1360 ng/mL), chlorzoxazone(CYP2E1, 40 �M or 6780 ng/mL) and midazolam (CYP3A, 2.5 �Mor 810 ng/mL). The chemical structures of the substrates and theirCYP-specific metabolites are reported in Fig. 1. Compared to theoriginal cocktail approach [13], omeprazole was preferred over (S)-mephenytoin due to its higher microsomal metabolic rate at lowerconcentration and the better analytical response of the CYP-specificmetabolite. During preliminary experiments, sensitivity obtainedwith both analytical strategies was not sufficient for the detectionof 4′-hydroxymephenytoin produced under incubation conditionsand using (S)-mephenytoin at 100 �M (or 21,830 ng/mL). Indeed,this metabolite possessed LOD and LOQ values of approximatively400 ng/mL and 900 ng/mL, respectively. Omeprazole was incubatedat 40 �M to reduce the risk of interaction with other substratesof the cocktail [4]. Two phytochemicals, namely yohimbine andresveratrol, were individually added to the incubation mixture toobtain final concentrations of 10 �M. The control incubation did notcontain phytochemicals. After a pre-incubation for 3 min at 37 ◦C,the CYP450-dependent phase I reactions were initiated by addingan excess of NADPH. The incubation takes place during 20 minat 37 ◦C under agitation (400 rpm). The enzymatic reaction wasstopped by adding 100 �L of ice-cold ACN to the reaction medium.The precipitated proteins were removed by centrifugation (5 min at10,000 rpm), and an aliquot (150 �L) of the resulting supernatantwas transferred to a vial for analysis. Triplicate incubations werecarried out. Finally, the impact of phytochemicals on CYPs activitieswere estimated and discussed.
3. Results and discussion
When studying in vitro metabolism using the cocktail approach,there is a need to develop fast and sensitive methods able to dis-criminate a number of substrates and metabolites. There are twostrategies to develop such an assay. The first possibility is to usegeneric, non-optimized chromatographic conditions, together withthe latest generation of MS/MS device offering very high sensi-tivity and selectivity. However, when dealing with in vitro CYPinhibition assay, such a level of sensitivity and selectivity is gen-erally not required and this solution may be quite expensive to
apply. As an alternative, a different strategy was proposed, whichconsists in optimizing as much as possible the chromatographicstep to have sufficient selectivity, and to combine this optimizedchromatographic method with simple, easy-to-use and relatively
D. Spaggiari et al. / J. Chromatogr. A 1371 (2014) 244–256 247
Table 1Physico-chemical properties and MS conditions for optimal detection of the 8 substrates and 8 metabolites in UHPLC and UHPSFC.
CYP450isoform
SubstrateCYP-specific metabolite
Physico-chemical propertiesa MS UHPLC–MS UHPSFC–MS
Acidic//basicpKa
LogP LogD(pH=3)
LogD(pH=7)
LogD(pH=9)
SIR(m/z)
ESI polarity(+/−)
Cone voltage (V)
1A2Phenacetin −//1.4 1.6 1.6 1.6 1.6 180.1 ESI+ 10 10Acetaminophen 9.9//1.7 0.3 0.3 0.3 0.3 152.1 ESI+ 10 5
2A6Coumarin – 1.4 1.4 1.4 1.4 147.0 ESI+ 15 57-Hydroxycoumarin 7.9//− 1.6 1.6 1.5 0.4 163.0 ESI+ 10 5
2B6Bupropion −//7.2 3.5 0.4 3.0 3.5 240.1 ESI+ 10 10Hydroxybupropion 11.9//7.7 2.6 −0.5 1.8 2.6 238.1 ( H2O) ESI+ 20 25
2C9Flurbiprofen 4.1//− 4.1 4.1 1.4 0.4 199.1 ( COO) ESI− 30 254′-Hydroxyflurbiprofen 4.2, 9.6//− 3.3 3.3 0.5 −0.5 215.1 ( COO) ESI− 25 25
2C19Omeprazole 8.7//1.6, 4.4 2.2 0.4 2.2 1.9 346.1 ESI+ 5 55-Hydroxyomeprazole 8.7,13.4//1.6, 4.1 0.5 0.4 1.6 1.1 362.1 ESI+ 10 10
2D6Dextromethorphan −//9.1 4.1 1.0 2.0 3.8 272.2 ESI+ 15 25Dextrorphan 10.1//9.1 3.5 0.4 1.5 3.1 258.2 ESI+ 20 30
2E1Chlorzoxazone 8.5//− 2.2 2.2 2.2 1.6 168.0 ESI− 20 106-Hydroxychlorzoxazone 7.8,10.5//− 1.6 1.6 1.4 −0.1 184.0 ESI− 15 15
.9
.1
“s
omac
mfvtchthitmowa
3
ttou
3
if1igwCctgm
3Asubfamily
Midazolam −//6.0 3.9 1.6 31′-Hydroxymidazolam 13.6//3.6 3.1 2.2 3
a ACD/Labs predicted values.
cheap” single quadrupole instrument, to achieve the requestedensitivity.
In the present work, UHPLC and UHPSFC methods were devel-ped for the separation of 8 probe substrates and 8 CYP-specificetabolites and the single quadrupole detector was also used to
ssist and fasten the chromatographic method development pro-edure (peak tracking).
Due to the limited spectral resolution of the single quadrupoleass spectrometer (m/z 0.7 FWHM), distinguishing between dif-
erent compounds in MS is not always straightforward. Indeed,arious peaks can be observed on one given SIR channel, dueo (i) the isotopic abundance of Cl35/Cl37 occurring for severalompounds, (ii) a small m/z difference for several analytes (e.g.,ydroxybupropion, m/z 256 versus dextrorphan, m/z 258), and (iii)he in-source fragmentation of metabolites (e.g., loss of water forydroxybupropion, m/z 256 and thermal degradation of phenacetin
nto acetaminophen, m/z 152), yielding two identical peaks withinhe same SIR trace of the corresponding substrates (e.g., bupropion,/z 240 and phenacetin, m/z 180). For these reasons, a baseline res-
lution of the 16 compounds in both UHPLC and UHPSFC conditionsas required prior to detection when using a single quadrupole
nalyzer.
.1. Method development in UHPLC–MS
To develop a powerful UHPLC–MS method for the analysis ofhe mixture containing 8 substrates and 8 metabolites, a sequen-ial two-step procedure was applied, including a generic screeningf UHPLC conditions and a chromatographic optimization methodsing modelling software.
.1.1. Screening procedureAs described in Table 2, a generic screening procedure was
nitially applied to the mixture of 16 standard compounds. Four dif-erent UHPLC columns of identical dimensions (50 mm × 2.1 mm,.7 �m) were used. In terms of column chemistries, three hybrid sil-
ca phases bonded with C18, phenyl, and C18 with polar embeddedroups were considered. Because most of the selected substancesere ionizable, a charged surface hybrid stationary phase (CSH18) was also chosen to modify selectivity. Because analytical
ompounds possess a wide range of physico-chemical properties,hree different volatile buffers (i.e., pH 3, 6 and 9) were investi-ated. Finally, experiments were conducted using the two organicodifiers commonly used in RPLC mode, methanol (MeOH) and3.9 326.1 ESI+ 20 303.1 342.1 ESI+ 15 25
acetonitrile (ACN). This screening procedure was similar to the onepresented in [14].
A generic gradient from 2% to 90% over 4 min was applied withall the possible combinations of stationary phases, mobile-phasepH, and organic modifiers (corresponding to 24 different con-ditions). Following these experiments, various chromatographicand MS responses were evaluated, including the retention of thecompounds, chromatographic selectivity between the peaks, andsensitivity (background noise and signal).
When applying columns packed with sub-2 �m particles,one of the most important constraints is the elevated pressuredrop related to the use of MeOH in the mobile phase. BecauseMeOH/water mixtures are almost twice as viscous as ACN/watermixtures, ACN is generally considered as the first choice in UHPLCfor high-throughput separations at elevated flow rates. Apart fromspeed of analysis, MS sensitivity also has to be considered to selectthe most appropriate organic modifier. Similarly to previous find-ings [15], ionization was enhanced by an average factor 2–5 withMeOH versus ACN for the designated set of compounds, suggestingthat enhanced sensitivity and lower limits of detection are achievedwith polar protic solvents. Because the sensitivities achieved witha miniaturized single quadrupole detector may be limited for invitro metabolism study, and because peak shapes of all of the com-pounds were comparable regardless of the organic modifier, MeOHwas selected to reach the highest possible sensitivity. On the otherhand, it is important to consider that the mobile phase flow rate willbe limited with such a highly viscous mobile phase, thus increas-ing analysis time. In this study, a flow rate of 500 �L/min induced amaximal pressure drop of approximately 800 bar was applied witha MeOH/water mobile phase.
The influence of the mobile-phase pH (acidic, neutral andbasic) was also evaluated. The neutral pH was not useful due toa lack of sensitivity for many ions. This lack of sensitivity wasattributed to the limited number of compounds that were fullyionized at pH 6, as illustrated in Table 1. Indeed, only flurbiprofen,4′-hydroxyflurbiprofen, dextromethorphan and dextrorphan wereionized under these pH conditions. Other analytes were only par-tially ionized, and their retentions were moderate. Most of themwere eluted with a limited proportion of the organic modifier,which was detrimental for the desolvation of ions in ESI. Because
both ionization and desolvation were sub-optimal under neutralpH conditions, sensitivity was systematically too limited. On thecontrary, the achieved sensitivities were enhanced at pH 3 and 9.Acidic compounds were completely ionized at basic pH, but the
248 D. Spaggiari et al. / J. Chromatogr. A 1371 (2014) 244–256
Table 2Summary of the initial screening conditions for UHPLC–MS and UHPSFC–MS.
UHPLC UHPSFC
Column pH Organic modifier Column Organic modifier Mobile phase additives
BEH C18 3 Acetonitrile BEH Methanol Ammonium formate 10 mMBEH C18 3 Methanol BEH Methanol Ammonium formate 10 mM + 2% waterBEH C18 6 Acetonitrile BEH Isopropanol Ammonium formate 10 mMBEH C18 6 Methanol BEH Isopropanol Ammonium formate 10 mM + 2% waterBEH C18 9 Acetonitrile BEH 2-EP Methanol Ammonium formate 10 mMBEH C18 9 Methanol BEH 2-EP Methanol Ammonium formate 10 mM + 2% waterBEH phenyl 3 Acetonitrile BEH 2-EP Isopropanol Ammonium formate 10 mMBEH phenyl 3 Methanol BEH 2-EP Isopropanol Ammonium formate 10 mM + 2% waterBEH phenyl 6 Acetonitrile CSH fluoro-phenyl Methanol Ammonium formate 10 mMBEH phenyl 6 Methanol CSH fluoro-phenyl Methanol Ammonium formate 10 mM + 2% waterBEH phenyl 9 Acetonitrile CSH fluoro-phenyl Isopropanol Ammonium formate 10 mMBEH phenyl 9 Methanol CSH fluoro-phenyl Isopropanol Ammonium formate 10 mM + 2% waterCSH C18 3 Acetonitrile HSS C18 SB Methanol Ammonium formate 10 mMCSH C18 3 Methanol HSS C18 SB Methanol Ammonium formate 10 mM + 2% waterCSH C18 6 Acetonitrile HSS C18 SB Isopropanol Ammonium formate 10 mMCSH C18 6 Methanol HSS C18 SB Isopropanol Ammonium formate 10 mM + 2% waterCSH C18 9 AcetonitrileCSH C18 9 MethanolShield RP18 3 AcetonitrileShield RP18 3 MethanolShield RP18 6 AcetonitrileShield RP18 6 MethanolShield RP18 9 AcetonitrileShield RP18 9 Methanol
O
NH
O
NH
O
OH
O O OOH O
Cl
NHO
Cl
NH
OOH
OH
F
O
OH
F
O
OH
NH
O
Cl
ONH
O
Cl
O
OH
N
N
F
N
Cl N
N
F
N
Cl
OH
O
N
OH
N
CYP1A2O-deethyla�on
CYP2A67-hydroxyla�on
CYP2B6hydroxyla�on
CYP2C94’-hydroxyla�on
CYP2C195-hydroxyla�on
CYP2D6O-demethyla�o n
CYP2E16-hydroxyla�on
CYP3A1’-hydroxyla�on
sub famil y
Phenace� n (7) Acetaminophen (1)
Coumarin (5) 7-hydroxycoumar in (3)
Buprop ion (8) Hydroxybup ropio n (6)
Flurbiprofen (16) 4’-hydroxyflurbiprofen (14)
Omeprazole (12) 5-hydroxyomeprazole (9)
Dextrometho rphan (11) Dextrorphan (4)
Chlorzoxazone (10) 6-hydroxychlo rzoxazone (2)
Midazolam (13) 1’-hydroxym idazolam (15)
N
NH
S
N
O
O O N
NH
S
N
O
O O
OH
Fig. 1. Chemical structures of the substrates and CYP-specific metabolites.

atog
dmmsedoaotwc
rpmgisbws
depcec
3
wsbafi311dsmsv(v[
Lptdwsp
btMuo1m
D. Spaggiari et al. / J. Chrom
esolvation of ions was quite limited, as the acidic substrates andetabolites were eluted with a limited proportion of the organicodifier. The situation was exactly the opposite with basic sub-
tances; the ionization at pH 9 was poor, but these substances wereluted with a higher proportion of organic modifier, improving theesolvation of ions in ESI. In acidic conditions, either the ionizationr desolvation was enhanced compared to neutral pH, for basic andcidic compounds, respectively [16]. From a chromatographic pointf view, pH 9 was beneficial for retention and selectivity, but dis-orted peaks (i.e., tailing, fronting, shouldering and peak splitting)ere often observed. For these reasons, the rest of the study was
arried out exclusively under acidic pH.Regarding the selection of stationary phase, the differences in
etention and selectivity were not significant. Indeed, no phase out-erformed the other ones, regardless of the pH and the organicodifier. All of the compounds were sufficiently retained with the
eneric gradient, for all of the stationary phases, with differencesn the nature and number of critical pairs. As expected, the MS sen-itivity was also not a relevant criterion to select the best column,ecause the sensitivities achieved with the four stationary phasesere similar. Therefore, the most versatile, robust and chemically
table stationary phase, the Acquity BEH C18, was selected.For the screening step, it was valuable to have a compact MS
evice to unambiguously identify the individual compounds inach condition because it was possible to quickly determine whicheaks were poorly detected, distorted or badly resolved. Then,onsidering the analytical conditions and physico-chemical prop-rties of the problematic compounds, some reliable explanationsould be found.
.1.2. Method optimization procedureNext to the initial screening procedure, the gradient profile
as further optimized using the most promising combination oftationary phase, mobile-phase pH and organic modifier, on theasis of two generic gradients that only differed in slope (7.3%nd 22%/min). This gradient optimization was simultaneously per-ormed with an optimization of the mobile phase temperaturen the range 30–60 ◦C within a narrower range of acidic pH (pH–4). Overall, the mixture of 16 compounds was injected under2 different conditions, including two gradients (2–90% in 4 and2 min) at two temperatures (30 and 60 ◦C) and three pH con-itions (3.0, 3.5 and 4.0). For data manipulation, a linear solventtrength (LSS)-based HPLC modelling software was employed. Theost recent version of computer-assisted method development
oftware allows a simultaneous modelling of the effect of threeariables for a given separation. In this study, gradient steepnesstG), temperature (T), and mobile-phase pH were selected as modelariables to create a cube resolution map with the three factors17–19].
However, for a successful method optimization on the basis ofSS based retention models, it is necessary to individual track eacheak in each of the different analytical conditions. This task is oftenedious and time-consuming. Here, the ability of the simple MSetector to identify the retention times of all of the compoundsithin the mixture was employed. This method considerably
peeds up the method development procedure, in comparison witheak tracking performed with UV detection.
Fig. 2 shows the corresponding 3D surface responses generatedy the modelling software. As depicted in this cube representation,he best condition correspond to a linear gradient from 2% to 90%
eOH over 8 min at a temperature of 35 ◦C and a pH of 3.7. The sim-
lated chromatogram, calculated for an average column efficiencyf 7000 plates (i.e., a reasonable plate count for a 50 mm × 2.1 mm,.7 �m column) is also provided in Fig. 2. On this simulated chro-atogram, the minimal resolution (Rsmin) was 2.89 and the mostr. A 1371 (2014) 244–256 249
critical peak pair was phenacetin and hydroxybupropion (m/z of180 and 238), both detected in positive ESI mode.
The experimental chromatogram obtained under optimal con-ditions is provided in Fig. 3. As shown in Table 3, the discrepanciesbetween simulated and observed retention times were in the rangeof 0–5.4%, which is acceptable. A baseline separation of all 16 sub-strates and metabolites was ultimately achieved in approximately7 min under the optimal UHPLC–MS conditions.
3.2. Method development in UHPSFC–MS
3.2.1. Screening procedureSimilarly to the methodology used for UHPLC–MS, an initial
screening procedure was applied in UHPSFC–MS to first find outthe best combination of a stationary phase, an organic modifier andan additive. For the stationary phases, columns of 100 mm × 3 mmwere exclusively employed to achieve fast kinetic performance.Shorter and/or narrower columns were not compatible with theselected UHPSFC systems because the extra-column band broaden-ing of our instrument was estimated at ∼85 �L2 versus only 8 �L2
for the UHPLC system. Then, severe loss in performance may havebeen observed with 50 mm × 2.1 mm columns under UHPSFC con-ditions, as demonstrated elsewhere [20]. Despite an upper pressurelimit of only 400 bar, columns packed with 1.7 �m particles weresuccessfully employed due to the limited viscosity of the CO2-basedmobile phase [21]. Four different stationary phase chemistrieswere selected, including a hybrid silica phase (BEH), a hybrid silicabonded with a 2-ethylpyridine moiety (BEH 2-EP), a silica phasebonded with C18 alkyl chains (HSS C18 SB) and a charged surfacehybrid silica particle bonded with a fluorophenyl moiety (CSH FP).As shown in a recent study by Khater et al., these four phases offera high degree of orthogonality [22]. In addition, the four phaseswere available with dimensions of 100 mm × 3 mm, 1.7 �m (and1.8 �m for the HSS C18 phase). Based on our previous experience,only alcohols were tested as organic modifiers, because the per-formance achieved with acetonitrile, tetrahydrofuran and othertypes of organic solvents was disappointing with pharmaceuticalcompounds [23]. Therefore, methanol and isopropanol were con-sidered as organic modifiers for the initial screening step. Becausethe mixture of substrates and metabolites to be analyzed containsnumerous acidic and basic substances, 10 mM ammonium formatewas systematically added to the mobile phase [24]. This additivewas particularly appropriate because it is volatile and thereforecompatible with MS detection. Furthermore, it allows obtainingsymmetrical and narrow peaks with both acidic and basic sub-stances. Finally, the screening experiments were carried out in theabsence and in presence of 2% water in the mobile phase, as it hasbeen shown that a small addition of water can contribute to enhanc-ing peak shapes, reduce retention times of most polar substances,improve MS sensitivity and modify selectivity under SFC conditions[25].
A generic method consisting of a 0.5 min initial isocratic stepat 2% followed by a gradient from 2% to 30% in 4 min was appliedwith all possible combinations of stationary phases, mobile phaseadditives and organic modifiers (corresponding to 16 differentconditions). Following these experiments, the retention of the com-pounds, the peak shapes, the chromatographic selectivity betweenpeaks and the sensitivity (background noise and signal) wereevaluated to find out the best analytical conditions. The singlequadrupole device was successfully used to identify the 16 differentanalytes in all screening conditions.
Among the four stationary phases, the CSH FP performed the
worst. Even if all of the compounds of interest were eluted duringthe generic gradient on this column, the peaks were distorted (tail-ing and broadening) and most significantly, a strong backgroundnoise was observed on numerous SIR channels. This behaviour
250 D. Spaggiari et al. / J. Chromatogr. A 1371 (2014) 244–256
Fig. 2. 2D and 3D surface responses and corresponding simulated chromatogram obtained with modelling software. Conditions: column Acquity BEH C18 (50 mm × 2.1 mm,1 min,( in, (6)c ydrox
cohgfoaeestpHwtof
iawp
.7 �m), phase A: buffer pH 3.7, phase B: methanol, gradient from 2 to 90% B in 8.002) 6-hydroxychlorzoxazone, (3) 7-hydroxycoumarin, (4) dextrorphan, (5) coumarhlorzoxazone, (11) dextromethorphan, (12) omeprazole, (13) midazolam, (14) 4′-h
ould be related to bleeding phenomena, related to the presencef a positive charge of an unknown nature at the surface of theybrid silica particles, to the bonding chemistry of the fluorophenylroup itself, or to presence of residues (metal catalysts) remainingrom the bonding chemistry. One of the most important issuesbserved with the BEH phase was related to the very low retentionnd unacceptable peak shape of coumarin, which was eluted tooarly during the initial isocratic step. Various modifications werevaluated to improve its retention, such as reducing the backpres-ure or decreasing the initial percentage of organic modifier downo 1%, but none of them were successful. Finally, all of the com-ounds were eluted with adequate retention on the BEH 2-EP andSS C18 SB phases. However, the peak shape and overall selectivityas enhanced on the BEH 2-EP. For example, there was a triplet of
hree peaks (m/z of 238, 342 and 326) with a resolution close to zeron the HSS C18 SB phases. Thus, the BEH 2-EP phase was selectedor further optimization.
Regarding the choice of organic modifier, the elution strength of
sopropanol was lower than that of MeOH, due to a lower H-bondcidity and basicity for isopropanol. This lower elution strengthas problematic because a few compounds, such as dextromethor-han, were not eluted on the BEH column even at 30% isopropanol,flow rate: 0.5 mL/min, temperature: 35 ◦C. Peak identification: (1) acetaminophen, hydroxybupropion, (7) phenacetin, (8) bupropion, (9) 5-hydroxyomeprazole, (10)yflurbiprofen, (15) 1′-hydroxymidazolam, (16) flurbiprofen.
probably because this compound was the most basic among our setof substrates and metabolites. In addition, the peaks correspondingto basic substances, such as hydroxybupropion on the BEH 2-EPphase, were much broader and tailed. Finally, the sensitivity wasalso reduced when MeOH was replaced by isopropanol. Theseobservations confirm the superiority of MeOH over isopropanol asan organic modifier for our particular application.
The screening analyses were carried out in the absence and inpresence of 2% water within the mobile phase. Contrary to ourexpectations, the effect of water on the peak shape and selectivitywas negligible (especially when MeOH was used as organic modi-fier), regardless of the stationary phase. However, water was foundto increase sensitivity in positive ESI mode, while its sensitivityreduction in negative ESI mode was moderate. Thus, 2% water wassystematically added to the mobile phase for the rest of the study.
3.2.2. Method optimization procedureIn UHPSFC, computer-assisted method development software
cannot be used, because it has been demonstrated that thelinear-solvent-strength theory (LSS) was not valid (i.e., that a linearrelationship exists between log k and %MeOH) under SFC conditions[26,27]. In addition, the van’t Hoff equation (log k = f(1/T)) has never
D. Spaggiari et al. / J. Chromatogr. A 1371 (2014) 244–256 251
2
10
14
16
0.0
3.4x10⁵
7.06.05.04.03.02.01.00.0 minutes
peak
inte
nsity
ESI -SIRoverlaid
UHPLC-MS
0.0
1.3x10⁷
7.06.05.04.03.02.01.00.0
11
13
13
125
68
2
9
15
4
7
10 14 16
minutes
ESI+/ESI-SIRoverlaid
peak
inte
nsity
UHPLC-MS
F (50 mp perat
btowczmtitt
TC
ig. 3. Optimal chromatograms in UHPLC–MS. Conditions: column Acquity BEH C18hase B: methanol, gradient from 2 to 90% B in 8.00 min, flow rate: 0.5 mL/min, tem
een employed with supercritical or subcritical fluids and polar sta-ionary phases. Therefore, a simple univariate approach was carriedut to improve the separation achieved using the BEH 2-EP phaseith the generic gradient previously described. With the generic
onditions, the separations between acetaminophen and omepra-ole (m/z of 152 and 346) and between phenacetin, flurbiprofen andidazolam (m/z of 180, 199 and 326) were insufficient, with a par-
ial co-elution of these species. Therefore, various parameters werenvestigated to tune the selectivity and improve the separation ofhe most critical pairs. The effect of the mobile phase temperature inhe range 35–45 ◦C was found to be negligible, most likely because
able 3omparison between predicted retention time and experimental retention time for the 1
CYP isoform SubstrateCYP-specific metabolite
Predicted retention ti
CYP1A2Phenacetin 4.06
Acetaminophen 1.52
CYP2A6Coumarin 3.73
7-hydroxycoumarin 3.19
CYP2B6Bupropion 4.23
Hydroxybupropion 3.90
CYP2C9Flurbiprofen 6.97
4′-Hydroxyflurbiprofen 5.80
CYP2C19Omeprazole 5.38
5-Hydroxyomeprazole 4.53
CYP2D6Dextromethorphan 4.95
Dextrorphan 3.49
CYP2E1Chlorzoxazone 4.72
6-Hydroxychlorzoxazone 2.56
CYP3A subfamilyMidazolam 5.59
1′-Hydroxymidazolam 5.95
m × 2.1 mm, 1.7 �m), phase A: buffer pH 3.7 water with 10 mM ammonium formate,ure: 35 ◦C, injection volume: 2 �L. Peak identification similar to Fig. 2.
the most critical compounds were eluted with a relatively high pro-portion of organic modifier, limiting the impact of the temperatureon the mobile phase density. Because both critical peak pairs werecomposed of substances with diverse acidic and basic properties,the concentration of ammonium formate was modified in the rangeof 5–20 mM, without any effect on selectivity. Finally, the onlyparameter that had a significant effect on the selectivity was the
slope of the gradient. The slope of the gradient was varied between7.0% and 1.9%/min, and a baseline separation of the 16 compoundswas ultimately achieved. To further decrease analysis time, amultistep gradient was applied to improve resolution without6 compounds.
me (min) Experimental retention time (min) Difference (%)
3.89 −4.21.58 +3.53.60 −3.63.12 −2.24.07 −3.83.76 −3.66.75 −3.15.58 −3.85.14 −4.54.34 −4.14.78 −3.53.41 −2.34.46 −5.42.56 0.05.34 −4.45.69 −4.3

252 D. Spaggiari et al. / J. Chromatogr. A 1371 (2014) 244–256
16
14
2
0.0
6.5x10⁵
0.0 1.0 2.0 3.0 4.0 5.0 6.0 7.0minutes
UHPSFC-MS 10ESI -
overlai d SIR
peak
inte
nsity
1
210
7
5
3
8 615
12
9
411
1614
0.0
7.5x10⁶
0.0 1.0 2.0 3.0 4.0 5.0 6.0 7.0minutes
ESI+/ESI-overlai d SIR
UHPSFC-MS
peak
inte
nsity
13
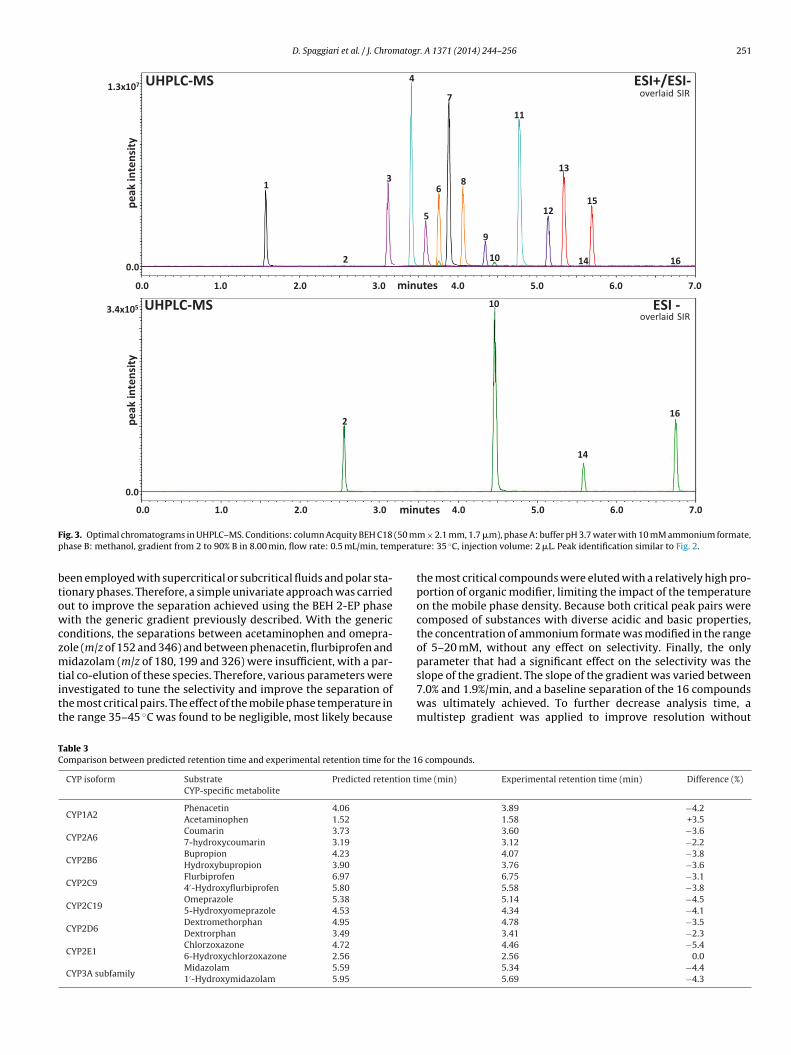
Fig. 4. Optimal chromatograms in UHPSFC–MS. Conditions: column Acquity UPC2 BEH 2-ethylpyridine (100 mm × 3.0 mm, 1.7 �m), phase A: CO2, phase B: methanol/water( .5% bt etwea
dFfgtc4Wa
3U
tso
idtfifmiaT
98:2) with 10 mM ammonium formate, 1% B for 0.5 min then gradient from 1 to 9emperature: 40 ◦C, backpressure: 150 bar, make-up pump: ethanol at 0.7 mL/min bnd 7 min, injection volume: 2 �L. Peak identification similar to Fig. 2.
rastically affecting throughput. The final separation shown inig. 4 was obtained with an initial isocratic step at 1% MeOHor 0.5 min, to sufficiently retain coumarin, followed by a linearradient from 1% to 9.5% in 4.5 min. A steeper gradient from 9.5%o 30% was run for 1.5 min to elute the most strongly retainedompounds, specifically dextromethorphan, acetaminophen,′-hydroxyflurbiprofen, 5-hydroxyomeprazole and dextrorphan.ith this method, the 16 peaks were baseline-resolved with an
nalysis time of approximately 7 min.
.3. Comparison of achieved sensitivities in UHPLC–MS andHPSFC–MS
After the method development, the sensitivities achieved withhe compact single quadrupole device for the mixture of 8 sub-trates and their CYP-specific metabolites were evaluated under theptimal UHPLC–MS and UHPSFC–MS conditions described above.
To reach the highest possible sensitivity, the electrospray ion-zation (ESI) parameters were optimized. With this particular MSetector, the number of parameters that can be adjusted is rela-ively limited. The probe temperature and capillary voltage werexed at generic values because their impact on the sensitivity was
ound to be negligible. On the contrary, cone voltages were opti-
ized for each analyte because its impact on the sensitivity wasmportant. Various cone voltages between 5 and 30 V were tested,nd the signal-to-noise ratio was monitored for all these conditions.he optimal cone voltages are reported in Table 1.
etween 0.5 and 5 min and 9.5 to 30% between 5 and 6.5 min, flow rate: 2 mL/min,en 0 and 1.6 min, 0.5 mL/min between 1.6 and 6.2 min and 0.3 mL/min between 6.2
For the coupling of UHPSFC and MS, a double T-union interfacewas employed, similar to the one described in [7]. In this inter-face, the first zero-dead volume T-union allows the addition of anorganic solvent with an external pump to enhance MS ionizationand avoid analyte precipitation. The nature of the organic solventand its flow rate were optimized because both parameters mayimpact sensitivity. Ethanol (EtOH) was used as a make-up solvent;it offers a good sensitivity for all of the compounds, particularlyin negative ionization mode (ESI−). Another benefit of ethanol isits limited environmental impact. Regarding the flow rate, the firsteluted peaks (i.e., coumarin and bupropion) were better detectedwith a high amount of EtOH, while the most strongly retained com-pounds (i.e., 4′-hydroxyflurbiprofen and dextrorphan) required lessEtOH. This behaviour appears quite logical because the proportionof protic solvent contained in the mobile phase was very limited atthe beginning of the run (1% of MeOH) and much higher at the end(30% of MeOH). To achieve the best sensitivity for all substances,0.7 mL/min of EtOH was added from 0 to 1.6 min, 0.5 mL/min ofEtOH was used from 1.7 to 6.1 min and 0.3 mL/min of EtOH wasemployed after 6.2 min.
To evaluate the instrumental sensitivity in UHPLC–MS andUHPSFC–MS, a solution containing the 16 standard compounds wasreconstituted at a concentration of 1 �g/mL in a dissolution solventcomposed of a 50:50 (v/v) ACN/H2O mixture with 25 mM HEPES
buffer pH 7.4 to mimic the metabolic incubation medium. Succes-sive dilutions of this initial solution were performed with the samediluent to reach final concentrations of 500, 200, 100, 50, 20, 10, 5, 2and 1 ng/mL. These ten solutions were injected in both UHPLC–MS
D. Spaggiari et al. / J. Chromatogr. A 1371 (2014) 244–256 253
Table 4Limits of quantitation (LOQ, ng/mL) of the 8 substrates and 8 metabolites in UHPLC–MS and UHPSFC–MS.
CYP450 isoform SubstrateCYP-specific metabolite
UHPLC–MS UHPSFC–MS Sensitivity modification
1A2Phenacetin 5 10 ÷2Acetaminophen 20 20 =
2A6Coumarin 5 40 ÷87-Hydroxycoumarin 50 10 ×5
2B6Bupropion 3 20 ÷6.6Hydroxybupropion 2 10 ÷5
2C9Flurbiprofen 50 50 =4′-Hydroxyflurbiprofen 100 200 ÷2
2C19Omeprazole 3 10 ÷3.35-Hydroxyomeprazole 5 20 ÷4
2D6Dextromethorphan 2 2 =Dextrorphan 3 10 ÷3.3
2E1Chlorzoxazone 5 5 =
30
5
5
ac(tabbtti(aiasu
U7tbtcg
UadbdptciwcsUEwibiUIic
6-Hydroxychlorzoxazone
3Asubfamily
Midazolam
1′-Hydroxymidazolam
nd UHPSFC–MS, and signal-to-noise values were measured for allompounds. The limit of detection (LOD) and limit of quantitationLOQ) were estimated as signal-to-noise values of 3 and 10, respec-ively. The LOQ values were reported in Table 4. The LOD valueschieved in UHPLC–MS ranged from 1 to 50 ng/mL, while they wereetween 1 and 75 ng/mL for UHPSFC–MS. The LOQ values wereetween 2 and 100 ng/mL in UHPLC–MS, while they ranged from 2o 200 ng/mL in UHPSFC–MS. In agreement with previous findings,he LOD and LOQ were generally worse in ESI− compared to the pos-tive ionization mode (ESI+), and the two most acidic compoundsi.e., flurbiprofen and 4′-hydroxyflurbiprofen) had the highest LODnd LOQ values. Based on the concentrations employed for then vitro CYP-dependent metabolism assay (see Section 2.3), the LOQchieved in both UHPLC–MS and UHPSFC–MS were found to beufficient. This result confirms that the single quadrupole detectorsed in this study may be of interest for such an application.
As shown in Table 4, the sensitivities achieved in theHPSFC–MS were, on average, 3-fold lower than in UHPLC–MS. The-hydroxycoumarin was the only compound with a better LOQ (5-imes lower) in UHPSFC–MS. For a few compounds (i.e., coumarin,upropion and hydroxybupropion), sensitivity was 5- to 8-fold bet-er in UHPLC–MS compared with UHPSFC–MS. For all of the otherompounds, the change in sensitivity between the two chromato-raphic modes was more limited and varies between 0.8 and 4.
In a previous study [7], the sensitivity differences betweenHPLC–MS and UHPSFC–MS, attributed to the interfacing methodnd the nature of the solvent entering the ESI/MS were discussed inetails. In [7], it was demonstrated that sensitivity was enhancedy a factor of up to 10 in UHPSFC–MS compared to UHPLC–MS,ue to a better desolvation of CO2/MeOH versus ACN/H2O mobilehase. This result contradicts the findings of this new study, andhe following explanations could be taken into account. First, theompounds were obviously not identical to the ones employedn [7], and the substrate/metabolite pairs selected here cover a
ider range of physico-chemical properties. Indeed, some of theompounds were poorly retained (eluted with 1% MeOH), whileome other compounds were eluted with up to 30% of MeOH inHPSFC conditions. In addition, acidic compounds detected in theSI− mode were not evaluated in the previous study. Second, MeOHas used as an organic modifier in UHPLC, while ACN was used
n [7]. As discussed in Section 3.1.1, the sensitivity was enhancedy a factor 3–5 when using MeOH rather than ACN. Third, it is
mportant to consider that the injected volumes in UHPLC and
HPSFC were not scaled in proportion to the column volumes.ndeed, the column volume in UHPSFC was 4 times higher thann UHPLC (100 mm × 3 mm versus 50 mm × 2.1 mm). In the presentase, the injected volume was held constant at 2 �L to limit peak
100 ÷3.34 ×1.2
20 ÷4
shape issues caused by a large injected volume in SFC [28]. Afurther increase in detection sensitivity in UHPSFC–MS by a fac-tor of 4 might thus be expected if the injection volume couldbe proportionally adjusted. Fourth, the ionization source designwas different between the triple quadrupole employed in [7] andthe modern single quadrupole employed in the present study. Asdemonstrated in [29], which describes a comparison of sensitivityachieved in RPLC–MS and HILIC-MS with several MS brands/types,modern MS devices offer enhanced evaporation efficiency, whichis important for RPLC mobile phases containing high proportionsof water. Therefore, it is highly probable that a better desolvationand thus better sensitivity was achieved in UHPLC–MS with the sin-gle quadrupole employed in this study, compared with the triplequadrupole employed in [7]. Last but not least, a single quadrupoleis much less selective than a triple quadrupole, and the backgroundnoise was not identical between UHPLC–MS and UHPSFC–MS con-ditions, while it was the same with the triple quadrupole employedin [7].
3.4. Application to in vitro CYP-mediated metabolism testing
The cocktail methodology is an attractive approach usedto simultaneously monitor the enzymatic activity of the mostimportant cytochromes P450 (CYPs) in clinical or pre-clinicalstudies. This approach allows the easy characterization of thephase I metabolism of biological systems and also the evaluationof the inhibition and induction properties of xenobiotics [4]. In thepresent study, the cocktail approach was employed to demonstratethe in vitro impact of two phytochemicals (i.e., yohimbine andresveratrol) towards CYP probe reactions, using the UHPLC–MSand UHPSFC–MS methods previously developed. For this purpose,numerous microsomal incubations were performed in triplicates(k = 3) and injected in triplicates (n = 3) in both analytical platforms.The reaction medium was relatively complex and contained themixture of 8 CYP probe substrates and their metabolites, 25 mMHEPES buffer at pH 7.4, 0.25 mg/mL of proteins (HLMs), an excessof NADPH as a co-factor, and acetonitrile as a stopping agent forthe microsomal reaction. Even if a precipitation of proteins andcentrifugation was performed as described in [13], the presence ofremaining proteins in the sample injection should be considered. Inthe case of UHPSFC conditions, both proteins and oligonucleotides(NADPH) might be weakly eluted from the stationary phase andcould induce a modification of the surface chemistry, leading to
undesired changes in chromatographic properties (i.e., retention,selectivity and peak width). To evaluate this issue, the retentiontimes were monitored during the injection of the incubated solu-tions. Three individual incubations in the absence of an inhibitor,
254 D. Spaggiari et al. / J. Chromatogr. A 1371 (2014) 244–256
F e., yohc olic rm
iwicraberte“t5dbFa
tspeiwrata
ig. 5. Determination of the in vitro inhibitory potential of two phytochemicals, i.ocktail approach and using UHPLC–MS and UHPSFC–MS. Microsomal CYP metabetabolic ratios obtained without inhibitors (100%).
n the presence of yohimbine and in the presence of resveratrolere injected in triplicates. Following the course of these 27
njections, the average RSD values for the retention times of the 16ompounds were 0.14% and 0.15% in UHPLC–MS and UHPSFC–MS,espectively. All the RSD values were between 0.0 and 0.2%, exceptcetaminophen in UHPLC (0.8%), coumarin in UHPSFC (0.6%) andupropion in UHPSFC (0.6%). However, this behaviour can be easilyxplained because these 3 compounds were the least stronglyetained compounds. These observations tend to demonstrate thathe presence of proteins and oligonucleotides was not critical forither of the two analytical techniques. Apart from the presence ofcritical” substances within the injection mixture, it is also impor-ant to consider that the final reaction medium was composed of0% of water and 50% of acetonitrile. This highly aqueous sampleiluent may be critical for the first eluted peaks in UHPSFC–MS,ut surprisingly no peak distortion was observed, as illustrated inig. 4. This observation confirms that UHPSFC can be considereds a viable strategy for in vitro metabolism studies.
After the triplicate injections of all of the incubation media,he peak areas were reported for all of the substrates and CYPpecific metabolites to assess the inhibition properties of the twohytochemicals. The analytical repeatability for the peak areas wasvaluated in both UHPLC–MS and UHPSFC–MS. The average inter-njection repeatability for the peak areas for the 16 compounds
as estimated at 7.7% and 10.5% for UHPLC–MS and UHPSFC–MS,
espectively, while the inter-incubation variability for the peakreas was 12.4 and 14.5% in UHPLC–MS and UHPSFC–MS, respec-ively. In all of the cases, the overall variability was found to becceptable (less than 20%), considering the fact that (i) biologicalimbine and resveratrol (both incubated at 10 �M), on the CYP activities with theatios obtained in presence of phytochemicals are expressed as percentage of the
samples were analyzed and (ii) MS detection was employedwithout any correction by a deuterated or chemically relatedinternal standard, generally included in the quenching solution.The variability achieved with UHPSFC–MS was always slightlysuperior to the variability with UHPLC–MS, but this difference wasnot critical for determining the inhibition properties.
To evaluate the impact of the selected phytochemicals onmicrosomal CYP activities, incubations including the tested com-pounds at 10 �M were compared to control incubations (i.e., withno inhibitors), as described by Spaggiari et al. [13]. Briefly, themetabolic ratios for all the CYPs, i.e., the ratios of the metabo-lite to the substrate peaks, were obtained in the presence ofyohimbine and resveratrol and expressed as a percentage of themetabolic ratios obtained in the control incubations. To bettervisualize the activity of all the major CYPs, percentages wererepresented using an octagonal radar plot representation of CYPphenotypic profiles, where each axis corresponds to the relativeactivity of the CYP reported in a logarithmic scale. As depictedin Fig. 5, the radar plots obtained for yohimbine and resveratrolwere quite similar, confirming that UHPLC–MS and UHPSFC–MSwere both able to characterize the in vitro inhibition proper-ties of xenobiotics. In the case of yohimbine, the activities of allof the CYPs were similar within 20%, except for CYP2D6. Thechromatographic peaks of dextromethorphan (increasing) and itsmetabolite dextrorphan (decreasing) were strongly affected; cor-
responding to a reduction of CYP2D6 activity by approximately20-fold and confirming that yohimbine is indeed a strong selectiveinhibitor of this isoform [30]. For resveratrol, the activity of CYP2E1(6-hydroxychlorzoxazone/chlorzoxazone ratio) was reduced by
atog
atCmma
icstcpo
4
cqiudr
mppptbpwtrwmwrtMa
wc22tHrb
UttTUtow
otfw
[
[
[
[
[
[
[
D. Spaggiari et al. / J. Chrom
pproximately a factor of 2, and the activity of the members ofhe CYP3A subfamily (1′-hydroxymidazolam/midazolam ratio) andYP1A2 (acetaminophen/phenacetin ratio) were diminished byore than 20%. These observations demonstrate that resveratroloderately inhibits CYP2E1 activity and weakly inhibits CYP1A2
nd CYP3A subfamily activities [31].Finally, the sensitivity achieved with the MS device employed
n this study was sufficient to draw reliable conclusions from theocktail approach. However, it is important to keep in mind that iftrong inhibitors of CYP2C9 were tested, it is highly probable thathe sensitivity of this particular MS detector would become insuffi-ient to discriminate the level of inhibition, because the amount ofroduced 4′-hydroxyflurbiprofen would be very low, and the LOQf this metabolite is relatively high, especially for UHPSFC–MS.
. Conclusion
A new strategy involving the combination of fully optimizedhromatographic method with a simple, compact and cheap singleuadrupole MS detector was proposed for a simple in vitro CYP
nhibition assay using the cocktail approach. This MS device wassed with both UHPLC and UHPSFC, and optimized methods wereeveloped to baseline resolve a mixture of 8 substrates and their 8espective CYP-specific metabolites.
The interest of this new compact MS was first highlighted for theethod development step. The use of such an MS device was found
articularly attractive for unambiguously identifying and trackingeaks during the method development and allows speeding up thisrocedure. In the case of UHPLC, a two-step strategy was applied. Inhe first stage, a screening procedure was applied to determine theest combination of a column, an organic modifier and a mobile-hase pH. Once the best combination was selected, the selectivityas further improved by adjusting the gradient profile, tempera-
ure and pH using HPLC modelling software. Ultimately, a baselineesolution of the 16 compounds was achieved, and the analysis timeas less than 7 min. A similar procedure was applied to develop aethod for UHPSFC. In this case, the optimization of the separationas carried out without the help of modelling software because the
etention models have not yet been described under the SFC condi-ions. However, due to the efficient peak tracking provided by the
S detector, a baseline separation was rapidly obtained, and thenalysis time was again less than 7 min.
Following the method development, the sensitivity achievedith this MS detector was evaluated under both UHPLC and UHPSFC
onditions for the 16 analytes of interest. The LOQs were between and 100 ng/mL in UHPLC–MS, while they ranged from 2 to00 ng/mL in UHPSFC–MS. As expected, the sensitivity in the nega-ive ESI mode was systematically lower than in the positive mode.owever, based on the concentrations generally employed for cur-
ent in vitro phase I metabolism assays, these LOQs were found toe sufficient.
Finally, the two developed analytical methods, UHPLC–MS andHPSFC–MS, were applied to an in vitro metabolism study using
he cocktail approach, where the aim was to evaluate the inhibi-ion properties of two phytochemicals, yohimbine and resveratrol.he same conclusions were drawn with both UHPLC–MS andHPSFC–MS, that yohimbine was a strong selective inhibitor of
he CYP2D6 subfamily, while resveratrol was a moderate inhibitorf the CYP1A2, CYP2E1 and CYP3A subfamily. These observationsere in line with previously published data.
In conclusion, this study confirms that the combination of fully
ptimized chromatographic methods (both in LC and SFC modes),ogether with single quadrupole detector may be a suitable strategyor in vitro CYP inhibition assay. Compared with the gold standardhich consists in using generic LC conditions together with[
r. A 1371 (2014) 244–256 255
state-of-the-art MS/MS devices, our methods may be easier to usefor a technician operating in a routine environment. In addition,the instrumental cost is significantly reduced and finally, appropri-ate levels of selectivity and sensitivity achieved with this approachwere demonstrated.
Acknowledgements
The authors wish to thank Frederic Forini, Joel Fricker, ValerieCarlezzo, Marco Rentsch, Stuart Chadwick and Mark Howdle fromWaters for stimulating discussions, valuable comments and for theloan of the Acquity H-class system as well as Acquity QDA detec-tor. The authors also thank Dr. Imre Molnar for the loan of Drylabsoftware (Drylab, Molnar-Institute, Berlin, Germany). Finally, SirineDandan is also acknowledged for her technical assistance to find outthe final SFC conditions.
References
[1] B. Testa, A. Pedretti, G. Vistoli, Foundation review: reactions and enzymes inthe metabolism of drugs and other xenobiotics, Drug Discov. Today 17 (2012)549–560.
[2] J.H. Lin, A.Y.H. Lu, Inhibition and induction of cytochrome P450 and the clinicalimplications, Clin. Pharmacokinet. 35 (1998) 361–390.
[3] D. Spaggiari, L. Geiser, S. Rudaz, Coupling ultra-high-pressure liquid chro-matography with mass spectrometry for in vitro drug metabolism studies,Trends Anal. Chem. (2014), http://dx.doi.org/10.1016/j.trac.2014.06.021.
[4] D. Spaggiari, L. Geiser, Y. Daali, S. Rudaz, A cocktail approach for assessing thein vitro activity of human cytochrome P450s: an overview of current method-ologies, J. Pharm. Biomed. Anal. 101 (2014) 221–237.
[5] A. Grand-Guillaume Perrenoud, J. Boccard, J.-V. Veuthey, D. Guillarme, Anal-ysis of basic compounds by supercritical fluid chromatography: attempts toimprove peak shape and maintain mass spectrometry compatibility, J. Chro-matogr. A 1262 (2012) 205–213.
[6] L. Novakova, A. Grand-Guillaume Perrenoud, I. Francois, C. West, E. Lesel-lier, D. Guillarme, Modern analytical supercritical fluid chromatography usingcolumns packed with sub-2 �m particles: a tutorial, Anal. Chim. Acta 824(2014) 18–35.
[7] A. Grand-Guillaume Perrenoud, J.L. Veuthey, D. Guillarme, Coupling state-of-the-art supercritical fluid chromatography and mass spectrometry: fromhyphenation interface optimization to high-sensitivity analysis of pharmaceu-tical compounds, J. Chromatogr. A 1339 (2014) 174–184.
[8] J. Castro-Perez, R. Plumb, J.H. Granger, L. Beattie, K. Joncour, A. Wright,Increasing throughput and information content for in vitro drug metabolismexperiments using ultra-performance liquid chromatography coupled to aquadrupole time-of-flight mass spectrometer, Rapid Commun. Mass Spectrom.19 (2005) 843–848.
[9] A. Tolonen, M. Turpeinen, A. Pelkonen, Liquid chromatography-mass spec-trometry in in vitro drug metabolite screening, Drug Discov. Today 14 (2009)120–133.
10] R.S. Plumb, W.B. Potts, P.D. Rainville, P.G. Alden, D.H. Shave, G. Bayn-ham, J.R. Mazzeo, Addressing the analytical throughput challenges in ADMEscreening using rapid ultra-performance liquid chromatography/tandem massspectrometry methodologies, Rapid Commun. Mass Spectrom. 22 (2008)2139–2152.
11] R. Nicoli, S. Martel, S. Rudaz, J.L. Wolfender, J.L. Veuthey, P.A. Carrupt, D. Guil-larme, Advances in LC platforms for drug discovery, Expert Opin. Drug Discov.5 (2010) 475–489.
12] K.A. Youdim, K.C. Saunders, A review of LC–MS techniques and high-throughputapproaches used to investigate drug metabolism by cytochrome P450s, J. Chro-matogr. B 878 (2010) 1326–1336.
13] D. Spaggiari, L. Geiser, Y. Daali, S. Rudaz, Phenotyping of CYP450 in humanliver microsomes using the cocktail approach, Anal. Bionanal. Chem. 406 (2014)4875–4887.
14] B. Debrus, D. Guillarme, S. Rudaz, Improved quality-by-design compliantmethodology for method development in reversed-phase liquid chromatog-raphy, J. Pharm. Biomed. Anal. 84 (2013) 215–223.
15] B.A. Huffman, M.L. Poltash, C.A. Hughey, Effect of polar protic and polaraprotic solvents on negative-ion electrospray ionization and chromato-graphic separation of small acidic molecules, Anal. Chem. 84 (2012) 9942–9950.
16] J. Schappler, R. Nicoli, D. Nguyen, S. Rudaz, J.L. Veuthey, D. Guillarme, Cou-pling ultra high-pressure liquid chromatography with single quadrupole massspectrometry for the analysis of a complex drug mixture, Talanta 78 (2009)
377–387.17] R. Kormany, I. Molnar, J. Fekete, D. Guillarme, S. Fekete, Robust UHPLC sep-aration method development for multi-API product containing amlodipineand bisoprolol: the impact of column selection, Chromatographia 77 (2014)1119–1127.

2 matog
[
[
[
[
[
[
[
[
[
[
[
[
[
56 D. Spaggiari et al. / J. Chro
18] R. Kormany, J. Fekete, D. Guillarme, S. Fekete, Reliability of simulated robustnesstesting in fast liquid chromatography, using state-of-the-art column technol-ogy, instrumentation and modelling software, J. Pharm. Biomed. Anal. 89 (2014)67–75.
19] R. Kormany, J. Fekete, D. Guillarme, S. Fekete, Reliability of computer-assistedmethod transfer between several column dimensions packed with 1.3–5 �mcore–shell particles and between various instruments, J. Pharm. Biomed. Anal.94 (2014) 188–195.
20] A. Grand-Guillaume Perrenoud, C. Hamman, G. Meenakshi, J.L. Veuthey, D.Guillarme, S. Fekete, Maximizing kinetic performance in supercritical fluidchromatography using state-of-the-art instruments, J. Chromatogr. A 1314(2013) 288–297.
21] A. Grand-Guillaume Perrenoud, J.L. Veuthey, D. Guillarme, Comparison ofultra-high performance supercritical fluid chromatography and ultra-highperformance liquid chromatography for the analysis of pharmaceutical com-pounds, J. Chromatogr. A 1266 (2012) 158–167.
22] S. Khater, C. West, E. Lesellier, Characterization of five chemistries and threeparticle sizes of stationary phases used in supercritical fluid chromatography,J. Chromatogr. A 1319 (2013) 148–159.
23] L. Nováková, P. Chocholous, P. Solich, Ultra-fast separation of estrogen steroids
using subcritical fluid chromatography on sub-2-micron particles, Talanta 121(2014) 178–186.24] L. Novakova, A. Grand-Guillaume Perrenoud, R. Nicoli, M. Saugy, J.L. Veuthey,D. Guillarme, Ultra high performance supercritical fluid chromatography cou-pled with tandem mass spectrometry for screening of doping agents. I:
[
r. A 1371 (2014) 244–256
Investigation of mobile phase and MS conditions, Anal. Chim. Acta (2014),http://dx.doi.org/10.1016/j.aca.2014.10.004.
25] M. Ashraf-Khorassani, L.T. Taylor, Subcritical fluid chromatography of watersoluble nucleobases on various polar stationary phases facilitated withalcohol-modified CO2 and water as the polar additive, J. Sep. Sci. 33 (2010)1682–1691.
26] L.R. Snyder, J.W. Dolan, High Performance Gradient Elution: The Practical Appli-cation of the Linear-Solvent-Strength Model, John Wiley & Sons, Hoboken, NJ,USA, 2007.
27] P.J. Schoenmakers, Optimization of Chromatographic Selectivity: A Guideto Method Development Journal of Chromatography Library, vol. 35, 1986,Amsterdam, The Netherlands.
28] J.N. Fairchild, J.F. Hill, P.C. Iraneta, Influence of sample solvent composition forSFC separations, LCGC N. Am. 31 (2013) 326–333.
29] A. Periat, I. Kohler, A. Bugey, S. Bieri, F. Versace, C. Staub, D. Guil-larme, Hydrophilic interaction chromatography versus reversed phase liquidchromatography coupled to mass spectrometry: effect of electrospray ion-ization source geometry on sensitivity, J. Chromatogr. A 1356 (2014)211–220.
30] B.M. Vandenbrink, R.S. Foti, D.A. Rock, L.C. Wienkers, J.L. Wahlstrom, Prediction
of CYP2D6 drug interactions from in vitro data: evidence for substrate-dependent inhibition, Drug Metab. Dispos. 40 (2011) 47–53.31] B. Piver, F. Berthou, Y. Dreano, D. Lucas, Inhibition of CYP3A, CYP1A and CYP2E1activities by resveratrol and other non volatile red wine components, Toxicol.Lett. 125 (2001) 83–91.