Comparison of Historical Precipitation for Aberdeen ...
92
South Dakota State University South Dakota State University Open PRAIRIE: Open Public Research Access Institutional Open PRAIRIE: Open Public Research Access Institutional Repository and Information Exchange Repository and Information Exchange Electronic Theses and Dissertations 2018 Comparison of Historical Precipitation for Aberdeen, Ipswich, and Comparison of Historical Precipitation for Aberdeen, Ipswich, and Eureka, South Dakota Eureka, South Dakota Uday Singh Kshatriya South Dakota State University Follow this and additional works at: https://openprairie.sdstate.edu/etd Part of the Civil and Environmental Engineering Commons, and the Water Resource Management Commons Recommended Citation Recommended Citation Kshatriya, Uday Singh, "Comparison of Historical Precipitation for Aberdeen, Ipswich, and Eureka, South Dakota" (2018). Electronic Theses and Dissertations. 2695. https://openprairie.sdstate.edu/etd/2695 This Thesis - Open Access is brought to you for free and open access by Open PRAIRIE: Open Public Research Access Institutional Repository and Information Exchange. It has been accepted for inclusion in Electronic Theses and Dissertations by an authorized administrator of Open PRAIRIE: Open Public Research Access Institutional Repository and Information Exchange. For more information, please contact [email protected].
Transcript of Comparison of Historical Precipitation for Aberdeen ...
South Dakota State University South Dakota State University
Open PRAIRIE: Open Public Research Access Institutional Open PRAIRIE: Open Public Research Access Institutional
Repository and Information Exchange Repository and Information Exchange
Electronic Theses and Dissertations
2018
Comparison of Historical Precipitation for Aberdeen, Ipswich, and Comparison of Historical Precipitation for Aberdeen, Ipswich, and
Eureka, South Dakota Eureka, South Dakota
Uday Singh Kshatriya South Dakota State University
Follow this and additional works at: https://openprairie.sdstate.edu/etd
Part of the Civil and Environmental Engineering Commons, and the Water Resource Management
Commons
Recommended Citation Recommended Citation Kshatriya, Uday Singh, "Comparison of Historical Precipitation for Aberdeen, Ipswich, and Eureka, South Dakota" (2018). Electronic Theses and Dissertations. 2695. https://openprairie.sdstate.edu/etd/2695
This Thesis - Open Access is brought to you for free and open access by Open PRAIRIE: Open Public Research Access Institutional Repository and Information Exchange. It has been accepted for inclusion in Electronic Theses and Dissertations by an authorized administrator of Open PRAIRIE: Open Public Research Access Institutional Repository and Information Exchange. For more information, please contact [email protected].
COMPARISON OF HISTORICAL PRECIPITATION FOR ABERDEEN, IPSWICH
AND EUREKA, SOUTH DAKOTA
BY
UDAY SINGH KSHATRIYA
A thesis submitted in partial fulfillment of the requirements for the degree
Master of Science
Major in Civil Engineering
South Dakota State University
2018
iii
ACKNOWLEDGMENTS
This is a good opportunity for me to express my sincere respect to my advisor, Dr.
Suzette R. Burckhard for her ‘patience’, inspiring guidance, outstanding cooperation,
constant encouragement, and for providing me the foundation for independent thinking that
inspired me in the most important moments of making right decisions throughout the study.
I still remember my low grades in the first semester at South Dakota State University. But
I’m proud to say that her constant support, critical appreciation and parental concern gave
a glitter of confidence to my studies and the foreground for this research. Her expertise,
understanding, work ethics, and passion for water and environmental engineering, and her
students will never be forgotten.
I thank my friends for their unconditional love, care, utmost cooperation and help
to complete this arduous task and for having stood by me every time. Words fail to express
my deepest gratitude and genuine love to the pillars of my strength my dad Rekha Singh
Kshatriya and mom Lalitha Bai Kshatriya for their belief in me and standing by my side
during my good and bad times. Their inevitable love, care and positively friendly
suggestions made me a better human being.
I honorably express my deepest gratefulness towards my parents for their godly
influence upon my life and their countless blessings. In spite of my modest attempt to enlist
every name whom I would like to pay my gratitude, if any person who have helped me in
one or the other way and have not been included in this list were greatly acknowledged by
me for their help.
iv
TABLE OF CONTENTS
LIST OF ABBREVIATIONS ……………………………………...….…….... vii
LIST OF FIGURES ………………………………………………………….......ix
LIST OF TABLES …………………………………………………………...…. x
ABSTRACT ………………………………….…….…………………………... xi
1. CHAPTER 1: INTRODUCTION ................................................................. 1
1.1 Background ................................................................................................... 1
1.2 Hydrologic cycle ........................................................................................... 1
1.3 Objectives ..................................................................................................... 2
1.4 Tasks ............................................................................................................. 2
2. CHAPTER 2: LITERATURE REVIEW ...................................................... 3
2.1 Background ................................................................................................... 3
2.2 Estimation Techniques for Missing Precipitation Data ................................ 4
3. CHAPTER 3: METHODOLOGY ................................................................ 7
3.1 Description of Study Area ............................................................................ 7
3.1.1 Geography of Aberdeen ......................................................................... 8
3.1.2 Geography of Ipswich ............................................................................ 9
3.1.3 Geography of Eureka ............................................................................. 9
3.2 Source of Data............................................................................................. 10
3.2 Conventions Used ....................................................................................... 11
v
3.2.1 Water Year ........................................................................................... 11
3.2.2 Statistical Analysis ............................................................................... 11
3.3 Estimating Missing Precipitation Data ....................................................... 12
3.4: Identification of Annual 8-Year periods .................................................... 16
3.5 Climate Periods ........................................................................................... 16
4. Chapter-4 Results ........................................................................................ 18
4.1 Climate for Aberdeen .................................................................................. 18
4.1.1: Monthly Precipitation of Aberdeen .................................................... 18
4.1.2: Annual Precipitation of Aberdeen ...................................................... 20
4.1.3: Cumulative 8-Year Precipitation Periods for Aberdeen ..................... 21
4.2 Climate for Ipswich..................................................................................... 23
4.2.1: Monthly Precipitation of Ipswich ....................................................... 23
4.2.2: Annual Precipitation of Ipswich ......................................................... 27
4.2.3: Cumulative 8-Year Precipitation Periods for Ipswich ........................ 28
4.3 Climate for Eureka ...................................................................................... 29
4.3.1: Monthly Precipitation of Eureka......................................................... 29
4.3.2: Annual Precipitation of Eureka ........................................................... 31
4.3.3: Cumulative 8-Year Precipitation Periods for Eureka ......................... 32
5. Chapter-5 Discussion .................................................................................. 34
5.1: Introduction ................................................................................................ 34
vi
5.2: Comparative Annual Precipitation............................................................. 34
5.3: Combined Annual 8-Year Periods ............................................................. 36
5.4: Mean Monthly Precipitation for Aberdeen, Ipswich and Eureka, SD ....... 38
6. Chapter-6 Conclusion ................................................................................. 44
7. Chapter 7 – Suggestions for Future Research ............................................. 46
8. References ................................................................................................... 47
9. Appendix: A: SEASONAL STATISTICS.................................................. 51
10. APPENDIX B: 8-YEAR PERIODS STATISTICS .................................... 69
vii
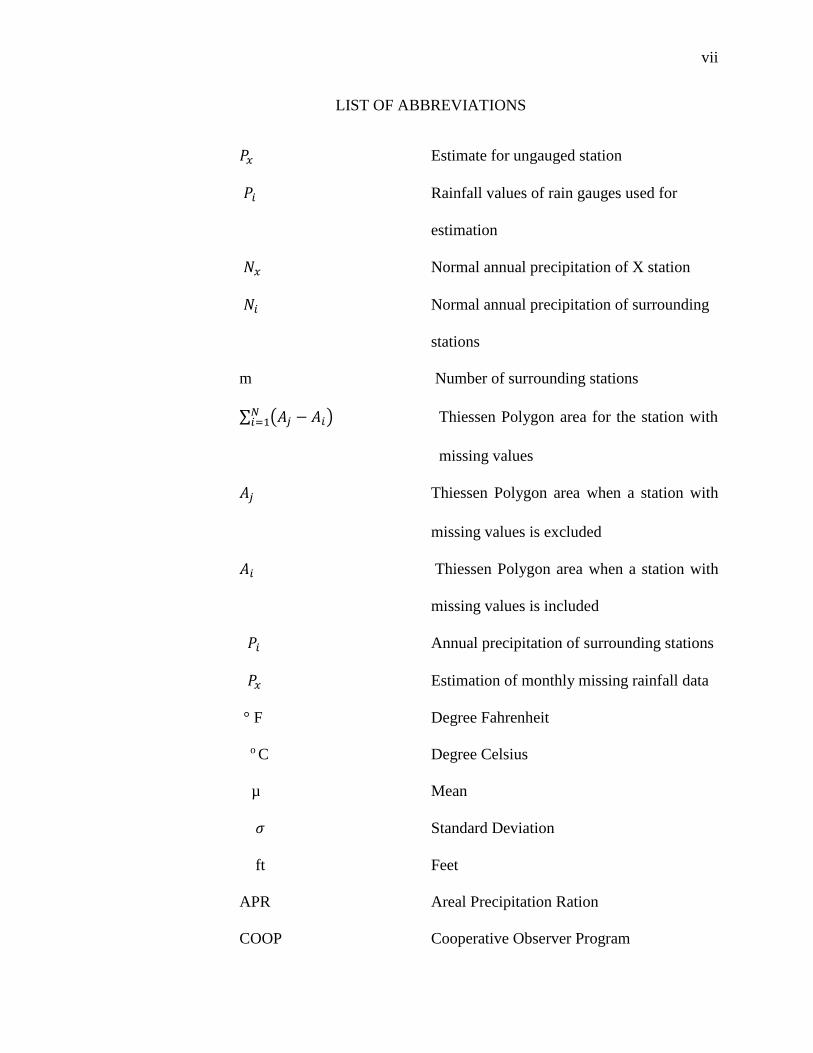
LIST OF ABBREVIATIONS
𝑃𝑥 Estimate for ungauged station
𝑃𝑖 Rainfall values of rain gauges used for
estimation
𝑁𝑥 Normal annual precipitation of X station
𝑁𝑖 Normal annual precipitation of surrounding
stations
m Number of surrounding stations
∑ (𝐴𝑗 − 𝐴𝑖)𝑁𝑖=1 Thiessen Polygon area for the station with
missing values
𝐴𝑗 Thiessen Polygon area when a station with
missing values is excluded
𝐴𝑖 Thiessen Polygon area when a station with
missing values is included
𝑃𝑖 Annual precipitation of surrounding stations
𝑃𝑥 Estimation of monthly missing rainfall data
° F Degree Fahrenheit
o C Degree Celsius
µ Mean
𝜎 Standard Deviation
ft Feet
APR Areal Precipitation Ration
COOP Cooperative Observer Program
viii
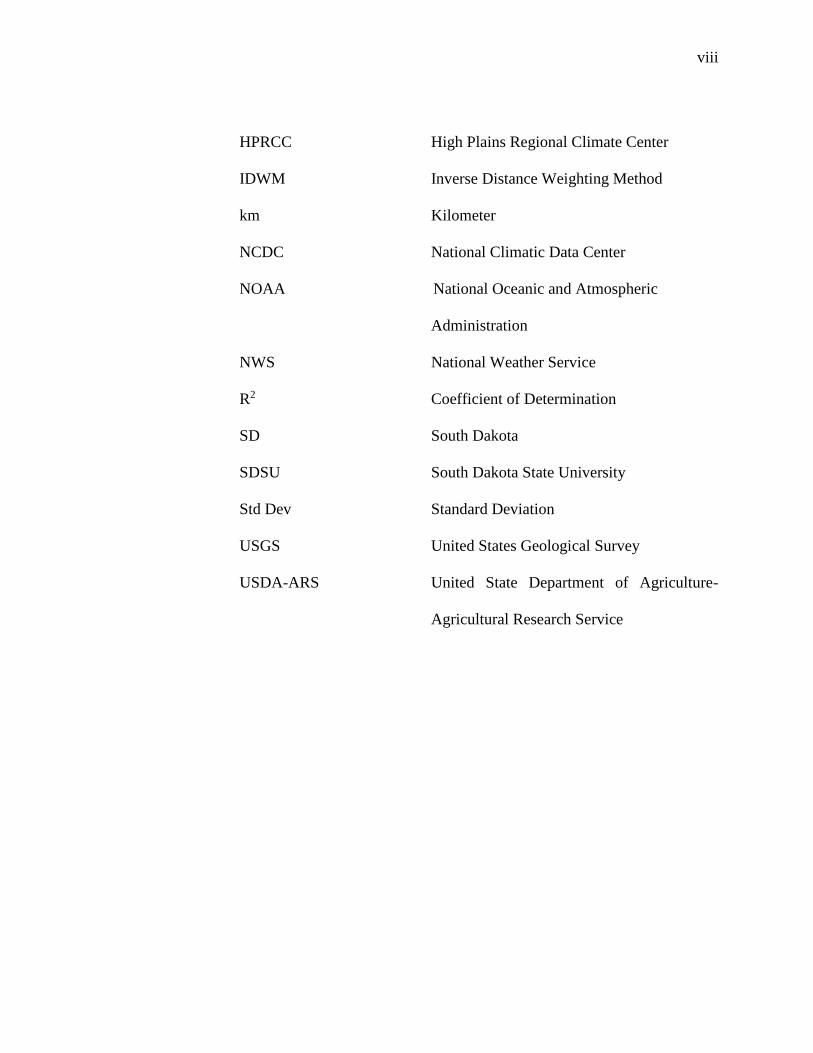
HPRCC High Plains Regional Climate Center
IDWM Inverse Distance Weighting Method
km Kilometer
NCDC National Climatic Data Center
NOAA National Oceanic and Atmospheric
Administration
NWS National Weather Service
R2 Coefficient of Determination
SD South Dakota
SDSU South Dakota State University
Std Dev Standard Deviation
USGS United States Geological Survey
USDA-ARS United State Department of Agriculture-
Agricultural Research Service
ix
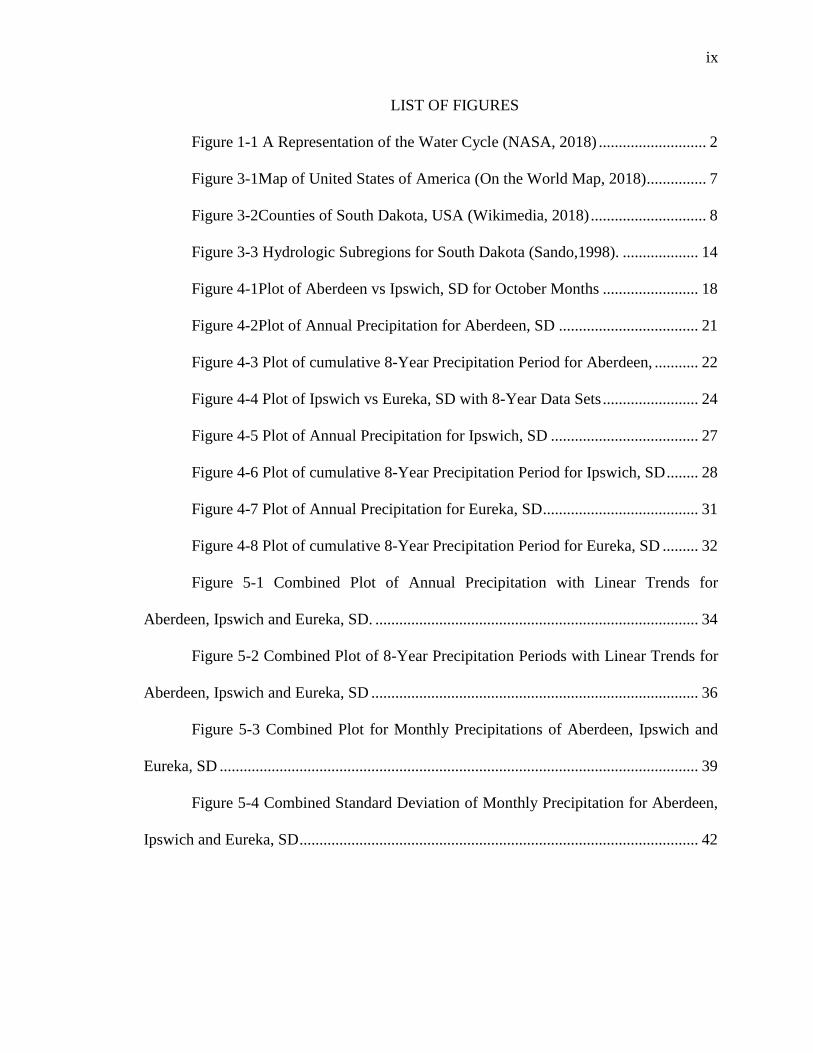
LIST OF FIGURES
Figure 1-1 A Representation of the Water Cycle (NASA, 2018) ........................... 2
Figure 3-1Map of United States of America (On the World Map, 2018)............... 7
Figure 3-2Counties of South Dakota, USA (Wikimedia, 2018) ............................. 8
Figure 3-3 Hydrologic Subregions for South Dakota (Sando,1998). ................... 14
Figure 4-1Plot of Aberdeen vs Ipswich, SD for October Months ........................ 18
Figure 4-2Plot of Annual Precipitation for Aberdeen, SD ................................... 21
Figure 4-3 Plot of cumulative 8-Year Precipitation Period for Aberdeen, ........... 22
Figure 4-4 Plot of Ipswich vs Eureka, SD with 8-Year Data Sets ........................ 24
Figure 4-5 Plot of Annual Precipitation for Ipswich, SD ..................................... 27
Figure 4-6 Plot of cumulative 8-Year Precipitation Period for Ipswich, SD ........ 28
Figure 4-7 Plot of Annual Precipitation for Eureka, SD ....................................... 31
Figure 4-8 Plot of cumulative 8-Year Precipitation Period for Eureka, SD ......... 32
Figure 5-1 Combined Plot of Annual Precipitation with Linear Trends for
Aberdeen, Ipswich and Eureka, SD. ................................................................................. 34
Figure 5-2 Combined Plot of 8-Year Precipitation Periods with Linear Trends for
Aberdeen, Ipswich and Eureka, SD .................................................................................. 36
Figure 5-3 Combined Plot for Monthly Precipitations of Aberdeen, Ipswich and
Eureka, SD ........................................................................................................................ 39
Figure 5-4 Combined Standard Deviation of Monthly Precipitation for Aberdeen,
Ipswich and Eureka, SD .................................................................................................... 42
x
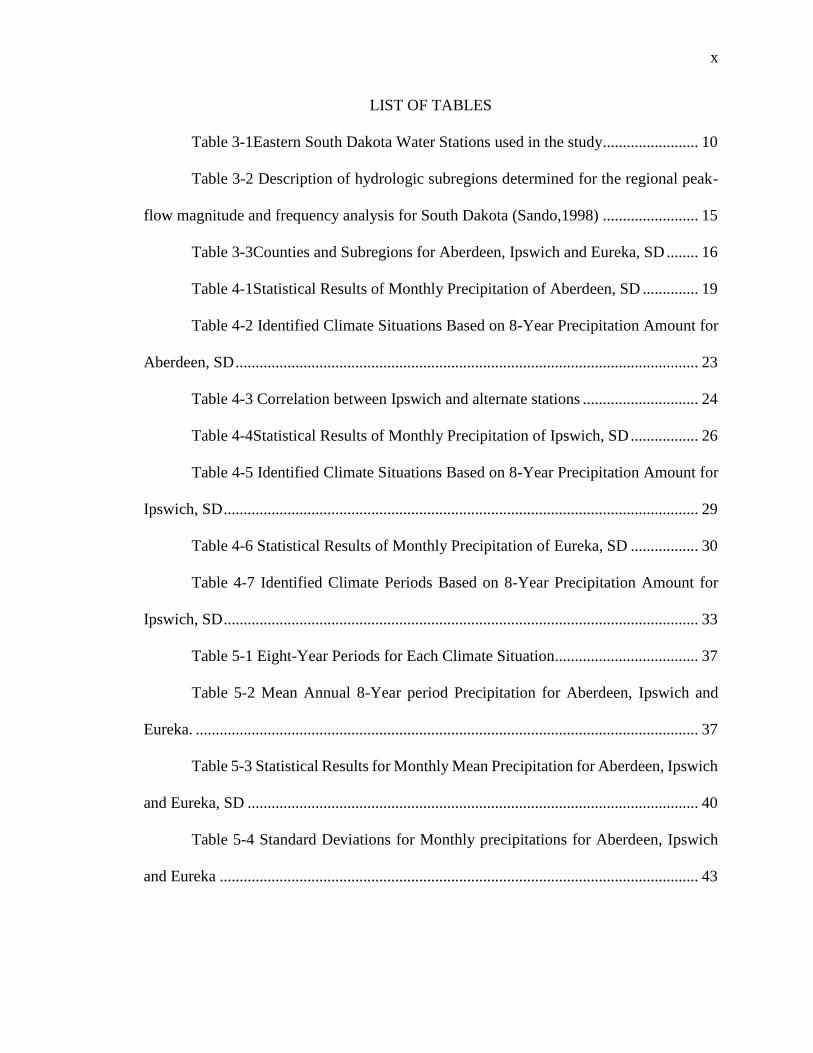
LIST OF TABLES
Table 3-1Eastern South Dakota Water Stations used in the study ........................ 10
Table 3-2 Description of hydrologic subregions determined for the regional peak-
flow magnitude and frequency analysis for South Dakota (Sando,1998) ........................ 15
Table 3-3Counties and Subregions for Aberdeen, Ipswich and Eureka, SD ........ 16
Table 4-1Statistical Results of Monthly Precipitation of Aberdeen, SD .............. 19
Table 4-2 Identified Climate Situations Based on 8-Year Precipitation Amount for
Aberdeen, SD .................................................................................................................... 23
Table 4-3 Correlation between Ipswich and alternate stations ............................. 24
Table 4-4Statistical Results of Monthly Precipitation of Ipswich, SD ................. 26
Table 4-5 Identified Climate Situations Based on 8-Year Precipitation Amount for
Ipswich, SD ....................................................................................................................... 29
Table 4-6 Statistical Results of Monthly Precipitation of Eureka, SD ................. 30
Table 4-7 Identified Climate Periods Based on 8-Year Precipitation Amount for
Ipswich, SD ....................................................................................................................... 33
Table 5-1 Eight-Year Periods for Each Climate Situation.................................... 37
Table 5-2 Mean Annual 8-Year period Precipitation for Aberdeen, Ipswich and
Eureka. .............................................................................................................................. 37
Table 5-3 Statistical Results for Monthly Mean Precipitation for Aberdeen, Ipswich
and Eureka, SD ................................................................................................................. 40
Table 5-4 Standard Deviations for Monthly precipitations for Aberdeen, Ipswich
and Eureka ........................................................................................................................ 43
xi
ABSTRACT
COMPARISON OF HISTORICAL PRECIPITATION FOR ABERDEEN, IPSWICH
AND EUREKA, SOUTH DAKOTA
UDAY SINGH KSHATRIYA
2018
The availability of water resources varies from time to time with the climate
conditions. Keeping track of climate conditions would eventually benefit for the future
predictions. The objective of this research was to compare and contrast the climate
especially for Aberdeen, Ipswich and Eureka, South Dakota utilizing the historical monthly
precipitation records and to develop the techniques that are reliable to estimate the missing
data. For these necessary statistical analyses were performed using the monthly
precipitation data from High Plains Regional Climate Center (HPRCC) for the annual and
8-Year periods for Aberdeen, Ipswich and Eureka, South Dakota. 63 water years of
precipitation data were used for the study to develop the climate periods for ‘Dry’,
‘Moderately Dry’, ‘Mean’, ‘Moderately Wet’ and ‘Wet’. The results were compared with
the previous studies and concluded that the maximum precipitation in a year occurs for the
month of June in the summer season and the minimum precipitation occurs for the month
of January in winter. The highest variability in precipitation was for the months of June,
July and August. This study also confirms the results from similar previous studies of
different geographic areas in South Dakota, USA.
1
CHAPTER 1: INTRODUCTION
1.1 Background
Climate change is an alarming factor in recent years due to rapid urbanization and
increase in global warming. Atmospheric concentrations of carbon dioxide and carbon
monoxide are increasing at an alarming rate leads to increase in surface temperature.
Imbalance in the hydrologic cycle is due to increase in surface temperature in the
atmosphere. Changes in climatic conditions, for example, precipitation, temperature, wind,
and dissipation can cause extensive and fast changes in stream flow and more slow changes
in groundwater flow (Robson and Stewart, 1990).
Creating climatic situations incorporate concentrate climatic variability in the
hydrologic cycle. For example, evaporation, precipitation, temperature, relative humidity,
wind speed (Amatya, 2011).
1.2 Hydrologic cycle
The hydrologic cycle starts with the evaporation of water from the surface of the
sea. As humid air is lifted, it cools, and water vapor consolidates to form clouds. Dampness
is transported the world over until the point when it comes back to the surface as
precipitation. The evaporation of water is usually estimated using evaporation pans, has
been diminishing in the recent decades over extensive territories with various atmospheres.
The basic interpretation is that the pattern is identified with expanding cloudiness,
furthermore, that it gives a sign of diminishing potential evaporation and a diminishing
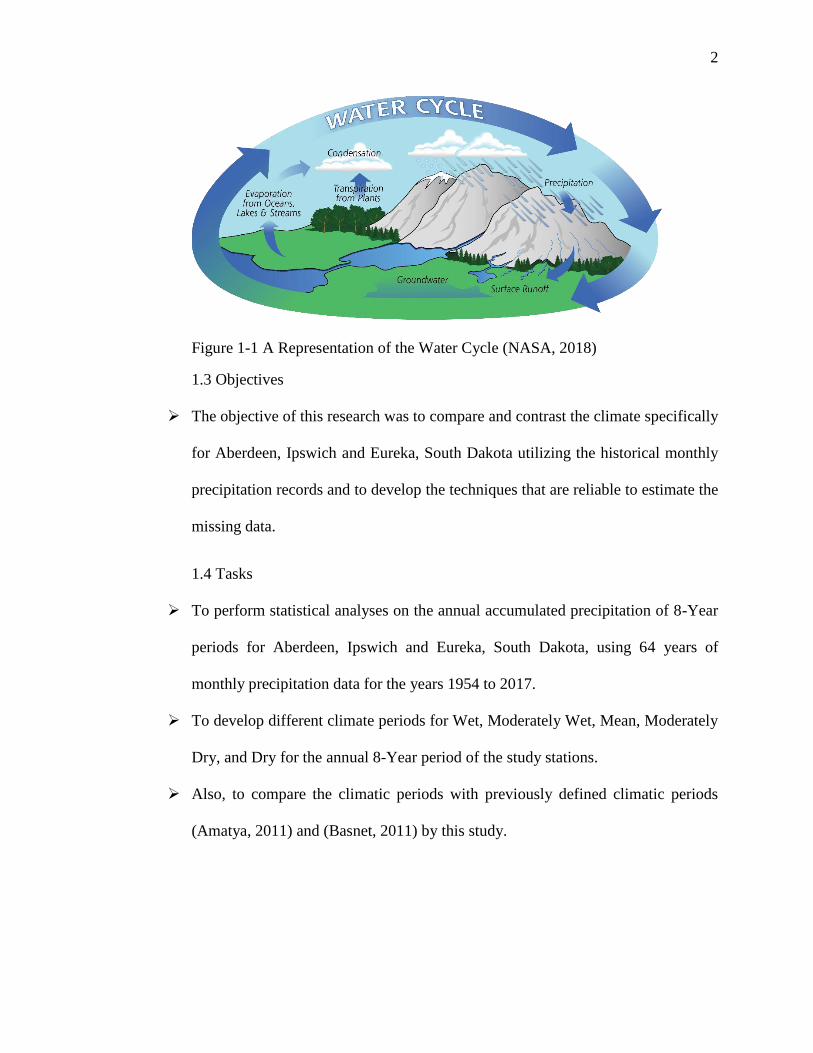
terrestrial evaporation part in the hydrologic cycle. Figure 1.1 represents hydrologic cycle
consists of evaporation, transpiration, condensation and precipitation (Brutsaert, &
Parlange, 1998).
2
Figure 1-1 A Representation of the Water Cycle (NASA, 2018)
1.3 Objectives
➢ The objective of this research was to compare and contrast the climate specifically
for Aberdeen, Ipswich and Eureka, South Dakota utilizing the historical monthly
precipitation records and to develop the techniques that are reliable to estimate the
missing data.
1.4 Tasks
➢ To perform statistical analyses on the annual accumulated precipitation of 8-Year
periods for Aberdeen, Ipswich and Eureka, South Dakota, using 64 years of
monthly precipitation data for the years 1954 to 2017.
➢ To develop different climate periods for Wet, Moderately Wet, Mean, Moderately
Dry, and Dry for the annual 8-Year period of the study stations.
➢ Also, to compare the climatic periods with previously defined climatic periods
(Amatya, 2011) and (Basnet, 2011) by this study.
3
CHAPTER 2: LITERATURE REVIEW
2.1 Background
Water is one of the primary sources of living for any species on the Earth. The water
on the Earth is available by means of surface water and groundwater. Precipitation is water
discharged from mists as rain, slush, snow, or hail. It is the essential association in the
water cycle that accommodates the conveyance of atmospheric water to the Earth.
Technically in precipitation, only rain and snow are important (McCuen, 2005).
The availability of water depends on the climatic condition of the region. South
Dakota is a continental climate. Continental climate is portrayed by hot summers, chilly
winters, and little precipitation. Generally, continental climate occurs in the central portion
of the continent. South Dakota is considered to be continental due to its geographical
location in central North America equally distant from the Atlantic and Pacific oceans
(Hogan. et al., 2001).
Cyclones and droughts in the Great Plains are natural calamities that occur during
extreme precipitation and temperature conditions. Occasional variations in precipitation on
a watershed result in variations in stream flow that can affect the availability of water. An
investigation was carried out to assess the effect of occasional speculative variations in
precipitation on streamflow (Van Liew et al., 2003). The goal was to build a prototype for
streamflow response along with a range of hypothetical precipitation forecasts. The
prototype was developed for the 33 km2 subwatershed, 442, located in the United States
Department of Agriculture-Agricultural Research Service (USDA-ARS) Little Washita
River Experimental Watershed in Southwestern Oklahoma. The Soil and Water
Assessment Tool was used to determine streamflow responses to hypothetical precipitation
4
forecasts that represent changes of ±20% and ±40% for the fall quarter. Results of this
study indicated that when precipitation events that are drier than normal were used, the
streamflow responses approached baseflow conditions on the watershed, while using
wetter than normal precipitation lead to higher streamflow values which were characterized
by considerable variability which was attributed to variations in storm size, duration, and
intensity during the fall months (Van Liew et al., 2003). Twentieth-century patterns of
precipitation have been studied by an assortment of strategies to determine how
precipitation has changed or differed over the years. One study noted that since 1910,
precipitation has increased by approximately 10% over the continental United States (Karl
& Knight, 1998).
Different climatic scenarios were developed using the accumulated annual
precipitation data for 8-Year periods for Aberdeen, South Dakota. Outcomes of this
research concluded that the developed climatic scenarios using one-year climatic data may
not produce the accurate results for the 8-Year climatic scenario (Basnet, 2011). Another
similar kind of approach was performed for five stations in Eastern South Dakota to
develop the climatic scenarios using evaporation and precipitation data. Also, the results
were compared with the climatic scenarios developed by USGS study (Amatya, 2011).
2.2 Estimation Techniques for Missing Precipitation Data
Distance-weighted and data-driven strategies are widely utilized for estimation of
missing precipitation data. Inverse distance weighting method (IDWM) is a standout
amongst most of the time utilized techniques for evaluating missing precipitation values at
a gauge in view of values recorded at all other accessible account gauges. Conceptual
improvements were introduced in the IDWM method that led to several modified distance-
5
based methods. These strategies were tested for estimation of missing precipitation data.
Historical precipitation data from 20 rain-checking stations in the state of Kentucky, USA.
(Teegavarapu & Chandramouli, 2005).
The Normal ratio method is used when annual precipitation exceeds 10% of the
considered gauge. This method weights the effect of each surrounding station based on
normal precipitation for that station and the missing station (Singh, 1994). The following
equation estimates the missing data.
𝑃𝑥 =1
𝑚∑[
𝑁𝑥
𝑁𝑖
𝑚
𝑖=1
] 𝑃𝑖
Where 𝑃𝑥 = Estimate for ungauged station
𝑃𝑖 = Rainfall values of rain gauges used for estimation
𝑁𝑥 = Normal annual precipitation of X station
𝑁𝑖 = normal annual precipitation of surrounding stations
m = Number of surrounding stations
Areal Precipitation Ratio (APR) method was developed based on spatial
distribution of daily rainfall without accounting for historical recurrence. The technique
related point precipitation records to Thiessen Polygon areas. The APR method assumes
the contribution of rainfall from surrounding stations is proportionate to the areal
contribution of each sub-catchment (Thiessen polygon area claimed by each station without
considering the missing gauge) when the station of missing values is excluded (De Silva et
al., 2007). The formula for the APR method is as follows
𝑃𝑥 = ∑ [(𝐴𝑗 − 𝐴𝑖)𝑃𝑖]𝑁
𝑖=1
∑ (𝐴𝑗 − 𝐴𝑖)𝑁𝑖=1
Where ∑ (𝐴𝑗 − 𝐴𝑖)𝑁𝑖=1 = Thiessen Polygon area for the station with missing values

6
𝐴𝑗 = Thiessen Polygon area when a station with missing values is excluded
𝐴𝑖 = Thiessen Polygon area when a station with missing values is included
𝑃𝑖 = Annual precipitation of surrounding stations
𝑃𝑥 = Estimation of monthly missing rainfall data
7
CHAPTER 3: METHODOLOGY
3.1 Description of Study Area
South Dakota, USA is approximately 1300 miles equally distant from the Atlantic
and Pacific oceans. It is in central North America i.e., a Midwestern portion of the United
States of America. South Dakota is the seventeenth largest by area which is surrounded by
six states, North Dakota in the north, Minnesota and Iowa in the east, Nebraska in the south,
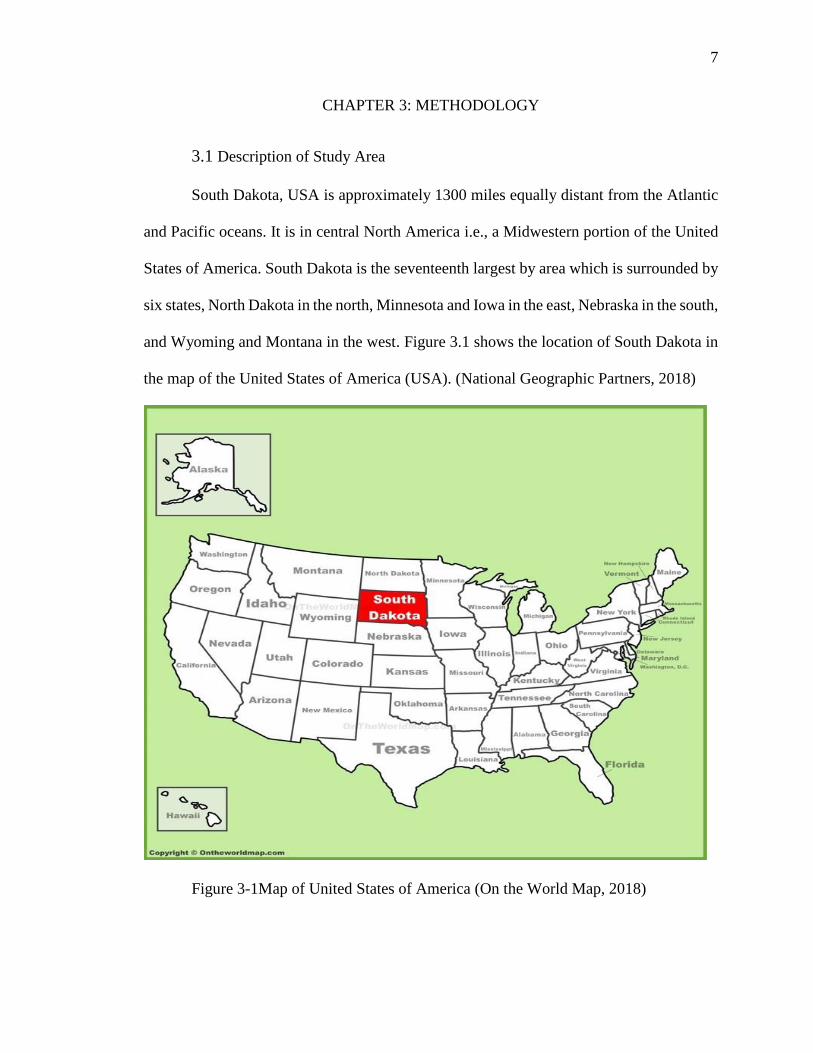
and Wyoming and Montana in the west. Figure 3.1 shows the location of South Dakota in
the map of the United States of America (USA). (National Geographic Partners, 2018)
Figure 3-1Map of United States of America (On the World Map, 2018)
8
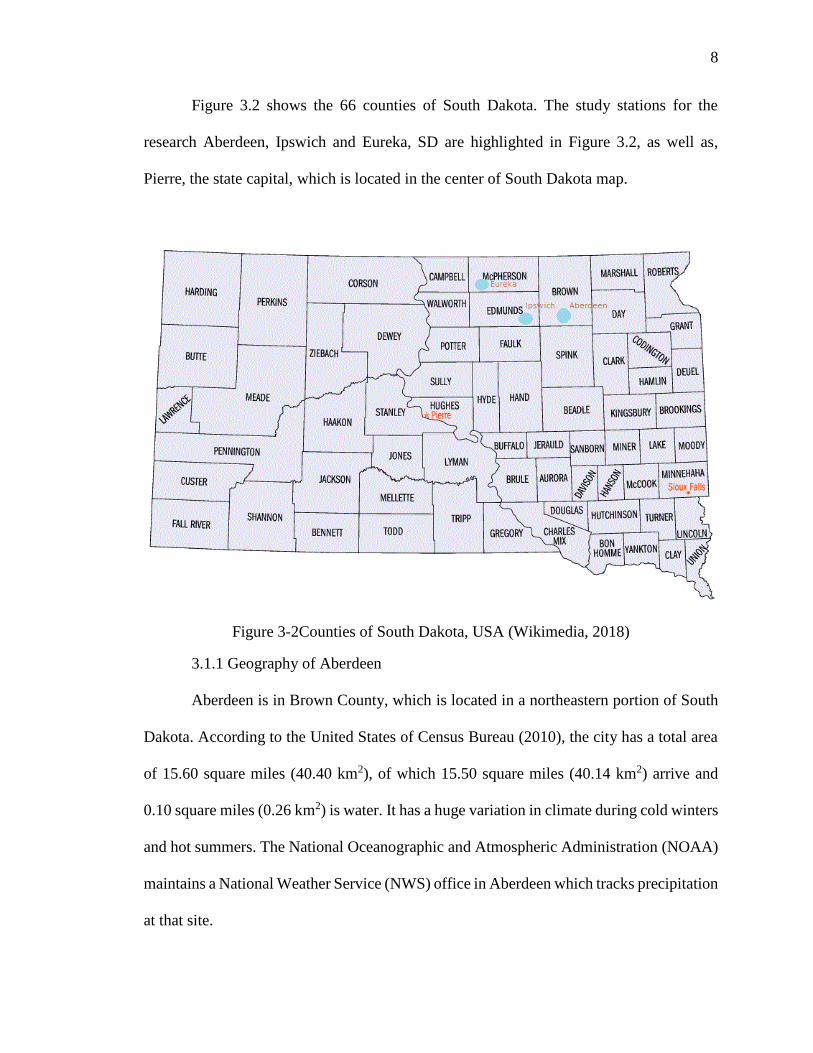
Figure 3.2 shows the 66 counties of South Dakota. The study stations for the
research Aberdeen, Ipswich and Eureka, SD are highlighted in Figure 3.2, as well as,
Pierre, the state capital, which is located in the center of South Dakota map.
Figure 3-2Counties of South Dakota, USA (Wikimedia, 2018)
3.1.1 Geography of Aberdeen
Aberdeen is in Brown County, which is located in a northeastern portion of South
Dakota. According to the United States of Census Bureau (2010), the city has a total area
of 15.60 square miles (40.40 km2), of which 15.50 square miles (40.14 km2) arrive and
0.10 square miles (0.26 km2) is water. It has a huge variation in climate during cold winters
and hot summers. The National Oceanographic and Atmospheric Administration (NOAA)
maintains a National Weather Service (NWS) office in Aberdeen which tracks precipitation
at that site.
9
3.1.2 Geography of Ipswich
Ipswich is 1.34 square mile area city in Edmunds County, SD. In Ipswich summers
are warm and winters are freezing and dry. The warmest season lasts for approximately 4
months with temperature varies from 850𝐹 to 610𝐹. The winter season lasts for 3 and half
months with 60𝐹 to 240𝐹 A wet day is considered only if it has at least 0.04 inches of
liquid or any other form of precipitation. The pattern of precipitation or wet days in Ipswich
does not follow a specific discernible trend or pattern throughout the year other than having
more wet days during some months. The wetter period lasts for five months, from April
through September (Weather spark, 2018).
3.1.3 Geography of Eureka
Eureka has almost the similar geographical type of Ipswich and Aberdeen.
Eureka is a city in McPherson County, South Dakota. According to the United States
Census Bureau (2010), The city has a total area of 1.00 square mile (2.59 km2), of which,
0.93 square miles (2.41 km2) is land and 0.07 square miles (0.18 km2) is water. The average
yearly temperature in Eureka is cool at 5.8 °C (42.4 °F). There is a variety of normal month
to month temperatures of 34.5 °C (62.1°F) which is above the moderate rate range. There
is a range/variety of normal diurnal temperatures of 13.7 °C (24.7 °F). The hottest month
(July) is extremely warm having a mean temperature of 22.1 °C (71.78 °F). The coldest
month (January) is exceptionally cool having a normal temperature of - 12.4 °C (9.68 °F)
(Climatemps.com, 2018).

10
3.2 Source of Data
The primary source of climate data for the research is obtained from High Plains
Regional Climate Center (HPRCC, 2018). The Cooperative Observer Program (COOP) is
a volunteer network of observers which collects and reports on the Nation’s weather and
climate. The purpose of the COOP is to provide the observational climatic data like 24-
hour precipitation totals, maximum and minimum temperatures and rains. The data were
obtained at: https://www.ncdc.noaa.gov/data-access/land-based-station-data/land-based-
datasets/cooperative-observer-network-coop
The precipitation data required for the study was obtained from High Plains
Regional Climatic Center (HPRCC). The data range available for each station was not
consistent, i.e., a different set of data periods were available. So, the common data periods
were adjusted to 1954 to 2017 which turned out to be 64 years of monthly precipitation
data for Aberdeen, Ipswich and Eureka, SD, according to the US Geological Survey (2018).
The raw data were further adjusted to water year which starts from October 1 to September
30 of every year.
Table 3-1Eastern South Dakota Water Stations used in the study
Stations County COOP ID
Number
Climate Data No. of Years
Aberdeen Brown 390020 Precipitation 1954-2017
Ipswich Edmunds 394206 Precipitation 1954-2017
Eureka McPherson 392797 Precipitation 1954-2017
Table 3.1 shows the stations considered for the study, location, Cooperative
Observer station (COOP) and the number of years of record used for the analysis.
11
3.2 Conventions Used
3.2.1 Water Year
In general, a year is considered to be twelve months which is from January 1
through December 31. A water year is also known as a hydrological year or a discharge
year which deals with the surface water supply. According to the USGS (2018), the
hydrological year or discharge year is defined as “the 12-month period October 1, for any
given year through September 30, of the following year. The water year is designated by
the calendar year in which it ends and which includes 9 of the 12 months. Thus, the year
ending September 30, 1999 is called the "1999" water year.”
3.2.2 Statistical Analysis
Data were assumed to be Normally distributed based on prior research by Basnet
(2011). The terms that have been used in the statistical analysis in the process of the thesis
are explained in detail below:
Mean (Average)
The mean is simply often referred to as the average of a given set of numbers. It is
the sum of the given set of numbers divided by a total number of items in the set. The mean
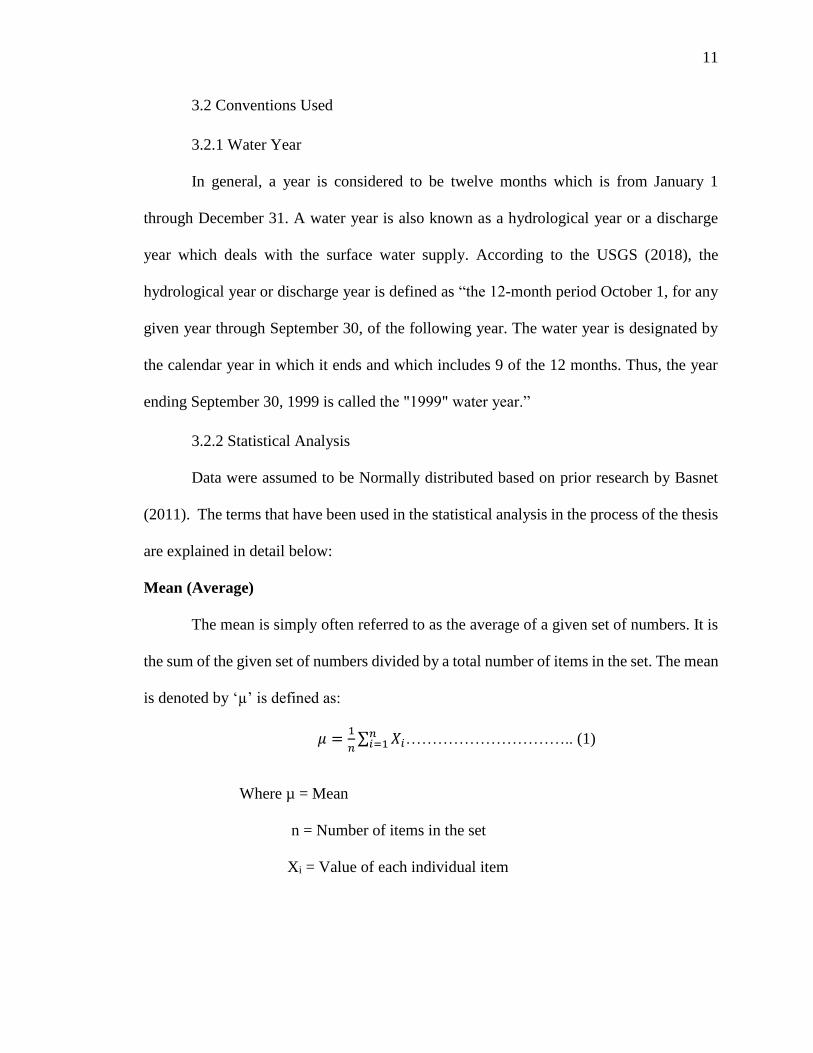
is denoted by ‘µ’ is defined as:
𝜇 =1
𝑛∑ 𝑋𝑖
𝑛𝑖=1 ………………………….. (1)
Where µ = Mean
n = Number of items in the set
Xi = Value of each individual item
12
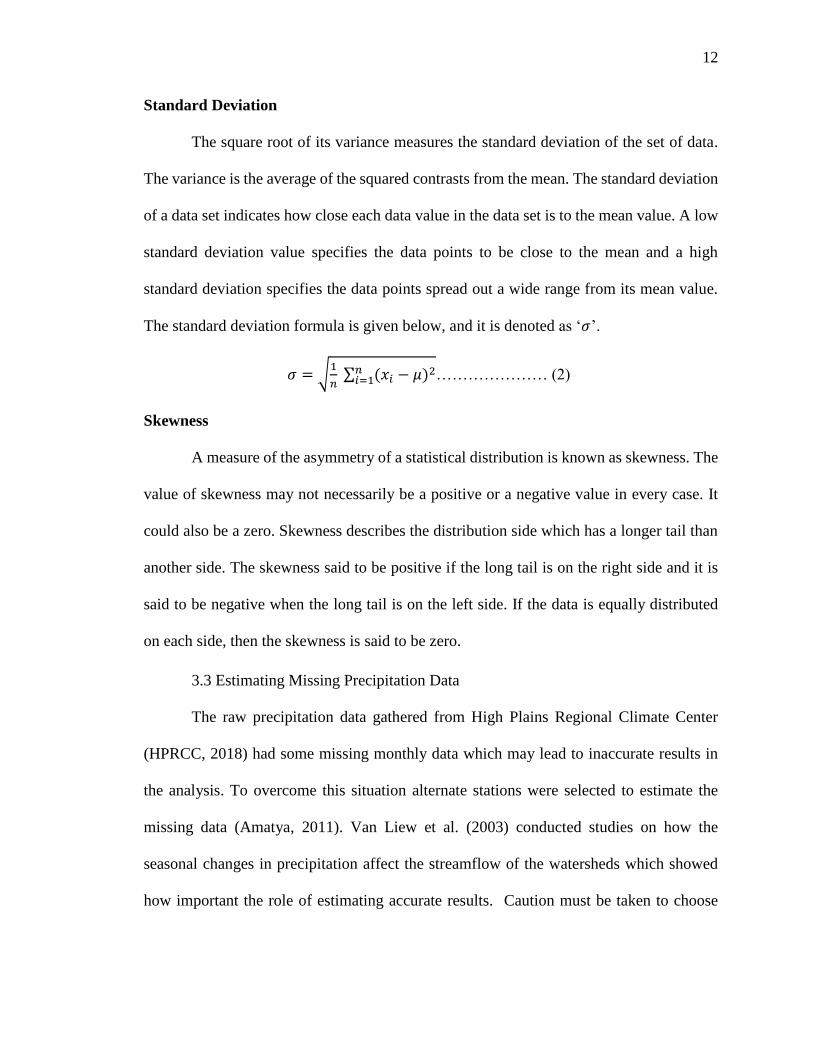
Standard Deviation
The square root of its variance measures the standard deviation of the set of data.
The variance is the average of the squared contrasts from the mean. The standard deviation
of a data set indicates how close each data value in the data set is to the mean value. A low
standard deviation value specifies the data points to be close to the mean and a high
standard deviation specifies the data points spread out a wide range from its mean value.
The standard deviation formula is given below, and it is denoted as ‘𝜎’.
𝜎 = √1
𝑛 ∑ (𝑥𝑖 − 𝜇)2𝑛
𝑖=1 ………………… (2)
Skewness
A measure of the asymmetry of a statistical distribution is known as skewness. The
value of skewness may not necessarily be a positive or a negative value in every case. It
could also be a zero. Skewness describes the distribution side which has a longer tail than
another side. The skewness said to be positive if the long tail is on the right side and it is
said to be negative when the long tail is on the left side. If the data is equally distributed
on each side, then the skewness is said to be zero.
3.3 Estimating Missing Precipitation Data
The raw precipitation data gathered from High Plains Regional Climate Center
(HPRCC, 2018) had some missing monthly data which may lead to inaccurate results in
the analysis. To overcome this situation alternate stations were selected to estimate the
missing data (Amatya, 2011). Van Liew et al. (2003) conducted studies on how the
seasonal changes in precipitation affect the streamflow of the watersheds which showed
how important the role of estimating accurate results. Caution must be taken to choose
13
stations for comparison so that the estimated values are not biased to the trend at the
comparison station.
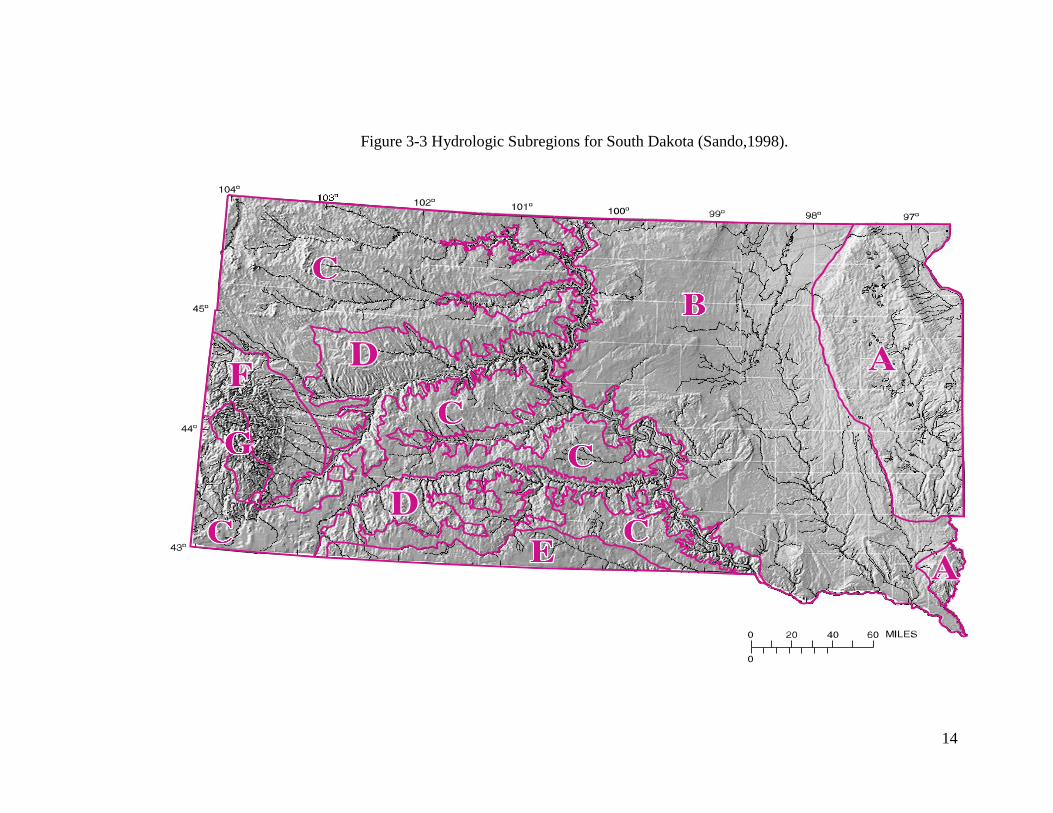
The alternate stations were identified using Sando (1998) who developed the
hydrologic subregions for the regional peak-flow magnitude for South Dakota (Figure 3.3).
The subregions specified in Figure 3.3 is explained in Table 3.2. As the streamflow and the
precipitation are related to each other, Table 3.3 shows the alternative stations which are
selected within the specific hydrologic subregions to estimate missing precipitation records
(see Appendix A for dataset).
14
Figure 3-3 Hydrologic Subregions for South Dakota (Sando,1998).
15
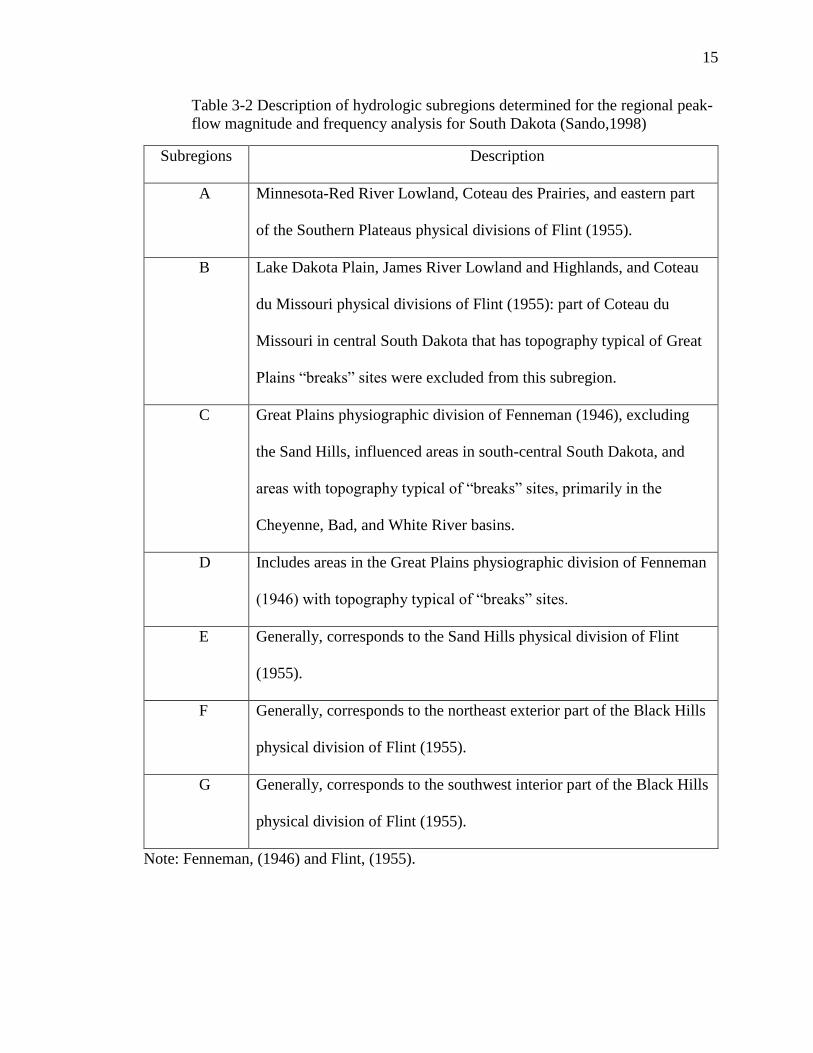
Table 3-2 Description of hydrologic subregions determined for the regional peak-
flow magnitude and frequency analysis for South Dakota (Sando,1998)
Subregions Description
A Minnesota-Red River Lowland, Coteau des Prairies, and eastern part
of the Southern Plateaus physical divisions of Flint (1955).
B Lake Dakota Plain, James River Lowland and Highlands, and Coteau
du Missouri physical divisions of Flint (1955): part of Coteau du
Missouri in central South Dakota that has topography typical of Great
Plains “breaks” sites were excluded from this subregion.
C Great Plains physiographic division of Fenneman (1946), excluding
the Sand Hills, influenced areas in south-central South Dakota, and
areas with topography typical of “breaks” sites, primarily in the
Cheyenne, Bad, and White River basins.
D Includes areas in the Great Plains physiographic division of Fenneman
(1946) with topography typical of “breaks” sites.
E Generally, corresponds to the Sand Hills physical division of Flint
(1955).
F Generally, corresponds to the northeast exterior part of the Black Hills
physical division of Flint (1955).
G Generally, corresponds to the southwest interior part of the Black Hills
physical division of Flint (1955).
Note: Fenneman, (1946) and Flint, (1955).
16
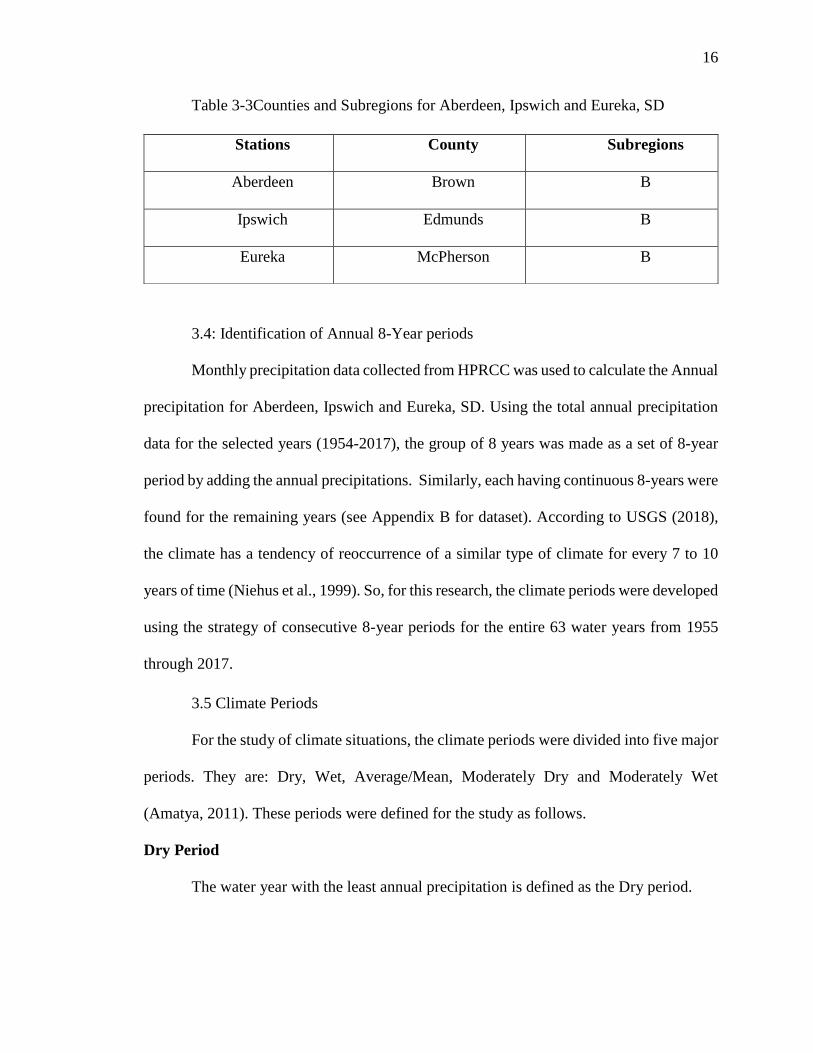
Table 3-3Counties and Subregions for Aberdeen, Ipswich and Eureka, SD
3.4: Identification of Annual 8-Year periods
Monthly precipitation data collected from HPRCC was used to calculate the Annual
precipitation for Aberdeen, Ipswich and Eureka, SD. Using the total annual precipitation
data for the selected years (1954-2017), the group of 8 years was made as a set of 8-year
period by adding the annual precipitations. Similarly, each having continuous 8-years were
found for the remaining years (see Appendix B for dataset). According to USGS (2018),
the climate has a tendency of reoccurrence of a similar type of climate for every 7 to 10
years of time (Niehus et al., 1999). So, for this research, the climate periods were developed
using the strategy of consecutive 8-year periods for the entire 63 water years from 1955
through 2017.
3.5 Climate Periods
For the study of climate situations, the climate periods were divided into five major
periods. They are: Dry, Wet, Average/Mean, Moderately Dry and Moderately Wet
(Amatya, 2011). These periods were defined for the study as follows.
Dry Period
The water year with the least annual precipitation is defined as the Dry period.
Stations County Subregions
Aberdeen Brown B
Ipswich Edmunds B
Eureka McPherson B

17
Wet Period
The water year with the highest amount of precipitation is defined as the Wet
period.
Average Period
The period with an average amount of precipitation is said to be the Average period.
Moderately Wet Period
The Moderately Wet period is obtained by calculating the mean of the period plus
its standard deviation. The periods that lies between the average plus standard deviation is
called Moderately Wet period.
Moderately Dry Period
The Moderately Dry period is obtained by subtracting the standard deviation from
the average.
18
CHAPTER-4: RESULTS
4.1 Climate for Aberdeen
4.1.1: Monthly Precipitation of Aberdeen
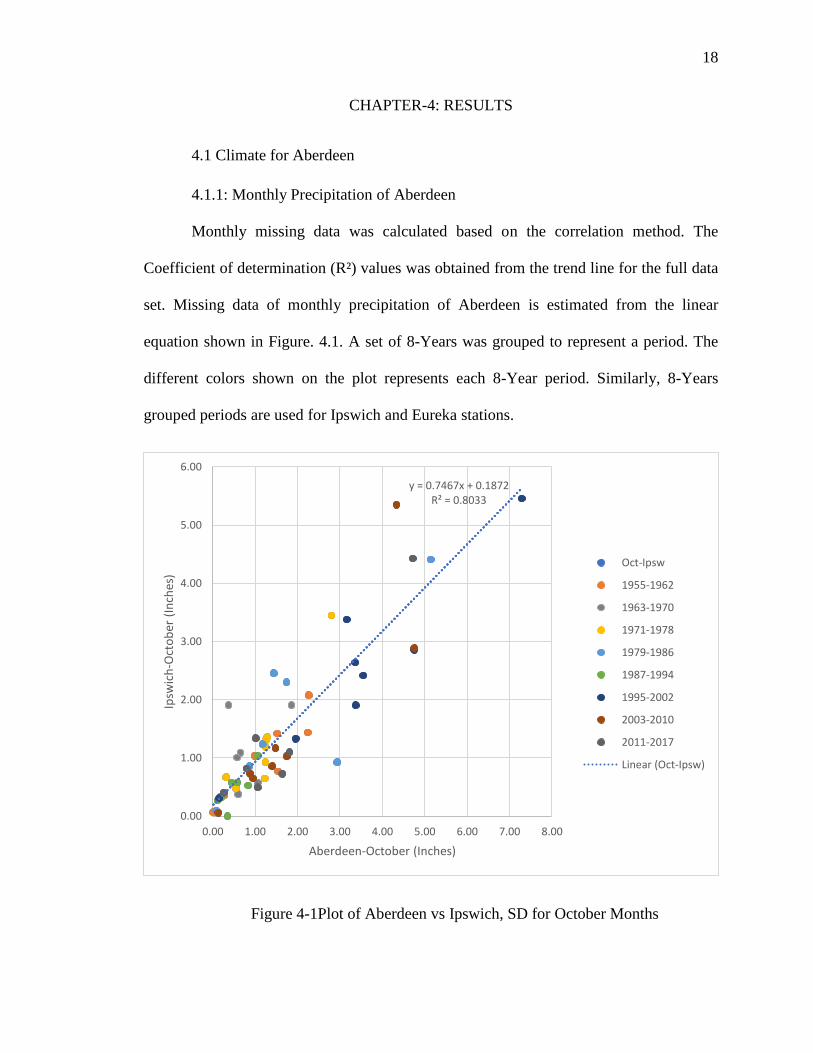
Monthly missing data was calculated based on the correlation method. The
Coefficient of determination (R²) values was obtained from the trend line for the full data
set. Missing data of monthly precipitation of Aberdeen is estimated from the linear
equation shown in Figure. 4.1. A set of 8-Years was grouped to represent a period. The
different colors shown on the plot represents each 8-Year period. Similarly, 8-Years
grouped periods are used for Ipswich and Eureka stations.
Figure 4-1Plot of Aberdeen vs Ipswich, SD for October Months
y = 0.7467x + 0.1872R² = 0.8033
0.00
1.00
2.00
3.00
4.00
5.00
6.00
0.00 1.00 2.00 3.00 4.00 5.00 6.00 7.00 8.00
Ipsw
ich
-Oct
ob
er (
Inch
es)
Aberdeen-October (Inches)
Oct-Ipsw
1955-1962
1963-1970
1971-1978
1979-1986
1987-1994
1995-2002
2003-2010
2011-2017
Linear (Oct-Ipsw)
19
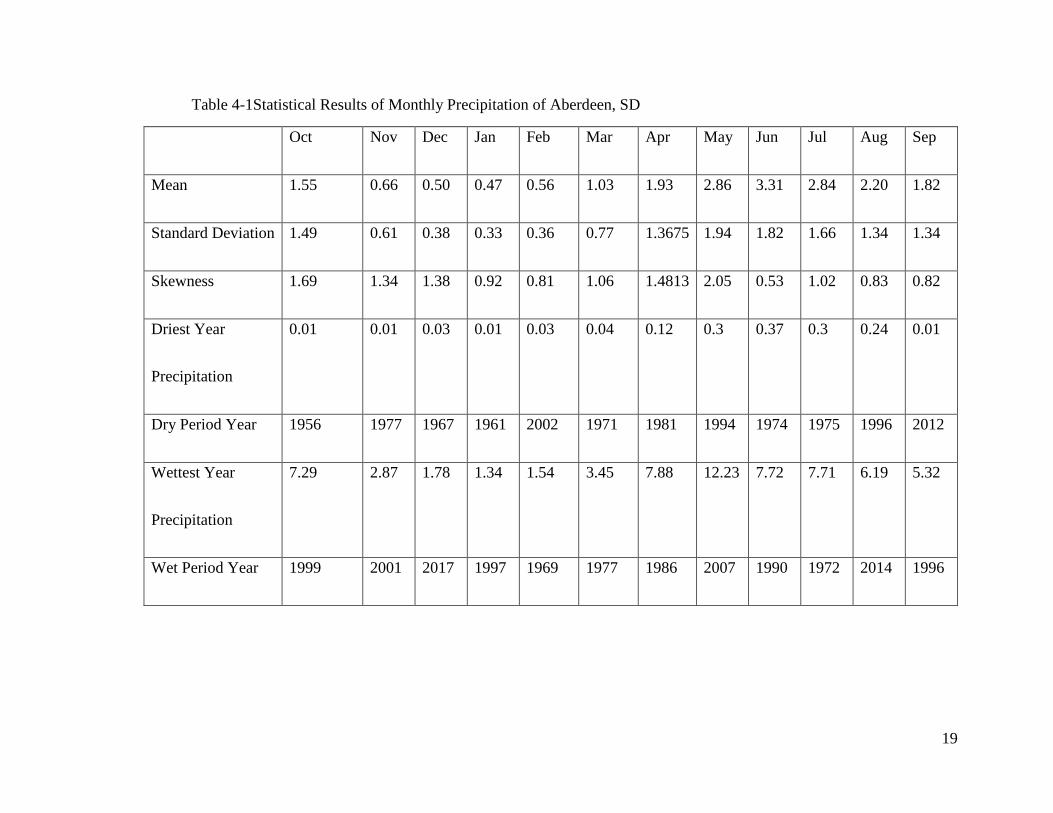
Table 4-1Statistical Results of Monthly Precipitation of Aberdeen, SD
Oct Nov Dec Jan Feb Mar Apr May Jun Jul Aug Sep
Mean 1.55 0.66 0.50 0.47 0.56 1.03 1.93 2.86 3.31 2.84 2.20 1.82
Standard Deviation 1.49 0.61 0.38 0.33 0.36 0.77 1.3675 1.94 1.82 1.66 1.34 1.34
Skewness 1.69 1.34 1.38 0.92 0.81 1.06 1.4813 2.05 0.53 1.02 0.83 0.82
Driest Year
Precipitation
0.01 0.01 0.03 0.01 0.03 0.04 0.12 0.3 0.37 0.3 0.24 0.01
Dry Period Year 1956 1977 1967 1961 2002 1971 1981 1994 1974 1975 1996 2012
Wettest Year
Precipitation
7.29 2.87 1.78 1.34 1.54 3.45 7.88 12.23 7.72 7.71 6.19 5.32
Wet Period Year 1999 2001 2017 1997 1969 1977 1986 2007 1990 1972 2014 1996
20
Table 4.1 shows the statistical results of monthly precipitation of Aberdeen, SD it
is observed that the maximum mean was in June which is found to be 3.31 Inches (in)
and the minimum is 0.47 Inches (in) in January. The maximum and minimum standard
deviation are 1.94 in May and 0.33 in January respectively. Similarly, the maximum and
minimum skewness is 2.05 (May) and 0.53 (June) respectively.
The results during the dry period precipitations were interesting that the minimum
precipitation was recorded in October, November, January and September and found to be
0.01 inches (in) during the years 1956, 1977, 1961 and 2012 respectively. The maximum
precipitation during dry periods was 0.37 inches in June 1974. The maximum and
minimum precipitation during wet periods were 12.23 inches and 1.34 inches in May 2007
and January 1997 respectively.
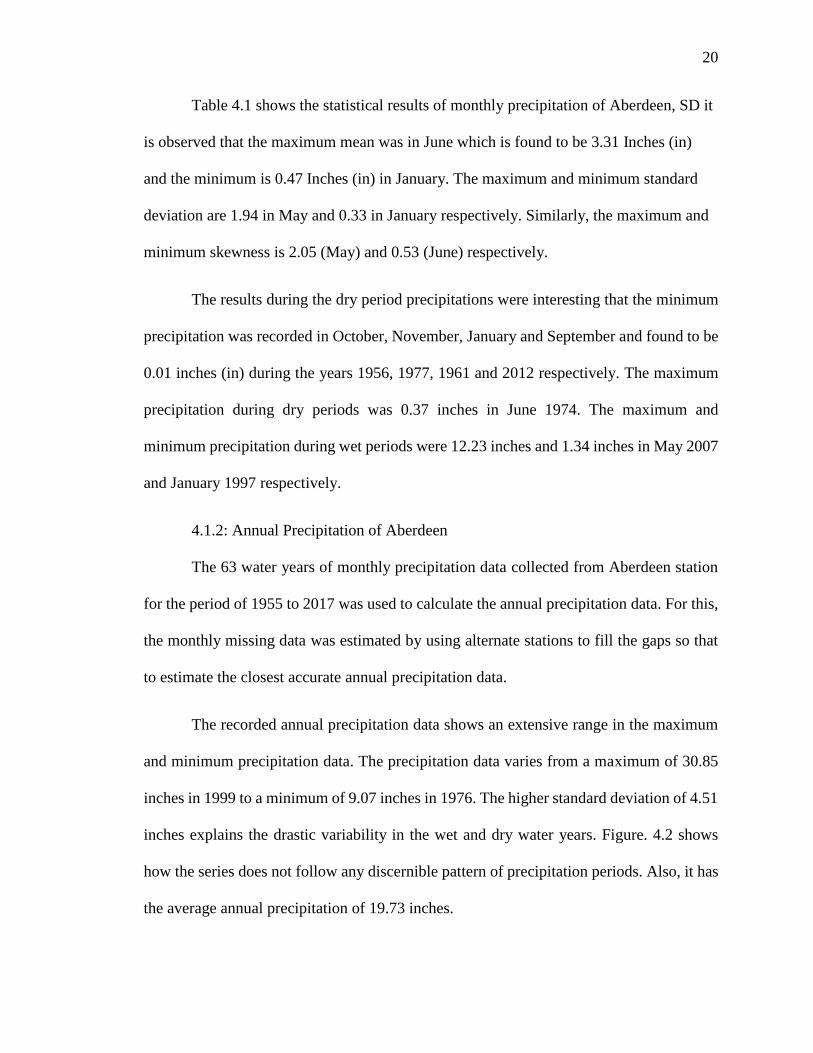
4.1.2: Annual Precipitation of Aberdeen
The 63 water years of monthly precipitation data collected from Aberdeen station
for the period of 1955 to 2017 was used to calculate the annual precipitation data. For this,
the monthly missing data was estimated by using alternate stations to fill the gaps so that
to estimate the closest accurate annual precipitation data.
The recorded annual precipitation data shows an extensive range in the maximum
and minimum precipitation data. The precipitation data varies from a maximum of 30.85
inches in 1999 to a minimum of 9.07 inches in 1976. The higher standard deviation of 4.51
inches explains the drastic variability in the wet and dry water years. Figure. 4.2 shows
how the series does not follow any discernible pattern of precipitation periods. Also, it has
the average annual precipitation of 19.73 inches.
21
Figure 4-2Plot of Annual Precipitation for Aberdeen, SD
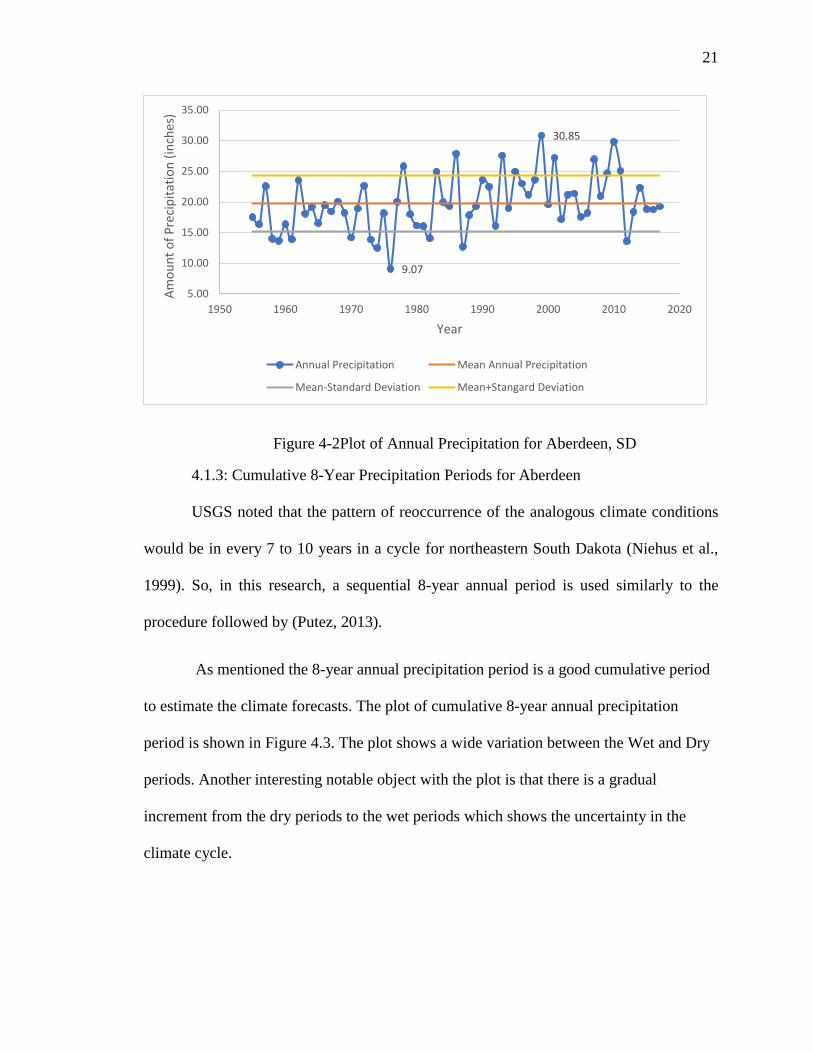
4.1.3: Cumulative 8-Year Precipitation Periods for Aberdeen
USGS noted that the pattern of reoccurrence of the analogous climate conditions
would be in every 7 to 10 years in a cycle for northeastern South Dakota (Niehus et al.,
1999). So, in this research, a sequential 8-year annual period is used similarly to the
procedure followed by (Putez, 2013).
As mentioned the 8-year annual precipitation period is a good cumulative period
to estimate the climate forecasts. The plot of cumulative 8-year annual precipitation
period is shown in Figure 4.3. The plot shows a wide variation between the Wet and Dry
periods. Another interesting notable object with the plot is that there is a gradual
increment from the dry periods to the wet periods which shows the uncertainty in the
climate cycle.
9.07
30.85
5.00
10.00
15.00
20.00
25.00
30.00
35.00
1950 1960 1970 1980 1990 2000 2010 2020
Am
ou
nt
of
Pre
cip
itat
ion
(in
ches
)
Year
Annual Precipitation Mean Annual Precipitation
Mean-Standard Deviation Mean+Stangard Deviation
22
Figure 4-3 Plot of cumulative 8-Year Precipitation Period for Aberdeen
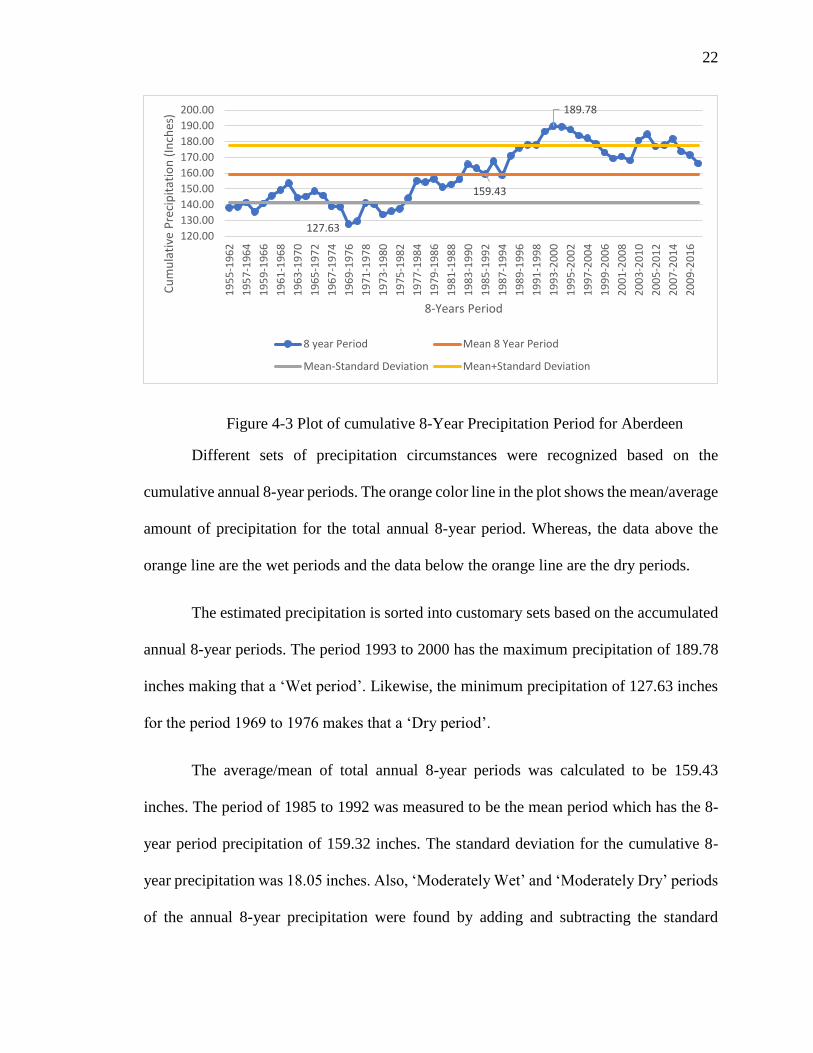
Different sets of precipitation circumstances were recognized based on the
cumulative annual 8-year periods. The orange color line in the plot shows the mean/average
amount of precipitation for the total annual 8-year period. Whereas, the data above the
orange line are the wet periods and the data below the orange line are the dry periods.
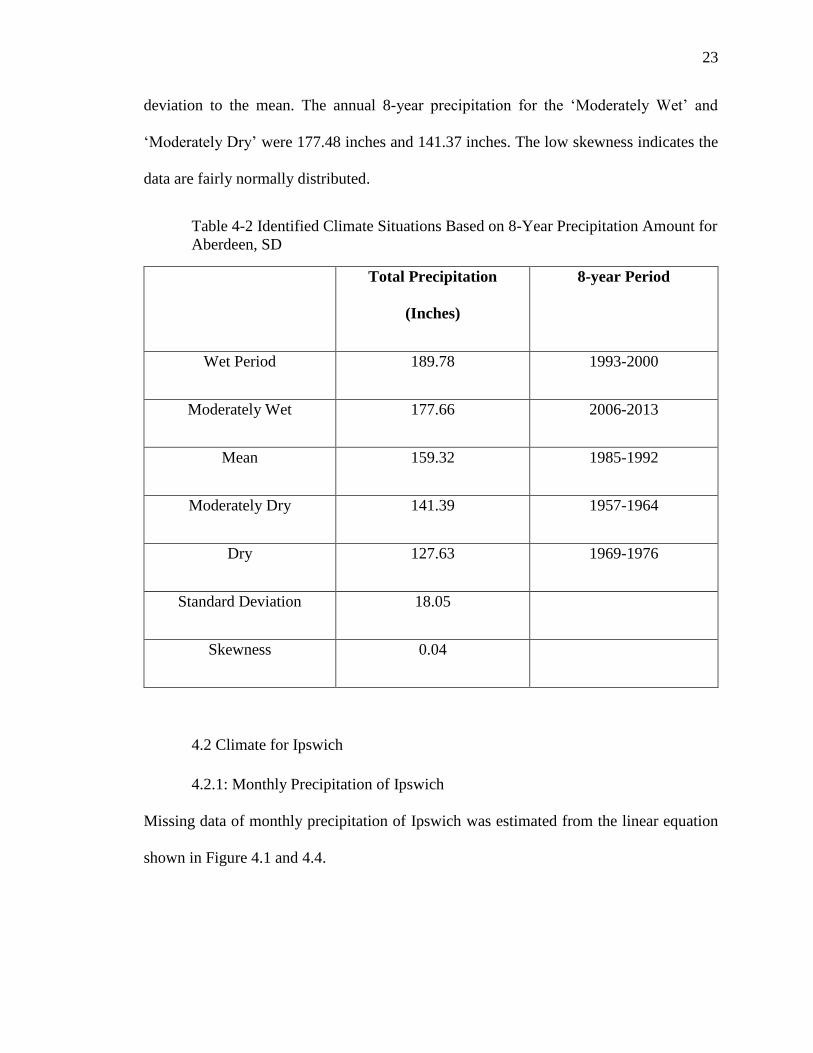
The estimated precipitation is sorted into customary sets based on the accumulated
annual 8-year periods. The period 1993 to 2000 has the maximum precipitation of 189.78
inches making that a ‘Wet period’. Likewise, the minimum precipitation of 127.63 inches
for the period 1969 to 1976 makes that a ‘Dry period’.
The average/mean of total annual 8-year periods was calculated to be 159.43
inches. The period of 1985 to 1992 was measured to be the mean period which has the 8-
year period precipitation of 159.32 inches. The standard deviation for the cumulative 8-
year precipitation was 18.05 inches. Also, ‘Moderately Wet’ and ‘Moderately Dry’ periods
of the annual 8-year precipitation were found by adding and subtracting the standard
127.63
189.78
159.43
120.00
130.00
140.00
150.00
160.00
170.00
180.00
190.00
200.00
19
55
-19
62
19
57
-19
64
19
59
-19
66
19
61
-19
68
19
63
-19
70
19
65
-19
72
19
67
-19
74
19
69
-19
76
19
71
-19
78
19
73
-19
80
19
75
-19
82
19
77
-19
84
19
79
-19
86
19
81
-19
88
19
83
-19
90
19
85
-19
92
19
87
-19
94
19
89
-19
96
19
91
-19
98
19
93
-20
00
19
95
-20
02
19
97
-20
04
19
99
-20
06
20
01
-20
08
20
03
-20
10
20
05
-20
12
20
07
-20
14
20
09
-20
16
Cu
mu
lati
ve P
reci
pit
atio
n (
Inch
es)
8-Years Period
8 year Period Mean 8 Year Period
Mean-Standard Deviation Mean+Standard Deviation
23
deviation to the mean. The annual 8-year precipitation for the ‘Moderately Wet’ and
‘Moderately Dry’ were 177.48 inches and 141.37 inches. The low skewness indicates the
data are fairly normally distributed.
Table 4-2 Identified Climate Situations Based on 8-Year Precipitation Amount for
Aberdeen, SD
Total Precipitation
(Inches)
8-year Period
Wet Period 189.78 1993-2000
Moderately Wet 177.66 2006-2013
Mean 159.32 1985-1992
Moderately Dry 141.39 1957-1964
Dry 127.63 1969-1976
Standard Deviation 18.05
Skewness 0.04
4.2 Climate for Ipswich
4.2.1: Monthly Precipitation of Ipswich
Missing data of monthly precipitation of Ipswich was estimated from the linear equation
shown in Figure 4.1 and 4.4.
24
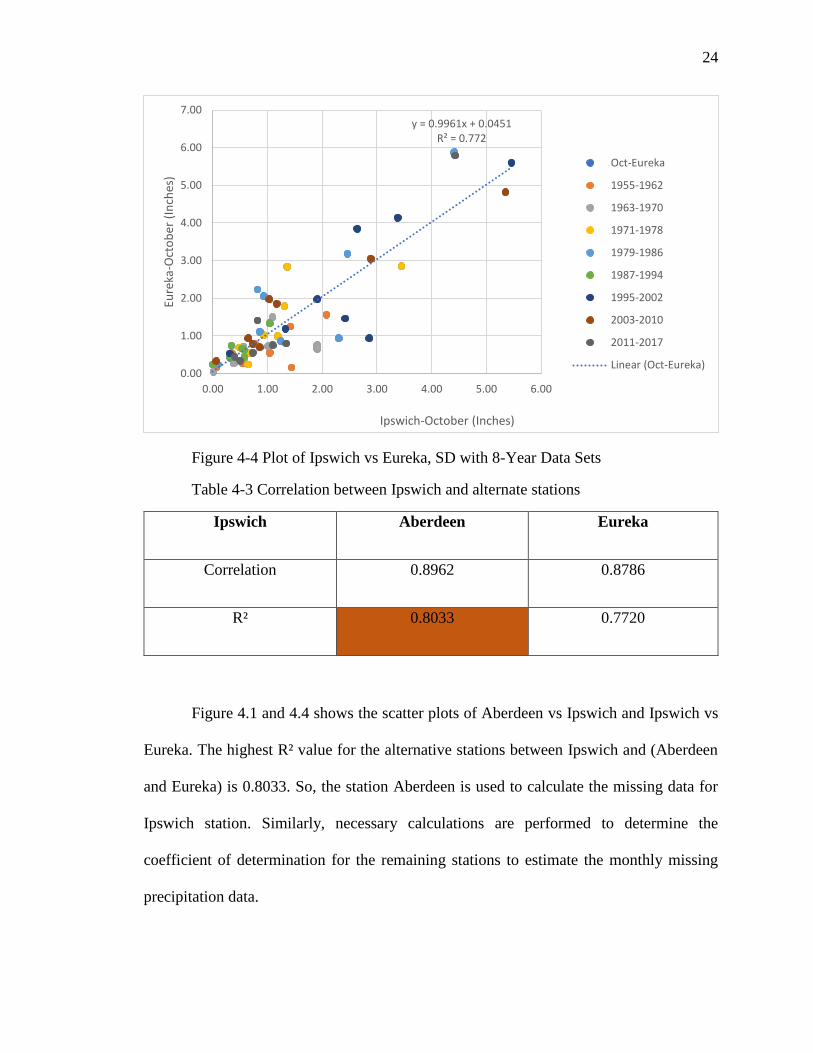
Figure 4-4 Plot of Ipswich vs Eureka, SD with 8-Year Data Sets
Table 4-3 Correlation between Ipswich and alternate stations
Ipswich Aberdeen Eureka
Correlation 0.8962 0.8786
R² 0.8033 0.7720
Figure 4.1 and 4.4 shows the scatter plots of Aberdeen vs Ipswich and Ipswich vs
Eureka. The highest R² value for the alternative stations between Ipswich and (Aberdeen
and Eureka) is 0.8033. So, the station Aberdeen is used to calculate the missing data for
Ipswich station. Similarly, necessary calculations are performed to determine the
coefficient of determination for the remaining stations to estimate the monthly missing
precipitation data.
y = 0.9961x + 0.0451R² = 0.772
0.00
1.00
2.00
3.00
4.00
5.00
6.00
7.00
0.00 1.00 2.00 3.00 4.00 5.00 6.00
Eure
ka-O
cto
ber
(In
ches
)
Ipswich-October (Inches)
Oct-Eureka
1955-1962
1963-1970
1971-1978
1979-1986
1987-1994
1995-2002
2003-2010
2011-2017
Linear (Oct-Eureka)
25
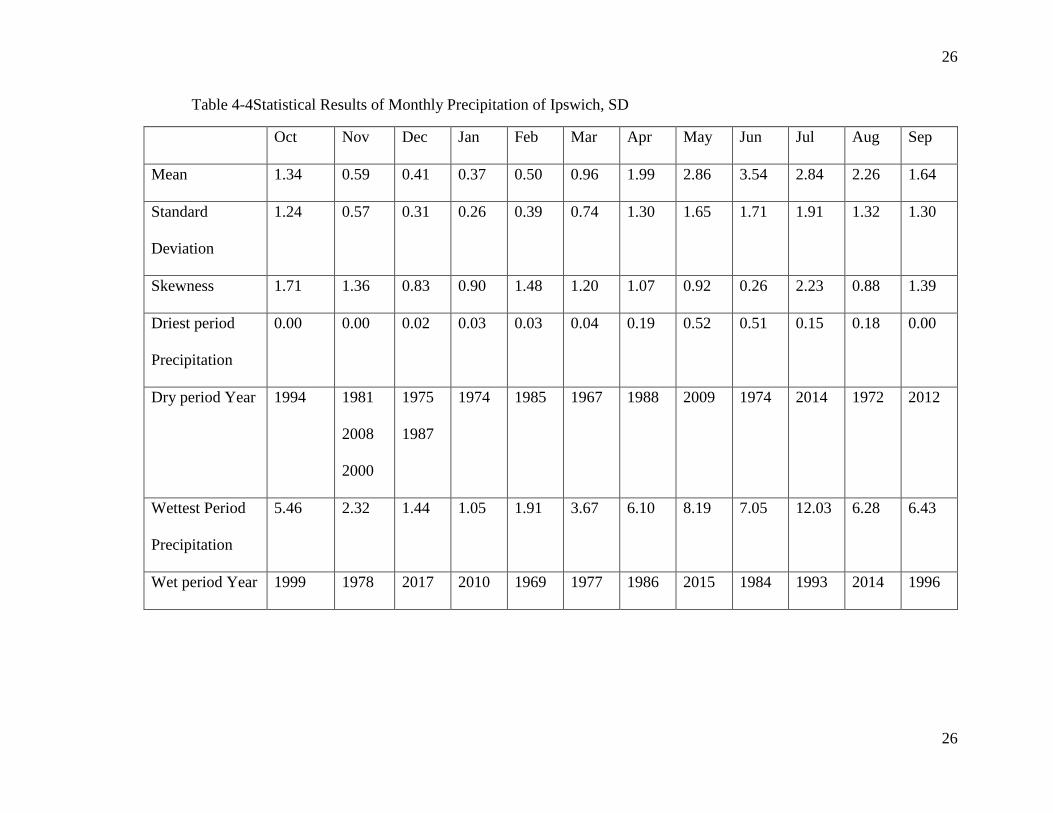
Table 4.4 shows the statistical results of monthly precipitation of Ipswich, SD. The
maximum and minimum means were 3.54 inches in June and 0.37 inches in January
respectively. The maximum and minimum standard deviations were 1.91 and 0.26
respectively. The former was in July and the latter in January. Similarly, the maximum and
minimum Skewness values were found to be 2.23 and 0.26 inches in July and June
respectively.
The highest precipitation during dry period was 0.52 inches in May 2009 and lowest
dry period precipitation of 0.00 inches was found in three months October, November and
September in 1994, 1981 and 2012 respectively. The highest and lowest precipitations
during the wet period were 12.03 inches and 1.05 inches in July 1993 and January 2010
respectively.
26
26
Table 4-4Statistical Results of Monthly Precipitation of Ipswich, SD
Oct Nov Dec Jan Feb Mar Apr May Jun Jul Aug Sep
Mean 1.34 0.59 0.41 0.37 0.50 0.96 1.99 2.86 3.54 2.84 2.26 1.64
Standard
Deviation
1.24 0.57 0.31 0.26 0.39 0.74 1.30 1.65 1.71 1.91 1.32 1.30
Skewness 1.71 1.36 0.83 0.90 1.48 1.20 1.07 0.92 0.26 2.23 0.88 1.39
Driest period
Precipitation
0.00 0.00 0.02 0.03 0.03 0.04 0.19 0.52 0.51 0.15 0.18 0.00
Dry period Year 1994 1981
2008
2000
1975
1987
1974 1985 1967 1988 2009 1974 2014 1972 2012
Wettest Period
Precipitation
5.46 2.32 1.44 1.05 1.91 3.67 6.10 8.19 7.05 12.03 6.28 6.43
Wet period Year 1999 1978 2017 2010 1969 1977 1986 2015 1984 1993 2014 1996
27
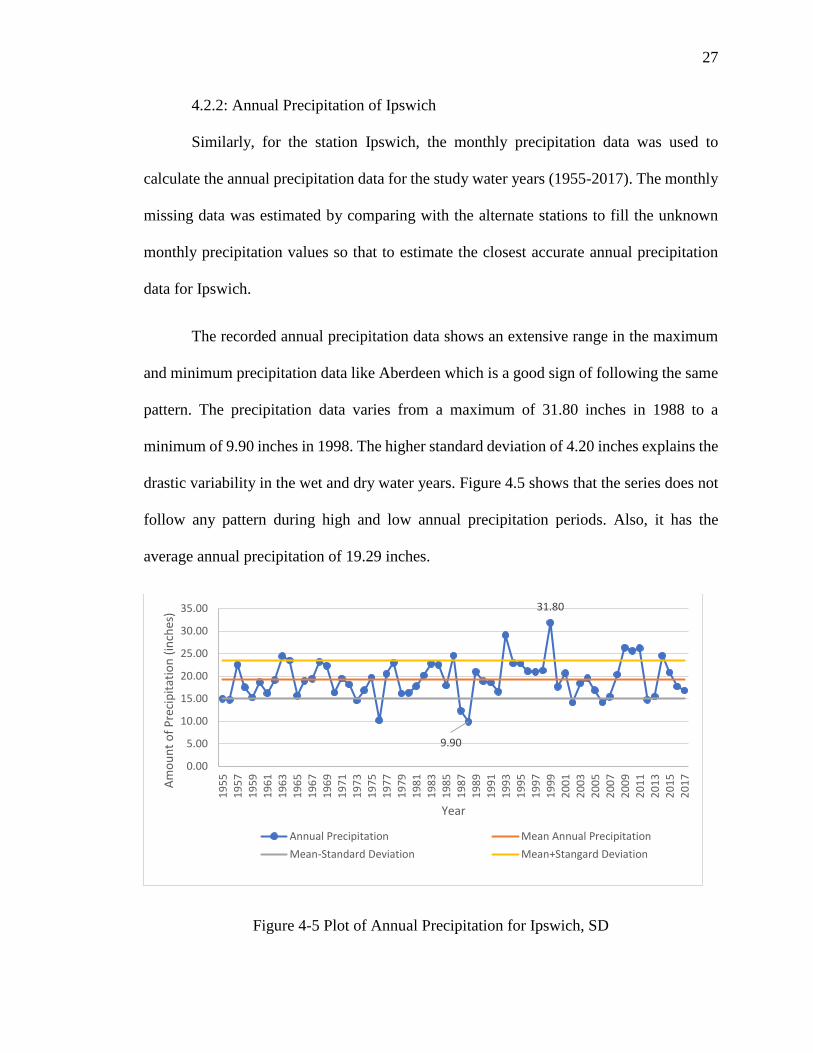
4.2.2: Annual Precipitation of Ipswich
Similarly, for the station Ipswich, the monthly precipitation data was used to
calculate the annual precipitation data for the study water years (1955-2017). The monthly
missing data was estimated by comparing with the alternate stations to fill the unknown
monthly precipitation values so that to estimate the closest accurate annual precipitation
data for Ipswich.
The recorded annual precipitation data shows an extensive range in the maximum
and minimum precipitation data like Aberdeen which is a good sign of following the same
pattern. The precipitation data varies from a maximum of 31.80 inches in 1988 to a
minimum of 9.90 inches in 1998. The higher standard deviation of 4.20 inches explains the
drastic variability in the wet and dry water years. Figure 4.5 shows that the series does not
follow any pattern during high and low annual precipitation periods. Also, it has the
average annual precipitation of 19.29 inches.
Figure 4-5 Plot of Annual Precipitation for Ipswich, SD
9.90
31.80
0.00
5.00
10.00
15.00
20.00
25.00
30.00
35.00
19
55
19
57
19
59
19
61
19
63
19
65
19
67
19
69
19
71
19
73
19
75
19
77
19
79
19
81
19
83
19
85
19
87
19
89
19
91
19
93
19
95
19
97
19
99
20
01
20
03
20
05
20
07
20
09
20
11
20
13
20
15
20
17
Am
ou
nt
of
Pre
cip
itat
ion
(in
ches
)
Year
Annual Precipitation Mean Annual Precipitation
Mean-Standard Deviation Mean+Stangard Deviation
28
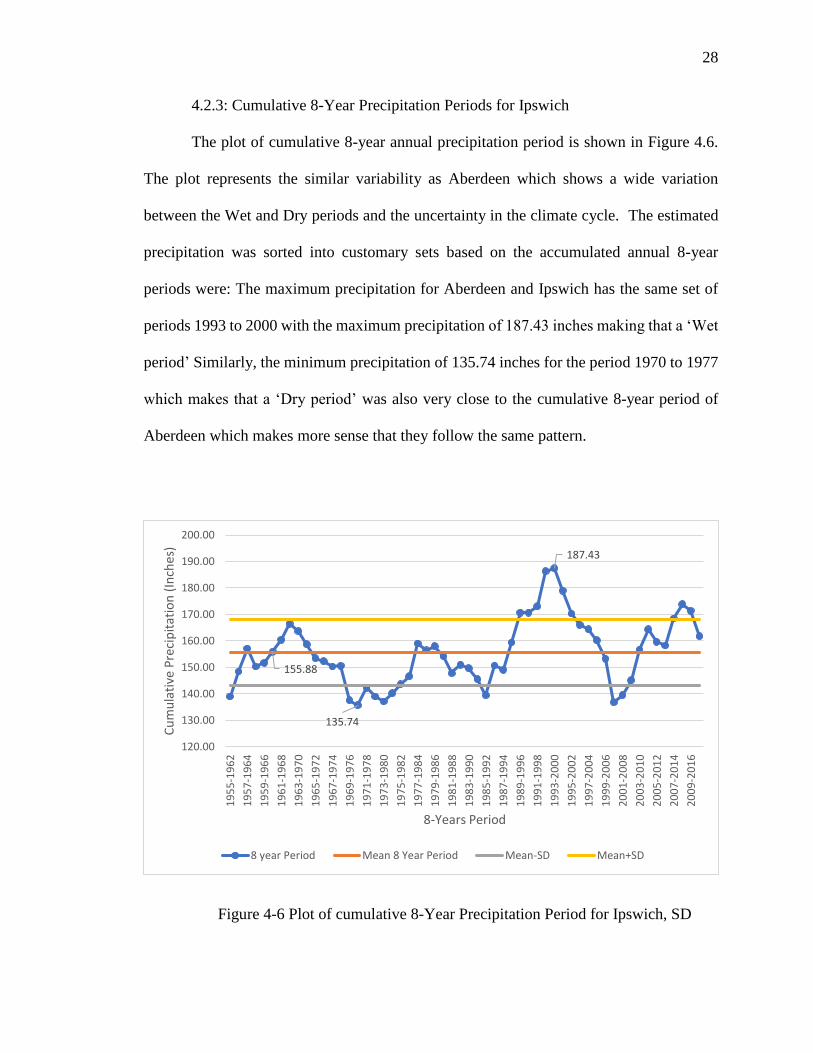
4.2.3: Cumulative 8-Year Precipitation Periods for Ipswich
The plot of cumulative 8-year annual precipitation period is shown in Figure 4.6.
The plot represents the similar variability as Aberdeen which shows a wide variation
between the Wet and Dry periods and the uncertainty in the climate cycle. The estimated
precipitation was sorted into customary sets based on the accumulated annual 8-year
periods were: The maximum precipitation for Aberdeen and Ipswich has the same set of
periods 1993 to 2000 with the maximum precipitation of 187.43 inches making that a ‘Wet
period’ Similarly, the minimum precipitation of 135.74 inches for the period 1970 to 1977
which makes that a ‘Dry period’ was also very close to the cumulative 8-year period of
Aberdeen which makes more sense that they follow the same pattern.
Figure 4-6 Plot of cumulative 8-Year Precipitation Period for Ipswich, SD
155.88
135.74
187.43
120.00
130.00
140.00
150.00
160.00
170.00
180.00
190.00
200.00
19
55
-19
62
19
57
-19
64
19
59
-19
66
19
61
-19
68
19
63
-19
70
19
65
-19
72
19
67
-19
74
19
69
-19
76
19
71
-19
78
19
73
-19
80
19
75
-19
82
19
77
-19
84
19
79
-19
86
19
81
-19
88
19
83
-19
90
19
85
-19
92
19
87
-19
94
19
89
-19
96
19
91
-19
98
19
93
-20
00
19
95
-20
02
19
97
-20
04
19
99
-20
06
20
01
-20
08
20
03
-20
10
20
05
-20
12
20
07
-20
14
20
09
-20
16
Cu
mu
lati
ve P
reci
pit
atio
n (
Inch
es)
8-Years Period
8 year Period Mean 8 Year Period Mean-SD Mean+SD
29
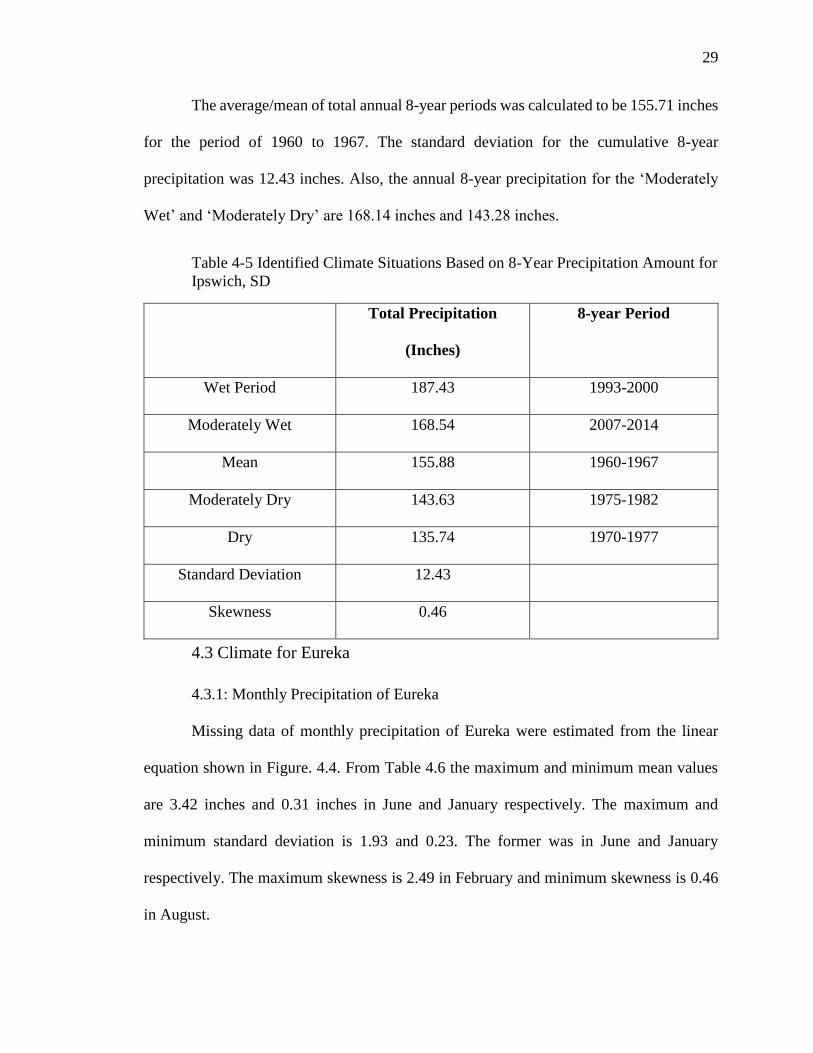
The average/mean of total annual 8-year periods was calculated to be 155.71 inches
for the period of 1960 to 1967. The standard deviation for the cumulative 8-year
precipitation was 12.43 inches. Also, the annual 8-year precipitation for the ‘Moderately
Wet’ and ‘Moderately Dry’ are 168.14 inches and 143.28 inches.
Table 4-5 Identified Climate Situations Based on 8-Year Precipitation Amount for
Ipswich, SD
Total Precipitation
(Inches)
8-year Period
Wet Period 187.43 1993-2000
Moderately Wet 168.54 2007-2014
Mean 155.88 1960-1967
Moderately Dry 143.63 1975-1982
Dry 135.74 1970-1977
Standard Deviation 12.43
Skewness 0.46
4.3 Climate for Eureka
4.3.1: Monthly Precipitation of Eureka
Missing data of monthly precipitation of Eureka were estimated from the linear
equation shown in Figure. 4.4. From Table 4.6 the maximum and minimum mean values
are 3.42 inches and 0.31 inches in June and January respectively. The maximum and
minimum standard deviation is 1.93 and 0.23. The former was in June and January
respectively. The maximum skewness is 2.49 in February and minimum skewness is 0.46
in August.
30
Table 4-6 Statistical Results of Monthly Precipitation of Eureka, SD
Oct Nov Dec Jan Feb Mar Apr May Jun Jul Aug Sep
Mean 1.38 0.56 0.37 0.31 0.42 0.80 1.75 2.84 3.42 2.70 2.30 1.56
Standard
Deviation
1.41 0.60 0.32 0.23 0.38 0.68 1.19 1.54 1.93 1.72 1.36 1.19
Skewness 1.87 1.75 1.66 1.50 2.49 1.05 1.09 0.64 1.01 1.69 0.46 1.03
Driest Period
Precipitation
0.05 0.00 0.00 0.02 0.01 0.03 0.07 0.46 0.47 0.24 0.19 0.01
Dry Period
Year
1965 2012 2008
1987
2007 1985 2012 1987 1976 1974 2014 2010 2012
Wettest
Period
Precipitation
5.88 2.78 1.57 1.21 2.17 2.68 5.30 6.70 9.59 10.34 5.82 4.64
Wet period
Year
1983 2001 2011 1997 2000 1968 1989 2015 1964 1993 1993 1973
31
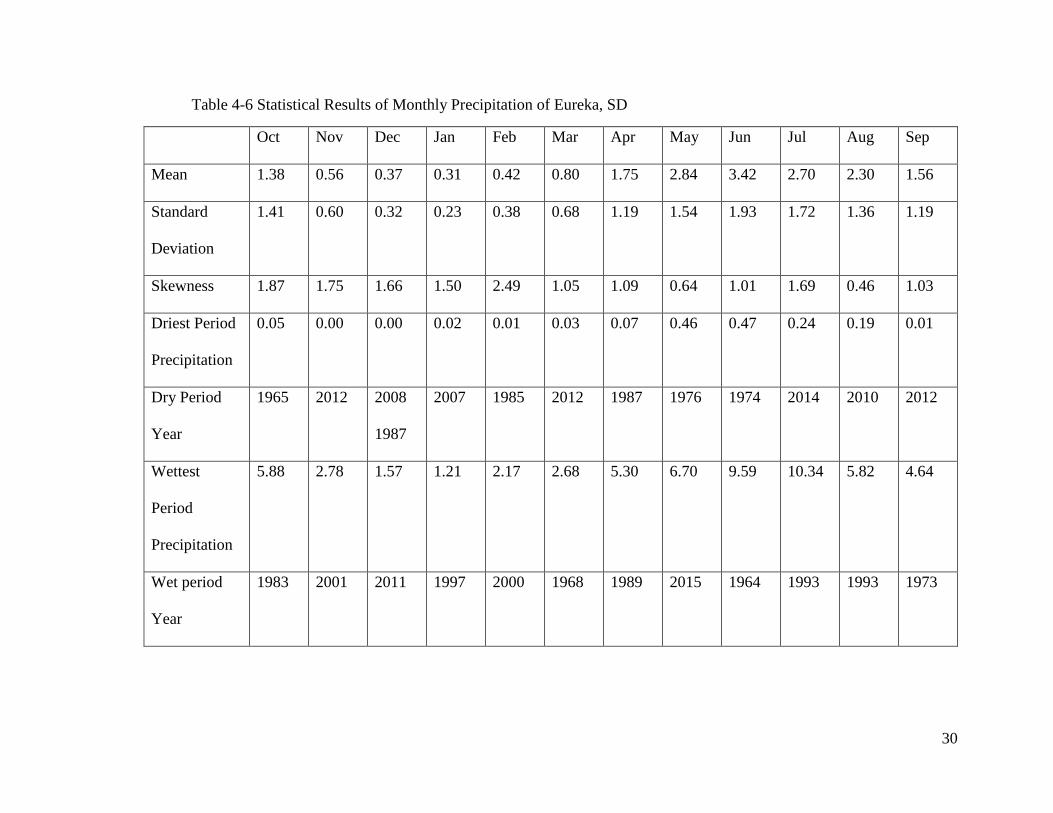
The maximum driest precipitation of 0.47 inches occurred in June and the minimum
was found in November and December to be 0.00 inches. Similarly, the maximum and
minimum wettest year precipitation is 10.34 inches and 1.21 inches in July 1993 and
January 1997 respectively
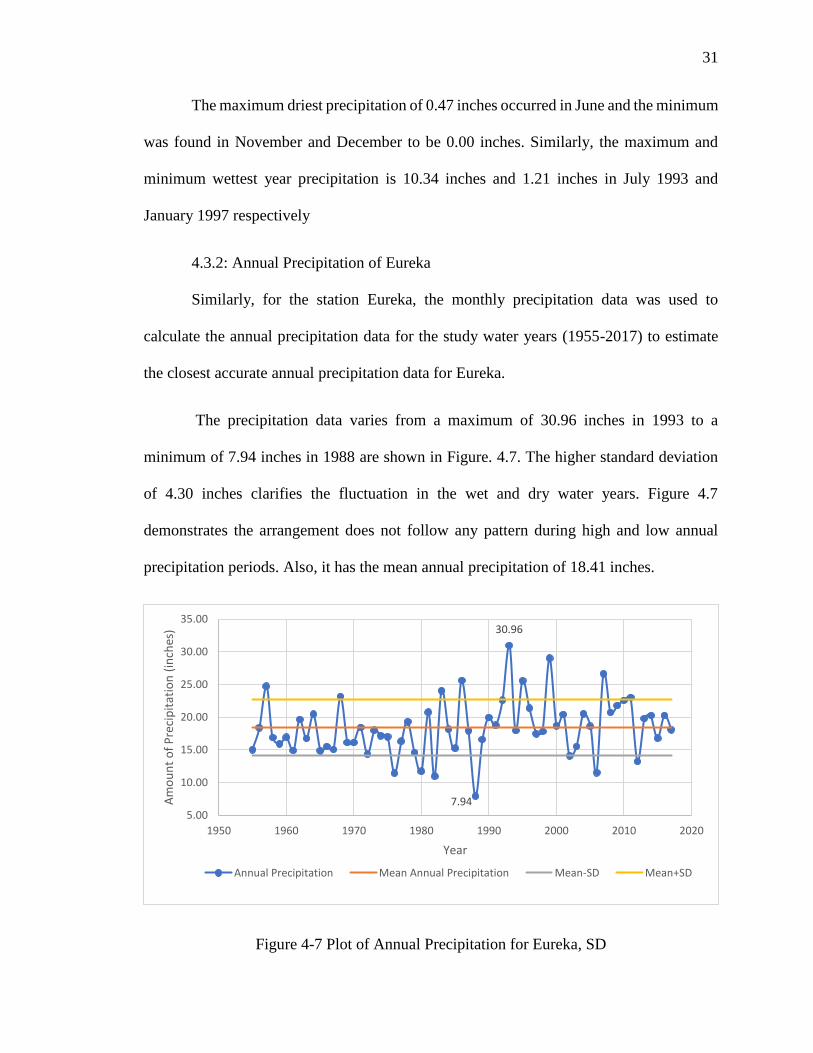
4.3.2: Annual Precipitation of Eureka
Similarly, for the station Eureka, the monthly precipitation data was used to
calculate the annual precipitation data for the study water years (1955-2017) to estimate
the closest accurate annual precipitation data for Eureka.
The precipitation data varies from a maximum of 30.96 inches in 1993 to a
minimum of 7.94 inches in 1988 are shown in Figure. 4.7. The higher standard deviation
of 4.30 inches clarifies the fluctuation in the wet and dry water years. Figure 4.7
demonstrates the arrangement does not follow any pattern during high and low annual
precipitation periods. Also, it has the mean annual precipitation of 18.41 inches.
Figure 4-7 Plot of Annual Precipitation for Eureka, SD
7.94
30.96
5.00
10.00
15.00
20.00
25.00
30.00
35.00
1950 1960 1970 1980 1990 2000 2010 2020
Am
ou
nt
of
Pre
cip
itat
ion
(in
ches
)
Year
Annual Precipitation Mean Annual Precipitation Mean-SD Mean+SD
32
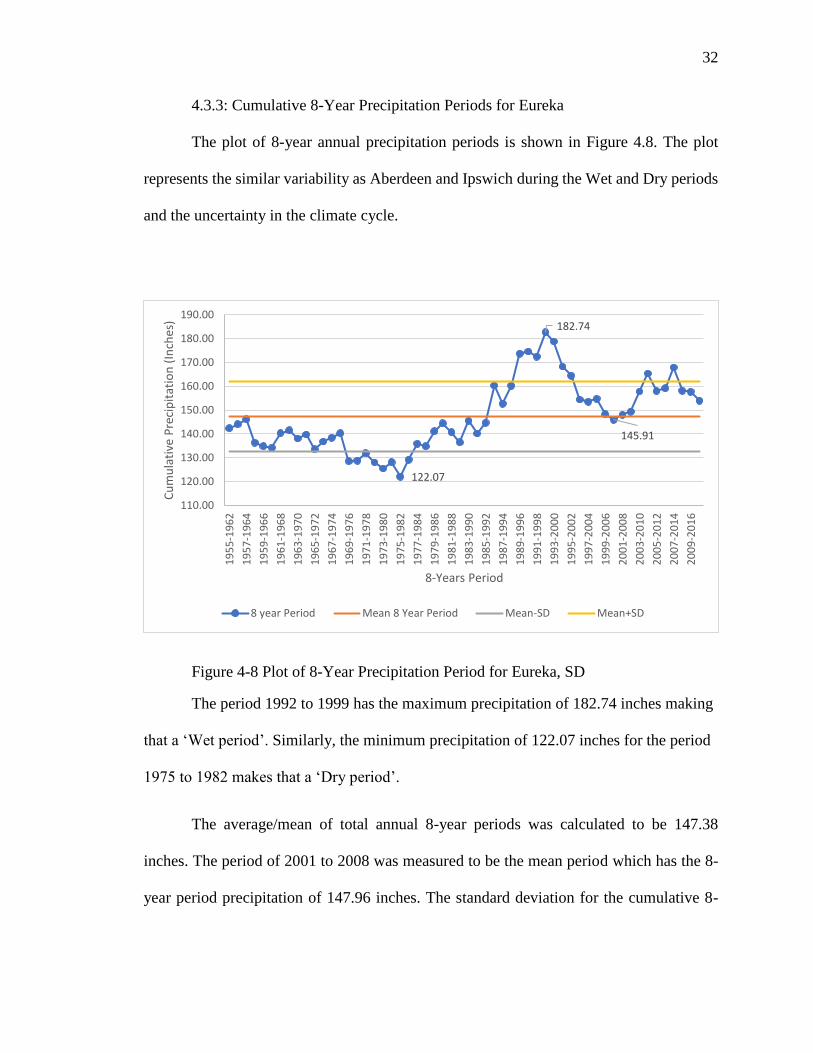
4.3.3: Cumulative 8-Year Precipitation Periods for Eureka
The plot of 8-year annual precipitation periods is shown in Figure 4.8. The plot
represents the similar variability as Aberdeen and Ipswich during the Wet and Dry periods
and the uncertainty in the climate cycle.
Figure 4-8 Plot of 8-Year Precipitation Period for Eureka, SD
The period 1992 to 1999 has the maximum precipitation of 182.74 inches making
that a ‘Wet period’. Similarly, the minimum precipitation of 122.07 inches for the period
1975 to 1982 makes that a ‘Dry period’.
The average/mean of total annual 8-year periods was calculated to be 147.38
inches. The period of 2001 to 2008 was measured to be the mean period which has the 8-
year period precipitation of 147.96 inches. The standard deviation for the cumulative 8-
122.07
182.74
145.91
110.00
120.00
130.00
140.00
150.00
160.00
170.00
180.00
190.00
19
55
-19
62
19
57
-19
64
19
59
-19
66
19
61
-19
68
19
63
-19
70
19
65
-19
72
19
67
-19
74
19
69
-19
76
19
71
-19
78
19
73
-19
80
19
75
-19
82
19
77
-19
84
19
79
-19
86
19
81
-19
88
19
83
-19
90
19
85
-19
92
19
87
-19
94
19
89
-19
96
19
91
-19
98
19
93
-20
00
19
95
-20
02
19
97
-20
04
19
99
-20
06
20
01
-20
08
20
03
-20
10
20
05
-20
12
20
07
-20
14
20
09
-20
16
Cu
mu
lati
ve P
reci
pit
atio
n (
Inch
es)
8-Years Period
8 year Period Mean 8 Year Period Mean-SD Mean+SD
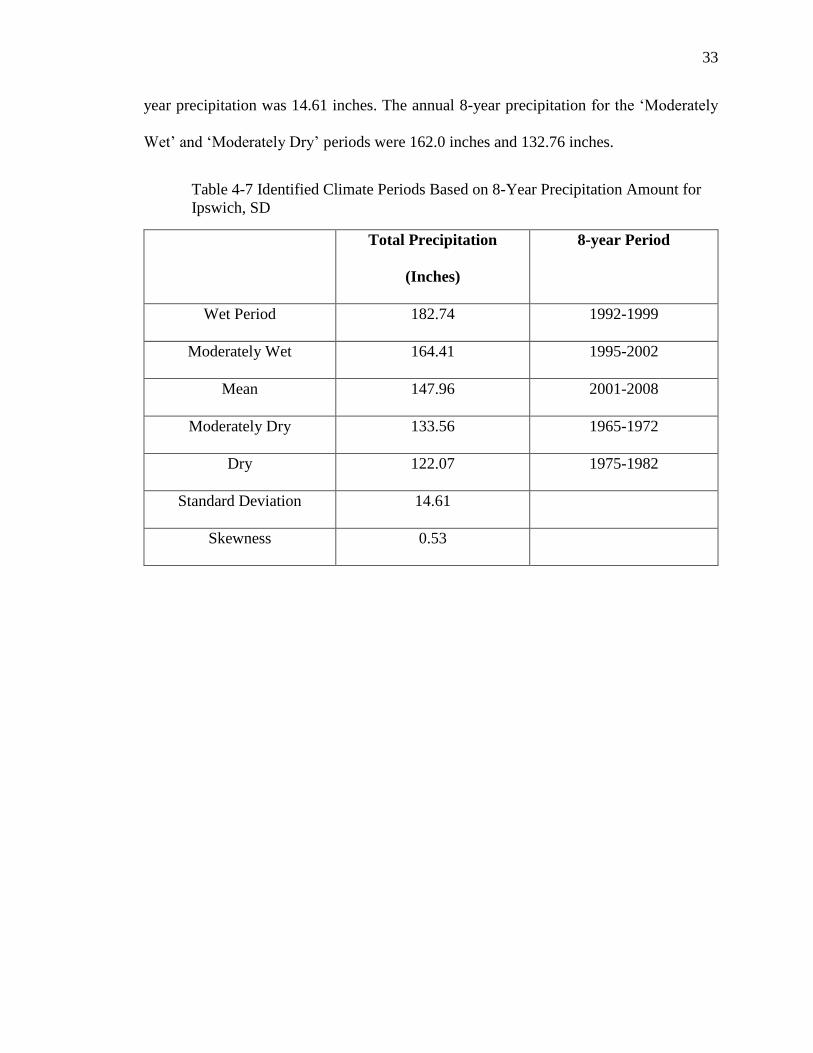
33
year precipitation was 14.61 inches. The annual 8-year precipitation for the ‘Moderately
Wet’ and ‘Moderately Dry’ periods were 162.0 inches and 132.76 inches.
Table 4-7 Identified Climate Periods Based on 8-Year Precipitation Amount for
Ipswich, SD
Total Precipitation
(Inches)
8-year Period
Wet Period 182.74 1992-1999
Moderately Wet 164.41 1995-2002
Mean 147.96 2001-2008
Moderately Dry 133.56 1965-1972
Dry 122.07 1975-1982
Standard Deviation 14.61
Skewness 0.53
34
CHAPTER-5: DISCUSSION
5.1: Introduction
Climate results for Aberdeen, Ipswich and Eureka were compared for several
factors. The following section details those comparison.
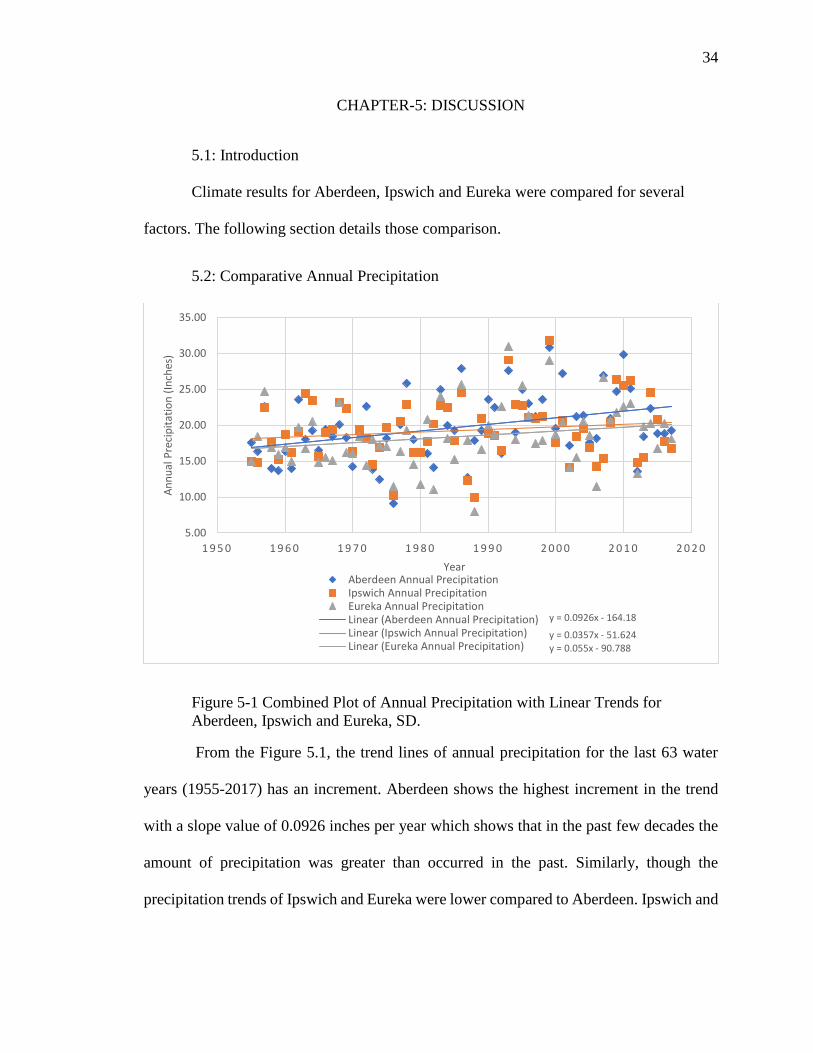
5.2: Comparative Annual Precipitation
Figure 5-1 Combined Plot of Annual Precipitation with Linear Trends for
Aberdeen, Ipswich and Eureka, SD.
From the Figure 5.1, the trend lines of annual precipitation for the last 63 water
years (1955-2017) has an increment. Aberdeen shows the highest increment in the trend
with a slope value of 0.0926 inches per year which shows that in the past few decades the
amount of precipitation was greater than occurred in the past. Similarly, though the
precipitation trends of Ipswich and Eureka were lower compared to Aberdeen. Ipswich and
y = 0.0926x - 164.18
y = 0.0357x - 51.624y = 0.055x - 90.788
5.00
10.00
15.00
20.00
25.00
30.00
35.00
1 9 5 0 1 9 6 0 1 9 7 0 1 9 8 0 1 9 9 0 2 0 0 0 2 0 1 0 2 0 2 0
An
nu
al P
reci
pit
atio
n (
Inch
es)
YearAberdeen Annual PrecipitationIpswich Annual PrecipitationEureka Annual PrecipitationLinear (Aberdeen Annual Precipitation)Linear (Ipswich Annual Precipitation)Linear (Eureka Annual Precipitation)
35
Eureka have a slight increment in the trend which follows the similar pattern in which
Ipswich has the least slope of 0.0357 inches per year.
And, the precipitation growth rates were calculated for each station and found to be
20.33% for Aberdeen, 16.38% for Ipswich and 8.10% for Eureka. According to Karl and
Knight (1998), precipitation has increased by approximately 10% over the continental
zones in the USA which supports the precipitation growth rates for the study areas.
From the Figure 5.1 for Aberdeen, Ipswich and Eureka there might be a possibility
that the amount of precipitation in coming decades could increase following the
precipitation patterns found during this study. Along with the precipitation patterns, the
flooding patterns in the future could also increase. This research would indicate the
necessity of updated plans and regulations for the study area if they were not updated in
recent years.
36
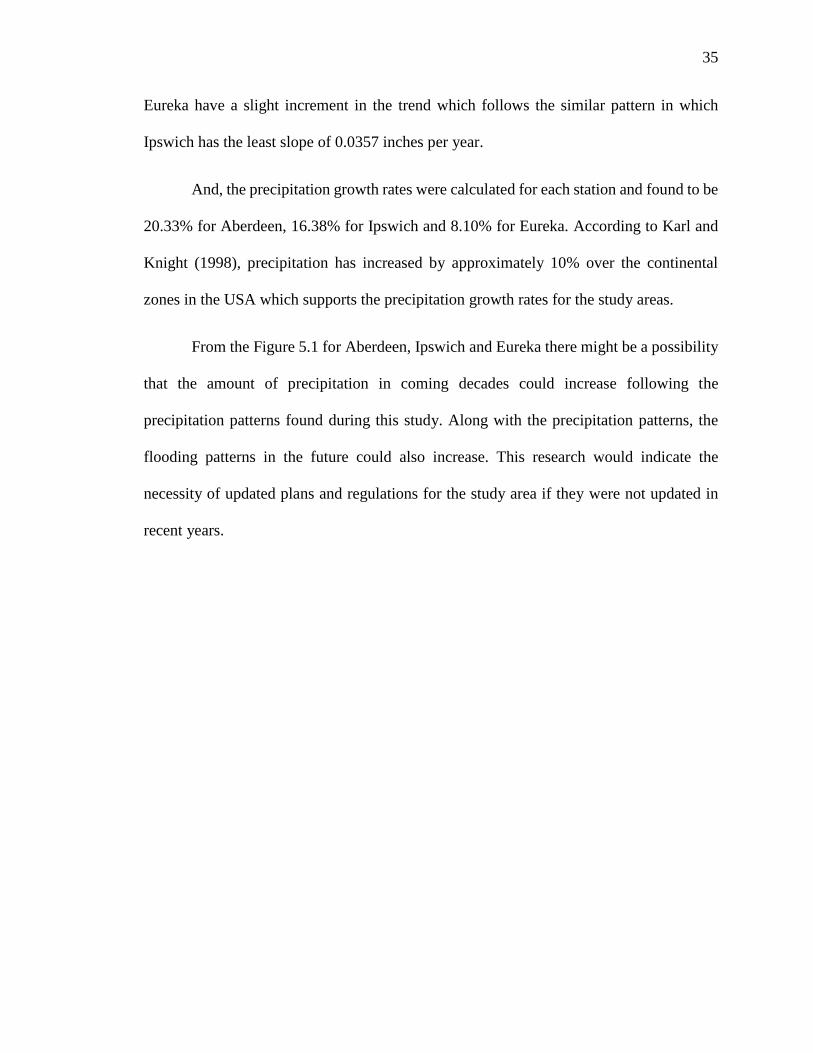
5.3: Combined Annual 8-Year Periods
Figure 5-2 Combined Plot of 8-Year Periods Precipitation with Linear Trends for
Aberdeen, Ipswich and Eureka, SD
Figure 5.2 shows the plot of combined annual 8-Year periods for the selected 63
water years for Aberdeen, Ipswich and Eureka. Also, Table 5.1 shows the climate situations
of 8-Year periods for different stations. The climate situations were divided into five
categories ‘Wet’, ‘Moderately Wet’, ‘Mean’, ‘Moderately Dry’ and ‘Dry’. According to
the statistics performed for the study. The occurrence of wet periods for Aberdeen, Ipswich
and Eureka were close to each other with different maximum ranges in precipitation. The
8-Year period for the wettest climate for Aberdeen and Ipswich was 1993-2000 and with a
slight variation, Eureka had the wettest 8-Year period on 1992-1999. So, it could be
concluded that the wet period for the three stations was the same. Similarly, the dry periods
were statistically analyzed for the three stations. The dry 8-Year periods were varied from
110.00
120.00
130.00
140.00
150.00
160.00
170.00
180.00
190.00
200.00
19
55
-19
62
19
57
-19
64
19
59
-19
66
19
61
-19
68
19
63
-19
70
19
65
-19
72
19
67
-19
74
19
69
-19
76
19
71
-19
78
19
73
-19
80
19
75
-19
82
19
77
-19
84
19
79
-19
86
19
81
-19
88
19
83
-19
90
19
85
-19
92
19
87
-19
94
19
89
-19
96
19
91
-19
98
19
93
-20
00
19
95
-20
02
19
97
-20
04
19
99
-20
06
20
01
-20
08
20
03
-20
10
20
05
-20
12
20
07
-20
14
20
09
-20
16
Cu
mu
lati
ve P
reci
pit
atio
n (
Inch
es
8-Year Period
Aberdeen Mean 8 Year Period Ipswich Mean 8 Year Period
Eureka Mean 8 Year Period Aberdeen 8 year Period
Ipswich 8 year Period Eureka 8 year Period
Linear (Eureka Mean 8 Year Period) Linear (Aberdeen 8 year Period)
37
the 70s and early 80s. By looking at the plot the overlapping of the data indicates that the
1990’s were the wettest periods from the last 63 water years.
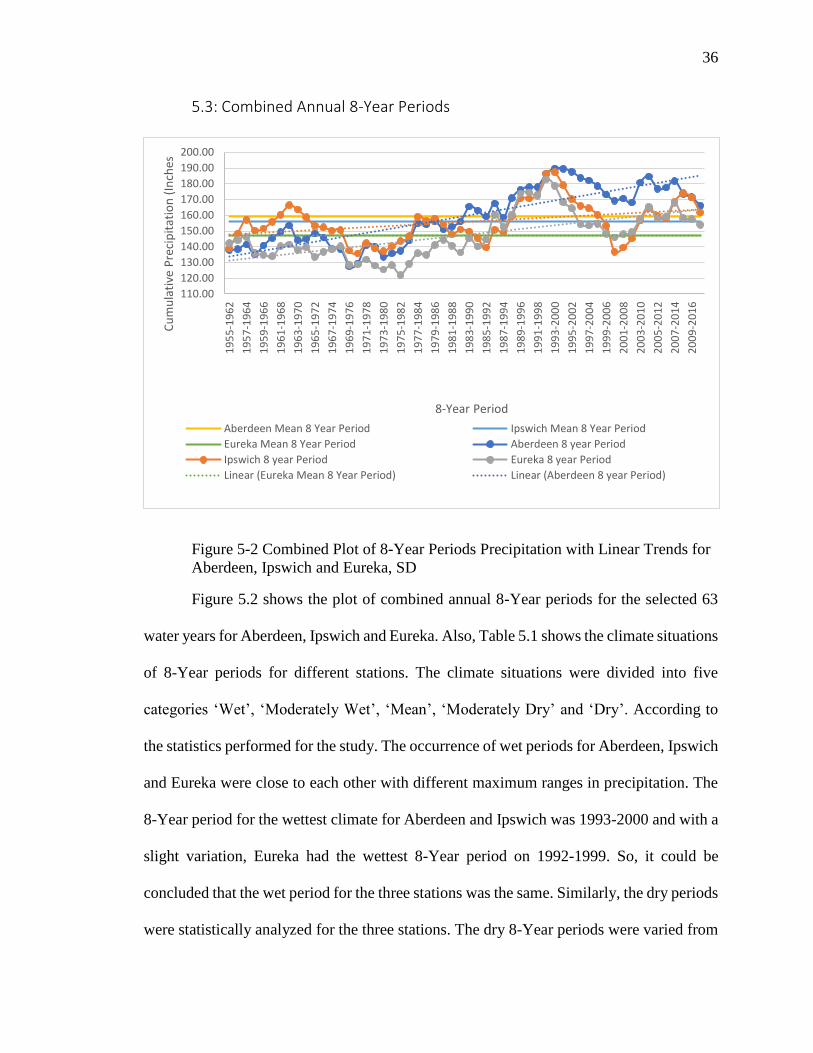
Table 5-1 8-Year Periods for Each Climate Situation
Aberdeen Ipswich Eureka
Wet 1993-2000 1993-2000 1992-1999
Moderately Wet 2006-2013 2007-2014 1995-2002
Mean 1985-1992 1960-1967 2001-2008
Moderately Dry 1957-1964 1975-1982 1965-1972
Dry 1969-1976 1970-1977 1975-1982
Whereas, the mean annual 8-Year periods for Aberdeen, Ipswich and Eureka were
also included in Figure 5.1. The yellow color line in the plot indicates the mean annual 8-
Year period of Aberdeen. The plot available above the yellow was considered to
moderately wet and wet periods and the scatter points below the yellow line was
moderately dry and dry periods for Aberdeen, SD.
Similarly, for Ipswich, SD the blue line represents the mean annual 8-Year period
and the green line indicates the mean annual 8-Year for Eureka, SD.
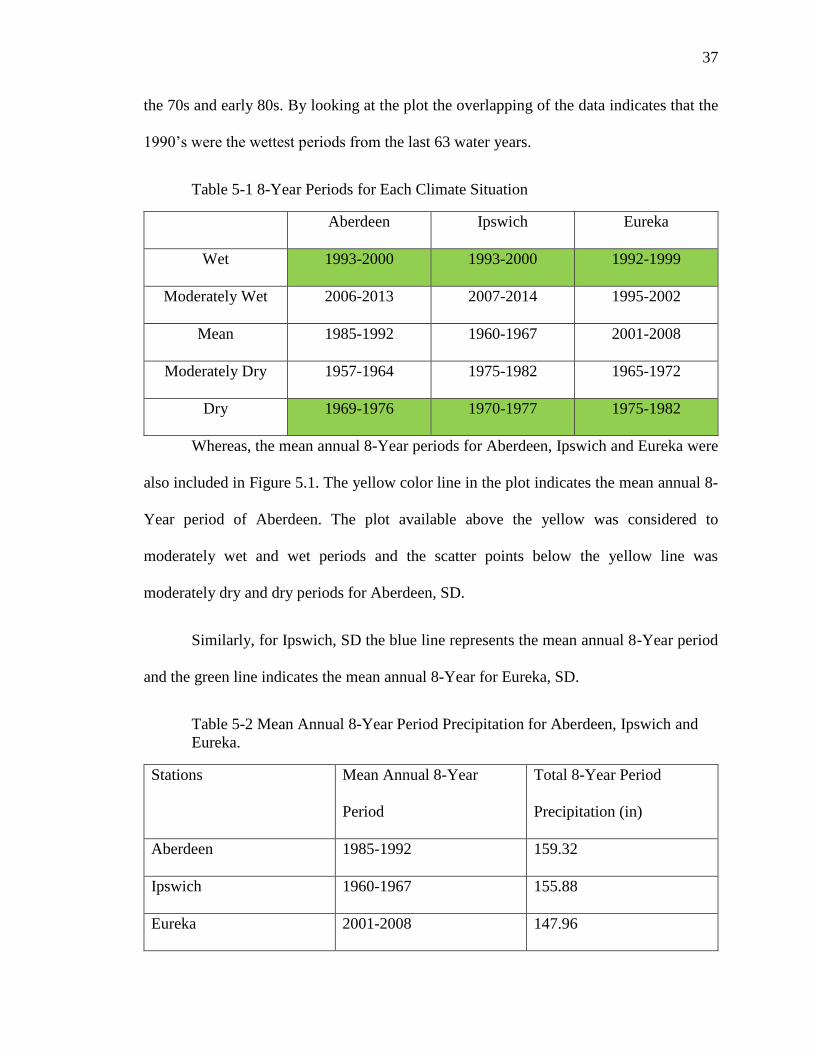
Table 5-2 Mean Annual 8-Year Period Precipitation for Aberdeen, Ipswich and
Eureka.
Stations Mean Annual 8-Year
Period
Total 8-Year Period
Precipitation (in)
Aberdeen 1985-1992 159.32
Ipswich 1960-1967 155.88
Eureka 2001-2008 147.96
38
Table 5.2 shows the precipitation data for Mean Annual 8-Year period precipitation
data for the selected three stations Aberdeen, Ipswich and Eureka, SD, and shows the
different time periods of precipitation. The mean annual precipitation for 8-Year period for
Aberdeen had the highest precipitation records followed by Ipswich and Eureka. Whereas,
the mean 8-year period had different periods, unlike the Maximum precipitation records.
As explained in section 3.2 the study areas for this research were shown as located in
Humid Continental ‘B’ in the hydrologic subregions. From the Table 5.2 it could be clearly
seen that the precipitation increased from western station to the eastern stations, i.e., Eureka
followed by Ipswich and Aberdeen.
5.4: Mean Monthly Precipitation for Aberdeen, Ipswich and Eureka, SD
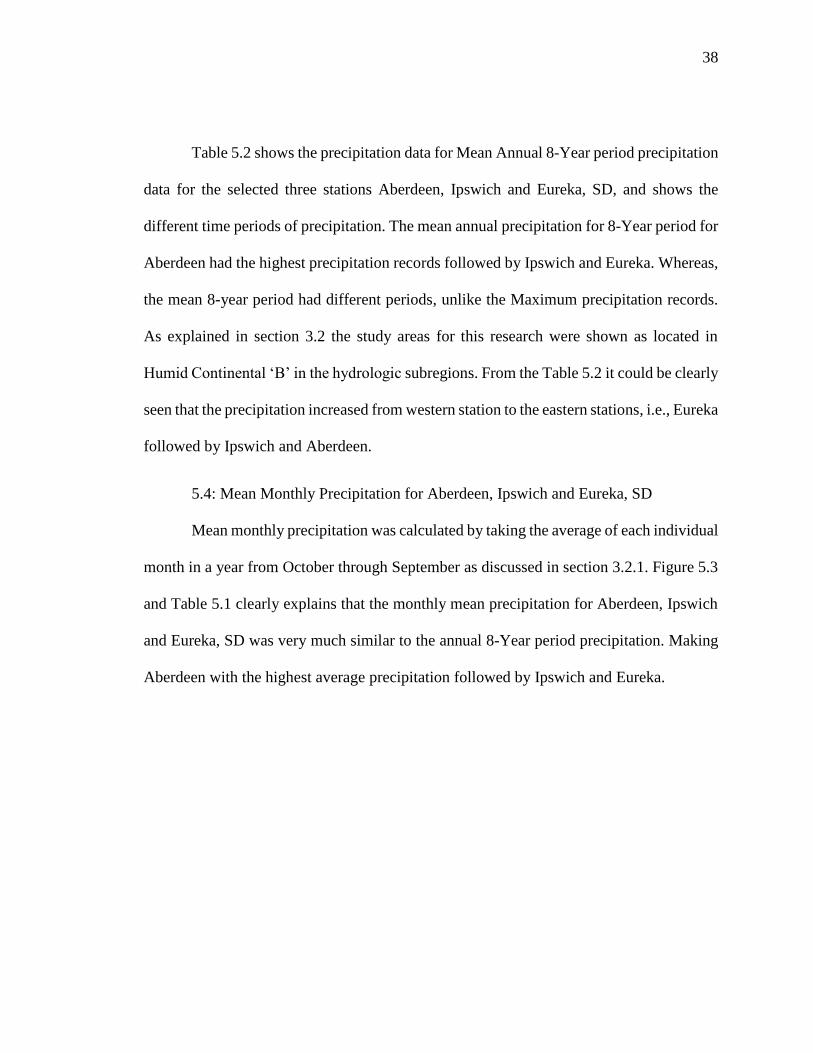
Mean monthly precipitation was calculated by taking the average of each individual
month in a year from October through September as discussed in section 3.2.1. Figure 5.3
and Table 5.1 clearly explains that the monthly mean precipitation for Aberdeen, Ipswich
and Eureka, SD was very much similar to the annual 8-Year period precipitation. Making
Aberdeen with the highest average precipitation followed by Ipswich and Eureka.
39
Figure 5-3 Plot for Monthly Precipitation for Aberdeen, Ipswich and Eureka, SD
Figure 5.3 shows that the maximum precipitation in water year occurred in June
and minimum precipitation occurred in January. Also, if the results are discussed in terms
of seasons. In general, the total amount of precipitation decides the year as the Wet or Dry
year. For further analysis, the annual precipitation was divided into four climate seasons.
From the previous studies on the seasonal variation of precipitation four seasons
were classified from the annual precipitation. They are; fall season (September, October
and November), winter season (December, January and February), spring season (March,
April and May) and summer season (June, July and August). Statistical analyses were
performed to calculate mathematical functions. (Basnet, 2011).
0
0.5
1
1.5
2
2.5
3
3.5
4
Oct Nov Dec Jan Feb Mar Apr May Jun Jul Aug Sep
Mo
nth
ly M
ean
Pre
cip
itat
ion
(In
ches
)
Months
Aberdeen Monthly Mean Ipswich Monthly Mean Eureka Monthly Mean
40
Table 5-3 Statistical Results for Monthly Mean Precipitation for Aberdeen,
Ipswich and Eureka, SD
Season Months Aberdeen
Monthly Mean
(in)
Ipswich
Monthly
Mean (in)
Eureka
Monthly Mean
(In)
Fall Sep 1.82 1.64 1.56
Oct 1.55 1.34 1.38
Nov 0.66 0.59 0.56
Winter Dec 0.50 0.41 0.37
Jan 0.47 0.37 0.31
Feb 0.56 0.50 0.42
Spring Mar 1.03 0.96 0.80
Apr 1.93 1.99 1.75
May 2.86 2.86 2.84
Summer Jun 3.31 3.54 3.42
Jul 2.84 2.84 2.70
Aug 2.20 2.26 2.30
Total
Precipitation
19.73 19.29 18.41
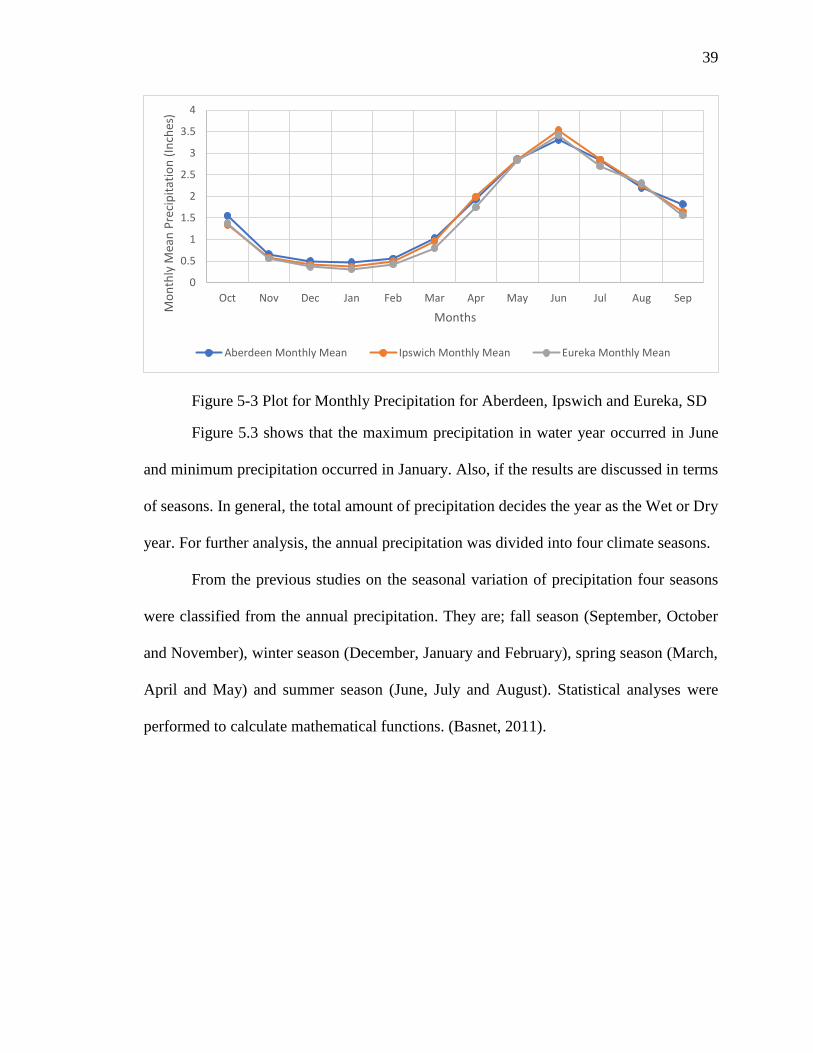
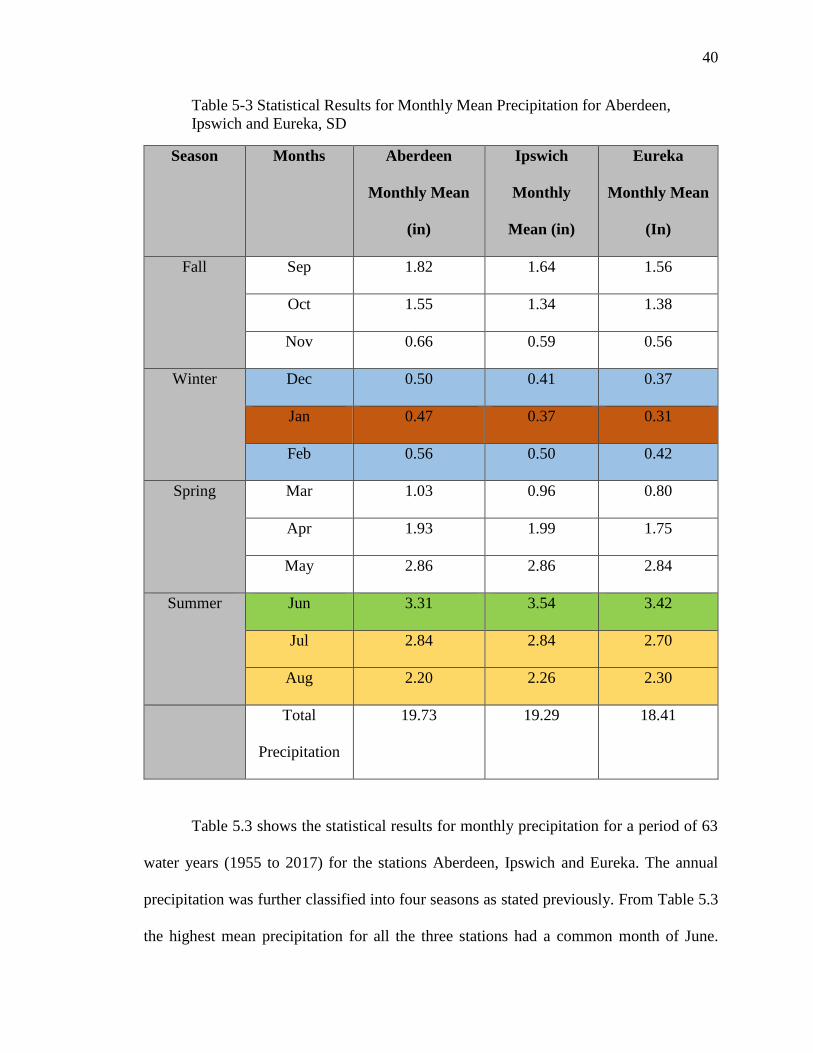
Table 5.3 shows the statistical results for monthly precipitation for a period of 63
water years (1955 to 2017) for the stations Aberdeen, Ipswich and Eureka. The annual
precipitation was further classified into four seasons as stated previously. From Table 5.3
the highest mean precipitation for all the three stations had a common month of June.
41
Ipswich had the highest monthly mean precipitation. Also, looking at the statistics, January
had the least mean monthly precipitation with Eureka having the lowest mean monthly
precipitation among the three stations. In terms of seasons, summer shows the maximum
precipitation among the four seasons. The colors yellow and green represents the maximum
precipitation season i.e., summer whereas, the green row specifically highlights the
individual month of June which has the highest precipitation. Similarly, the observed
season with least mean monthly precipitation was winter. The highlighted rows with the
colors blue and red represent the driest season whereas, red row highlights the individual
month with the lowest mean precipitation.
So, from Table 5.1 and Figure 5.3 the seasons with the highest to lowest monthly
mean precipitations were summer followed by spring, fall and winter. According to
Amatya (2011) and Basnet (2011), the seasons followed the same sequence as this study
does. Also, this research is further extended to investigate the exact months for the wettest
and driest period of precipitation, specifically to identify the months with the most
variability.
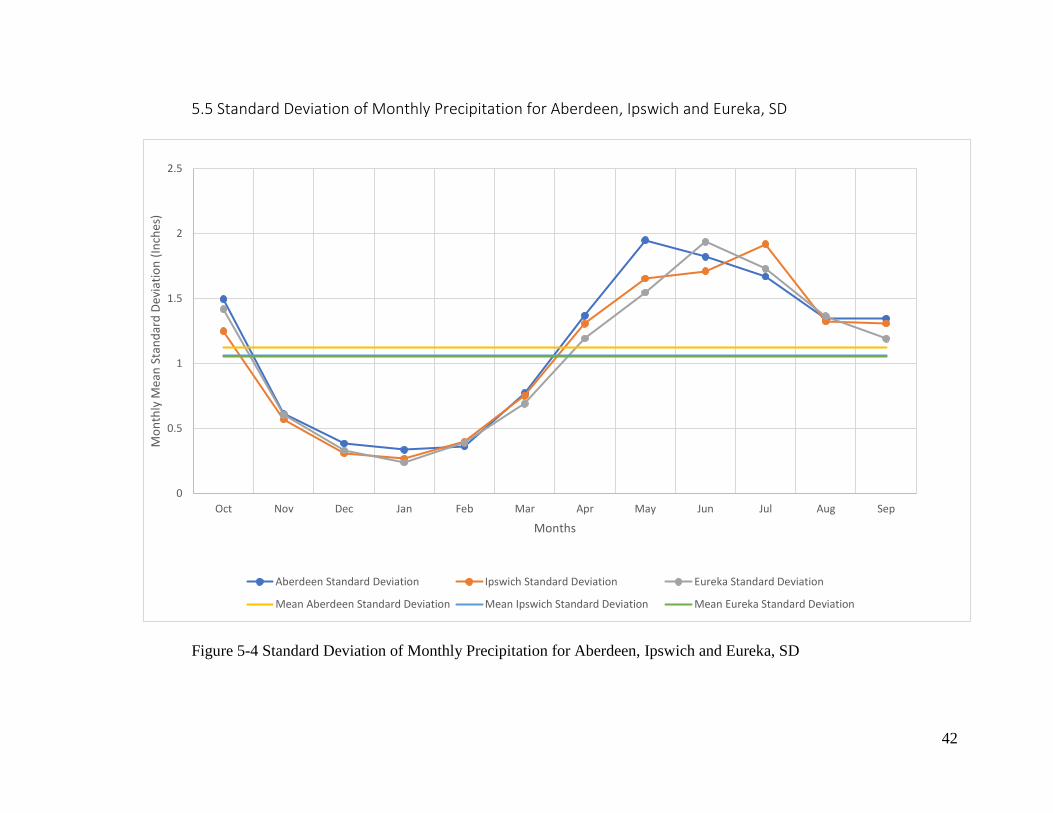
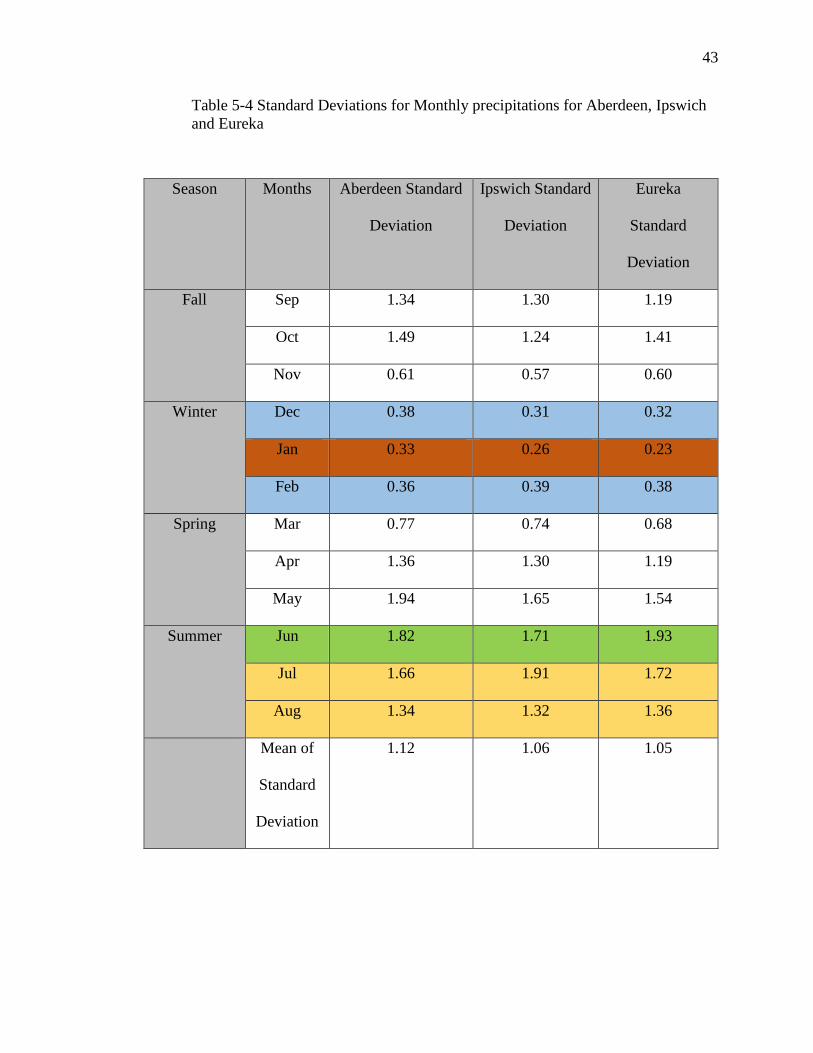
Figure 5.4 and Table 5.4 shows that the standard deviations for the monthly
precipitation follow the same pattern as the mean monthly precipitation. The more the
standard deviation value is, the more it fluctuates from its average precipitation. So, Table
5.4 shows January with the lowest standard deviation value for the three stations. June is
the wettest month with the highest standard deviation. These observations also support the
previous studies of Amatya (2011) and Banset (2011) which showed that ‘wet’ periods had
more precipitation in the months with the highest standard deviation.
42
5.5 Standard Deviation of Monthly Precipitation for Aberdeen, Ipswich and Eureka, SD
Figure 5-4 Standard Deviation of Monthly Precipitation for Aberdeen, Ipswich and Eureka, SD
0
0.5
1
1.5
2
2.5
Oct Nov Dec Jan Feb Mar Apr May Jun Jul Aug Sep
Mo
nth
ly M
ean
Sta
nd
ard
Dev
iati
on
(In
ches
)
Months
Aberdeen Standard Deviation Ipswich Standard Deviation Eureka Standard Deviation
Mean Aberdeen Standard Deviation Mean Ipswich Standard Deviation Mean Eureka Standard Deviation
43
Table 5-4 Standard Deviations for Monthly precipitations for Aberdeen, Ipswich
and Eureka
Season Months Aberdeen Standard
Deviation
Ipswich Standard
Deviation
Eureka
Standard
Deviation
Fall Sep 1.34 1.30 1.19
Oct 1.49 1.24 1.41
Nov 0.61 0.57 0.60
Winter Dec 0.38 0.31 0.32
Jan 0.33 0.26 0.23
Feb 0.36 0.39 0.38
Spring Mar 0.77 0.74 0.68
Apr 1.36 1.30 1.19
May 1.94 1.65 1.54
Summer Jun 1.82 1.71 1.93
Jul 1.66 1.91 1.72
Aug 1.34 1.32 1.36
Mean of
Standard
Deviation
1.12 1.06 1.05
44
CHAPTER – 6: CONCLUSION
Precipitation plays an important role in the hydrologic cycle which impacts in
environmental changes. A period with high precipitation can cause floods and property loss
and similarly, a period with low precipitation can cause severe droughts. So, the study of
precipitation is critical in the field of water resources management. Based on the previous
studies, climatic periods were developed for Aberdeen, Ipswich and Eureka, South Dakota.
The monthly historical precipitation for the last 63 water years (1955 to 2017) was
collected from High Plain Regional climate center (HPRCC) for Aberdeen, Ipswich and
Eureka, South Dakota and analyzed using a statistical approach. Based on annual
accumulated 8-Year periods different climate periods were developed.
For the station Aberdeen, the period 1993 to 2000 has the maximum precipitation
of 189.78 inches making that a Wet period and the minimum precipitation of 127.63 inches
for the period 1969 to 1976 makes that a Dry period. Similarly, for Ipswich, the maximum
precipitation for the annual 8-Year period was recorded to be on the period 1993 to 2000
with 187.43 inches of precipitation and the minimum precipitation was 135.74 inches for
the period 1970 to 1977. For the station Eureka the maximum precipitation was recorded
for the period 1992 to 1999 with 182.74 inches and the minimum precipitation with 122.07
inches for the period 1975 to 1982.
The comparison made with the previous studies had ended up with positive results.
The previous studies conclude that the wettest season for the north-eastern South Dakota
was summer season followed by spring, fall and winter. This research is further extended
to investigate the exact months for the wettest and driest period of precipitation. The
observations made from the mean monthly precipitation concludes the wettest month to be
45
June and the driest month to be January. In general, people assume spring to be the wettest
season, but this study clarifies that the maximum precipitation in a year occurs in the
summer season. This study helps in identifying and tracking the precipitation for every
particular month for the stations Aberdeen, Ipswich and Eureka and can be used by water
resource departments and the planners for forecasting the possible future precipitations.
46
CHAPTER – 7: SUGGESTIONS FOR FUTURE RESEARCH
The climatic periods were developed by using the monthly historical precipitation
data of Aberdeen, Ipswich and Eureka, South Dakota from HPRCC.
➢ A similar kind of method can be used to estimate the climate periods for other
study areas.
➢ Climate periods can be developed by using the other different climatic factors like
evaporation, humidity, temperature, wind speed and stream flow.
➢ By taking the average periods of the different cities based on the different climatic
factors, an average period can be developed for the specific region.
47
CHAPTER – 8 REFERENCES
Amatya, S., 2011. Development of Climate Scenarios Using Climate Data from Specific
Stations in Eastern South Dakota. Master’s Thesis, South Dakota State University.
Basnet, N., 2011. Development of Climatic Scenarios Using Precipitation Data for
Aberdeen, South Dakota. Master’s Thesis, South Dakota State University.
Brutsaert, W., & Parlange, M. B., 1998. Hydrologic cycle explains the evaporation
paradox. Nature, 396(6706), 30.
Climatemps.com, 2018. Average Temperatures in Eureka, South Dakota; Available online
at http://www.eureka-sd.climatemps.com/temperatures.php. Accessed on July 12, 2018.
De Silva, R.P., Dayawansa, N.D.K., & Ratnasiri, M.D., 2007. A Comparison of Methods
used in Estimating Missing Rainfall Data. The Journal of Agricultural Sciences, Vol.3,
No.2, 101-108 p.
High Plains Regional Climate Center., 2018. Precipitation Data; Available online at
http://climod.unl.edu/. Accessed on April 21, 2018.
Hogan, E. P., Fouberg, E.H., & Gab, O.E., 2001. The geography of South Dakota. Center
for Western Studies.
48
Karl, T. R., & Knight, R. W., 1998. Secular Trends of Precipitation Amount, Frequency,
and Intensity in the United States. Bulletin of the American Meteorological Society,
Vol.27, No.2, 231-242 p.
McCuen, H.R., 2005. Hydrologic Analysis and Design, Third Edition, Pearson Prentice
Hall, New Jersey.
National Geographic Partners, 2018. Geography of South Dakota; Available online at
https://kids.nationalgeographic.com/explore/states/south-dakota/#south-dakota-mount-
rushmore.jpg, Accessed on July 11, 2018.
Niehus, C. A., Vecchia, A. V. & Thompson, R. F. 1999: Lake-Level Frequency Analysis
for the Waubay Lakes Chain, Northeastern South Dakota. U.S. Geological Survey Water-
Resources Investigations Report 99-4122, 166 p.
Puetz, J. A., 2013. Analysis of Historical Cooperative Observation Program (COOP)
Climate Data Through Trend and Correlation Determination for Selected South Dakota
Sites and Comparisons of COOP Sensors with the Automated Weather Data Network
(AWDN) Remote Sensors. Electronic Theses and Dissertations. 1375.
https://openprairie.sdstate.edu/etd/1375
49
Robson, S.G., & Stewart, M., 1990, GeoHydrologic Evaluation of the Upper Part of the
Upper part of the Mesaverde Group Northwestern Colorado. U.S. Geological Survey,
Water-Resources Investigations Report 90-4020, 25.
Sando, S.K., 1998. Techniques for Estimating Peak-Flow Magnitude and Frequency
Relations for South Dakota Streams. Water-Resources Investigation Report, 98-4055.
Singh, V. P., 1994. Elementary Hydrology. Prentice Hall of India: New Delhi.
Tabios, G. Q., & Salas, J. D., 1985. A comparative analysis of techniques for spatial
interpolation of precipitation. Water Resource Bull. 21(3), 365-380.
Teegavarapu, R. S., & Chandramouli, V., 2005. Improved weighting methods,
deterministic and stochastic data-driven models for estimation of missing precipitation
records. Journal of Hydrology, 312(1-4), 191-206 p.
United States Geological Survey, 2018. Water Resources of The United States; Available
online at https://water.usgs.gov/nwc/explain_data.html. Accessed on July 9, 2018.
Van Liew, M. W., Schneider, J. M., & Garbrecht, J. D., 2003. Streamflow response of an
agricultural watershed to seasonal changes in precipitation. In Proceedings of the 1st
interagency conference on research in the watersheds (ICRW), 27-30 p.

50
Weather spark, 2018. Average weather in Ipswich, South Dakota; Available online at
https://weatherspark.com/y/6301/Average-Weather-in-Ipswich-South-Dakota-United-
States-Year-Round. Accessed on July 12, 2018.
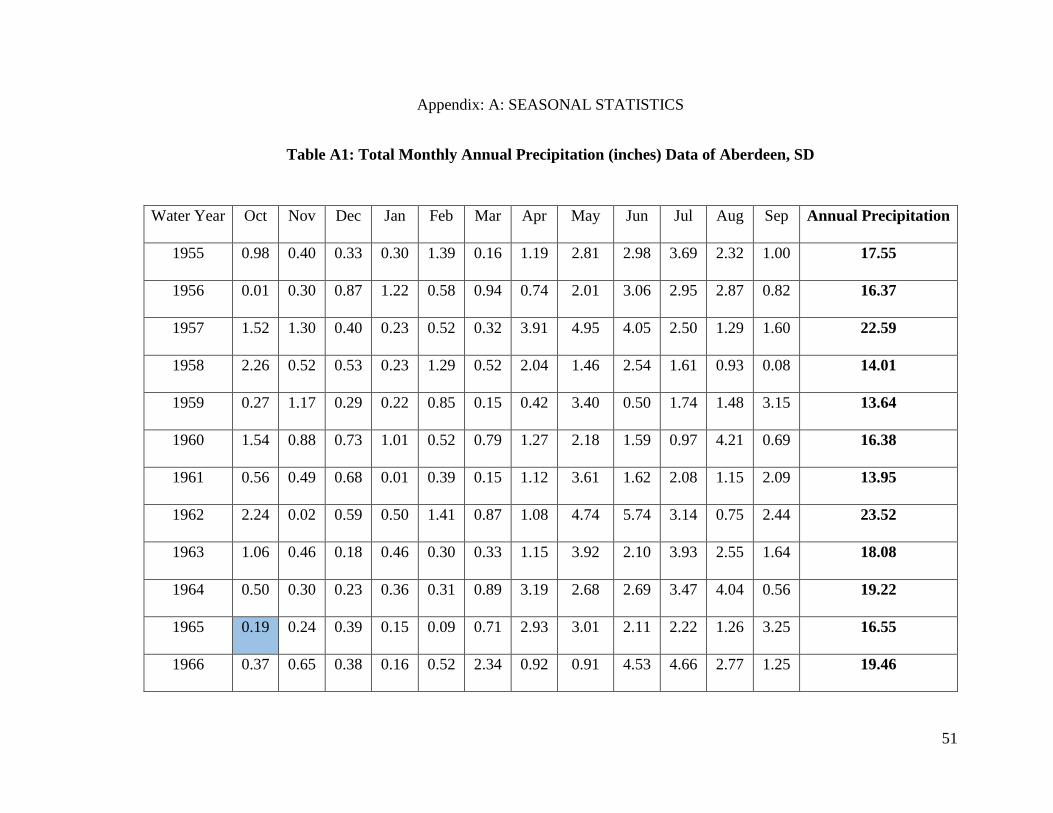
51
Appendix: A: SEASONAL STATISTICS
Table A1: Total Monthly Annual Precipitation (inches) Data of Aberdeen, SD
Water Year Oct Nov Dec Jan Feb Mar Apr May Jun Jul Aug Sep Annual Precipitation
1955 0.98 0.40 0.33 0.30 1.39 0.16 1.19 2.81 2.98 3.69 2.32 1.00 17.55
1956 0.01 0.30 0.87 1.22 0.58 0.94 0.74 2.01 3.06 2.95 2.87 0.82 16.37
1957 1.52 1.30 0.40 0.23 0.52 0.32 3.91 4.95 4.05 2.50 1.29 1.60 22.59
1958 2.26 0.52 0.53 0.23 1.29 0.52 2.04 1.46 2.54 1.61 0.93 0.08 14.01
1959 0.27 1.17 0.29 0.22 0.85 0.15 0.42 3.40 0.50 1.74 1.48 3.15 13.64
1960 1.54 0.88 0.73 1.01 0.52 0.79 1.27 2.18 1.59 0.97 4.21 0.69 16.38
1961 0.56 0.49 0.68 0.01 0.39 0.15 1.12 3.61 1.62 2.08 1.15 2.09 13.95
1962 2.24 0.02 0.59 0.50 1.41 0.87 1.08 4.74 5.74 3.14 0.75 2.44 23.52
1963 1.06 0.46 0.18 0.46 0.30 0.33 1.15 3.92 2.10 3.93 2.55 1.64 18.08
1964 0.50 0.30 0.23 0.36 0.31 0.89 3.19 2.68 2.69 3.47 4.04 0.56 19.22
1965 0.19 0.24 0.39 0.15 0.09 0.71 2.93 3.01 2.11 2.22 1.26 3.25 16.55
1966 0.37 0.65 0.38 0.16 0.52 2.34 0.92 0.91 4.53 4.66 2.77 1.25 19.46
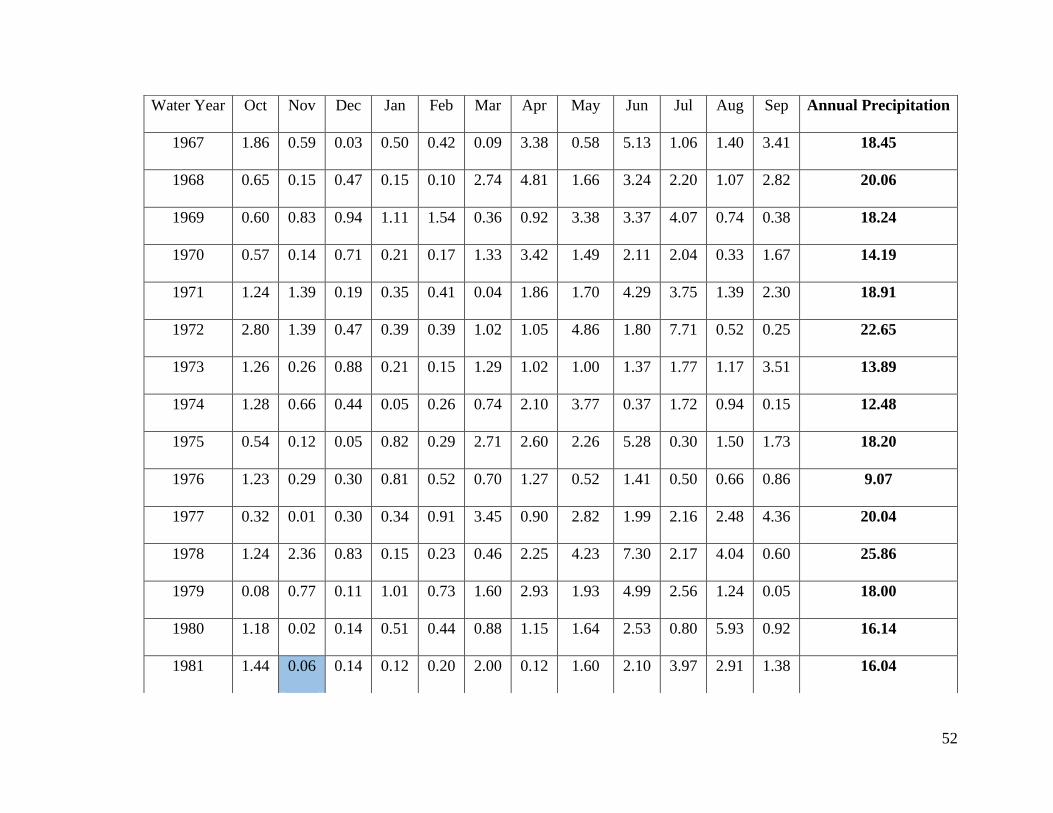
52
Water Year Oct Nov Dec Jan Feb Mar Apr May Jun Jul Aug Sep Annual Precipitation
1967 1.86 0.59 0.03 0.50 0.42 0.09 3.38 0.58 5.13 1.06 1.40 3.41 18.45
1968 0.65 0.15 0.47 0.15 0.10 2.74 4.81 1.66 3.24 2.20 1.07 2.82 20.06
1969 0.60 0.83 0.94 1.11 1.54 0.36 0.92 3.38 3.37 4.07 0.74 0.38 18.24
1970 0.57 0.14 0.71 0.21 0.17 1.33 3.42 1.49 2.11 2.04 0.33 1.67 14.19
1971 1.24 1.39 0.19 0.35 0.41 0.04 1.86 1.70 4.29 3.75 1.39 2.30 18.91
1972 2.80 1.39 0.47 0.39 0.39 1.02 1.05 4.86 1.80 7.71 0.52 0.25 22.65
1973 1.26 0.26 0.88 0.21 0.15 1.29 1.02 1.00 1.37 1.77 1.17 3.51 13.89
1974 1.28 0.66 0.44 0.05 0.26 0.74 2.10 3.77 0.37 1.72 0.94 0.15 12.48
1975 0.54 0.12 0.05 0.82 0.29 2.71 2.60 2.26 5.28 0.30 1.50 1.73 18.20
1976 1.23 0.29 0.30 0.81 0.52 0.70 1.27 0.52 1.41 0.50 0.66 0.86 9.07
1977 0.32 0.01 0.30 0.34 0.91 3.45 0.90 2.82 1.99 2.16 2.48 4.36 20.04
1978 1.24 2.36 0.83 0.15 0.23 0.46 2.25 4.23 7.30 2.17 4.04 0.60 25.86
1979 0.08 0.77 0.11 1.01 0.73 1.60 2.93 1.93 4.99 2.56 1.24 0.05 18.00
1980 1.18 0.02 0.14 0.51 0.44 0.88 1.15 1.64 2.53 0.80 5.93 0.92 16.14
1981 1.44 0.06 0.14 0.12 0.20 2.00 0.12 1.60 2.10 3.97 2.91 1.38 16.04
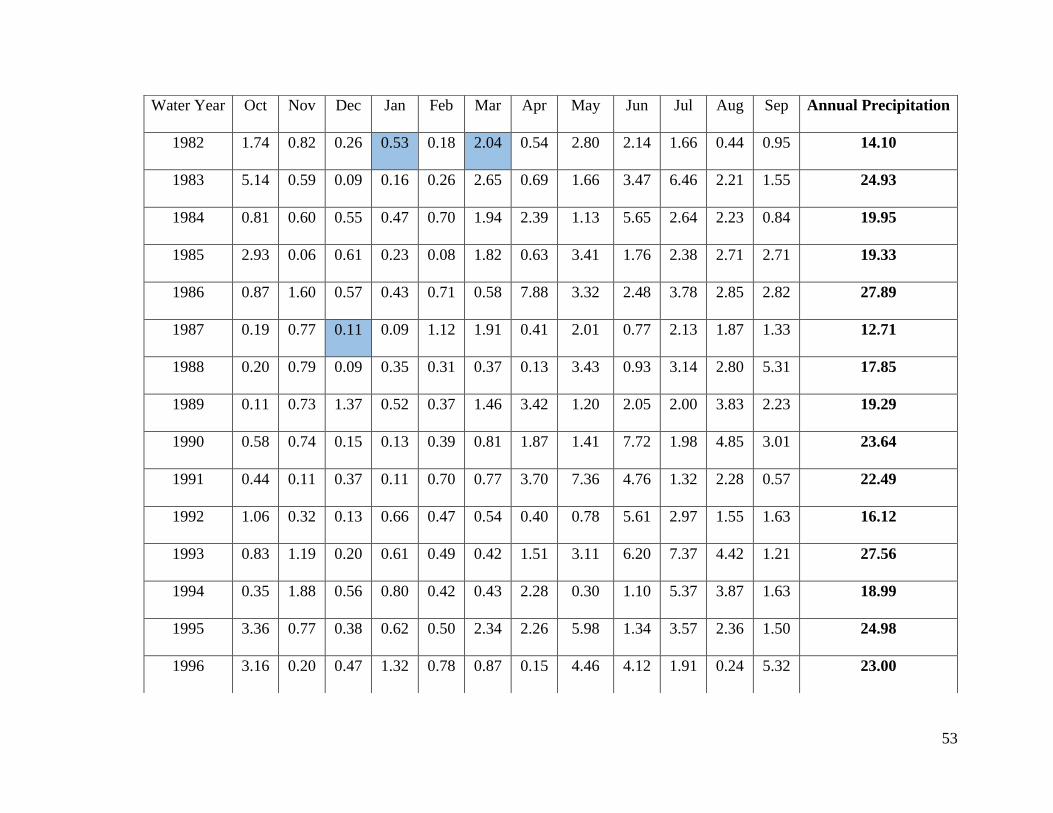
53
Water Year Oct Nov Dec Jan Feb Mar Apr May Jun Jul Aug Sep Annual Precipitation
1982 1.74 0.82 0.26 0.53 0.18 2.04 0.54 2.80 2.14 1.66 0.44 0.95 14.10
1983 5.14 0.59 0.09 0.16 0.26 2.65 0.69 1.66 3.47 6.46 2.21 1.55 24.93
1984 0.81 0.60 0.55 0.47 0.70 1.94 2.39 1.13 5.65 2.64 2.23 0.84 19.95
1985 2.93 0.06 0.61 0.23 0.08 1.82 0.63 3.41 1.76 2.38 2.71 2.71 19.33
1986 0.87 1.60 0.57 0.43 0.71 0.58 7.88 3.32 2.48 3.78 2.85 2.82 27.89
1987 0.19 0.77 0.11 0.09 1.12 1.91 0.41 2.01 0.77 2.13 1.87 1.33 12.71
1988 0.20 0.79 0.09 0.35 0.31 0.37 0.13 3.43 0.93 3.14 2.80 5.31 17.85
1989 0.11 0.73 1.37 0.52 0.37 1.46 3.42 1.20 2.05 2.00 3.83 2.23 19.29
1990 0.58 0.74 0.15 0.13 0.39 0.81 1.87 1.41 7.72 1.98 4.85 3.01 23.64
1991 0.44 0.11 0.37 0.11 0.70 0.77 3.70 7.36 4.76 1.32 2.28 0.57 22.49
1992 1.06 0.32 0.13 0.66 0.47 0.54 0.40 0.78 5.61 2.97 1.55 1.63 16.12
1993 0.83 1.19 0.20 0.61 0.49 0.42 1.51 3.11 6.20 7.37 4.42 1.21 27.56
1994 0.35 1.88 0.56 0.80 0.42 0.43 2.28 0.30 1.10 5.37 3.87 1.63 18.99
1995 3.36 0.77 0.38 0.62 0.50 2.34 2.26 5.98 1.34 3.57 2.36 1.50 24.98
1996 3.16 0.20 0.47 1.32 0.78 0.87 0.15 4.46 4.12 1.91 0.24 5.32 23.00
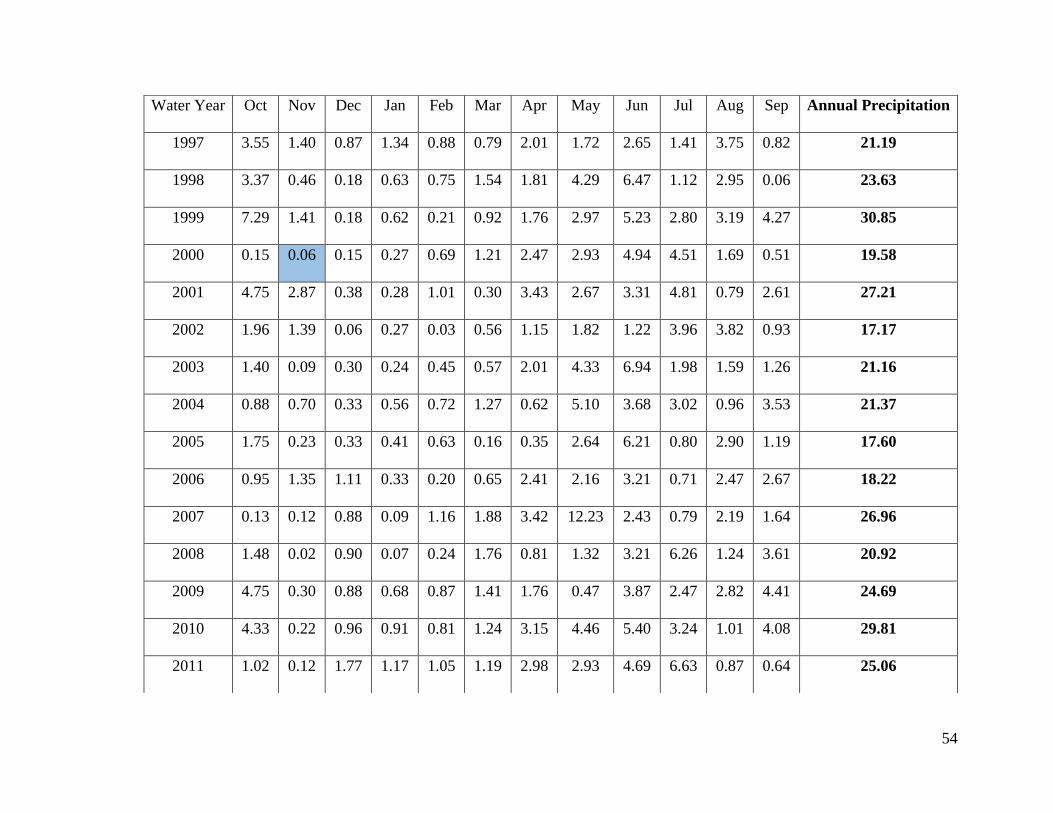
54
Water Year Oct Nov Dec Jan Feb Mar Apr May Jun Jul Aug Sep Annual Precipitation
1997 3.55 1.40 0.87 1.34 0.88 0.79 2.01 1.72 2.65 1.41 3.75 0.82 21.19
1998 3.37 0.46 0.18 0.63 0.75 1.54 1.81 4.29 6.47 1.12 2.95 0.06 23.63
1999 7.29 1.41 0.18 0.62 0.21 0.92 1.76 2.97 5.23 2.80 3.19 4.27 30.85
2000 0.15 0.06 0.15 0.27 0.69 1.21 2.47 2.93 4.94 4.51 1.69 0.51 19.58
2001 4.75 2.87 0.38 0.28 1.01 0.30 3.43 2.67 3.31 4.81 0.79 2.61 27.21
2002 1.96 1.39 0.06 0.27 0.03 0.56 1.15 1.82 1.22 3.96 3.82 0.93 17.17
2003 1.40 0.09 0.30 0.24 0.45 0.57 2.01 4.33 6.94 1.98 1.59 1.26 21.16
2004 0.88 0.70 0.33 0.56 0.72 1.27 0.62 5.10 3.68 3.02 0.96 3.53 21.37
2005 1.75 0.23 0.33 0.41 0.63 0.16 0.35 2.64 6.21 0.80 2.90 1.19 17.60
2006 0.95 1.35 1.11 0.33 0.20 0.65 2.41 2.16 3.21 0.71 2.47 2.67 18.22
2007 0.13 0.12 0.88 0.09 1.16 1.88 3.42 12.23 2.43 0.79 2.19 1.64 26.96
2008 1.48 0.02 0.90 0.07 0.24 1.76 0.81 1.32 3.21 6.26 1.24 3.61 20.92
2009 4.75 0.30 0.88 0.68 0.87 1.41 1.76 0.47 3.87 2.47 2.82 4.41 24.69
2010 4.33 0.22 0.96 0.91 0.81 1.24 3.15 4.46 5.40 3.24 1.01 4.08 29.81
2011 1.02 0.12 1.77 1.17 1.05 1.19 2.98 2.93 4.69 6.63 0.87 0.64 25.06
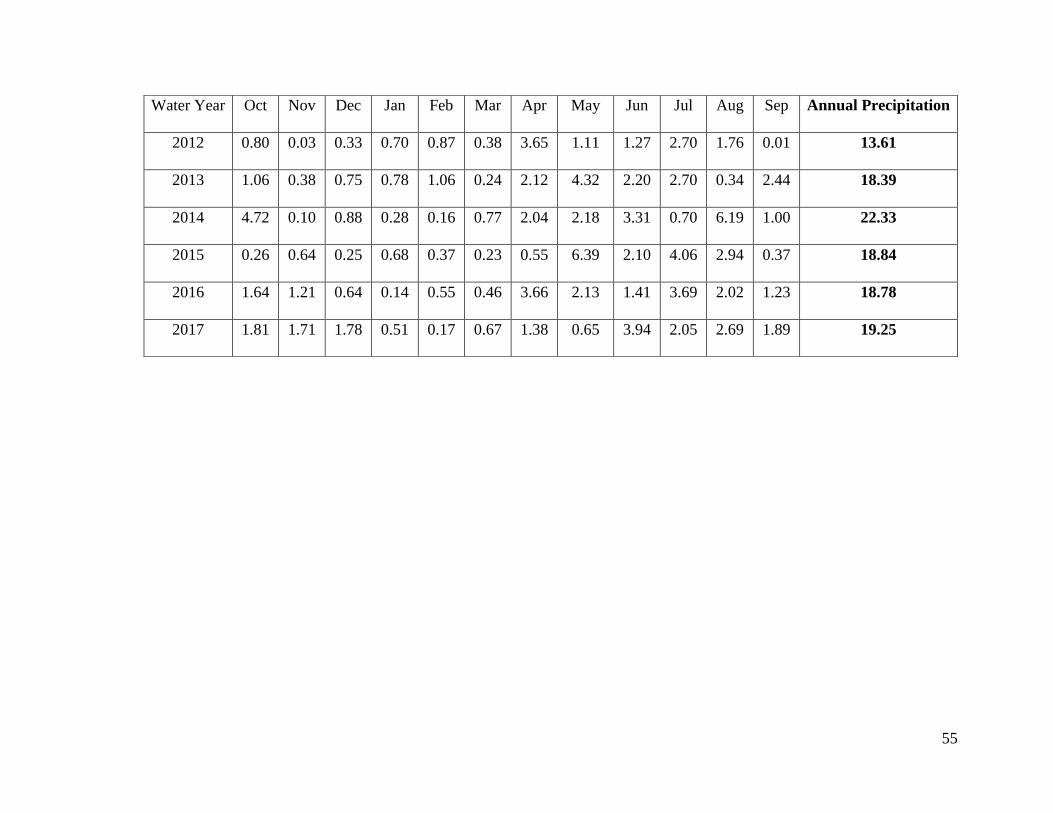
55
Water Year Oct Nov Dec Jan Feb Mar Apr May Jun Jul Aug Sep Annual Precipitation
2012 0.80 0.03 0.33 0.70 0.87 0.38 3.65 1.11 1.27 2.70 1.76 0.01 13.61
2013 1.06 0.38 0.75 0.78 1.06 0.24 2.12 4.32 2.20 2.70 0.34 2.44 18.39
2014 4.72 0.10 0.88 0.28 0.16 0.77 2.04 2.18 3.31 0.70 6.19 1.00 22.33
2015 0.26 0.64 0.25 0.68 0.37 0.23 0.55 6.39 2.10 4.06 2.94 0.37 18.84
2016 1.64 1.21 0.64 0.14 0.55 0.46 3.66 2.13 1.41 3.69 2.02 1.23 18.78
2017 1.81 1.71 1.78 0.51 0.17 0.67 1.38 0.65 3.94 2.05 2.69 1.89 19.25
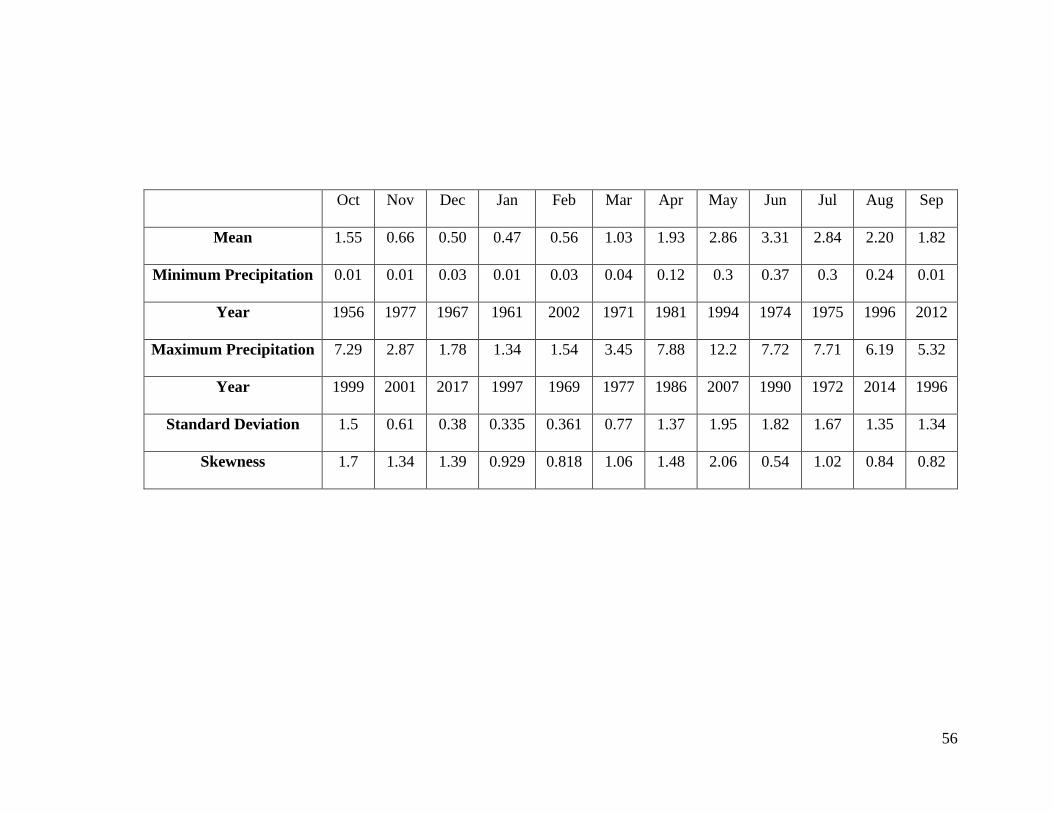
56
Oct Nov Dec Jan Feb Mar Apr May Jun Jul Aug Sep
Mean 1.55 0.66 0.50 0.47 0.56 1.03 1.93 2.86 3.31 2.84 2.20 1.82
Minimum Precipitation 0.01 0.01 0.03 0.01 0.03 0.04 0.12 0.3 0.37 0.3 0.24 0.01
Year 1956 1977 1967 1961 2002 1971 1981 1994 1974 1975 1996 2012
Maximum Precipitation 7.29 2.87 1.78 1.34 1.54 3.45 7.88 12.2 7.72 7.71 6.19 5.32
Year 1999 2001 2017 1997 1969 1977 1986 2007 1990 1972 2014 1996
Standard Deviation 1.5 0.61 0.38 0.335 0.361 0.77 1.37 1.95 1.82 1.67 1.35 1.34
Skewness 1.7 1.34 1.39 0.929 0.818 1.06 1.48 2.06 0.54 1.02 0.84 0.82
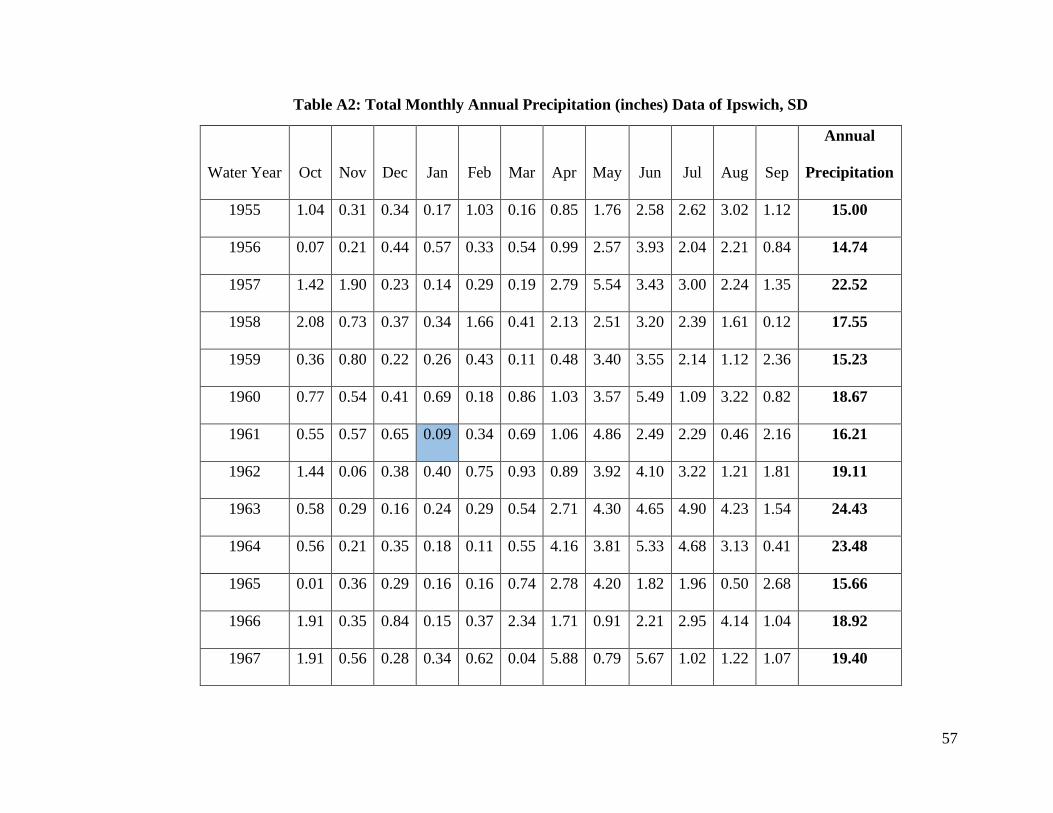
57
Table A2: Total Monthly Annual Precipitation (inches) Data of Ipswich, SD
Water Year Oct Nov Dec Jan Feb Mar Apr May Jun Jul Aug Sep
Annual
Precipitation
1955 1.04 0.31 0.34 0.17 1.03 0.16 0.85 1.76 2.58 2.62 3.02 1.12 15.00
1956 0.07 0.21 0.44 0.57 0.33 0.54 0.99 2.57 3.93 2.04 2.21 0.84 14.74
1957 1.42 1.90 0.23 0.14 0.29 0.19 2.79 5.54 3.43 3.00 2.24 1.35 22.52
1958 2.08 0.73 0.37 0.34 1.66 0.41 2.13 2.51 3.20 2.39 1.61 0.12 17.55
1959 0.36 0.80 0.22 0.26 0.43 0.11 0.48 3.40 3.55 2.14 1.12 2.36 15.23
1960 0.77 0.54 0.41 0.69 0.18 0.86 1.03 3.57 5.49 1.09 3.22 0.82 18.67
1961 0.55 0.57 0.65 0.09 0.34 0.69 1.06 4.86 2.49 2.29 0.46 2.16 16.21
1962 1.44 0.06 0.38 0.40 0.75 0.93 0.89 3.92 4.10 3.22 1.21 1.81 19.11
1963 0.58 0.29 0.16 0.24 0.29 0.54 2.71 4.30 4.65 4.90 4.23 1.54 24.43
1964 0.56 0.21 0.35 0.18 0.11 0.55 4.16 3.81 5.33 4.68 3.13 0.41 23.48
1965 0.01 0.36 0.29 0.16 0.16 0.74 2.78 4.20 1.82 1.96 0.50 2.68 15.66
1966 1.91 0.35 0.84 0.15 0.37 2.34 1.71 0.91 2.21 2.95 4.14 1.04 18.92
1967 1.91 0.56 0.28 0.34 0.62 0.04 5.88 0.79 5.67 1.02 1.22 1.07 19.40
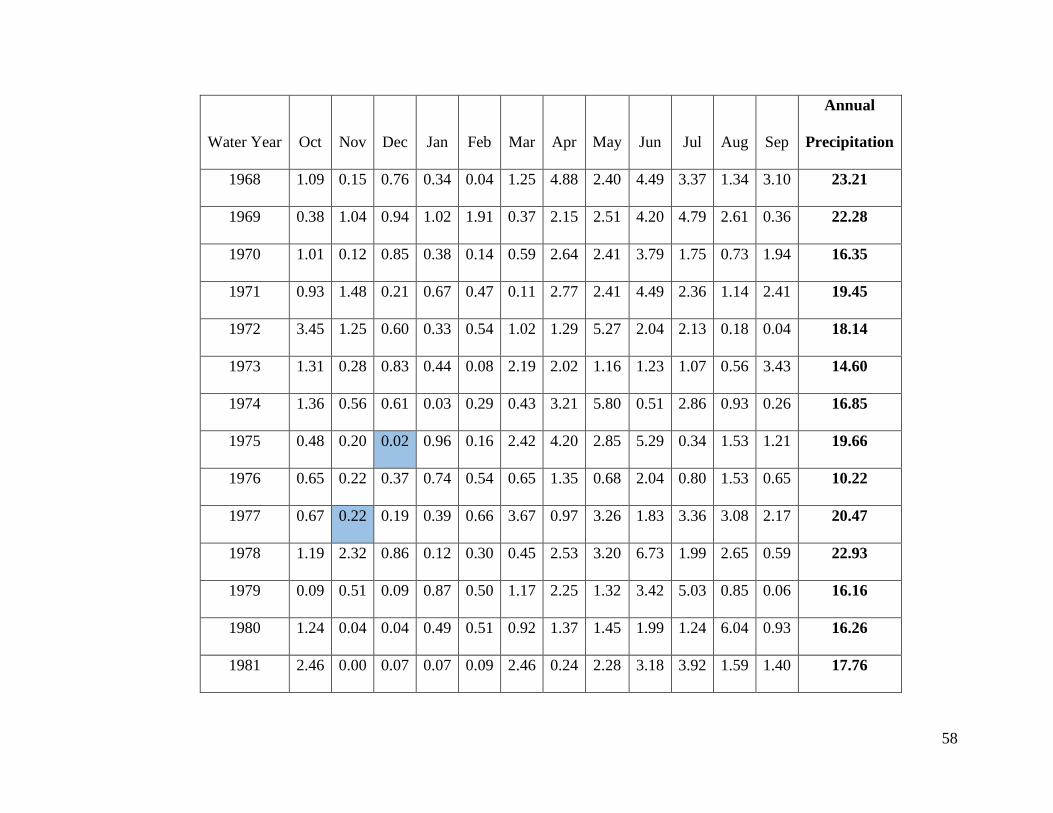
58
Water Year Oct Nov Dec Jan Feb Mar Apr May Jun Jul Aug Sep
Annual
Precipitation
1968 1.09 0.15 0.76 0.34 0.04 1.25 4.88 2.40 4.49 3.37 1.34 3.10 23.21
1969 0.38 1.04 0.94 1.02 1.91 0.37 2.15 2.51 4.20 4.79 2.61 0.36 22.28
1970 1.01 0.12 0.85 0.38 0.14 0.59 2.64 2.41 3.79 1.75 0.73 1.94 16.35
1971 0.93 1.48 0.21 0.67 0.47 0.11 2.77 2.41 4.49 2.36 1.14 2.41 19.45
1972 3.45 1.25 0.60 0.33 0.54 1.02 1.29 5.27 2.04 2.13 0.18 0.04 18.14
1973 1.31 0.28 0.83 0.44 0.08 2.19 2.02 1.16 1.23 1.07 0.56 3.43 14.60
1974 1.36 0.56 0.61 0.03 0.29 0.43 3.21 5.80 0.51 2.86 0.93 0.26 16.85
1975 0.48 0.20 0.02 0.96 0.16 2.42 4.20 2.85 5.29 0.34 1.53 1.21 19.66
1976 0.65 0.22 0.37 0.74 0.54 0.65 1.35 0.68 2.04 0.80 1.53 0.65 10.22
1977 0.67 0.22 0.19 0.39 0.66 3.67 0.97 3.26 1.83 3.36 3.08 2.17 20.47
1978 1.19 2.32 0.86 0.12 0.30 0.45 2.53 3.20 6.73 1.99 2.65 0.59 22.93
1979 0.09 0.51 0.09 0.87 0.50 1.17 2.25 1.32 3.42 5.03 0.85 0.06 16.16
1980 1.24 0.04 0.04 0.49 0.51 0.92 1.37 1.45 1.99 1.24 6.04 0.93 16.26
1981 2.46 0.00 0.07 0.07 0.09 2.46 0.24 2.28 3.18 3.92 1.59 1.40 17.76
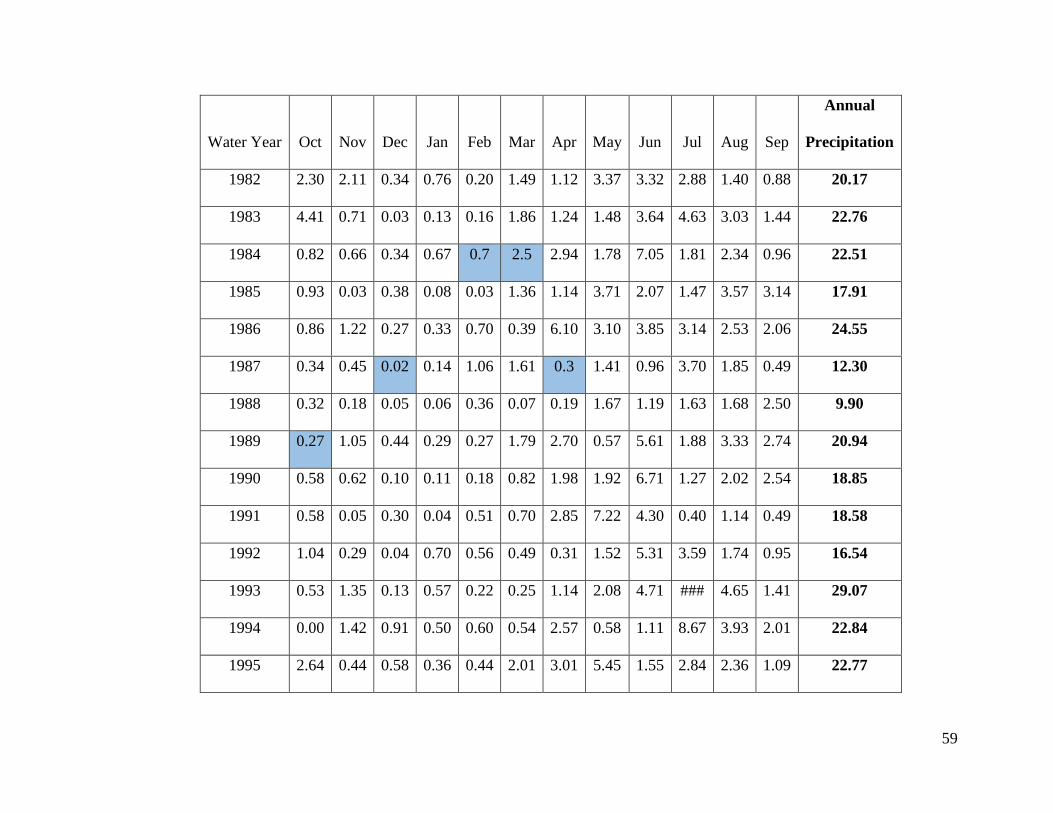
59
Water Year Oct Nov Dec Jan Feb Mar Apr May Jun Jul Aug Sep
Annual
Precipitation
1982 2.30 2.11 0.34 0.76 0.20 1.49 1.12 3.37 3.32 2.88 1.40 0.88 20.17
1983 4.41 0.71 0.03 0.13 0.16 1.86 1.24 1.48 3.64 4.63 3.03 1.44 22.76
1984 0.82 0.66 0.34 0.67 0.7 2.5 2.94 1.78 7.05 1.81 2.34 0.96 22.51
1985 0.93 0.03 0.38 0.08 0.03 1.36 1.14 3.71 2.07 1.47 3.57 3.14 17.91
1986 0.86 1.22 0.27 0.33 0.70 0.39 6.10 3.10 3.85 3.14 2.53 2.06 24.55
1987 0.34 0.45 0.02 0.14 1.06 1.61 0.3 1.41 0.96 3.70 1.85 0.49 12.30
1988 0.32 0.18 0.05 0.06 0.36 0.07 0.19 1.67 1.19 1.63 1.68 2.50 9.90
1989 0.27 1.05 0.44 0.29 0.27 1.79 2.70 0.57 5.61 1.88 3.33 2.74 20.94
1990 0.58 0.62 0.10 0.11 0.18 0.82 1.98 1.92 6.71 1.27 2.02 2.54 18.85
1991 0.58 0.05 0.30 0.04 0.51 0.70 2.85 7.22 4.30 0.40 1.14 0.49 18.58
1992 1.04 0.29 0.04 0.70 0.56 0.49 0.31 1.52 5.31 3.59 1.74 0.95 16.54
1993 0.53 1.35 0.13 0.57 0.22 0.25 1.14 2.08 4.71 ### 4.65 1.41 29.07
1994 0.00 1.42 0.91 0.50 0.60 0.54 2.57 0.58 1.11 8.67 3.93 2.01 22.84
1995 2.64 0.44 0.58 0.36 0.44 2.01 3.01 5.45 1.55 2.84 2.36 1.09 22.77
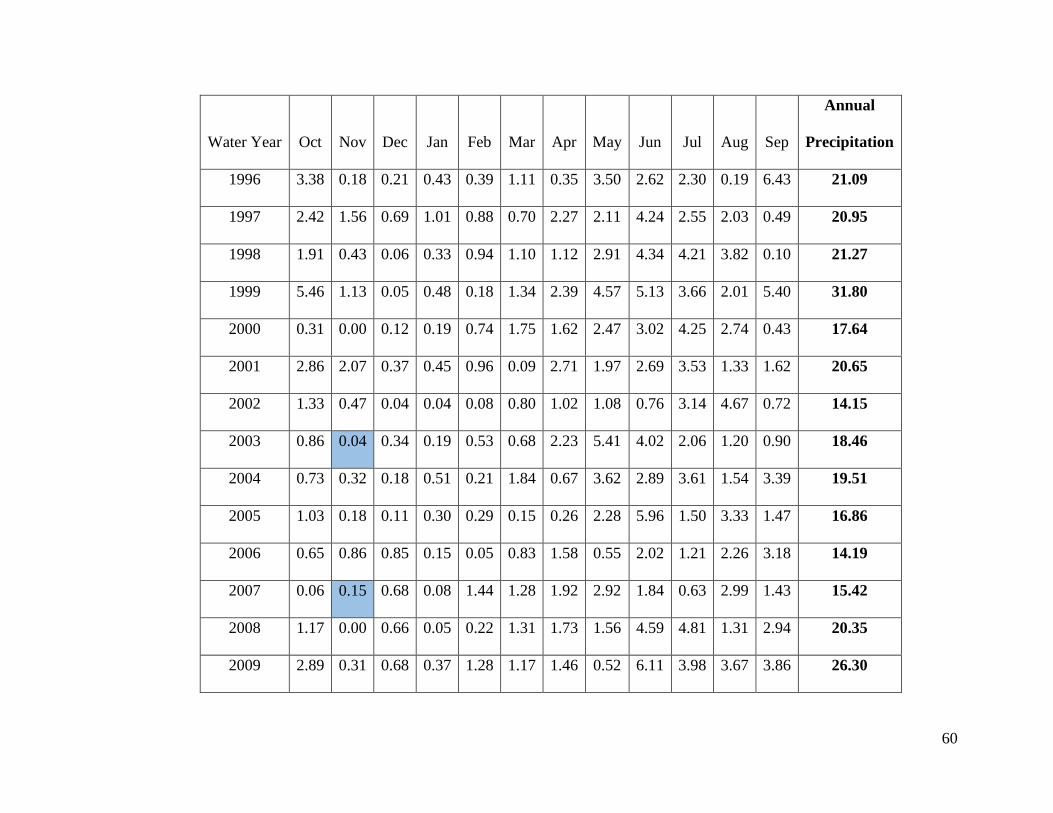
60
Water Year Oct Nov Dec Jan Feb Mar Apr May Jun Jul Aug Sep
Annual
Precipitation
1996 3.38 0.18 0.21 0.43 0.39 1.11 0.35 3.50 2.62 2.30 0.19 6.43 21.09
1997 2.42 1.56 0.69 1.01 0.88 0.70 2.27 2.11 4.24 2.55 2.03 0.49 20.95
1998 1.91 0.43 0.06 0.33 0.94 1.10 1.12 2.91 4.34 4.21 3.82 0.10 21.27
1999 5.46 1.13 0.05 0.48 0.18 1.34 2.39 4.57 5.13 3.66 2.01 5.40 31.80
2000 0.31 0.00 0.12 0.19 0.74 1.75 1.62 2.47 3.02 4.25 2.74 0.43 17.64
2001 2.86 2.07 0.37 0.45 0.96 0.09 2.71 1.97 2.69 3.53 1.33 1.62 20.65
2002 1.33 0.47 0.04 0.04 0.08 0.80 1.02 1.08 0.76 3.14 4.67 0.72 14.15
2003 0.86 0.04 0.34 0.19 0.53 0.68 2.23 5.41 4.02 2.06 1.20 0.90 18.46
2004 0.73 0.32 0.18 0.51 0.21 1.84 0.67 3.62 2.89 3.61 1.54 3.39 19.51
2005 1.03 0.18 0.11 0.30 0.29 0.15 0.26 2.28 5.96 1.50 3.33 1.47 16.86
2006 0.65 0.86 0.85 0.15 0.05 0.83 1.58 0.55 2.02 1.21 2.26 3.18 14.19
2007 0.06 0.15 0.68 0.08 1.44 1.28 1.92 2.92 1.84 0.63 2.99 1.43 15.42
2008 1.17 0.00 0.66 0.05 0.22 1.31 1.73 1.56 4.59 4.81 1.31 2.94 20.35
2009 2.89 0.31 0.68 0.37 1.28 1.17 1.46 0.52 6.11 3.98 3.67 3.86 26.30
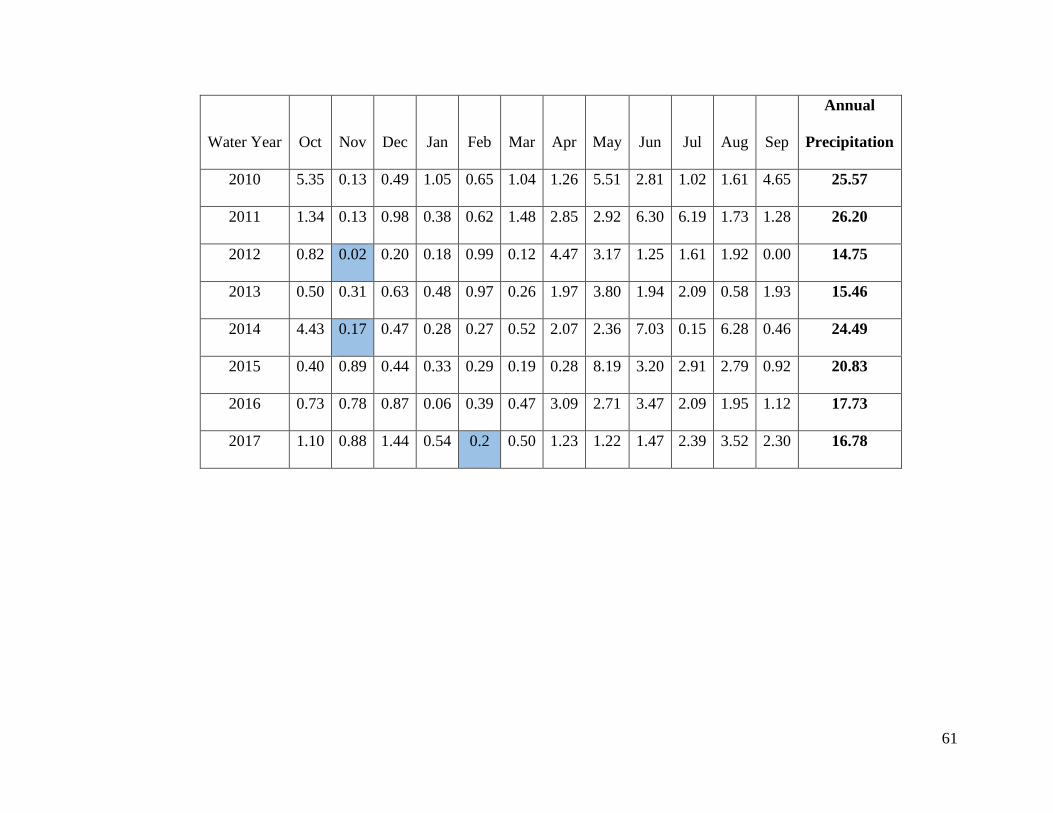
61
Water Year Oct Nov Dec Jan Feb Mar Apr May Jun Jul Aug Sep
Annual
Precipitation
2010 5.35 0.13 0.49 1.05 0.65 1.04 1.26 5.51 2.81 1.02 1.61 4.65 25.57
2011 1.34 0.13 0.98 0.38 0.62 1.48 2.85 2.92 6.30 6.19 1.73 1.28 26.20
2012 0.82 0.02 0.20 0.18 0.99 0.12 4.47 3.17 1.25 1.61 1.92 0.00 14.75
2013 0.50 0.31 0.63 0.48 0.97 0.26 1.97 3.80 1.94 2.09 0.58 1.93 15.46
2014 4.43 0.17 0.47 0.28 0.27 0.52 2.07 2.36 7.03 0.15 6.28 0.46 24.49
2015 0.40 0.89 0.44 0.33 0.29 0.19 0.28 8.19 3.20 2.91 2.79 0.92 20.83
2016 0.73 0.78 0.87 0.06 0.39 0.47 3.09 2.71 3.47 2.09 1.95 1.12 17.73
2017 1.10 0.88 1.44 0.54 0.2 0.50 1.23 1.22 1.47 2.39 3.52 2.30 16.78
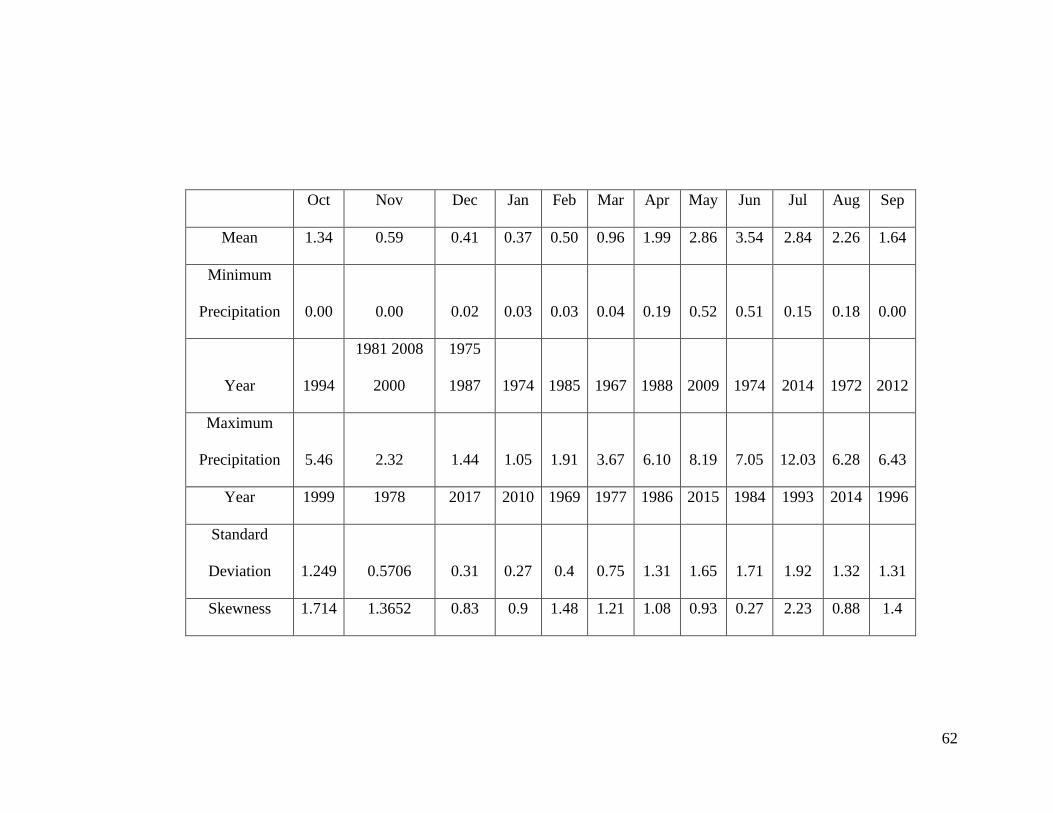
62
Oct Nov Dec Jan Feb Mar Apr May Jun Jul Aug Sep
Mean 1.34 0.59 0.41 0.37 0.50 0.96 1.99 2.86 3.54 2.84 2.26 1.64
Minimum
Precipitation 0.00 0.00 0.02 0.03 0.03 0.04 0.19 0.52 0.51 0.15 0.18 0.00
Year 1994
1981 2008
2000
1975
1987 1974 1985 1967 1988 2009 1974 2014 1972 2012
Maximum
Precipitation 5.46 2.32 1.44 1.05 1.91 3.67 6.10 8.19 7.05 12.03 6.28 6.43
Year 1999 1978 2017 2010 1969 1977 1986 2015 1984 1993 2014 1996
Standard
Deviation 1.249 0.5706 0.31 0.27 0.4 0.75 1.31 1.65 1.71 1.92 1.32 1.31
Skewness 1.714 1.3652 0.83 0.9 1.48 1.21 1.08 0.93 0.27 2.23 0.88 1.4
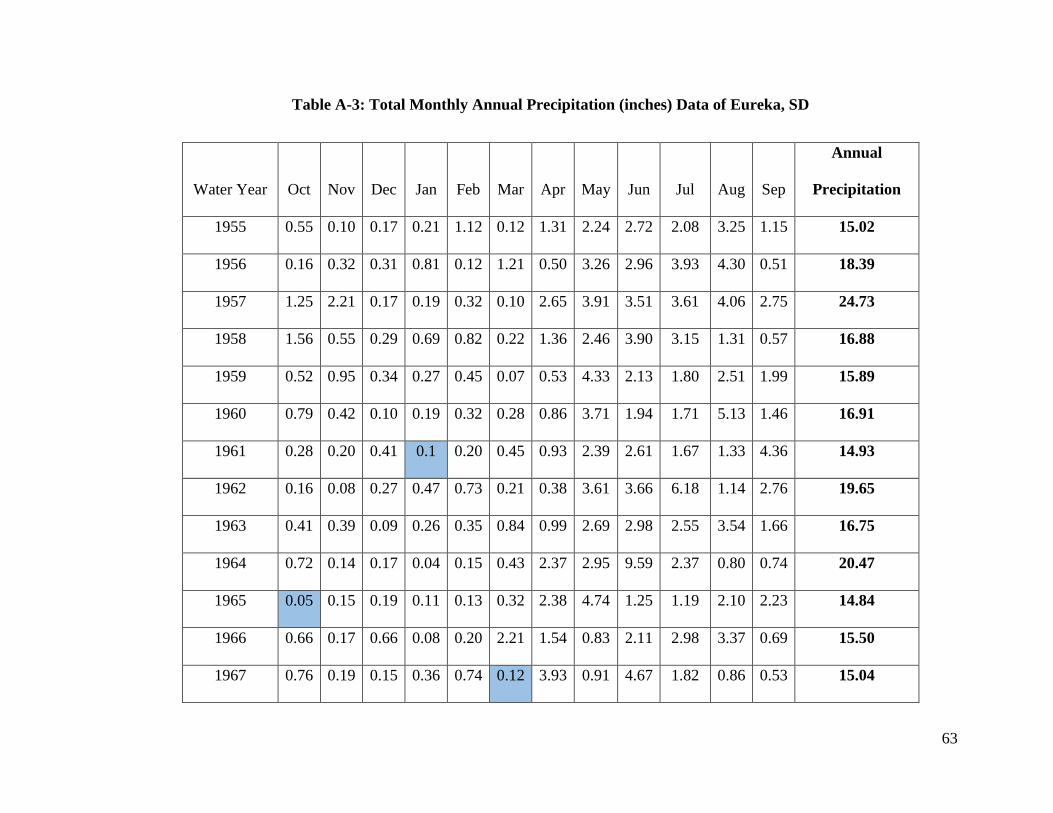
63
Table A-3: Total Monthly Annual Precipitation (inches) Data of Eureka, SD
Water Year Oct Nov Dec Jan Feb Mar Apr May Jun Jul Aug Sep
Annual
Precipitation
1955 0.55 0.10 0.17 0.21 1.12 0.12 1.31 2.24 2.72 2.08 3.25 1.15 15.02
1956 0.16 0.32 0.31 0.81 0.12 1.21 0.50 3.26 2.96 3.93 4.30 0.51 18.39
1957 1.25 2.21 0.17 0.19 0.32 0.10 2.65 3.91 3.51 3.61 4.06 2.75 24.73
1958 1.56 0.55 0.29 0.69 0.82 0.22 1.36 2.46 3.90 3.15 1.31 0.57 16.88
1959 0.52 0.95 0.34 0.27 0.45 0.07 0.53 4.33 2.13 1.80 2.51 1.99 15.89
1960 0.79 0.42 0.10 0.19 0.32 0.28 0.86 3.71 1.94 1.71 5.13 1.46 16.91
1961 0.28 0.20 0.41 0.1 0.20 0.45 0.93 2.39 2.61 1.67 1.33 4.36 14.93
1962 0.16 0.08 0.27 0.47 0.73 0.21 0.38 3.61 3.66 6.18 1.14 2.76 19.65
1963 0.41 0.39 0.09 0.26 0.35 0.84 0.99 2.69 2.98 2.55 3.54 1.66 16.75
1964 0.72 0.14 0.17 0.04 0.15 0.43 2.37 2.95 9.59 2.37 0.80 0.74 20.47
1965 0.05 0.15 0.19 0.11 0.13 0.32 2.38 4.74 1.25 1.19 2.10 2.23 14.84
1966 0.66 0.17 0.66 0.08 0.20 2.21 1.54 0.83 2.11 2.98 3.37 0.69 15.50
1967 0.76 0.19 0.15 0.36 0.74 0.12 3.93 0.91 4.67 1.82 0.86 0.53 15.04
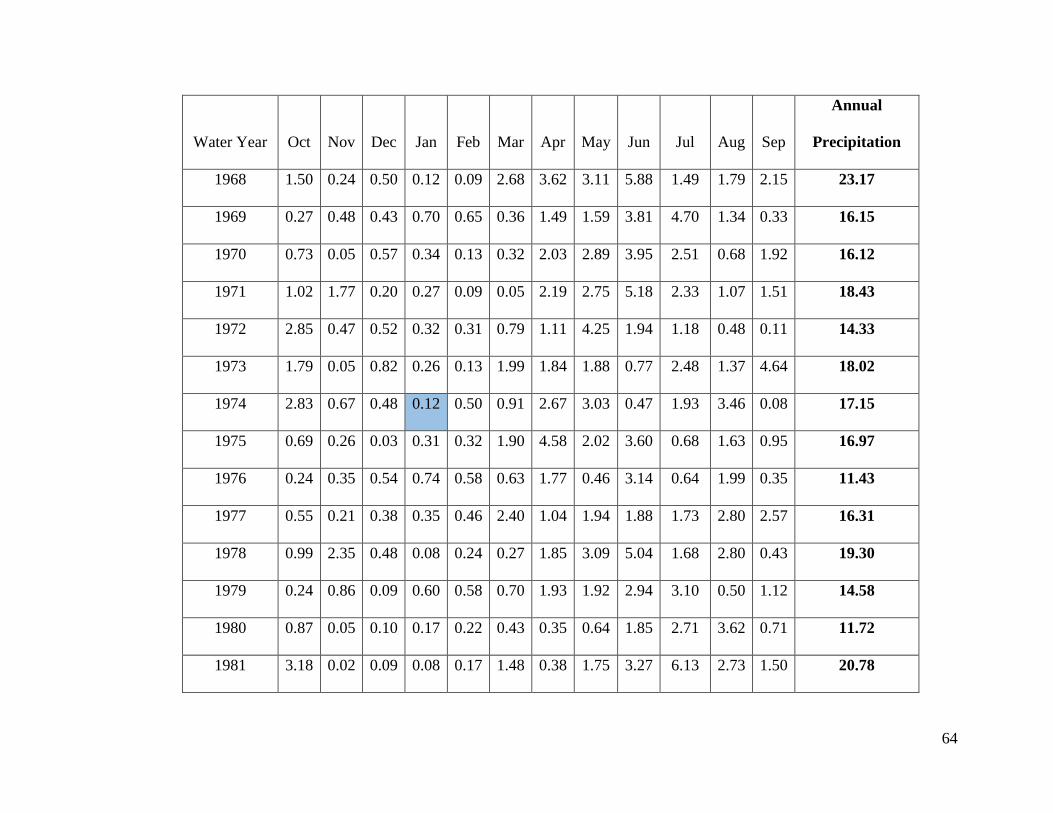
64
Water Year Oct Nov Dec Jan Feb Mar Apr May Jun Jul Aug Sep
Annual
Precipitation
1968 1.50 0.24 0.50 0.12 0.09 2.68 3.62 3.11 5.88 1.49 1.79 2.15 23.17
1969 0.27 0.48 0.43 0.70 0.65 0.36 1.49 1.59 3.81 4.70 1.34 0.33 16.15
1970 0.73 0.05 0.57 0.34 0.13 0.32 2.03 2.89 3.95 2.51 0.68 1.92 16.12
1971 1.02 1.77 0.20 0.27 0.09 0.05 2.19 2.75 5.18 2.33 1.07 1.51 18.43
1972 2.85 0.47 0.52 0.32 0.31 0.79 1.11 4.25 1.94 1.18 0.48 0.11 14.33
1973 1.79 0.05 0.82 0.26 0.13 1.99 1.84 1.88 0.77 2.48 1.37 4.64 18.02
1974 2.83 0.67 0.48 0.12 0.50 0.91 2.67 3.03 0.47 1.93 3.46 0.08 17.15
1975 0.69 0.26 0.03 0.31 0.32 1.90 4.58 2.02 3.60 0.68 1.63 0.95 16.97
1976 0.24 0.35 0.54 0.74 0.58 0.63 1.77 0.46 3.14 0.64 1.99 0.35 11.43
1977 0.55 0.21 0.38 0.35 0.46 2.40 1.04 1.94 1.88 1.73 2.80 2.57 16.31
1978 0.99 2.35 0.48 0.08 0.24 0.27 1.85 3.09 5.04 1.68 2.80 0.43 19.30
1979 0.24 0.86 0.09 0.60 0.58 0.70 1.93 1.92 2.94 3.10 0.50 1.12 14.58
1980 0.87 0.05 0.10 0.17 0.22 0.43 0.35 0.64 1.85 2.71 3.62 0.71 11.72
1981 3.18 0.02 0.09 0.08 0.17 1.48 0.38 1.75 3.27 6.13 2.73 1.50 20.78
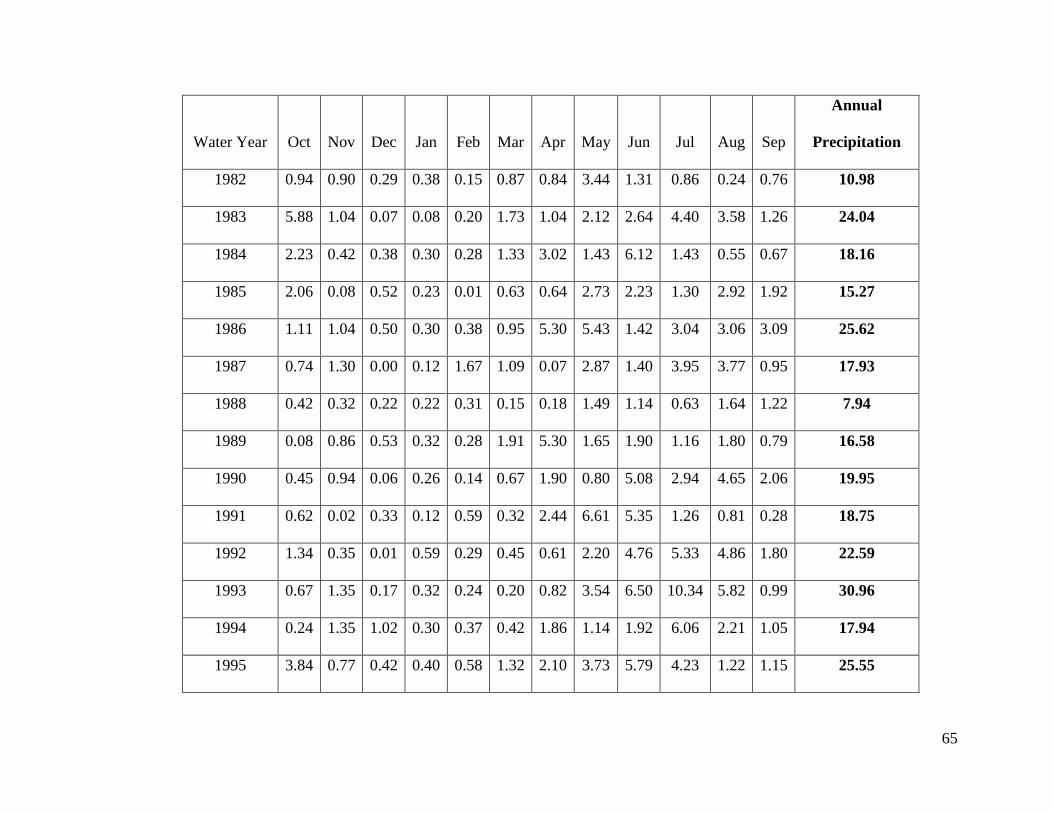
65
Water Year Oct Nov Dec Jan Feb Mar Apr May Jun Jul Aug Sep
Annual
Precipitation
1982 0.94 0.90 0.29 0.38 0.15 0.87 0.84 3.44 1.31 0.86 0.24 0.76 10.98
1983 5.88 1.04 0.07 0.08 0.20 1.73 1.04 2.12 2.64 4.40 3.58 1.26 24.04
1984 2.23 0.42 0.38 0.30 0.28 1.33 3.02 1.43 6.12 1.43 0.55 0.67 18.16
1985 2.06 0.08 0.52 0.23 0.01 0.63 0.64 2.73 2.23 1.30 2.92 1.92 15.27
1986 1.11 1.04 0.50 0.30 0.38 0.95 5.30 5.43 1.42 3.04 3.06 3.09 25.62
1987 0.74 1.30 0.00 0.12 1.67 1.09 0.07 2.87 1.40 3.95 3.77 0.95 17.93
1988 0.42 0.32 0.22 0.22 0.31 0.15 0.18 1.49 1.14 0.63 1.64 1.22 7.94
1989 0.08 0.86 0.53 0.32 0.28 1.91 5.30 1.65 1.90 1.16 1.80 0.79 16.58
1990 0.45 0.94 0.06 0.26 0.14 0.67 1.90 0.80 5.08 2.94 4.65 2.06 19.95
1991 0.62 0.02 0.33 0.12 0.59 0.32 2.44 6.61 5.35 1.26 0.81 0.28 18.75
1992 1.34 0.35 0.01 0.59 0.29 0.45 0.61 2.20 4.76 5.33 4.86 1.80 22.59
1993 0.67 1.35 0.17 0.32 0.24 0.20 0.82 3.54 6.50 10.34 5.82 0.99 30.96
1994 0.24 1.35 1.02 0.30 0.37 0.42 1.86 1.14 1.92 6.06 2.21 1.05 17.94
1995 3.84 0.77 0.42 0.40 0.58 1.32 2.10 3.73 5.79 4.23 1.22 1.15 25.55
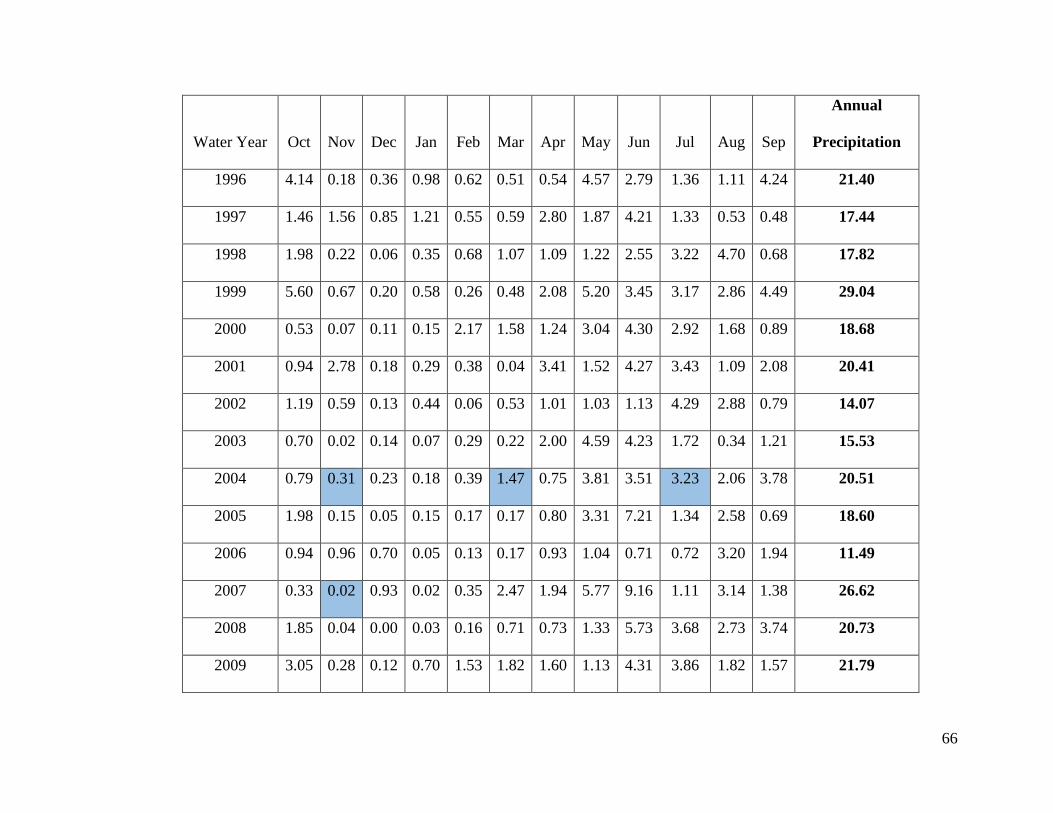
66
Water Year Oct Nov Dec Jan Feb Mar Apr May Jun Jul Aug Sep
Annual
Precipitation
1996 4.14 0.18 0.36 0.98 0.62 0.51 0.54 4.57 2.79 1.36 1.11 4.24 21.40
1997 1.46 1.56 0.85 1.21 0.55 0.59 2.80 1.87 4.21 1.33 0.53 0.48 17.44
1998 1.98 0.22 0.06 0.35 0.68 1.07 1.09 1.22 2.55 3.22 4.70 0.68 17.82
1999 5.60 0.67 0.20 0.58 0.26 0.48 2.08 5.20 3.45 3.17 2.86 4.49 29.04
2000 0.53 0.07 0.11 0.15 2.17 1.58 1.24 3.04 4.30 2.92 1.68 0.89 18.68
2001 0.94 2.78 0.18 0.29 0.38 0.04 3.41 1.52 4.27 3.43 1.09 2.08 20.41
2002 1.19 0.59 0.13 0.44 0.06 0.53 1.01 1.03 1.13 4.29 2.88 0.79 14.07
2003 0.70 0.02 0.14 0.07 0.29 0.22 2.00 4.59 4.23 1.72 0.34 1.21 15.53
2004 0.79 0.31 0.23 0.18 0.39 1.47 0.75 3.81 3.51 3.23 2.06 3.78 20.51
2005 1.98 0.15 0.05 0.15 0.17 0.17 0.80 3.31 7.21 1.34 2.58 0.69 18.60
2006 0.94 0.96 0.70 0.05 0.13 0.17 0.93 1.04 0.71 0.72 3.20 1.94 11.49
2007 0.33 0.02 0.93 0.02 0.35 2.47 1.94 5.77 9.16 1.11 3.14 1.38 26.62
2008 1.85 0.04 0.00 0.03 0.16 0.71 0.73 1.33 5.73 3.68 2.73 3.74 20.73
2009 3.05 0.28 0.12 0.70 1.53 1.82 1.60 1.13 4.31 3.86 1.82 1.57 21.79
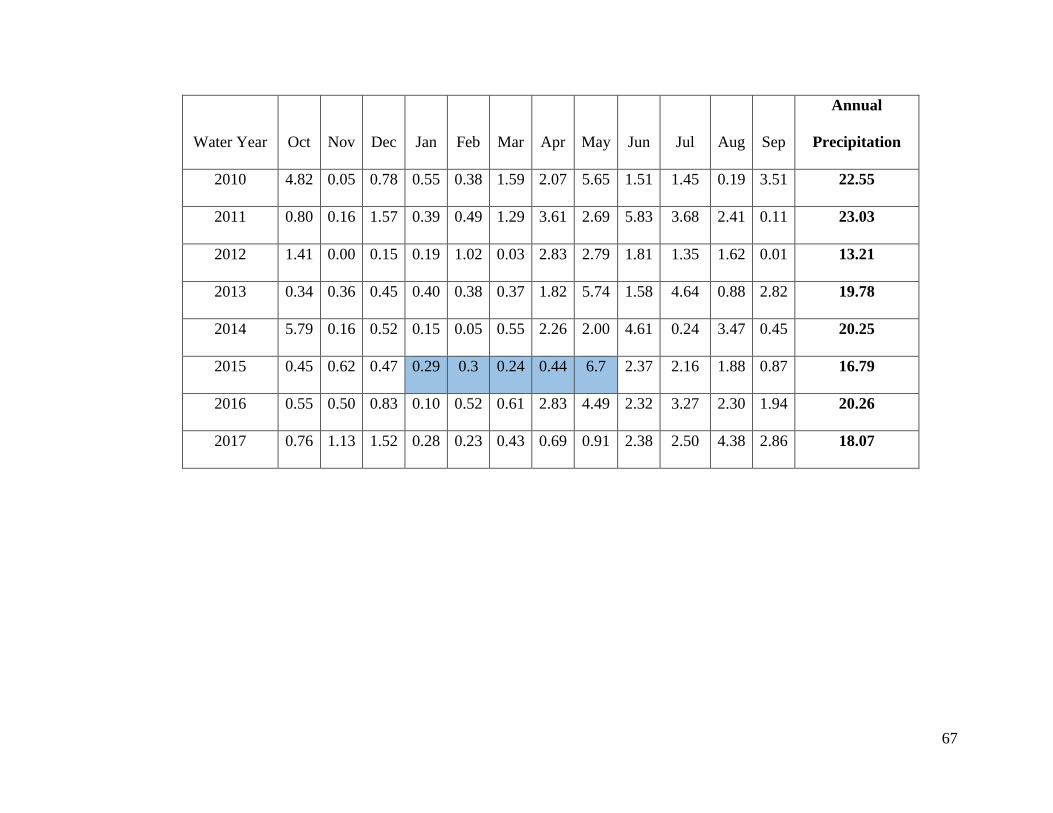
67
Water Year Oct Nov Dec Jan Feb Mar Apr May Jun Jul Aug Sep
Annual
Precipitation
2010 4.82 0.05 0.78 0.55 0.38 1.59 2.07 5.65 1.51 1.45 0.19 3.51 22.55
2011 0.80 0.16 1.57 0.39 0.49 1.29 3.61 2.69 5.83 3.68 2.41 0.11 23.03
2012 1.41 0.00 0.15 0.19 1.02 0.03 2.83 2.79 1.81 1.35 1.62 0.01 13.21
2013 0.34 0.36 0.45 0.40 0.38 0.37 1.82 5.74 1.58 4.64 0.88 2.82 19.78
2014 5.79 0.16 0.52 0.15 0.05 0.55 2.26 2.00 4.61 0.24 3.47 0.45 20.25
2015 0.45 0.62 0.47 0.29 0.3 0.24 0.44 6.7 2.37 2.16 1.88 0.87 16.79
2016 0.55 0.50 0.83 0.10 0.52 0.61 2.83 4.49 2.32 3.27 2.30 1.94 20.26
2017 0.76 1.13 1.52 0.28 0.23 0.43 0.69 0.91 2.38 2.50 4.38 2.86 18.07
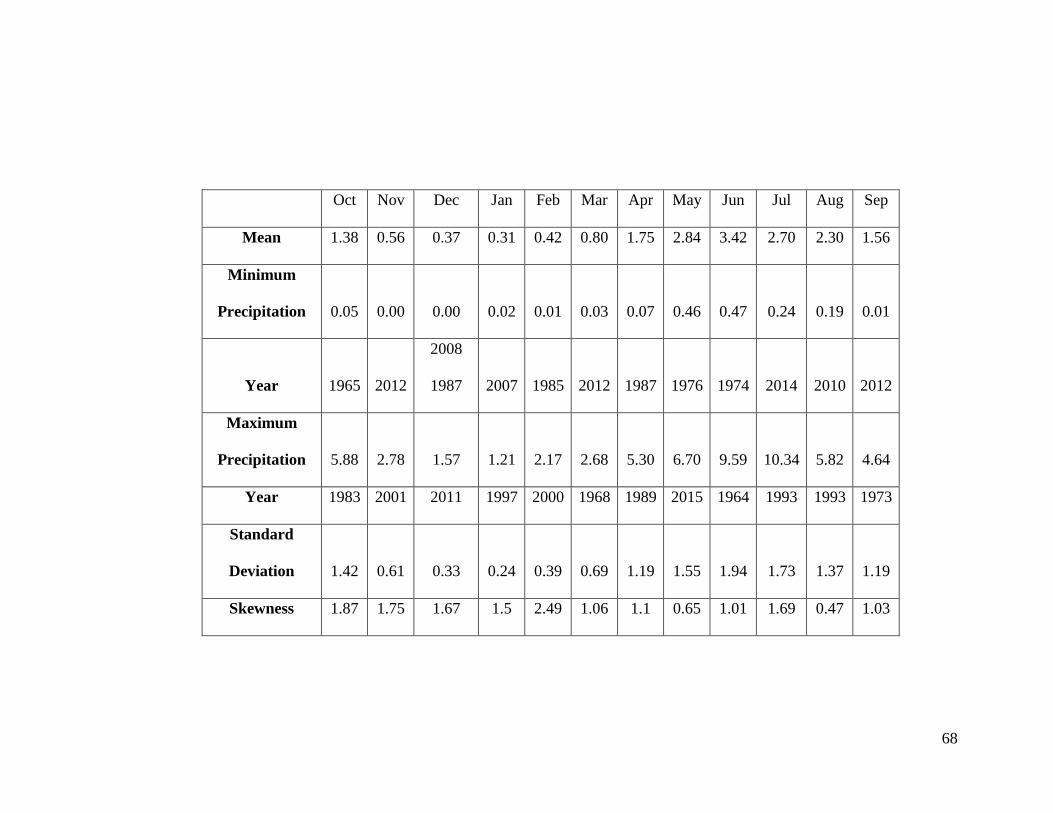
68
Oct Nov Dec Jan Feb Mar Apr May Jun Jul Aug Sep
Mean 1.38 0.56 0.37 0.31 0.42 0.80 1.75 2.84 3.42 2.70 2.30 1.56
Minimum
Precipitation 0.05 0.00 0.00 0.02 0.01 0.03 0.07 0.46 0.47 0.24 0.19 0.01
Year 1965 2012
2008
1987 2007 1985 2012 1987 1976 1974 2014 2010 2012
Maximum
Precipitation 5.88 2.78 1.57 1.21 2.17 2.68 5.30 6.70 9.59 10.34 5.82 4.64
Year 1983 2001 2011 1997 2000 1968 1989 2015 1964 1993 1993 1973
Standard
Deviation 1.42 0.61 0.33 0.24 0.39 0.69 1.19 1.55 1.94 1.73 1.37 1.19
Skewness 1.87 1.75 1.67 1.5 2.49 1.06 1.1 0.65 1.01 1.69 0.47 1.03
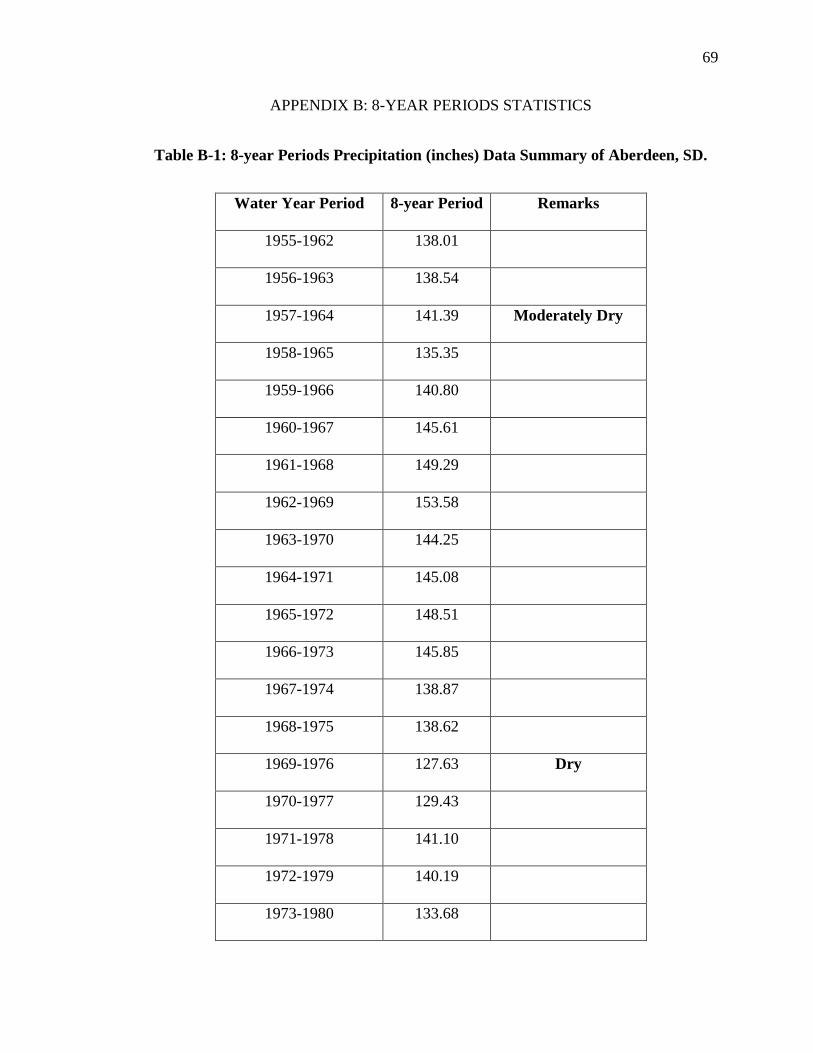
69
APPENDIX B: 8-YEAR PERIODS STATISTICS
Table B-1: 8-year Periods Precipitation (inches) Data Summary of Aberdeen, SD.
Water Year Period 8-year Period Remarks
1955-1962 138.01
1956-1963 138.54
1957-1964 141.39 Moderately Dry
1958-1965 135.35
1959-1966 140.80
1960-1967 145.61
1961-1968 149.29
1962-1969 153.58
1963-1970 144.25
1964-1971 145.08
1965-1972 148.51
1966-1973 145.85
1967-1974 138.87
1968-1975 138.62
1969-1976 127.63 Dry
1970-1977 129.43
1971-1978 141.10
1972-1979 140.19
1973-1980 133.68
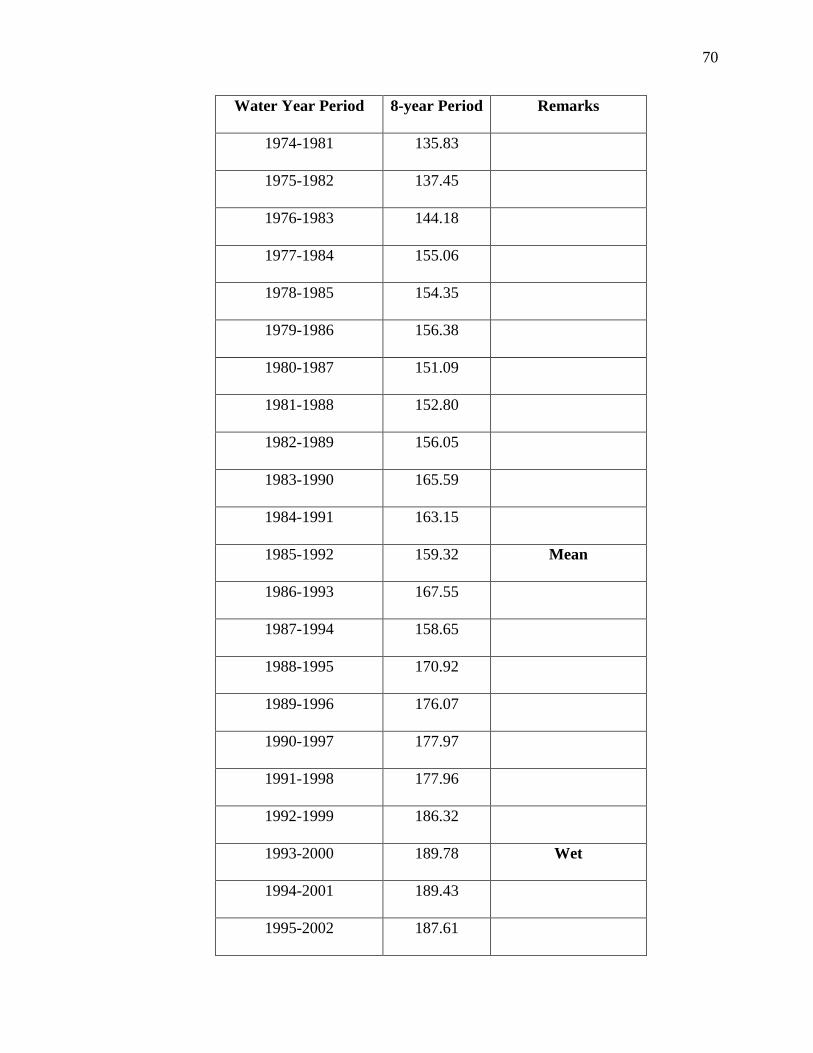
70
Water Year Period 8-year Period Remarks
1974-1981 135.83
1975-1982 137.45
1976-1983 144.18
1977-1984 155.06
1978-1985 154.35
1979-1986 156.38
1980-1987 151.09
1981-1988 152.80
1982-1989 156.05
1983-1990 165.59
1984-1991 163.15
1985-1992 159.32 Mean
1986-1993 167.55
1987-1994 158.65
1988-1995 170.92
1989-1996 176.07
1990-1997 177.97
1991-1998 177.96
1992-1999 186.32
1993-2000 189.78 Wet
1994-2001 189.43
1995-2002 187.61
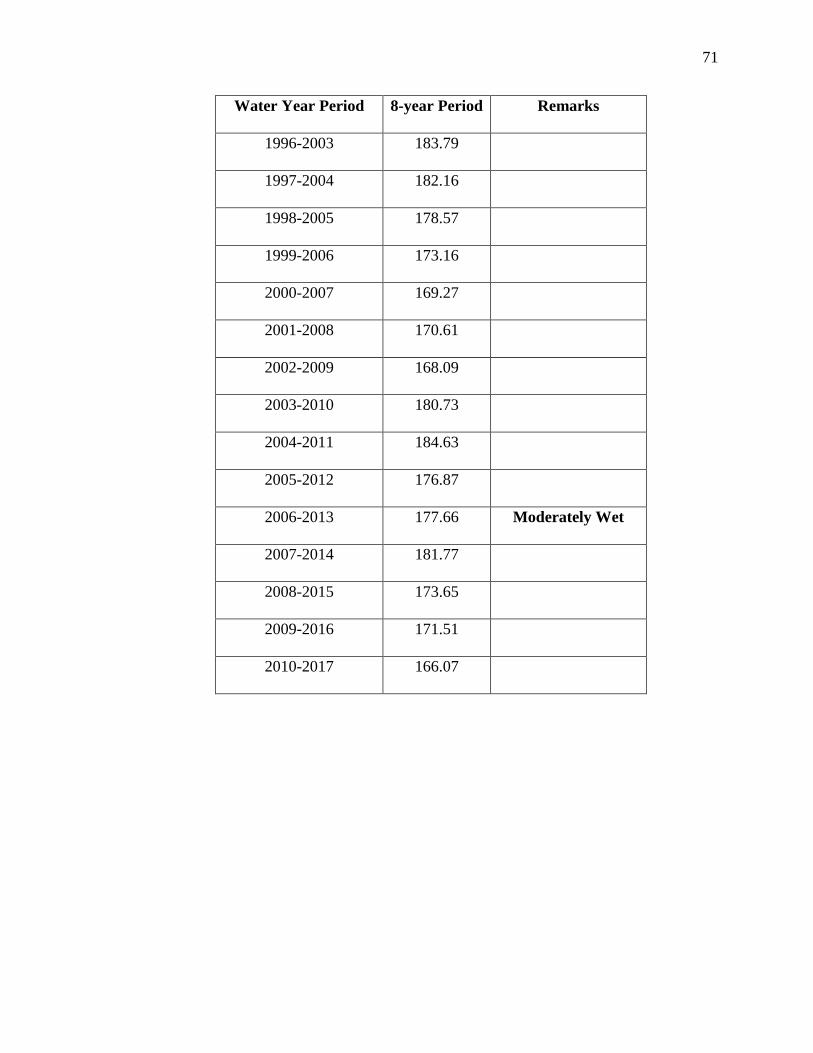
71
Water Year Period 8-year Period Remarks
1996-2003 183.79
1997-2004 182.16
1998-2005 178.57
1999-2006 173.16
2000-2007 169.27
2001-2008 170.61
2002-2009 168.09
2003-2010 180.73
2004-2011 184.63
2005-2012 176.87
2006-2013 177.66 Moderately Wet
2007-2014 181.77
2008-2015 173.65
2009-2016 171.51
2010-2017 166.07
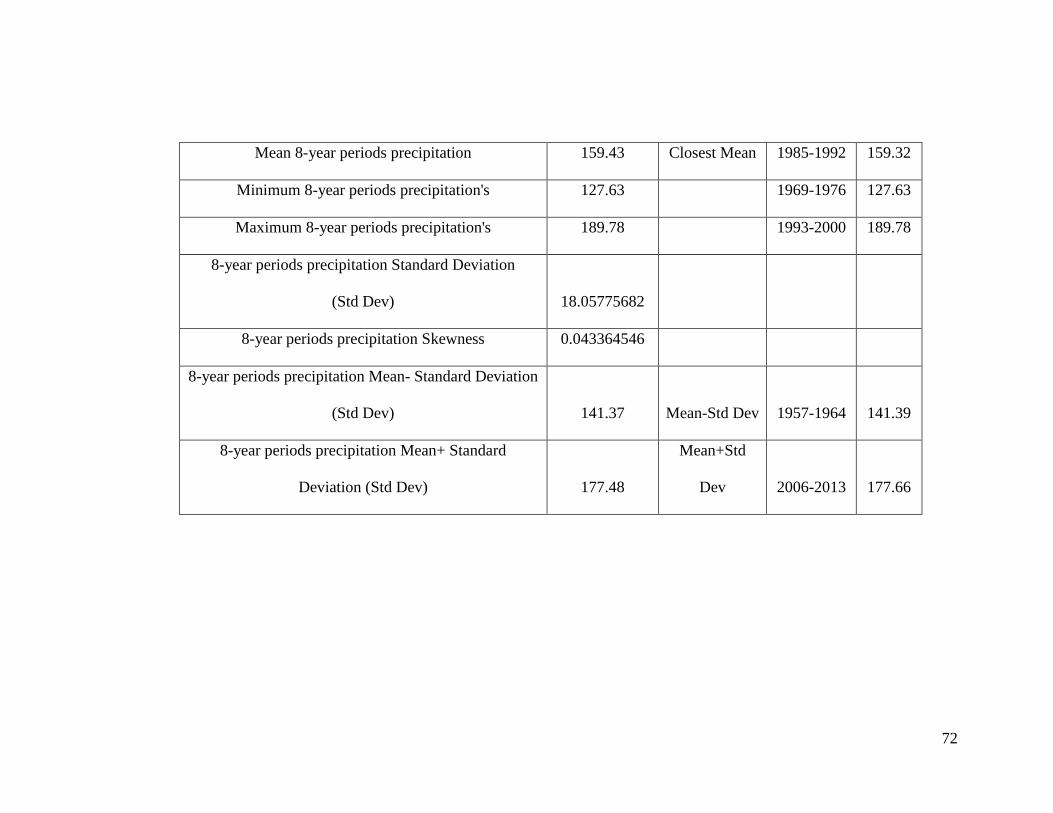
72
Mean 8-year periods precipitation 159.43 Closest Mean 1985-1992 159.32
Minimum 8-year periods precipitation's 127.63
1969-1976 127.63
Maximum 8-year periods precipitation's 189.78
1993-2000 189.78
8-year periods precipitation Standard Deviation
(Std Dev) 18.05775682
8-year periods precipitation Skewness 0.043364546
8-year periods precipitation Mean- Standard Deviation
(Std Dev) 141.37 Mean-Std Dev 1957-1964 141.39
8-year periods precipitation Mean+ Standard
Deviation (Std Dev) 177.48
Mean+Std
Dev 2006-2013 177.66
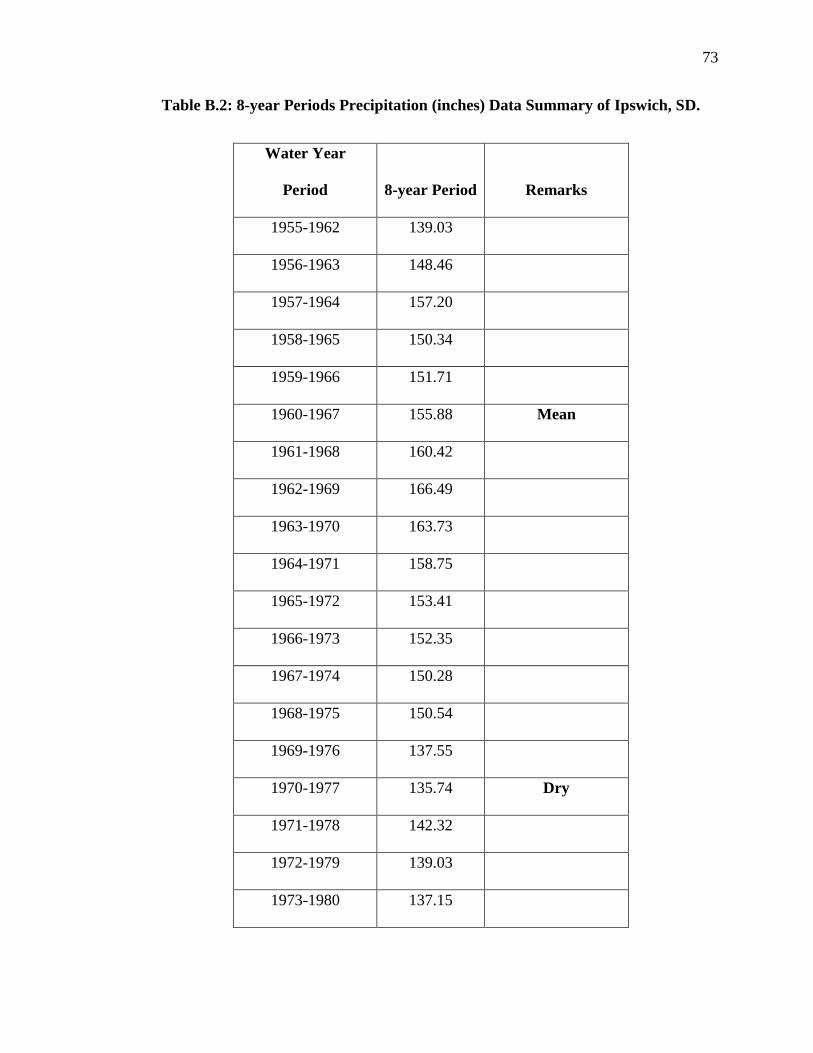
73
Table B.2: 8-year Periods Precipitation (inches) Data Summary of Ipswich, SD.
Water Year
Period 8-year Period Remarks
1955-1962 139.03
1956-1963 148.46
1957-1964 157.20
1958-1965 150.34
1959-1966 151.71
1960-1967 155.88 Mean
1961-1968 160.42
1962-1969 166.49
1963-1970 163.73
1964-1971 158.75
1965-1972 153.41
1966-1973 152.35
1967-1974 150.28
1968-1975 150.54
1969-1976 137.55
1970-1977 135.74 Dry
1971-1978 142.32
1972-1979 139.03
1973-1980 137.15
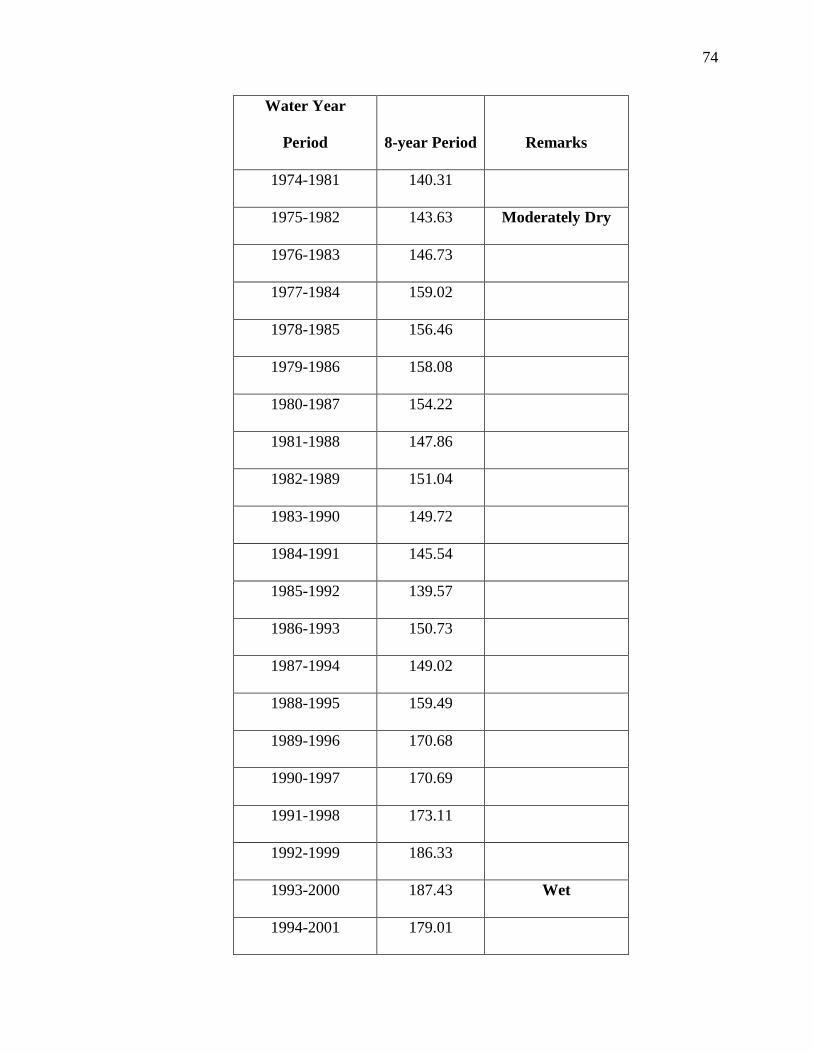
74
Water Year
Period 8-year Period Remarks
1974-1981 140.31
1975-1982 143.63 Moderately Dry
1976-1983 146.73
1977-1984 159.02
1978-1985 156.46
1979-1986 158.08
1980-1987 154.22
1981-1988 147.86
1982-1989 151.04
1983-1990 149.72
1984-1991 145.54
1985-1992 139.57
1986-1993 150.73
1987-1994 149.02
1988-1995 159.49
1989-1996 170.68
1990-1997 170.69
1991-1998 173.11
1992-1999 186.33
1993-2000 187.43 Wet
1994-2001 179.01
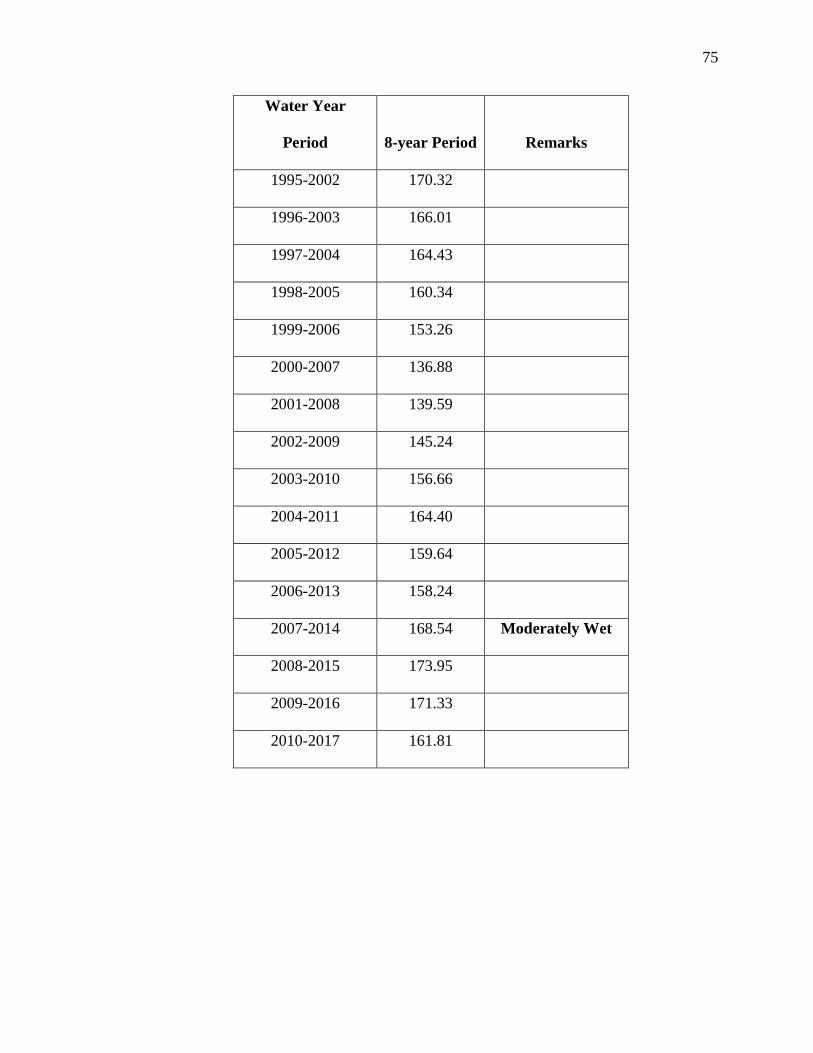
75
Water Year
Period 8-year Period Remarks
1995-2002 170.32
1996-2003 166.01
1997-2004 164.43
1998-2005 160.34
1999-2006 153.26
2000-2007 136.88
2001-2008 139.59
2002-2009 145.24
2003-2010 156.66
2004-2011 164.40
2005-2012 159.64
2006-2013 158.24
2007-2014 168.54 Moderately Wet
2008-2015 173.95
2009-2016 171.33
2010-2017 161.81
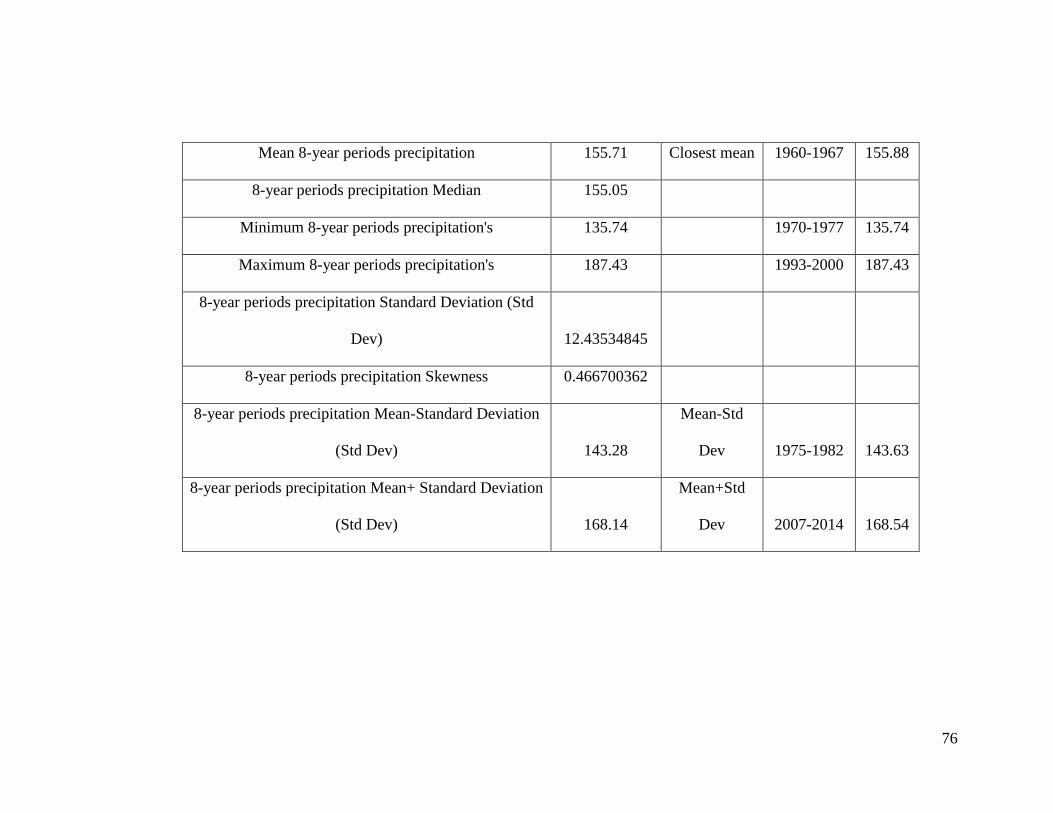
76
Mean 8-year periods precipitation 155.71 Closest mean 1960-1967 155.88
8-year periods precipitation Median 155.05
Minimum 8-year periods precipitation's 135.74
1970-1977 135.74
Maximum 8-year periods precipitation's 187.43
1993-2000 187.43
8-year periods precipitation Standard Deviation (Std
Dev) 12.43534845
8-year periods precipitation Skewness 0.466700362
8-year periods precipitation Mean-Standard Deviation
(Std Dev) 143.28
Mean-Std
Dev 1975-1982 143.63
8-year periods precipitation Mean+ Standard Deviation
(Std Dev) 168.14
Mean+Std
Dev 2007-2014 168.54
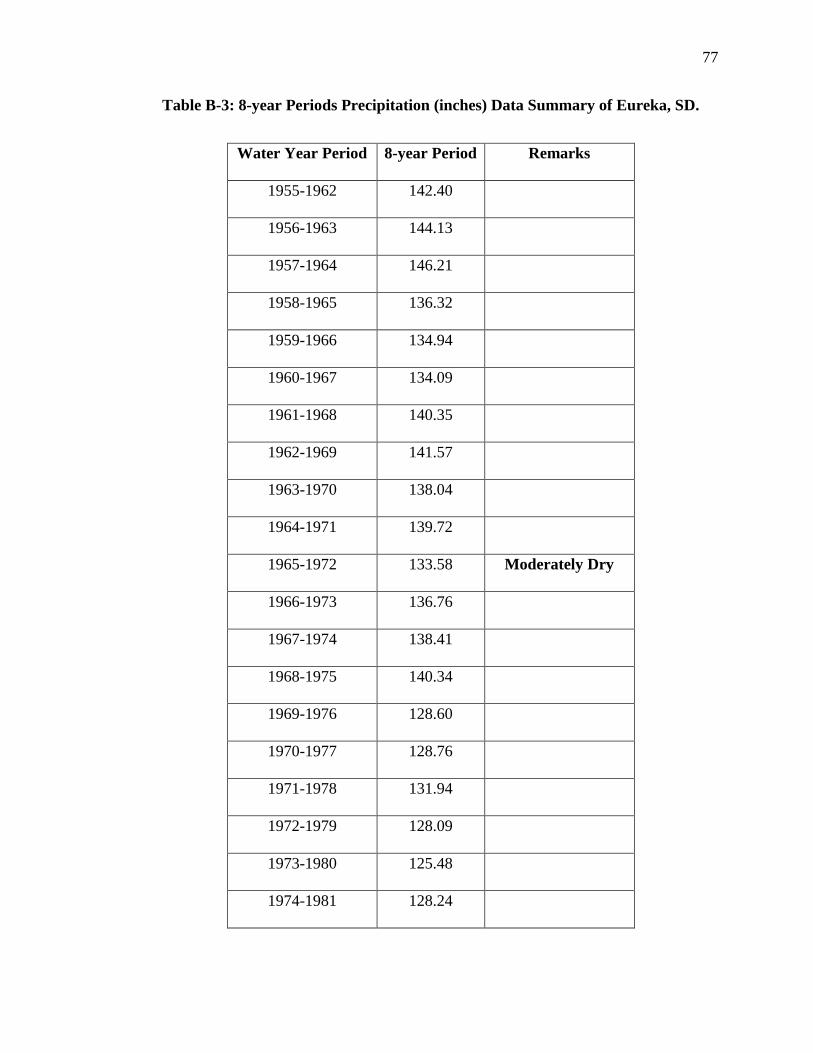
77
Table B-3: 8-year Periods Precipitation (inches) Data Summary of Eureka, SD.
Water Year Period 8-year Period Remarks
1955-1962 142.40
1956-1963 144.13
1957-1964 146.21
1958-1965 136.32
1959-1966 134.94
1960-1967 134.09
1961-1968 140.35
1962-1969 141.57
1963-1970 138.04
1964-1971 139.72
1965-1972 133.58 Moderately Dry
1966-1973 136.76
1967-1974 138.41
1968-1975 140.34
1969-1976 128.60
1970-1977 128.76
1971-1978 131.94
1972-1979 128.09
1973-1980 125.48
1974-1981 128.24
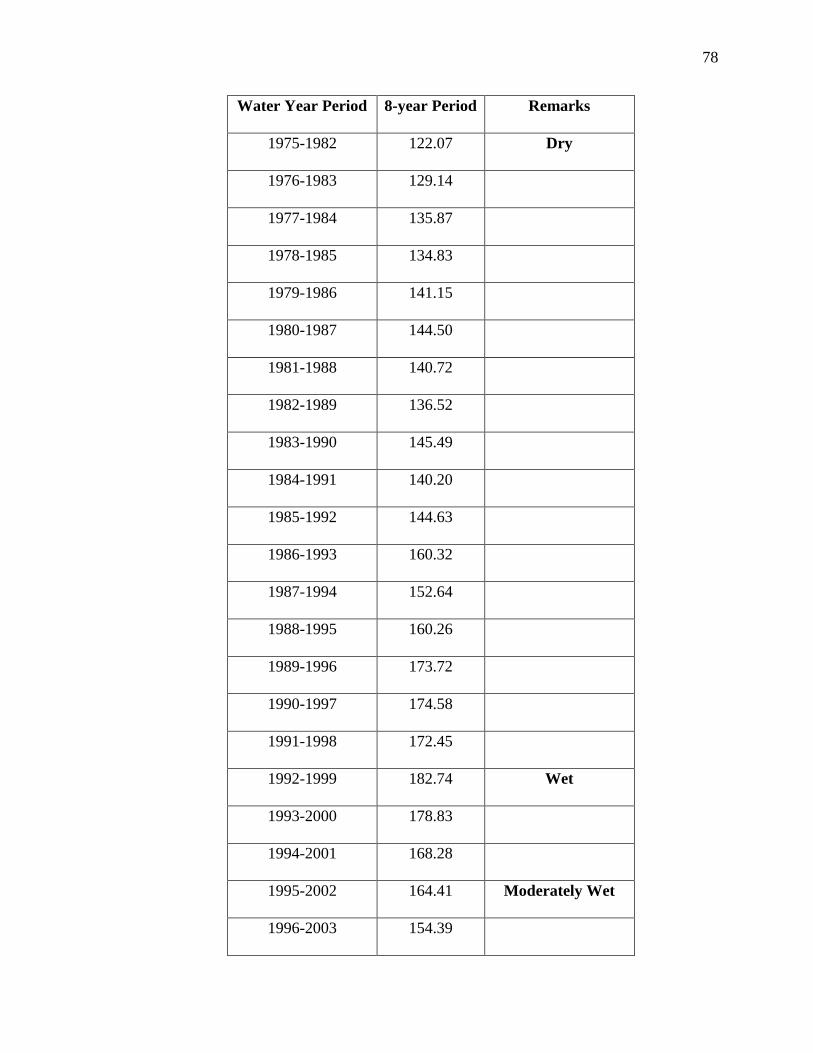
78
Water Year Period 8-year Period Remarks
1975-1982 122.07 Dry
1976-1983 129.14
1977-1984 135.87
1978-1985 134.83
1979-1986 141.15
1980-1987 144.50
1981-1988 140.72
1982-1989 136.52
1983-1990 145.49
1984-1991 140.20
1985-1992 144.63
1986-1993 160.32
1987-1994 152.64
1988-1995 160.26
1989-1996 173.72
1990-1997 174.58
1991-1998 172.45
1992-1999 182.74 Wet
1993-2000 178.83
1994-2001 168.28
1995-2002 164.41 Moderately Wet
1996-2003 154.39
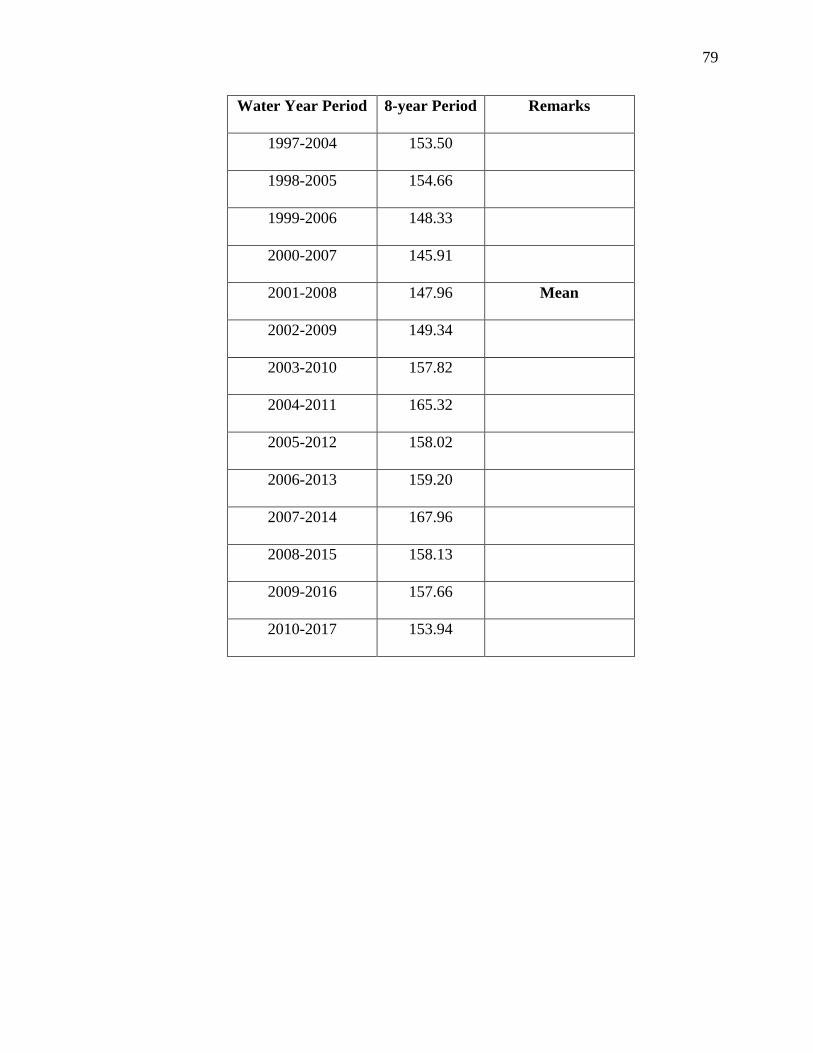
79
Water Year Period 8-year Period Remarks
1997-2004 153.50
1998-2005 154.66
1999-2006 148.33
2000-2007 145.91
2001-2008 147.96 Mean
2002-2009 149.34
2003-2010 157.82
2004-2011 165.32
2005-2012 158.02
2006-2013 159.20
2007-2014 167.96
2008-2015 158.13
2009-2016 157.66
2010-2017 153.94
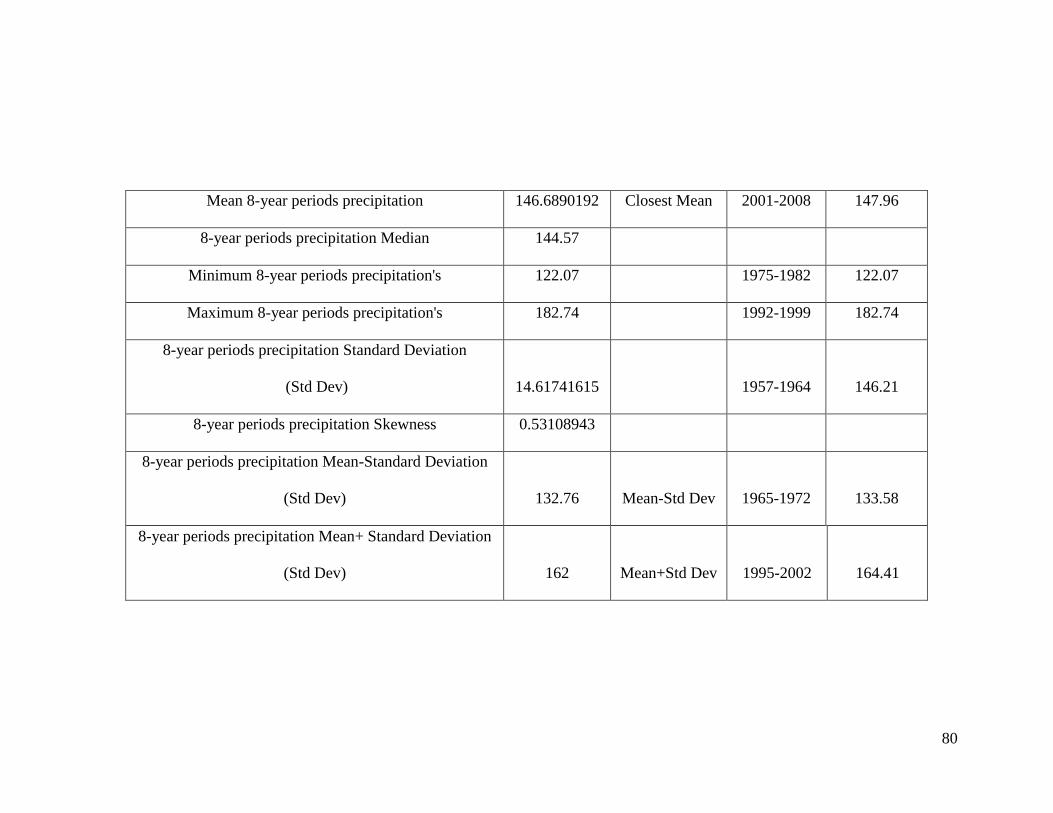
80
Mean 8-year periods precipitation 146.6890192 Closest Mean 2001-2008 147.96
8-year periods precipitation Median 144.57
Minimum 8-year periods precipitation's 122.07
1975-1982 122.07
Maximum 8-year periods precipitation's 182.74
1992-1999 182.74
8-year periods precipitation Standard Deviation
(Std Dev) 14.61741615
1957-1964 146.21
8-year periods precipitation Skewness 0.53108943
8-year periods precipitation Mean-Standard Deviation
(Std Dev) 132.76 Mean-Std Dev 1965-1972 133.58
8-year periods precipitation Mean+ Standard Deviation
(Std Dev) 162 Mean+Std Dev 1995-2002 164.41