Comparison of Factors Affecting the Plot Value According ... · transformed into question form and...
17
Comparison of Factors Affecting the Plot Value According to Participants and Provinces Sukran YALPIR, Fatma BUNYAN UNEL and Birol GULNAR, Turkey Key words: Criteria of real estate valuation, survey, factor analysis, t-test and ANOVA. SUMMARY The values of real estates in market conditions should be estimated in a healthy way as current. A lot of studies have been conducted especially interested in advanced valuation methods of mass real estate valuation. It is observed that these studies take into consideration different criteria. When the criteria are grouped by making a list of them, there are a lot of criteria based on legal, physical, locational and neighbourhood features. These criteria were transformed into question form and survey application was carried out in Ankara, Konya and Kayseri provinces of the Central Anatolia Region. Participants consist of experts that work on real estate valuation and citizens that play a role in real estate purchases and sales. It was discovered ten factors affecting the value of plot improved land as a result of factor analysis. In this study, factors were compared according to participants and provinces and researched different between the experts and the citizens with Independent Sampling t-Test. Moreover, it was determined that factor scores of the experts were higher than factor scores of the citizens. Whether factors were different between Ankara, Konya and Kayseri provinces or not, was tested with Analysis of Variance (ANOVA) according to the experts/citizens. According to analysis results, there is significantly different between them in some factors. Arsa Değerini Etkileyen Faktörlerin Katılımcılara ve İllere Göre Karşılaştırılması Anahtar Kelimeler: Taşınmaz değerleme kriterleri, anket, faktör analizi, t-Testi ve ANOVA ÖZET Taşınmazların piyasa koşullarındaki değerleri güncel olarak sağlıklı bir şekilde tahmin edilmelidir. Toplu taşınmaz değerlemede özellikle ileri değerleme yöntemleri ile ilgili birçok çalışma yürütülmektedir. Bu çalışmaların farklı farklı kriterleri ele aldığı gözlenmekte olup kriterler listelenerek gruplandırıldığında yasal, fiziksel, konumsal ve mahalli özelliklere dayalı bir çok kriter bulunmaktadır. Bu kriterler soru formatına dönüştürülerek İç Anadolu Bölgesinin Ankara, Konya ve Kayseri illerinde anket uygulaması gerçekleştirilmiştir. Katılımcılar, taşınmaz alım-satımında rol alan aktörlerden vatandaş ve taşınmaz değerleme konusunda çalışan uzmanlardan oluşmaktadır. Faktör analizi sonucunda gelişmiş arazi olan arsanın değerini etkileyen 10 faktör elde edilmiştir. Bu çalışmada faktörler katılımcılara ve
Transcript of Comparison of Factors Affecting the Plot Value According ... · transformed into question form and...

Comparison of Factors Affecting the Plot Value
According to Participants and Provinces
Sukran YALPIR, Fatma BUNYAN UNEL and Birol GULNAR, Turkey
Key words: Criteria of real estate valuation, survey, factor analysis, t-test and ANOVA.
SUMMARY
The values of real estates in market conditions should be estimated in a healthy way as
current. A lot of studies have been conducted especially interested in advanced valuation
methods of mass real estate valuation. It is observed that these studies take into consideration
different criteria. When the criteria are grouped by making a list of them, there are a lot of
criteria based on legal, physical, locational and neighbourhood features. These criteria were
transformed into question form and survey application was carried out in Ankara, Konya and
Kayseri provinces of the Central Anatolia Region. Participants consist of experts that work on
real estate valuation and citizens that play a role in real estate purchases and sales. It was
discovered ten factors affecting the value of plot improved land as a result of factor analysis.
In this study, factors were compared according to participants and provinces and researched
different between the experts and the citizens with Independent Sampling t-Test. Moreover, it
was determined that factor scores of the experts were higher than factor scores of the citizens.
Whether factors were different between Ankara, Konya and Kayseri provinces or not, was
tested with Analysis of Variance (ANOVA) according to the experts/citizens. According to
analysis results, there is significantly different between them in some factors.
Arsa Değerini Etkileyen Faktörlerin
Katılımcılara ve İllere Göre Karşılaştırılması
Anahtar Kelimeler: Taşınmaz değerleme kriterleri, anket, faktör analizi, t-Testi ve ANOVA
ÖZET
Taşınmazların piyasa koşullarındaki değerleri güncel olarak sağlıklı bir şekilde tahmin
edilmelidir. Toplu taşınmaz değerlemede özellikle ileri değerleme yöntemleri ile ilgili birçok
çalışma yürütülmektedir. Bu çalışmaların farklı farklı kriterleri ele aldığı gözlenmekte olup
kriterler listelenerek gruplandırıldığında yasal, fiziksel, konumsal ve mahalli özelliklere
dayalı bir çok kriter bulunmaktadır. Bu kriterler soru formatına dönüştürülerek İç Anadolu
Bölgesinin Ankara, Konya ve Kayseri illerinde anket uygulaması gerçekleştirilmiştir.
Katılımcılar, taşınmaz alım-satımında rol alan aktörlerden vatandaş ve taşınmaz değerleme
konusunda çalışan uzmanlardan oluşmaktadır. Faktör analizi sonucunda gelişmiş arazi olan
arsanın değerini etkileyen 10 faktör elde edilmiştir. Bu çalışmada faktörler katılımcılara ve
Comparison of Factors Affecting the Plot Value According to Participants and Provinces (9498)
Sukran Yalpir, Fatma Bunyan Unel and Birol Gulnar (Turkey)
FIG Congress 2018
Embracing our smart world where the continents connect: enhancing the geospatial maturity of societies
Istanbul, Turkey, May 6–11, 2018

illere göre karşılaştırılmış olup uzman ve vatandaş arasındaki fark Bağımsız Örneklem t-Testi
ile araştırılmıştır. Ayrıca uzman faktör puanlarının vatandaş faktör puanlarına göre genelinde
daha yüksek olduğu tespit edilmiştir. Faktörlerin Ankara, Konya ve Kayseri illerindeki
uzmanlara/vatandaşlara göre farklılaşıp farklılaşmadığı Tek Yönlü Varyans Analizi
(ANOVA) ile test edilmiştir. Analiz sonuçlarına göre bazı faktörlerde anlamlı bir şekilde fark
bulunmuştur.
Comparison of Factors Affecting the Plot Value According to Participants and Provinces (9498)
Sukran Yalpir, Fatma Bunyan Unel and Birol Gulnar (Turkey)
FIG Congress 2018
Embracing our smart world where the continents connect: enhancing the geospatial maturity of societies
Istanbul, Turkey, May 6–11, 2018
Comparison of Factors Affecting the Plot Value
According to Participants and Provinces
Sukran YALPIR, Fatma BUNYAN UNEL and Birol GULNAR, Turkey
1. INTRODUCTION
One of the most reliable investment tools in Turkey are real estates. The real estates were
assets that were fixed in place and earned in long-term but were not transformed into cash in
short time in case of need. In order to eliminate this disadvantage and to invest in small-scale
as well, real estate projects named in "Real Estate Certificate" started to be traded in Borsa
Istanbul (BİST). On a large scale, the participation shares of Real Estate Investment Trusts
(REITs) as well as the shares of Real Estate Investment Funds (REIF) were traded in the
BİST and presented to qualified investors. The fact that the real estates are taking place in the
BİST in these forms has become an international investment tool as well as national. Thus,
the volume of real estate has grown and gained a different attribution. Investment
opportunities for all the investor masses were offered and the functioning of the real estates
has opened the way to keep the economy alive by gaining momentum. The real estates which
have no place in any activity having earned to the economy in terms of real estate to
accelerate the development of Turkey is of great importance. In this regards, while the
management and administration of real estates will take place with the GIS coming from the
qualified database, it is essential that the real estate valuation can be carried out in a healthy
manner nationwide.
As it can be done for a real estate such as real estate valuation, purchase and selling, lending
and leasing, as well as the mass appraisal in a group of real estates such as taxation,
expropriation, urban transformation, land consolidation. As the number of real estates is
increased, the cost of valuation per real estate is decreasing. While traditional valuation
methods are sufficient for valuation of a real estate, advanced or statistically valuation
methods are needed in the mass appraisal (IAAO, 2013; Unel and Yalpır, 2013; Yıldız, 2014).
Independent, impartial and objective evaluation of the real estate is possible by clearly
revealing the properties of the real estates. In the valuation, the position of the real estate is
one of the most important criteria and decisions determining the value (Yomralıoğlu et al.,
2011), and each criteria to be included in the valuation processes will bring about the
economic provision of the real estate. Therefore, it is very important to determine the criteria
at the optimum level.
While advanced or statistically evaluation methods are applied in the literature studies, it has
been determined that different criteria are considered. In the Kauko (2002) study, for
example, Finland and Helsinki applied different methodologies at different scales by
considering different criteria. Using a total of 16 criteria, YSA and hedonic methods were
applied for the residences in the selected area. Lin (2010) applied multiple regression,
nonparametric regression and YSA methods with a total of 83 criteria consisting of 66
Comparison of Factors Affecting the Plot Value According to Participants and Provinces (9498)
Sukran Yalpir, Fatma Bunyan Unel and Birol Gulnar (Turkey)
FIG Congress 2018
Embracing our smart world where the continents connect: enhancing the geospatial maturity of societies
Istanbul, Turkey, May 6–11, 2018

location characteristics in the valuation of residential real estates. Schulz (2003) has been
examined the German Valuation Regulation and explained traditional valuation methods and
compared the success of applying linear regression and hedonic regression methods with
residential-related criteria.
In the literature, it has been found out that especially the criteria related to spatial features are
weighted. In the studies in which the environmental characteristics belonging to the residence
taking place a total of 8 criteria are discussed, the criteria are adapted to the questionnaire
based on the AHP method, the weights were determined according to the answers received
from the landlords and the order of importance was determined (Bender et al., 1997; 2000). In
a study similar to these, the weights of a total of 7 environmental criteria for urban
commercial real estate have been calculated (Bender et al., 1999). Yomralıoğlu (1993)
performed a survey study by scoring over 100 criteria for value-based land use using a
nominal method and weighted a total of 28 criteria. In his work Kryvobokov (2006), in order
to make the mass appraisal of urban land in Ukraine, he handled a total of 10 criteria of
spatial features and applied the survey prepared by using AHP method to experts to estimate
criteria weights and sort them in order of priorities.
A study was carried out in 2015 so as to determine the optimum criteria for plots which are
one of the real estate types. Criteria affecting the plot value were converted into survey format
and questioned in the form of the question for two participants group consisting of experts
and citizens in Ankara, Konya and Kayseri elected provinces for Central Anatolia Region.
Experts are individuals who are experienced in real estate, and citizens are actors in real estate
purchase and selling. Applying factor analysis to the data of collected survey results criteria
was reduced to 10 factors (Ünel, 2017). The purpose of this study is also to investigate
whether 10 factors are different between participants and provinces. Independent Sampling t-
Test was used to analyse different between the experts and the citizens. The ANOVA was
also performed to test different between Ankara, Konya and Kayseri provinces according to
experts/citizens. According to analysis results, there is significantly different between them in
some factors.
2. MATERIAL AND METHOD
2.1 The Study Area and Factors
Provinces in Central Anatolia Region in Turkey have been investigated in terms of
population, the number of voters, population increase speed and net speed of migration, the
number of sales, housing mortgage and the number of processes in zoning applications. It has
been decided to carry out the survey on the criteria affecting the plot value in the cities of
Ankara, Konya and Kayseri (Figure 1).
Comparison of Factors Affecting the Plot Value According to Participants and Provinces (9498)
Sukran Yalpir, Fatma Bunyan Unel and Birol Gulnar (Turkey)
FIG Congress 2018
Embracing our smart world where the continents connect: enhancing the geospatial maturity of societies
Istanbul, Turkey, May 6–11, 2018

Figure 1. Study areas in the survey (Unel et al., 2017)
Because of the different cities and participants in the survey, three basic sample groups have
appeared. The groups that are divided into experts, citizens and general groups are also
grouped according to Ankara, Konya and Kayseri cities (Figure 2). Analyzes were carried out
by taking into account the expert/citizen sample groups of all experts/all citizens and cities,
and their results were examined (Ünel, 2017).
Figure 2. Sampling Groups
In the survey study, a total of 125 questions were prepared using the five-point Likert Scale
with 116 questions and the mixed scale with the other questions related to the criteria
affecting the value of the plot. The answers of 559 experts and 1,915 citizen participants
gathered as a result of the survey study were prepared and arranged in the computer ready for
analysis. Factor Analysis was applied to the 96x2,474 dimensional matrix consisting of
survey data set. 96 Criteria, a total of 10 factors including Unsanitary Areas, Public
Institutions, Favourite Neighbourhood Information, Technical Infrastructure Services, Zoning
Status, Entertainment and Cultural Areas, Public Transportations, Green Areas, Legal
Comparison of Factors Affecting the Plot Value According to Participants and Provinces (9498)
Sukran Yalpir, Fatma Bunyan Unel and Birol Gulnar (Turkey)
FIG Congress 2018
Embracing our smart world where the continents connect: enhancing the geospatial maturity of societies
Istanbul, Turkey, May 6–11, 2018
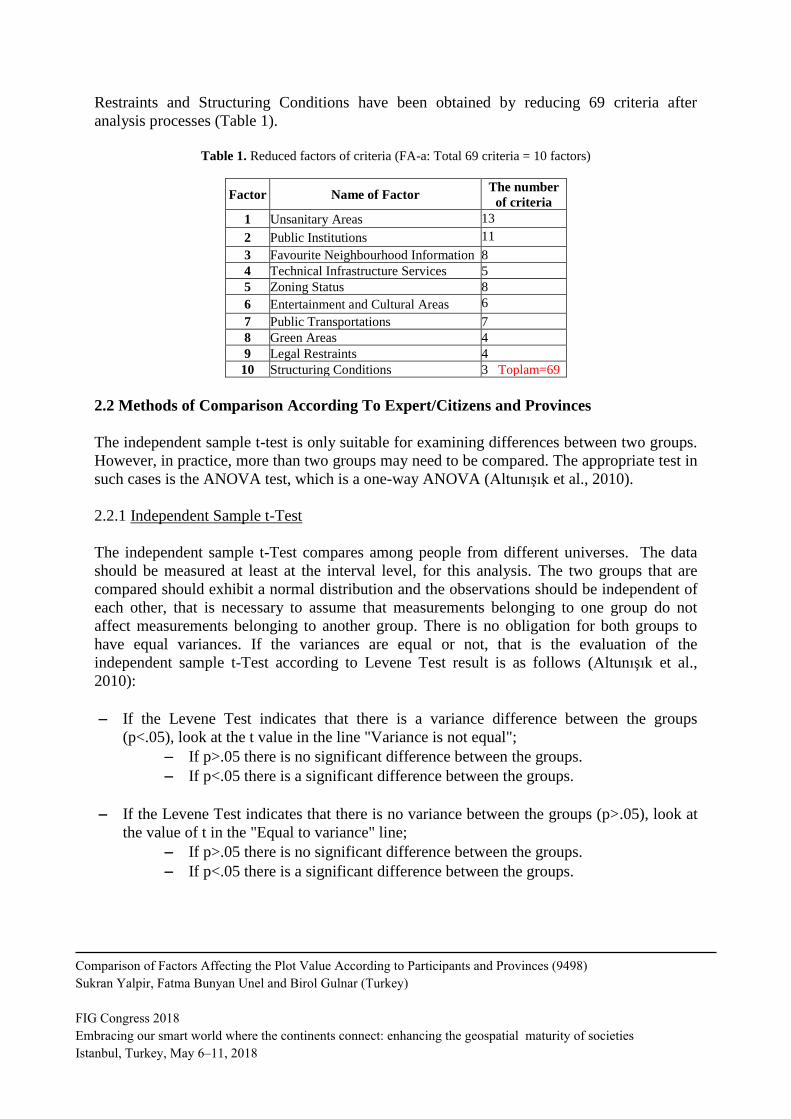
Restraints and Structuring Conditions have been obtained by reducing 69 criteria after
analysis processes (Table 1).
Table 1. Reduced factors of criteria (FA-a: Total 69 criteria = 10 factors)
Factor Name of Factor The number
of criteria
1 Unsanitary Areas 13
2 Public Institutions 11
3 Favourite Neighbourhood Information 8
4 Technical Infrastructure Services 5
5 Zoning Status 8
6 Entertainment and Cultural Areas 6
7 Public Transportations 7
8 Green Areas 4
9 Legal Restraints 4
10 Structuring Conditions 3 Toplam=69
2.2 Methods of Comparison According To Expert/Citizens and Provinces
The independent sample t-test is only suitable for examining differences between two groups.
However, in practice, more than two groups may need to be compared. The appropriate test in
such cases is the ANOVA test, which is a one-way ANOVA (Altunışık et al., 2010).
2.2.1 Independent Sample t-Test
The independent sample t-Test compares among people from different universes. The data
should be measured at least at the interval level, for this analysis. The two groups that are
compared should exhibit a normal distribution and the observations should be independent of
each other, that is necessary to assume that measurements belonging to one group do not
affect measurements belonging to another group. There is no obligation for both groups to
have equal variances. If the variances are equal or not, that is the evaluation of the
independent sample t-Test according to Levene Test result is as follows (Altunışık et al.,
2010):
If the Levene Test indicates that there is a variance difference between the groups
(p<.05), look at the t value in the line "Variance is not equal";
If p>.05 there is no significant difference between the groups.
If p<.05 there is a significant difference between the groups.
If the Levene Test indicates that there is no variance between the groups (p>.05), look at
the value of t in the "Equal to variance" line;
If p>.05 there is no significant difference between the groups.
If p<.05 there is a significant difference between the groups.
Comparison of Factors Affecting the Plot Value According to Participants and Provinces (9498)
Sukran Yalpir, Fatma Bunyan Unel and Birol Gulnar (Turkey)
FIG Congress 2018
Embracing our smart world where the continents connect: enhancing the geospatial maturity of societies
Istanbul, Turkey, May 6–11, 2018

2.2.2 One-Way Analysis of Variance (ANOVA)
One-way analysis of variance is used to test whether the difference between two or more
unrelated sample means is significantly different from zero. In order for this analysis to be
made, the following assumptions should be fulfilled (Büyüköztürk, 2002; Gülnar, 2007):
The measurement level of the dependent variable should be at least the range scale.
Scores show on dependent variance normal distribution at each level of the investigated
factor.
Comparable samples of mean scores are unrelated.
The variances of the samples are equal.
In terms of the difference between the groups (p<.05) in the result of the ANOVA test, Post
Hoc Multiple Comparison Methods are used to determine from which group the difference is
derived (Köklü and Bökeoğlu, 2006). These methods are categorized into two separate classes
according to the equality between groups (p>.05) and the unequal variances (p<.05) (Kayri,
2009; IBM, 2015).
If the variances are equal:
Range and Dual Tests: Tukey, Hochberg's GT2, Gabriel and Scheffe
Range Tests: Tukey’s b, S-N-K (Student–Newman–Keuls), Duncan, R-E-G-
W-F (Ryan-Einot-Gabriel-Welsch F test), R-E-G-W-Q (Ryan-Einot-Gabriel-
Welsch range test) and Waller-Duncan
Dual Tests: Bonferroni, Tukey, Sidak, Gabriel, Hochberg's GT2, Dunnett,
Scheffe and LSD (Least Significant Difference) as used.
If the variances are not equal:
Multiple Range Tests: Tamhane's T2, Dunnet's T3, Games-Howell and
Dunnet's C are in the shape.
In this study, Bonferroni was preferred if the multiple comparison variances between groups
were equal, and Tamhane's T2 was preferred if the variances were not equal. Because one of
the two advantages of the Bonferroni method is that it is easy to implement and the other is
that it can be used in many different test cases (Doğan and Doğan, 2014). The provision of the
Bonferroni method for in case of unequal variances is Tamhane's T2 method. In addition to
these, Bonferroni (ANOVA, 2015) and Tamhane's T2 methods can be used when the sample
groups are not equal (Kayri, 2009).
Comparison of Factors Affecting the Plot Value According to Participants and Provinces (9498)
Sukran Yalpir, Fatma Bunyan Unel and Birol Gulnar (Turkey)
FIG Congress 2018
Embracing our smart world where the continents connect: enhancing the geospatial maturity of societies
Istanbul, Turkey, May 6–11, 2018

3. COMPARISON OF FACTOR ACCORDING TO EXPERT/CITIZEN AND
PROVINCES
3.1 General, Expert and Citizen Comparisons of Factors
The arithmetic means of the criteria included in the factors affecting plot value were taken
separately for each participant. For each of the ten factors, the factor scores were obtained
from the arithmetic mean, which was taken as the general, all expert and all citizen sample
groups. Independent sample t-test was used to investigate the fact that factor scores were two
groups that differed or not according to expert and citizen. According to the results of the
analysis, it is seen that the factors affecting the plot value are significant differences among
the five factors of ten between the experts and the citizens.
The results of the Independent Sample t-Test are as follows: Public Institutions (t=-0.635/
p>.05), Technical Infrastructure Services (t=1.301/p>.05), Public Transportations (t=1.572/
p>.05), Green Areas (t=-0.450/p>.05) and Structuring Conditions (t=-0.949/p>.05). Because
the significance level is greater than 0.05, it has been shown that the factor scores do not
differ significantly from the experts and the citizens. Factors with the significance (Sig.) level
less than 0.05 were determined at the continuation of the test as follows: Unsanitary Areas
(t=-3.993/p<.05), Favourite Neighbourhood Information (t=7.714/p<.05), Zoning Status
(t=6.062/p<.05), Entertainment and Cultural Areas (t=3.045/p<.05) and Legal Restraints (t=-
5.824/p<.05). It was seen that these factor scores differed significantly according to the expert
and the citizen. Besides, it was determined that scores of expert factors were higher than those
of citizen factors (Table 2).
The scores of the factors in the general, all experts and all citizens samples are sorted
comparatively in absolute value from the large to small. In the three samples, the first three
rows are the same and are sorted as "Zoning Status", "Technical Infrastructure Services" and
"Unsanitary Areas". The "Public Transportations" and "Public Institutions" factors were the
same in all sample groups and ranked 7th and 8th. According to all experts, all citizens and
the general situation, the differences in the 4th, 5th, 6th, 9th and 10th rows have inferred a
difference of 50% between these samples (Table 3).
Comparison of Factors Affecting the Plot Value According to Participants and Provinces (9498)
Sukran Yalpir, Fatma Bunyan Unel and Birol Gulnar (Turkey)
FIG Congress 2018
Embracing our smart world where the continents connect: enhancing the geospatial maturity of societies
Istanbul, Turkey, May 6–11, 2018

Table 2. Independent sampling t-test results of factors according to expert and citizen
Factors Expert/
Citizen N Mean
t
Test Sig.
Unsanitary Areas Expert 559 -3.72
-3.993 .000 Citizen 1,915 -3.43
Public Institutions Expert 559 2.85
-0.635 .526 Citizen 1,915 2.90
Favourite Neighbourhood Information Expert 559 3.68
7.714 .000 Citizen 1,915 3.21
Technical Infrastructure Services Expert 559 3.83
1.301 .194 Citizen 1,915 3.75
Zoning Status Expert 559 4.14
6.062 .000 Citizen 1,915 3.88
Entertainment and Cultural Areas Expert 559 2.38
3.045 .002 Citizen 1,915 2.12
Public Transportations Expert 559 3.02
1.572 .116 Citizen 1,915 2.91
Green Areas Expert 559 3.22
-0.450 .653 Citizen 1,915 3.26
Legal Restraints Expert 559 -2.69
-5.824 .000 Citizen 1,915 -2.04
Structuring Conditions Expert 559 3.31
-0.949 .343 Citizen 1,915 3.37
Table 3. Comparative sorting of factors according to general, expert and citizen
General Expert Citizen
1 Zoning Status Zoning Status Zoning Status
2 Technical Infrastructure Services Technical Infrastructure Services Technical Infrastructure Services
3 Unsanitary Areas Unsanitary Areas Unsanitary Areas
4 Structuring Conditions Favourite Neighbourhood Inf. Structuring Conditions
5 Favourite Neighbourhood Inf. Structuring Conditions Green Areas
6 Green Areas Green Areas Favourite Neighbourhood Inf.
7 Public Transportations Public Transportations Public Transportations
8 Public Institutions Public Institutions Public Institutions
9 Legal Restraints Legal Restraints Entertainment and Cultural Areas
10 Entertainment and Cultural Areas Entertainment and Cultural Areas Legal Restraints
3.2 Comparisons of Experts and Citizens According to Ankara, Konya and Kayseri
Provinces of Factors
The arithmetic means of the criteria included in the factors affecting the plot value were taken
separately for each participant. Factor scores were attained by taking arithmetic means for ten
factors according to experts and citizens in Ankara, Konya and Kayseri provinces. With the
ANOVA has been tested because there are three sample groups in which the factor scores
differed or not according to the experts/citizens in Ankara, Konya and Kayseri provinces.
According to the results of the analysis, it is seen that the factors affecting the plot value are
Comparison of Factors Affecting the Plot Value According to Participants and Provinces (9498)
Sukran Yalpir, Fatma Bunyan Unel and Birol Gulnar (Turkey)
FIG Congress 2018
Embracing our smart world where the continents connect: enhancing the geospatial maturity of societies
Istanbul, Turkey, May 6–11, 2018

the significant difference five factors of the ten among the experts in Ankara, Konya and
Kayseri provinces. It is seen that the factors affecting the plot value are the significant
difference among the citizens of Ankara, Konya and Kayseri seven factors of the ten.
3.2.1 Factors compared to experts in Ankara, Konya and Kayseri
The ANOVA was used to test whether the factor scores differed according to experts in
Ankara, Konya and Kayseri. The ANOVA revealed that the scores of the factor did not differ
significantly according to experts from those in Ankara, Konya and Kayseri. Results are as
shown next: Unsanitary Areas (F=2.551/p>.05), Public Institutions (F=1.219/p>.05),
Favourite Neighbourhood Information (F=2.925/p>.05), Entertainment and Cultural Areas
(F=1.061/p>.05) and Legal Restraints (F=.121/p>.05). It is revealed that the scores of the
factor differed significantly according to experts from those in Ankara, Konya and Kayseri.
Results are as shown next: Technical Infrastructure Services (F=5.471/p<.05), Zoning Status
(F=3.173/p<.05), Public Transportations (F=4.069/p<.05), Green Areas (F=11.052/p<.05) and
Structuring Conditions (F=17.341/p<.05) (Table 4).
Table 4. The ANOVA results of the factors experts in Ankara, Konya and Kayseri
Factors Provinces N Mean F
Test Sig.
Unsanitary Areas
Ankara 208 -3.87
2.551 .079 Konya 221 -3.56
Kayseri 130 -3.76
Public Institutions
Ankara 208 2.94
1.219 .296 Konya 221 2.75
Kayseri 130 2.89
Favourite Neighbourhood Information
Ankara 208 3.80
2.925 .055 Konya 221 3.54
Kayseri 130 3.73
Technical Infrastructure Services
Ankara 208 4.02
5.471 .004 Konya 221 3.66
Kayseri 130 3.81
Zoning Status
Ankara 208 4.23
3.173 .043 Konya 221 4.04
Kayseri 130 4.17
Entertainment and Cultural Areas
Ankara 208 2.44
1.061 .347 Konya 221 2.43
Kayseri 130 2.19
Public Transportations
Ankara 208 3.07
4.069 .018 Konya 221 3.16
Kayseri 130 2.72
Green Areas
Ankara 208 3.57
11.052 .000 Konya 221 2.85
Kayseri 130 3.30
Legal Restraints Ankara 208 -2.64 0.121 .886
Comparison of Factors Affecting the Plot Value According to Participants and Provinces (9498)
Sukran Yalpir, Fatma Bunyan Unel and Birol Gulnar (Turkey)
FIG Congress 2018
Embracing our smart world where the continents connect: enhancing the geospatial maturity of societies
Istanbul, Turkey, May 6–11, 2018

Konya 221 -2.74
Kayseri 130 -2.68
Structuring Conditions
Ankara 208 3.61
17.341 .000 Konya 221 2.95
Kayseri 130 3.47
The factors affecting the value of plot; Tamhane and Bonferroni methods have been applied
in order to demonstrate that there is a significant difference among the experts in Ankara,
Konya and Kayseri provinces. Tamhane method was used as the variances of the Public
Transportations and Structuring Conditions Factor are not homogeneous, that is equal.
Bonferroni method was used as the variances of the other factors were homogeneous, that is
not equal.
Whether the Public Transportations and Structuring Conditions factors differed significantly
according to experts in Ankara, Konya and Kayseri have been tested using the Tamhane
method because the variances are not homogeneous.
Experts in Konya (Mean=3.16), according to experts in Kayseri (Mean=2.72),
in the Public Transportations factor and
Experts in Ankara (Mean=3.61) and Kayseri (Mean=3.47), according to the
experts in Konya (Mean=2.95) in the Structuring Conditions factor
have been shown to give more importance significantly.
Whether the Technical Infrastructure Services, Zoning Status and Green Areas factors are
significantly different according to experts in Ankara, Konya and Kayseri have been tested
using the Bonferroni method because of the homogeneous of their variances.
Experts in Ankara (Mean=4.02), according to experts in Konya (Mean=3.66)
in the Technical Infrastructure Services factor,
Experts in Ankara (Mean=4.23), according to experts in Konya (Mean=4.04) in
the Zoning Status factor, and
Experts in Ankara (Mean=3.57) and Kayseri (Mean=3.30), according to
experts in Konya (Mean=2.85) in the Green Areas factor
have been detected to be more significant.
Factors; According to experts in Ankara, Konya and Kayseri, comparatively presented
according to importance. According to the experts in Ankara, Konya and Kayseri, the first
four and the last two factors are the same, the first four factors are “Zoning Status”,
“Technical Infrastructure Services”, “Unsanitary Areas” and “Favourite Neighbourhood
Information”, and the last two factors are “Legal Restrictions and “Entertainment and Cultural
Areas”. According to the experts in Ankara, Konya and Kayseri, the fact that the 5th, 6th, 7th
and 8th rows are different indicates that there is a difference of 40% among these samples
(Table 5).
Comparison of Factors Affecting the Plot Value According to Participants and Provinces (9498)
Sukran Yalpir, Fatma Bunyan Unel and Birol Gulnar (Turkey)
FIG Congress 2018
Embracing our smart world where the continents connect: enhancing the geospatial maturity of societies
Istanbul, Turkey, May 6–11, 2018

Table 5. Comparatively sorting of factors according to experts in Ankara, Konya and Kayseri
Ankara Konya Kayseri
1 Zoning Status Zoning Status Zoning Status
2 Technical Infrastructure Services Technical Infrastructure Services Technical Infrastructure Services
3 Unsanitary Areas Unsanitary Areas Unsanitary Areas
4 Favourite Neighbourhood Inf. Favourite Neighbourhood Inf. Favourite Neighbourhood Inf.
5 Structuring Conditions Public Transportations Structuring Conditions
6 Green Areas Structuring Conditions Green Areas
7 Public Transportations Green Areas Public Institutions
8 Public Institutions Public Institutions Public Transportations
9 Legal Restraints Legal Restraints Legal Restraints
10 Entertainment and Cultural Areas Entertainment and Cultural Areas Entertainment and Cultural Areas
3.2.2 Factors compared to citizens in Ankara, Konya and Kayseri
With the ANOVA has been tested whether the factor scores differed according to the citizens
in Ankara, Konya and Kayseri. The ANOVA results; Entertainment and Cultural Areas
(F=2.270/p>.05), Public Transportations (F=1.818/p>.05) and Legal Restraints
(F=2.093/p>.05) factor scores have been revealed that significantly didn't differentiate
according to citizens in Ankara, Konya and Kayseri. Unsanitary Areas (F=11.376/p<.05),
Public Institutions (F=4.279/p<.05), Favourite Neighbourhood Information (F=4.027/p<.05),
Technical Infrastructure Services (F=9.832/p<.05), Zoning Status (F=3.754/p<.05), Green
Areas (F=15.924/p<.05) and Structuring Conditions (F=14.392/p<.05) factor scores have been
seen that significantly differed according to citizens in Ankara, Konya and Kayseri (Table 6).
Table 6. The ANOVA Results of Factors in Ankara, Konya and Kayseri Citizens
Factors Provinces N Mean F
Test Sig.
Unsanitary Areas
Ankara 546 -3.58
11.376 .000 Konya 942 -3.23
Kayseri 427 -3.68
Public Institutions
Ankara 546 2.87
4.279 .014 Konya 942 2.82
Kayseri 427 3.09
Favourite Neighbourhood Information
Ankara 546 3.21
4.027 .018 Konya 942 3.13
Kayseri 427 3.39
Technical Infrastructure Services
Ankara 546 3.86
9.832 .000 Konya 942 3.60
Kayseri 427 3.94
Zoning Status
Ankara 546 3.82
3.754 .024 Konya 942 3.86
Kayseri 427 4.01
Entertainment and Cultural Areas Ankara 546 2.27
2.270 .104 Konya 942 2.07
Comparison of Factors Affecting the Plot Value According to Participants and Provinces (9498)
Sukran Yalpir, Fatma Bunyan Unel and Birol Gulnar (Turkey)
FIG Congress 2018
Embracing our smart world where the continents connect: enhancing the geospatial maturity of societies
Istanbul, Turkey, May 6–11, 2018

Kayseri 427 2.03
Public Transportations
Ankara 546 2.84
1.818 .163 Konya 942 2.90
Kayseri 427 3.04
Green Areas
Ankara 546 3.31
15.924 .000 Konya 942 3.05
Kayseri 427 3.63
Legal Restraints
Ankara 546 -2.17
2.093 .124 Konya 942 -2.06
Kayseri 427 -1.82
Structuring Conditions
Ankara 546 3.52
14.392 .000 Konya 942 3.22
Kayseri 427 3.52
The factors affecting the value of plot; Tamhane and Bonferroni methods have been applied
in order to demonstrate that there is a significant difference among the citizens in Ankara,
Konya and Kayseri provinces. The Tamhane method was used because the variances of
Unsanitary Areas, Public Institutions, Technical Infrastructure Services, Zoning Status, Green
Areas and Structuring Conditions Factor were not homogeneous; the Bonferroni method was
used because the variances of other factors were homogeneous.
Since the variances of Unsanitary Areas, Public Institutions, Technical Infrastructure
Services, Zoning Status, Green Areas and Structuring Conditions Factor are not
homogeneous; it was investigated whether there is a significantly different according to the
citizens of Ankara, Konya and Kayseri using Tamhane method.
Citizens of Kayseri (Mean=-3.68) and Ankara (Mean=-3.58), according to the
citizens of Konya (Mean=-3.23) in the Unsanitary Areas factor and,
Citizens in Kayseri (Mean=3.09), according to citizens in Konya (Mean=2.82)
in the Public Institutions factor,
Citizens in Kayseri (Mean=3.94) and Ankara (Mean=3.86), according to
citizens in Konya (Mean=3.60) in the Technical Infrastructure Services factor,
Citizens in Kayseri (Mean=4.01), both according to citizens in Konya
(Mean=3.86) and Ankara (Mean=-3.82) in the Zoning Status factor,
Citizens in Kayseri (Mean=3.63), according to citizens in Ankara (Mean=3.31)
and Konya (Mean=3.05) [also citizens in Ankara (Mean=3.31) according to
citizens in Konya (Mean=3.05)] in the Green Areas factor, and
Citizens in Ankara (Mean=3.52) and Kayseri (Mean=3.52), according to
citizens in Konya (Mean=3.22) in the Structuring Conditions factor
have been observed to give more importance significantly.
Whether the Favourite Neighbourhood Factor is significantly different from the citizens of
Ankara, Konya and Kayseri have been tested using the Bonferroni method because of the
homogeneous of its variances.
Citizens in Kayseri (Mean=3.39), according to citizens in Konya (Mean=3.13)
in the Favourite Neighbourhood Information factor
Comparison of Factors Affecting the Plot Value According to Participants and Provinces (9498)
Sukran Yalpir, Fatma Bunyan Unel and Birol Gulnar (Turkey)
FIG Congress 2018
Embracing our smart world where the continents connect: enhancing the geospatial maturity of societies
Istanbul, Turkey, May 6–11, 2018

has been revealed that to give more importance significantly.
The factors are presented according to their importance in comparison with the citizens in
Ankara, Konya and Kayseri. The factor order for "Zoning Status", "Technical Infrastructure
Services" and "Unsanitary Areas" in the first three comparisons of all sample groups
examined above changed only for the citizens of Ankara. According to the citizens of Ankara,
Konya and Kayseri, it was observed that the 3rd and 9th-10th factors did not change their
ranks. Other factors (1, 2, 4, 5, 6, 7 and 8th rank) show differentiate according to provinces
and there is a 70% difference among citizens in Ankara, Konya, and Kayseri (Table 7).
According to the citizens in Ankara, Konya and Kayseri, the last two rows were in the form of
Entertainment and Cultural Areas and Legal Restraints, whereas, was observed that expert in
Ankara, Konya and Kayseri sorted the opposite.
Table 7. Comparatively sorting of factors according to citizens in Ankara, Konya and Kayseri
Ankara Konya Kayseri
1 Technical Infrastructure Services Zoning Status Zoning Status
2 Zoning Status Technical Infrastructure Services Technical Infrastructure Services
3 Unsanitary Areas Unsanitary Areas Unsanitary Areas
4 Structuring Conditions Structuring Conditions Green Areas
5 Green Areas Favourite Neighbourhood Information Structuring Conditions
6 Favourite Neighbourhood Inf. Green Areas Favourite Neighbourhood Inf.
7 Public Institutions Public Transportations Public Institutions
8 Public Transportations Public Institutions Public Transportations
9 Entertainment and Cultural Areas Entertainment and Cultural Areas Entertainment and Cultural Areas
10 Legal Restraints Legal Restraints Legal Restraints
4. CONCLUSION
Status of real estate in Turkey has changed over the last decade is on its way up easily and
quickly converted into liquidity. Thus, the value is at the forefront leads to the development,
management and administration of real estates. In other words, transparent and clear
knowledge of real estate prices is a route map for the purchaser, investor and user. Herein, the
provision of the route map is a valuation map. Data, consisting of optimum criteria should be
produced from the model values obtained using the generally accepted analysis method. The
major issue is seen as determining the optimum criteria according to real estate types.
The criteria affecting the plot value of real estate types vary from country to country, from
region to region and from person to person. It can be seen that the region is subject to many
changes such as demographics, education, income, immigration, crime, social structure,
lifestyles, culture and traditions as well as topographic, geological and meteorological
characteristics, noise and air pollution. In this study, it has been proved that the factors that
consisting of the criteria differ statistically significantly among the experts and citizens in
Ankara, Konya and Kayseri. It has been determined that all experts and all citizens are subject
to half-and-half differentiation and that all experts have given more importance to the
Unsanitary Areas, Favourite Neighbourhood Information, Zoning Status, Entertainment and
Comparison of Factors Affecting the Plot Value According to Participants and Provinces (9498)
Sukran Yalpir, Fatma Bunyan Unel and Birol Gulnar (Turkey)
FIG Congress 2018
Embracing our smart world where the continents connect: enhancing the geospatial maturity of societies
Istanbul, Turkey, May 6–11, 2018

Cultural Areas and Legal Restrictions factors according to all citizens. There are also
differences in the results of analysis of cities by experts and citizen participants. It was
identified that the experts in Ankara give more importance statistically in terms of Structuring
Conditions, technical Infrastructure Services, Zoning Status and Green Areas in Konya, while
Konya also give more importance to Public Transportations factor in Kayseri. In all the
factors other than Entertainment and Cultural Areas, Public Transportations and Legal
Restraints, citizens in Kayseri have been detected to give more importance significantly in
Konya compared to others in Ankara. Besides, it was observed that the difference of
importance between the provinces of the citizens was 70% and more than the other
comparatives.
Although the criteria affecting the plot value vary according to the person, those with
considerably the economic impact the value should be determined in a clear, obvious and
standard format. These criteria should be chosen by considering statistical significance.
Otherwise, the collection of the smallest details about the real estate will not be significant in
terms of time, labour and cost. Similar implementation, agricultural lands, housing, industry
and etc. real estates as well should be carried out.
ACKNOWLEDGEMENT
The authors would like to thank pollsters who made efforts and participants who patiently
completed the questionnaire in the data collection phase of the survey. This study is supported
by the Scientific and Technological Research Council of Turkey (TÜBİTAK) with 115Y769
Project Number and Selcuk University BAP coordinator with the project of 15101008.
REFERENCES
Altunışık, R., Coşkun, R., Bayraktaroğlu, S. and Yıldırım, E., 2010, Sosyal bilimlerde
araştırma yöntemleri SPSS uygulamalı, Sakarya, Sakarya Yayıncılık.
ANOVA, 2015, Multiple Comparison Procedures, [25.10.2015],
http://psych.colorado.edu/~carey/Courses/PSYC5741/handouts/Multiple_Comparison_
Procedures.pdf:
Bender, A., Din, A., Favarger, P., Hoesli, M. and Laakso, J., 1997, An analysis of perceptions
concerning the environmental quality of housing in Geneva, Urban Studies, 34 (3), 503–
513.
Bender, A., Din, A., Hoesli, M. and Laakso, J., 1999, Environmental quality perceptions of
urban commercial real estate, Journal of Property Investment & Finance, 17 (3), 280–
296.
Bender, A., Din, A., Hoesli, M. and Brocher, S., 2000, Environmental preferences of
homeowners, further evidence using the AHP method, Journal of Property Investment
& Finance, 18 (4), 445–455.
Büyüköztürk, Ş., 2002, Faktör Analizi: Temel kavramlar ve ölçek geliştirmede kullanımı,
Kuram ve Uygulamada Eğitim Yönetimi, 32, 470–483.
Comparison of Factors Affecting the Plot Value According to Participants and Provinces (9498)
Sukran Yalpir, Fatma Bunyan Unel and Birol Gulnar (Turkey)
FIG Congress 2018
Embracing our smart world where the continents connect: enhancing the geospatial maturity of societies
Istanbul, Turkey, May 6–11, 2018

Doğan, N. and Doğan, İ., 2014, Birinci Tür Hata’nın kontrolü ve adımsal (Stepwise) çoklu
karşılaştırma testleri, Düzce Üniversitesi, Sağlık Bilimleri Enstitüsü Dergisi, 4 (1), 28–
33.
Gülnar, B., 2007, Araştırma görevlilerinin iş tatminini sağlama aracı olarak örgütsel iletişim
ve iletişim doyumu: Kamu ve özel üniversite karşılaştırması, Selçuk Üniversitesi,
Sosyal Bilimler Enstitüsü, Doktora Tezi, Konya.
IAAO, 2013, Standard on mass appraisal of real property. USA, The International Association
of Assessing Officers.
IBM, 2015, One-Way ANOVA Post Hoc Tests, [25.10.2015], http://www-
01.ibm.com/support/knowledgecenter/SSLVMB_23.0.0/spss/base/idh_onew_post.dita:
Kauko, T. J., 2002, Modelling the locational determinants of house prices: neural network and
value tree approaches, Utrecht University, PhD, Netherlands.
Kayri, M., 2009, Araştırmalarda gruplar arası farkın belirlenmesine yönelik çoklu
karşılaştırma (Post-Hoc) teknikleri, Fırat Üniversitesi, Sosyal Bilimler Dergisi, 19 (1),
51–64.
Köklü, N., Ş., B. and Bökeoğlu, Ç. Ö., 2006, Sosyal bilimler için istatistik, Ankara, PegemA
Yayıncılık.
Kryvobokov, M., 2006, Mass valuation of urban land in Ukraine: From normative to a
market-based approach, Real Estate and Construction Management School of
Architecture and The Built Environment Royal Institute of Technology, PhD,
Stockholm.
Lin, C. C., 2010, Critical analysis and effectiveness of key parameters in residential property
valuations, State University of New York, The Faculty of The Graduate School of The
University at Buffalo, PhD, New York.
Schulz, M. A. R., 2003, Valuation of properties and economic models of real estate markets,
Humboldt-University, Wirtschaftswissenschaftlichen Fakultat, PhD, Berlin.
Unel, F. B. and Yalpir, S., 2013, Grouping and analyzing of real estate valuation approaches,
International Journal of Multidisciplinary Thought, 3 (1), 171–182.
Unel, F. B., Yalpir, S. and Gulnar, B., 2017, Preference changes depending on age groups of
criteria affecting the real estate value, International Journal of Engineering and
Geosciences (IJEG), 2 (2), 41–51.
Ünel, F. B., 2017, Taşınmaz değerleme kriterlerine yönelik coğrafi veri modelinin
geliştirilmesi, Selçuk Üniversitesi, Fen Bilimleri Enstitüsü, Doktora Tezi, Konya.
Yıldız, Ü., 2014, Gayrimenkul bilimlerinde kitlesel değerleme uygulamaları ve Türkiye için
model önerisi, Ankara Üniversitesi, Fen Bilimleri Enstitüsü, Yüksek Lisans Tezi,
Ankara.
Yomralıoğlu, T., 1993, A Nominal asset value-based approach for land readjustment and its
implementation using Geographical Information Systems, University of Newcastle upon
Tyne, PhD, UK.
Yomralıoğlu, T., Nişancı, R., Çete, M. and Candaş, E., 2011, Dünya’da ve Türkiye’de
taşınmaz değerlemesi. Türkiye’de Sürdürülebilir Arazi Yönetimi Çalıştayı. İstanbul,
Okan Üniversitesi.
Comparison of Factors Affecting the Plot Value According to Participants and Provinces (9498)
Sukran Yalpir, Fatma Bunyan Unel and Birol Gulnar (Turkey)
FIG Congress 2018
Embracing our smart world where the continents connect: enhancing the geospatial maturity of societies
Istanbul, Turkey, May 6–11, 2018
BIOGRAPHICAL NOTES
Sukran YALPIR is Assistant Professor at Department of Geomatics Engineering in Selcuk
University. She graduated from the Geomatics Engineering at Selcuk University in 1995. She
graduated from a PhD at Selcuk University in 2007. She studies on the topics of real estate
valuation, mass appraisal, land management, geographical information systems, urban
renewal, cadastre, land readjustment, etc.
Fatma BUNYAN UNEL graduated from the Geomatics Engineering at Selcuk University in
2002. She was a lecturer in Map and Cadastre Program in Selcuk University between 2002
and 2015. She graduated from a PhD at Selcuk University in 2017. She studies on the topics
of real estate valuation, mass appraisal, land management and geographical information
systems.
Birol GULNAR is Professor Doctor at Department of Radio-Television and Film in Selcuk
University. He graduated from Communication Faculty at Anadolu University in 2000. He
graduated from a PhD at Selcuk University in 2007. He studies on the topics of new
communication technologies, interpersonal communication, host language proficiency,
communication satisfaction, etc.
CONTACTS
Sukran YALPIR, Fatma BUNYAN UNEL and Birol GULNAR
Selcuk University, Alaeddin Keykubat Campus, 42130, Konya, TURKEY
Fax : 0090 332 241 06 35
Email : [email protected]; [email protected] and [email protected]
Web site: www.selcuk.edu.tr
Comparison of Factors Affecting the Plot Value According to Participants and Provinces (9498)
Sukran Yalpir, Fatma Bunyan Unel and Birol Gulnar (Turkey)
FIG Congress 2018
Embracing our smart world where the continents connect: enhancing the geospatial maturity of societies
Istanbul, Turkey, May 6–11, 2018