Comparison of ESN, urea, and aqua ammonia as sources of ...
79
Retrospective eses and Dissertations Iowa State University Capstones, eses and Dissertations 2008 Comparison of ESN, urea, and aqua ammonia as sources of nitrogen for corn production in Iowa Jeffrey Allen Moore Iowa State University Follow this and additional works at: hps://lib.dr.iastate.edu/rtd Part of the Agricultural Science Commons , Agriculture Commons , Agronomy and Crop Sciences Commons , and the Soil Science Commons is esis is brought to you for free and open access by the Iowa State University Capstones, eses and Dissertations at Iowa State University Digital Repository. It has been accepted for inclusion in Retrospective eses and Dissertations by an authorized administrator of Iowa State University Digital Repository. For more information, please contact [email protected]. Recommended Citation Moore, Jeffrey Allen, "Comparison of ESN, urea, and aqua ammonia as sources of nitrogen for corn production in Iowa" (2008). Retrospective eses and Dissertations. 14901. hps://lib.dr.iastate.edu/rtd/14901
Transcript of Comparison of ESN, urea, and aqua ammonia as sources of ...
Retrospective Theses and Dissertations Iowa State University Capstones, Theses andDissertations
2008
Comparison of ESN, urea, and aqua ammonia assources of nitrogen for corn production in IowaJeffrey Allen MooreIowa State University
Follow this and additional works at: https://lib.dr.iastate.edu/rtd
Part of the Agricultural Science Commons, Agriculture Commons, Agronomy and CropSciences Commons, and the Soil Science Commons
This Thesis is brought to you for free and open access by the Iowa State University Capstones, Theses and Dissertations at Iowa State University DigitalRepository. It has been accepted for inclusion in Retrospective Theses and Dissertations by an authorized administrator of Iowa State University DigitalRepository. For more information, please contact [email protected].
Recommended CitationMoore, Jeffrey Allen, "Comparison of ESN, urea, and aqua ammonia as sources of nitrogen for corn production in Iowa" (2008).Retrospective Theses and Dissertations. 14901.https://lib.dr.iastate.edu/rtd/14901

Comparison of ESN, urea, and aqua ammonia as sources of nitrogen for corn
production in Iowa
by
Jeffrey Allen Moore
A thesis submitted to the graduate faculty
in partial fulfillment of the requirements for the degree of
MASTER OF SCIENCE
Major: Soil Science (Soil Fertility)
Program of Study Committee:
Randy Killorn, Major Professor
Allen Knapp
Tom Loynachan
Iowa State University
Ames, Iowa
2008

UMI Number: 1450145
14501452008
UMI MicroformCopyright
All rights reserved. This microform edition is protected against unauthorized copying under Title 17, United States Code.
ProQuest Information and Learning Company 300 North Zeeb Road
P.O. Box 1346 Ann Arbor, MI 48106-1346
by ProQuest Information and Learning Company.

ii
TO:
My family and friends who have always supported me.

iii
Table of Contents
Abstract.................................................................................................................................v
General Introduction ...........................................................................................................1
Thesis Organization .............................................................................................................6
Comparison of ESN and urea applied in spring as sources of nitrogen for corn
production in Iowa
Abstract ......................................................................................................................7
Introduction................................................................................................................8
Materials and Methods...............................................................................................9
Results and Discussion ..............................................................................................12
Summary and Conclusions ........................................................................................18
References..................................................................................................................20
Figures........................................................................................................................21
Tables.........................................................................................................................22
Comparison of ESN and aqua ammonia applied in the fall and spring as sources of
nitrogen for corn production in Iowa
Abstract ......................................................................................................................34
Introduction................................................................................................................35
Materials and Methods...............................................................................................36
Results and Discussion ..............................................................................................39
Summary and Conclusions ........................................................................................44
References..................................................................................................................45
Figures........................................................................................................................46
Tables.........................................................................................................................47

iv
Comparison of ESN and aqua ammonia applied in the spring as sources of nitrogen for
corn production in Iowa
Abstract ......................................................................................................................57
Introduction................................................................................................................58
Materials and Methods...............................................................................................59
Results and Discussion ..............................................................................................61
Summary and Conclusions ........................................................................................64
References..................................................................................................................65
Tables.........................................................................................................................66
General Conclusions ............................................................................................................71
Acknowledgements ..............................................................................................................72
v
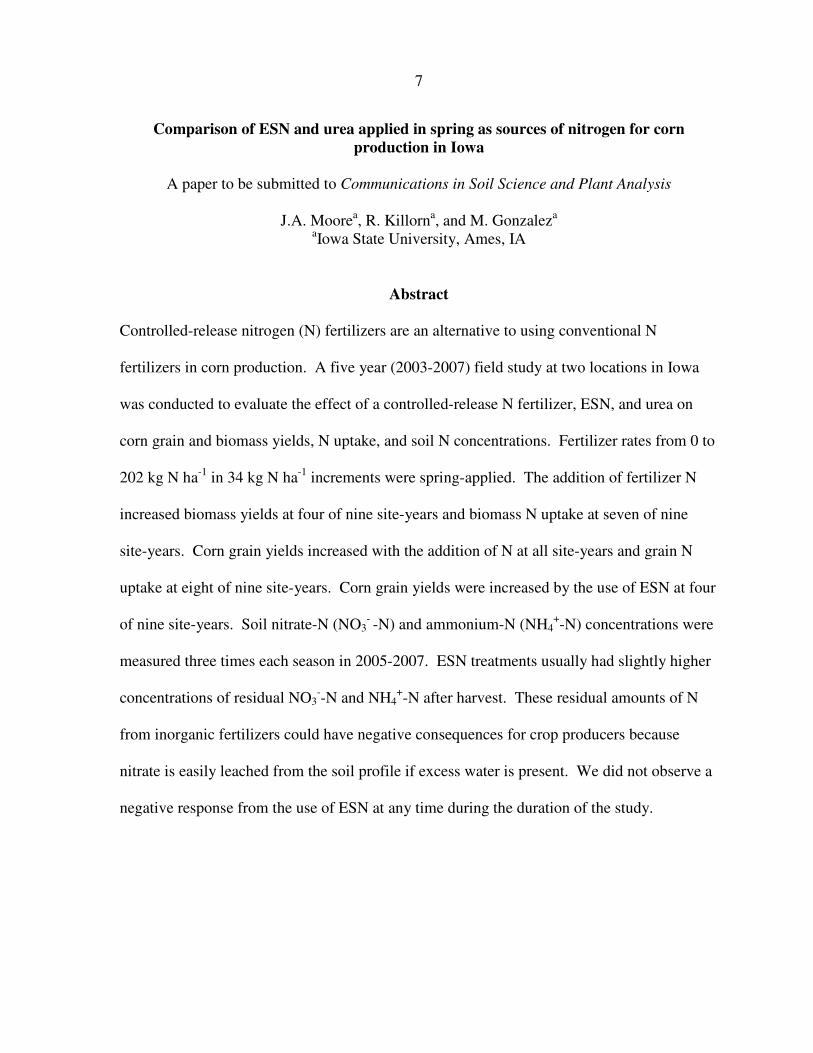
Abstract
Three nitrogen response studies were conducted in Iowa to compare the effect of a controlled
release fertilizer, ESN, to urea and aqua ammonia (AA), on corn grain yields, biomass yields,
and soil nitrate (NO3- -N) and ammonium (NH4
+-N) concentrations. Experiments were
conducted at two sites from 2003 through 2007 for the spring-applied ESN/urea study, two
sites from 2006 through 2007 for the fall and spring-applied ESN/AA study, and one site
from 2006 through 2007 for the spring applied ESN/AA study. N rates in the studies were 0-
202 kg ha-1
in 34 kg N ha-1
increments in the ESN/urea study and 0-202 kg N ha-1
in 67 kg N
ha-1
increments in the fall and spring-applied ESN/AA studies. Four of nine site-years in the
ESN/urea study had significantly higher corn grain yields due to ESN. One of four site-years
in the fall and spring-applied study had higher grain yields to either fall or spring application
of ESN. Neither year of the spring-applied ESN/AA study had significantly higher grain
yields due to ESN. Biomass yields, the above ground portion of the plant minus the ear,
were also collected at physiological maturity. None of the nine site-years in the ESN/urea
study had a positive response to ESN. One of the four site-years in the fall and spring-
applied ESN/AA study had a positive response to spring-applied ESN. Neither year of the
spring-applied ESN/AA study had a positive response to ESN. Soil samples were taken to
measure NH4+-N and NO3
- -N concentrations at the V-6, V-15 growth stages, and also post-
harvest at a depth of 0-30 cm. A 31-60 cm soil sample was also taken at post harvest.
Throughout all of the studies, ESN treatments usually had higher concentrations of soil
NH4+-N and NO3
- -N. Higher concentrations of residual N left in the soil after harvest can be
subject to loss overwinter.

1
General Introduction
Nitrogen (N) fertilization is one of the most important aspects to corn production. In
the past, as well as now, producers would often over-apply N to compensate for the risk of
running short of N during the growing season thus risking yield losses. Increasing
environmental concerns about nitrate leaching into ground water, runoff into surface water,
and the rising cost of N fertilizer have led researchers and producers to look at different N
management strategies which can help to reduce N loss and increase economic return to the
producer.
Timing of N fertilizer application can affect the efficiency of N, primarily because of
the time between the application and uptake by the crop. If nitrogen is applied well before
crop uptake, it can be lost by leaching or denitrification (Bundy, 1986). Leaching losses tend
to occur more often on well-drained soils while denitrification happens primarily on poorly
drained soils in the presence of warmer temperatures. Excess precipitation can increase the
losses of N through these two processes (Randall and Schmitt, 1998). Most N application in
the northern part of the Corn Belt is typically done by producers in the fall because there is
more time and field conditions are better suited for application compared to the spring
(Bundy and Sawyer, 2005). Also, N application in the fall by producers has other advantages
such as better distribution of labor and equipment demands, time savings during the busy
planting season, and the cost of N is usually cheaper in the fall compared to the spring
(Bundy, 1986; Randall and Schmitt, 1998).
Even though nitrogen gas (N2) makes up 78 percent of the atmosphere, it is one of the
most limiting elements for plant growth because it is not available until it is combined with
hydrogen or oxygen (Troeh and Thompson, 1993). Nitrogen is required for formation of

2
enzymes, to make lignin in cell walls, and is needed in about twenty amino acids to form
protein through peptide linkages. Nitrogen is also a component of chlorophyll; it is used in
the formation of purine and pyrimidine in DNA and RNA. Because N is required in such
large amounts, it can be reasoned that a deficiency will be detrimental to producing high
yields in crops. Plants tend to take up nitrate (NO3-) in the largest amount followed by
ammonium (NH4+). Nitrate is the only inorganic form of nitrogen that can and will
accumulate in plants in significant quantities (Black, 1968).
One type of management strategy currently being evaluated is the use of controlled
and slow-release N fertilizers. There are no official definitions of slow and controlled
release, but Trenkel (1997) suggests that a slow release fertilizer is insoluble and requires
microbial decomposition to release the fertilizer material, while a controlled release fertilizer
refers to a material which is coated or encapsulated by an insoluble material. This
encapsulation (water insoluble, semi-permeable or impermeable with pores) slows down the
release of the fertilizer. The general idea behind these N fertilizers is to slowly provide N or
other nutrients to plants throughout the growing season. The idea behind slow and controlled
release N products began as early as 1907 when a United States patent was granted for an
impregnating and coating process to be used in the production of a slow-release fertilizer
(Powell, 1968). Controlled-release fertilizers have been shown to increase yields in crops
such as potatoes (Zvomuya and Rosen, 2001) and barley (Nyborg et al., 1999).
ESN is a controlled-release N product (44% N) developed by Agrium, Inc. Nitrogen
is released through the organic, biodegradable, polymer coating which is composed of castor
oil, polymeric diphenylmethane diisocyanate, and wax. After the prills come in contact with
soil moisture, they absorb water and liquefy the urea inside the coating. The urea solution

3
will then diffuse into the soil solution though the coating over the growing season. The
diffusion rate is based on temperature with higher temperatures leading to increased diffusion
rates. After all of the urea solution is released, the coating will be broken down by microbial
action over time.
The use of slow and controlled release N fertilizers has some advantages because the
release of the product isn’t affected by certain soil properties such as pH, soil texture,
microbial activity, soil salinity, and other factors. This property of the coating makes it
possible to predict release rates over time (Trenkel, 1997). Other advantages include reduced
passes over the field which can aid in preventing compaction and reduce labor costs. Plant
injury from contact with high concentrations of soluble fertilizer can also be reduced (Powell,
1968). Currently, slow and controlled release fertilizers are predominately used in the turf
grass and horticultural industries because of their higher costs when compared to
conventional N fertilizers (Hauck, 1985). Trenkel (1997) states that unless the cost of
controlled release fertilizers can be significantly lowered, they will not gain wide use on low
value agricultural crops such as corn. Also, special care must be taken when handling
controlled release fertilizers in order not to scratch or break the coating. If this happens, the
granules will lose their controlled release properties. Controlled release fertilizers such as
ESN, and slow release N fertilizers have potential for generating greater corn yields and
reduced losses of nitrate compared with urea, especially in situations where N loss potential
is high (sandy soils, plentiful spring rainfall, fall application, etc.) (Randall and Sawyer,
2005).
The environment could also benefit from the increased use of controlled release
fertilizers. Hypoxia (low concentrations of dissolved oxygen in water, generally less than 2

4
mg/L) has been a persistent problem in the Gulf of Mexico. The hypoxia is most widespread
in June, July, and August and the size of the zone varies from year to year (Mitsch et al.,
2001). If laws are passed to restrict nitrogen application to certain times of the year or on
farmland where there is a possibility of polluting groundwater, rivers, and lakes, producers
may be forced to give a preference to these types of nitrogen fertilizers (Trenkel, 1997).
Delaying N applications until plants are able to effectively utilize N may substantially
increase N use efficiency (Olson and Kurtz, 1982).
The objectives of these papers were to: 1) compare the effects of spring-applied ESN
and urea on corn grain yields; 2) compare the effects of ESN and aqua ammonia applied in
the fall and spring on corn grain yields and 3) compare soil NH4+-N and soil NO3
--N
concentrations at three times during the year, the V-6 growth stage, the V-15 growth stage,
and at post-harvest.
References
Black, C.A. 1968. Soil-plant relationships. Wiley., New York.
Bundy, L.G. 1986. Review—timing nitrogen applications to maximize fertilizer efficiency
and crop response in conventional corn production. J. Fert. Issues. 3:99–106.
Hauck, R.D. 1985. Slow-release and bioinhibitor-amended nitrogen fertilizers. p. 294-319. In
O.P. Engelstad (ed.) Fertilizer technology and use, 3rd
ed. SSSA, Madison, WI.
Mitsch, W.J., J.W. Day Jr., J.W. Gilliam, P.M. Groffman, D.L. Hey, G.W. Randall, and N.
Wang. 2001. Reducing nitrogen loading to the Gulf of Mexico from the Mississippi
River Basin: strategies to counter a consistent ecological problem. BioScience. 51:
373-388.

5
Nyborg, M., S.S. Malhi, E.D. Solberg, and M. Zhang. 1999. Influence on polymer-coated
urea on mineral nitrogen release, nitrification, and barley yield and nitrogen uptake.
Commun. Soil Sci. Plant Anal. 30 (13-14): 1963-1974.
Olson, R.A., and L.T. Kurtz. 1982. Crop nitrogen requirements, utilization, and fertilization.
p. 567-604. In F.J. Stevenson (ed.) Nitrogen in agricultural soils. ASA, CSSA, and
SSSA, Madison, WI.
Powell, R. 1968. Controlled release fertilizers. Chemical process review No. 15: 1-198.
Randall, G.W., and M.A. Schmitt. 1998. Advisability of fall-applying nitrogen. p. 90–96. In
Proc. 1998 Wisconsin Fert., Aglime, and Pest Manage. Conf., Middleton, WI. 20 Jan.
1998. Univ. of Wisconsin, Madison.
Randall, G.W., and J. E. Sawyer. 2005. Nitrogen application timing, forms, and additives.
Gulf hypoxia and local water quality concerns workshop. Ames, IA. September 26-
28, 2005. Iowa State University, as viewed at
www.epa.gov/msbasin/taskforce/2006symposia/6NitrogenAppRandall.pdf. (verified
26th
November 2007).
Trenkel, M.E. 1997. Improving fertilizer use efficiency. Controlled-release stabilized
fertilizers in agriculture. FAO and IFA, Paris. p. 7-21.
Troeh, F.R., and L.M. Thompson. 1993. Soils and soil fertility, 5th
ed. New York : Oxford
University Press.
Zvomuya, F., and C.J. Rosen. 2001. Evaluation of polyolefin-coated urea for potato
production on a sandy soil. HortScience 36 (6): 1057-1060.

6
Thesis Organization
This thesis is organized with a general introduction, three papers that will be
submitted to Communications in Soil Science and Plant Analysis and a general conclusion.
Each individual paper has an abstract, introduction, materials and methods, results and
discussion, and summary and conclusions.
7
Comparison of ESN and urea applied in spring as sources of nitrogen for corn
production in Iowa
A paper to be submitted to Communications in Soil Science and Plant Analysis
J.A. Moorea, R. Killorn
a, and M. Gonzalez
a
aIowa State University, Ames, IA
Abstract
Controlled-release nitrogen (N) fertilizers are an alternative to using conventional N
fertilizers in corn production. A five year (2003-2007) field study at two locations in Iowa
was conducted to evaluate the effect of a controlled-release N fertilizer, ESN, and urea on
corn grain and biomass yields, N uptake, and soil N concentrations. Fertilizer rates from 0 to
202 kg N ha-1
in 34 kg N ha-1
increments were spring-applied. The addition of fertilizer N
increased biomass yields at four of nine site-years and biomass N uptake at seven of nine
site-years. Corn grain yields increased with the addition of N at all site-years and grain N
uptake at eight of nine site-years. Corn grain yields were increased by the use of ESN at four
of nine site-years. Soil nitrate-N (NO3- -N) and ammonium-N (NH4
+-N) concentrations were
measured three times each season in 2005-2007. ESN treatments usually had slightly higher
concentrations of residual NO3--N and NH4
+-N after harvest. These residual amounts of N
from inorganic fertilizers could have negative consequences for crop producers because
nitrate is easily leached from the soil profile if excess water is present. We did not observe a
negative response from the use of ESN at any time during the duration of the study.

8
Introduction
The use of nitrogen (N) fertilizer to obtain high corn grain yields is very common in
Iowa. Proper N fertilization is a difficult challenge facing today’s crop producers. Rising
costs of N fertilizer encourage producers to look for ways to increase yields and recover
applied N while keeping costs at a minimum.
Nitrogen is subject to physical and biological processes in the soil which can
influence the amount of N that is available for plant uptake (Gonzalez, 2005). Urea
(CO(NH2)2) is one of the most common N fertilizers used in the United States today. When
urea is applied to soils, it is hydrolyzed rapidly by an enzyme, urease, to form ammonium
(NH4+) and is then converted to nitrate (NO3
-) by a process called nitrification. Leaching of
applied N fertilizer results in reduced uptake efficiency by the target crop and is an
agricultural problem that crop producers have to deal with (Wang and Alva, 1996). The
dominant form of N in well-aerated soils is NO3--N, which is easily lost to leaching when
water passes through the soil profile (Allen, 1985).
ESN is a controlled-release N product (44% N) developed by Agrium, Inc. When
ESN comes in contact with soil moisture, it absorbs water and liquefies the urea inside of the
coating. ESN releases liquid urea through its polymer coating during the growing season.
As temperature increases, the rate of release of the urea into the soil solution increases.
Slow and controlled-release fertilizers are predominately used in the turf grass and
horticultural industries because of their higher cost when compared to conventional fertilizers
(Hauck, 1985). The use of controlled-release fertilizers offers advantages such as reduced
passes over the field, a decrease in plant injury, and soil properties (pH, soil texture,
microbial activity, etc) don’t affect release rates of the fertilizer (Trenkel, 1997). Currently
9
the cost of the fertilizer is prohibiting its use in lower value crops such as corn. Handling of
the product is also an issue. Care must be taken not to compromise the integrity of the
coating which can make the fertilizer lose its controlled release characteristics. To date, little
research has been published comparing ESN with urea for application to corn.
The objectives of this study were to: 1) compare the effects of spring-applied ESN
and urea on corn grain and biomass yields and 2) compare the effects of spring-applied ESN
and urea on soil NH4+-N and soil NO3
--N concentrations at three times during the year: the
V-6 growth stage, the V-15 growth stage, and at post-harvest.
Materials and Methods
The study was conducted over five growing seasons at two locations in Iowa: the
Northern Research and Demonstration Farm (KNW) at Kanawha (2003-2007) and the
Northwest Research and Demonstration Farm (NW) at Sutherland (2003, 2005-2007). The
2004 location at Sutherland received heavy hail damage so no data were collected. The soil
types for the experiments at Kanawha and Sutherland are listed in Table 1, while cultural
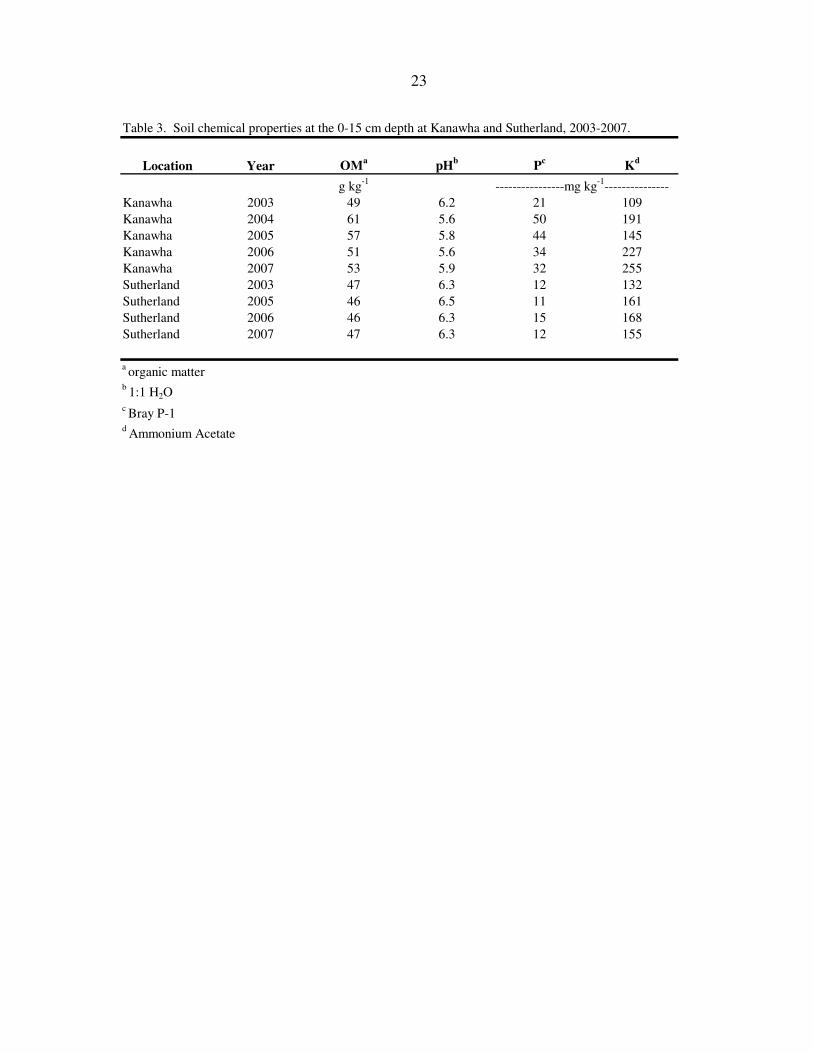
practices are listed in Table 2, and baseline soil data are listed in Table 3.
Treatments were arranged as a factorial in a randomized complete block design with
four replications. Each experimental plot measured 4.6 m by 12.2 m at KNW and contained
six rows of corn spaced 76 cm apart. The experimental plots at NW measured 3.05 m by
12.2 m. These plots contained 4 rows of corn spaced 76 cm apart. The ESN (44% N) and
urea (46% N) were hand applied in the spring before the corn was planted and incorporated
within twenty-four hours of application to reduce N loss due to volatilization. Nitrogen
application rates for all sites in all years were: 0, 34, 67, 101, 134, 168, and 202 kg N ha-1
.
The corn plots followed soybeans in all years of the study at both locations.
10
The corn was scouted several times throughout the growing season to evaluate overall
plant health and possible damage due to insects, disease, and weather related events.
Grain Yield and Analysis
The center rows of each plot were harvested (three rows at Kanawha and two rows at
Sutherland) with a combine. The weight of the grain in each plot and moisture content were
recorded when harvested by the combine. A sub-sample of the grain was collected, weighed,
and dried at 60º C. The sub-sample was used to determine grain moisture of the plot. Corn
grain yield was adjusted to reflect a moisture content of 155 g kg-1
.
Chemical analysis of the grain was conducted as follows: A 0.25g sub-sample of
grain was ground, dried for a minimum of twenty-four hours, and was digested using the
Hach Digesdahl® Digestion Apparatus, and the Hach Plant Tissue and Tissue Analysis
System (Hach Company, 1988), with concentrated sulfuric acid (18 M H2SO4) and 50%
hydrogen peroxide (H2O2). The digested product was then used to determine percent N by
using a modified Nessler Method test and a Hach DR/3000 Spectrophotometer (DR/3000
Procedure Code N.10) as described in the method for Nitrogen Analysis in Total Plant Tissue
(Hach Company, 1988). Nitrogen uptake was calculated by multiplying the grain yield by
the percent of N in the grain.
Plant Biomass Production and Analysis
Whole plant samples were collected when the plants reached physiological maturity.
The entire above-ground portion of six plants, minus the ears of corn were selected from the
center two rows (three plants from each row) of each plot. The first plant in the row was
skipped because it was generally larger due to more light interception. The plant samples
were chopped and weighed. A sub-sample was taken, weighed, then dried at 60º C for a

11
minimum of forty-eight hours, weighed again, and ground. Total nitrogen content and N
uptake of the biomass was determined by using the same procedure that was used to
determine the total nitrogen content of the grain. The dry weight of the sub-sample was used
to determine total above ground biomass produced per hectare. N uptake was calculated by
multiplying the dry weight of the biomass by the percent N in the biomass sample.
Soil Sampling and Analysis
Soil samples were collected three times a year at each site and year in 2005-2007.
The soil samples were taken at the V-6 growth stage, the V-15 growth stage, and after
harvest was completed. Three cores were randomly taken to a depth of 30 cm between the
center two rows of the plot and combined to form the sample. The post harvest sample
included samples collected from a depth of 31-60 cm.
The soil samples were dried at 60º C for a minimum of twenty-four hours and ground
to pass through a 2 mm sieve. A 10 g sub-sample was weighed and extracted with 50 ml of 2
M KCl solution. The extract was filtered and analyzed for NO3--N and NH4
+-N using a
QuikChem 8000 Automated Ion Analyzer by the QuikChem Method 12-107-04-1-B (Lachat
Instruments, 1992) for the NO3--N and QuikChem Method 12-107-06-2-A (Lachat
Instruments, 1993) for NH4+-N.
Data Analysis
Statistix 8 (Analytical Software, 2003) was used to analyze the data. The analyses for
each combination of site and year were done separately. Nitrate-N and NH4+-N content for
all soil sampling times were also analyzed separately. Differences at the p>F = 0.05 level or
less were considered significant. Outliers in all of the data, except for corn grain yield, were

12
identified by using residual graphs and were determined to be non-representative if they were
greater than three standard deviations from the experiment mean.
Results and Discussion
Kanawha location
Biomass production
Biomass yields increased with N rate in 2005 (p>F = 0.0003) and 2007 (p>F =
0.0001) but were non significant every other year (Table 4). The difference between the two
materials was not significant any year of the study. The interaction between material and N
rate was significant in 2006 (p>F = 0.0325) (Table 4). Average biomass yields were greater
for ESN treatments than urea treatments in 2004 and 2007. Averaged over site-years at
Kanawha, urea treatments yielded 8.08 Mg ha-1
while ESN treatments yielded 8.04 Mg ha-1
.
Biomass yields displayed a large amount of variability over the site-years at Kanawha. Since
six plants per plot were collected to determine biomass yield, it is possible that the samples
weren’t always representative of the plots.
Biomass N uptake was significantly increased by N rate in 2003, 2005 (p>F =
<0.0001), 2006, and 2007 (p>F = 0.0005) (Table 4). The difference between the two
materials was higher for ESN treatments in 2005 (p>F = 0.0050) (Table 4). The interaction
between material and N rate was not significant any year of the study. ESN treatments had
higher average N uptakes in 2003-2005 and 2007 (Table 4). This could be due to the
protective coating on the ESN. Because N is released at a slower rate compared to urea, it is
likely that more N was taken up by the corn than lost to leaching or other factors.
13
Grain Production
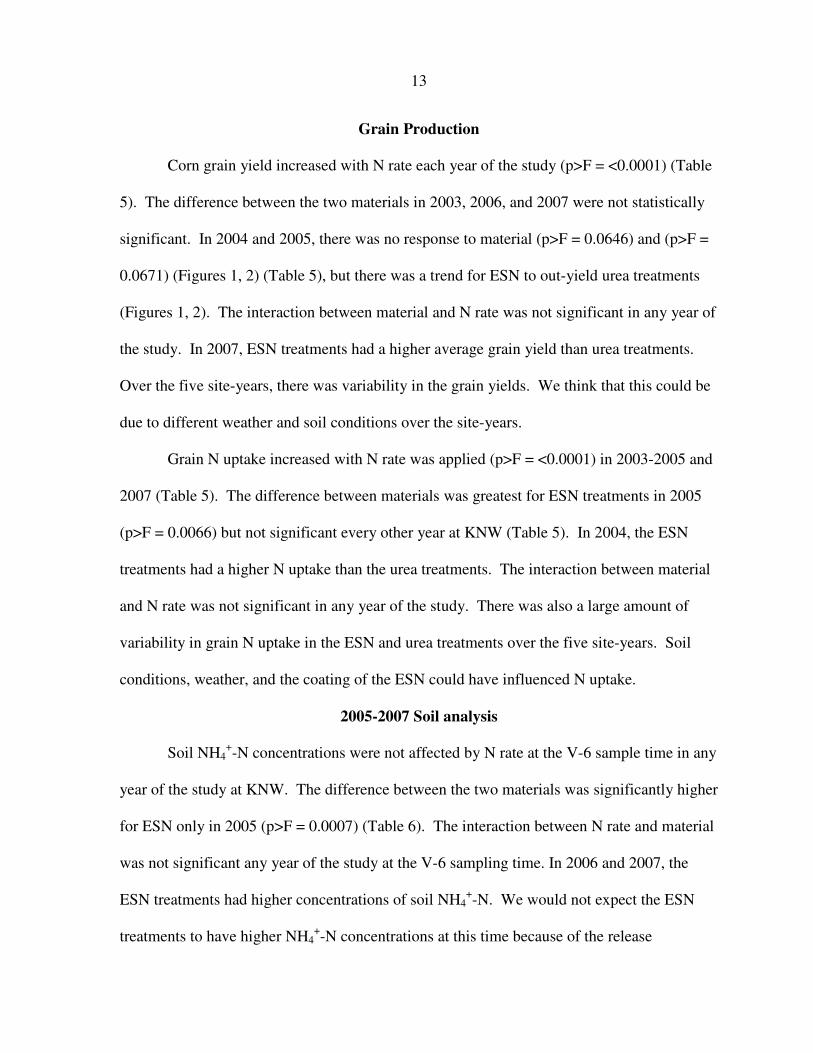
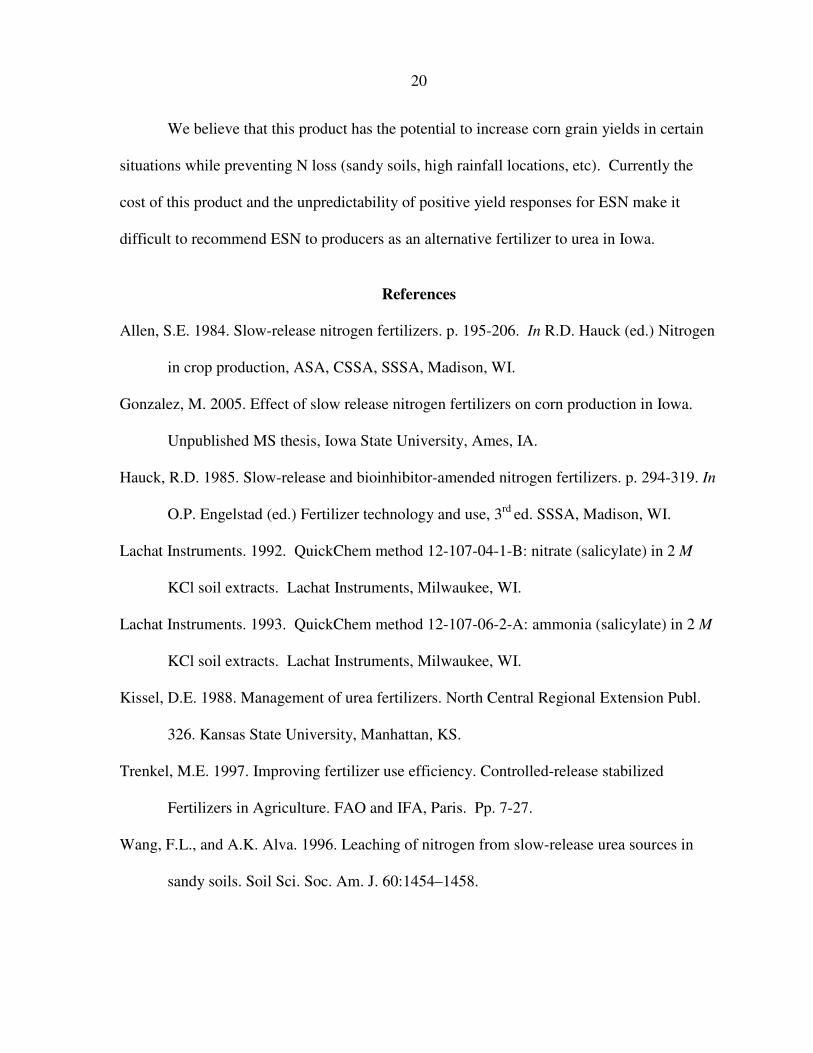
Corn grain yield increased with N rate each year of the study (p>F = <0.0001) (Table
5). The difference between the two materials in 2003, 2006, and 2007 were not statistically
significant. In 2004 and 2005, there was no response to material (p>F = 0.0646) and (p>F =
0.0671) (Figures 1, 2) (Table 5), but there was a trend for ESN to out-yield urea treatments
(Figures 1, 2). The interaction between material and N rate was not significant in any year of
the study. In 2007, ESN treatments had a higher average grain yield than urea treatments.
Over the five site-years, there was variability in the grain yields. We think that this could be
due to different weather and soil conditions over the site-years.
Grain N uptake increased with N rate was applied (p>F = <0.0001) in 2003-2005 and
2007 (Table 5). The difference between materials was greatest for ESN treatments in 2005
(p>F = 0.0066) but not significant every other year at KNW (Table 5). In 2004, the ESN
treatments had a higher N uptake than the urea treatments. The interaction between material
and N rate was not significant in any year of the study. There was also a large amount of
variability in grain N uptake in the ESN and urea treatments over the five site-years. Soil
conditions, weather, and the coating of the ESN could have influenced N uptake.
2005-2007 Soil analysis
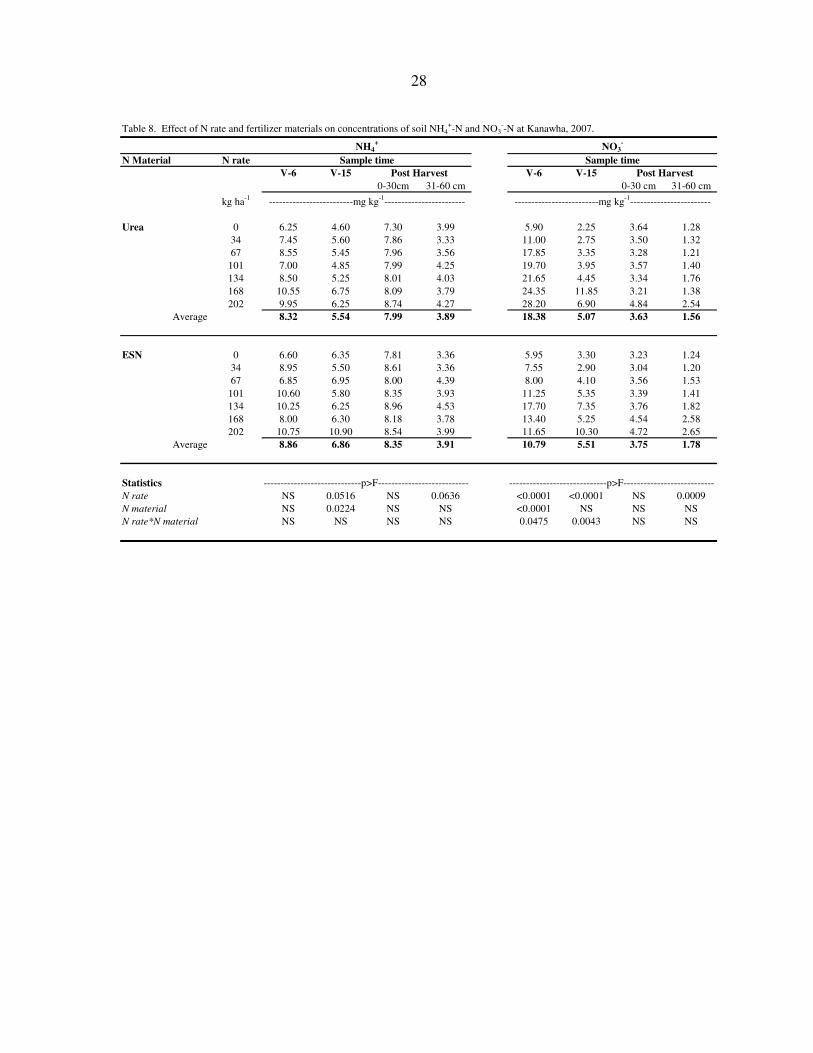
Soil NH4+-N concentrations were not affected by N rate at the V-6 sample time in any
year of the study at KNW. The difference between the two materials was significantly higher
for ESN only in 2005 (p>F = 0.0007) (Table 6). The interaction between N rate and material
was not significant any year of the study at the V-6 sampling time. In 2006 and 2007, the
ESN treatments had higher concentrations of soil NH4+-N. We would not expect the ESN
treatments to have higher NH4+-N concentrations at this time because of the release

14
properties of the ESN. Since ESN should be released at a slower rate throughout the season,
we would predict that there would be less N available at the V-6 growth stage when
compared to the urea treatments.
Soil NH4+-N concentrations at V-15 were increased by the addition of N in 2005 and
2007 (p>F = 0.0017 and 0.0516) (Tables 6, 8). The difference between the two materials
was significantly higher for ESN treatments in 2005 and 2007 (p>F = 0.0172 and 0.0224)
(Tables 6, 8). The interaction between the two materials was only significant in 2005 (p>F =
0.0194) (Table 6). The average concentrations of soil NH4+-N at this time were higher each
year for the ESN treatments compared to the urea treatments. We would expect this to
happen because a good portion of the N should still be releasing from the ESN and available
for plant uptake.
Post harvest soil NH4+-N concentrations at the 0-30 cm depth were not affected by
any of the factors tested in 2005-2007. Soil NH4+-N concentrations at the post harvest
sampling time at the 31-60 cm depth were slightly increased with the addition of N in 2007
(p>F = 0.0636) (Table 8).
Soil NO3--N concentrations at the V-6 sampling time increased with the addition of N
every year of the study (p>F = 0.0001, <0.0001, and <0.0001 respectively) (Tables 6, 7, 8).
The difference between the two materials was also significantly higher in the urea treatments
each year of the study (p>F = 0.0008, <0.0001, and <0.0001) (Tables 6, 7, 8). The
interaction between the two materials at the V-6 sampling time was significant in 2006 and
2007 (p>F = 0.0068 and 0.0475) (Tables 7, 8). We expected soil NO3--N concentrations
from urea to be higher due to the fact that urea generally hydrolyzes rapidly in soils in the

15
Midwest (Kissel, 1988). Obviously conditions such as temperature, moisture, soil pH and
other factors play a role in how fast N from urea becomes plant available.
At the V-15 sampling time, NO3-N concentrations increased with the addition of
fertilizer N every year of the study (p>F = 0.0025, 0.0052, and <0.0001 respectively) (Tables
6, 7, 8). The difference between the two materials was higher for ESN treatments in 2005
(p>F = 0.0001) (Table 6). The interaction between N rate and material was significant in
2005 and 2007 (p>F = 0.0202 and 0.0043) (Tables 6, 8). The average concentrations of soil
NO3-N from urea were only slightly higher than soil NO3-N from the ESN treatments in
2006. Generally, this would be expected because N from urea quickly becomes plant
available.
Post harvest soil NO3--N concentrations at the 0-30 cm depth increased with N rate in
2006 (p>F = <0.0001) (Table 7). No other factors at this depth were affected over the
duration of the study. At the 31-60 cm depth, soil NO3--N concentrations increased with the
addition of N in 2005 and 2007 (p>F = 0.0007 and 0.0009) (Tables 6, 8). The difference
between the two materials was higher for ESN treatments in 2005 (p>F = 0.0014) (Table 6).
The interaction between material and N rate was significant in 2005 (p>F = 0.0060) (Table
6).
Results and Discussion
Sutherland location
Biomass production
Biomass yields increased with increased N rates in 2006 (p>F = 0.0343) and 2007
(p>F = 0.0066) (Table 9). The difference between fertilizer materials and the interaction
between material and N rate were not significant in any year of the study. Averaged over

16
site-years at Sutherland, biomass yields from urea treatments were 7.28 Mg ha-1
and 7.14 Mg
ha-1
from ESN treatments. Biomass yields varied greatly over the four site-years at
Sutherland. This is more than likely due to different rainfall amounts over the length of the
study. The variation could also be due to not getting a representative sample to determine
biomass yield.
Biomass N uptake increased with N rate in 2003 (p>F = 0.0053), 2005 (p>F =
0.0001), and 2007 (p>F = <0.0001) (Table 9). The difference between the fertilizer materials
and the interaction between material and N rate were not significant in any year of the study.
Average biomass N uptake varied throughout the study, but when compared by year, the
source of N, ESN or urea, didn’t have much of an effect on N uptake. This could be because
environmental conditions were not ideal for the loss of N. The soils in this part of Iowa tend
to retain more NO3--N than in central Iowa which could also affect N availability.
Grain production
Corn grain yields increased as N rates increased each year of the study (p>F =
<0.0001) (Table 10). The difference between the two fertilizer materials was not significant
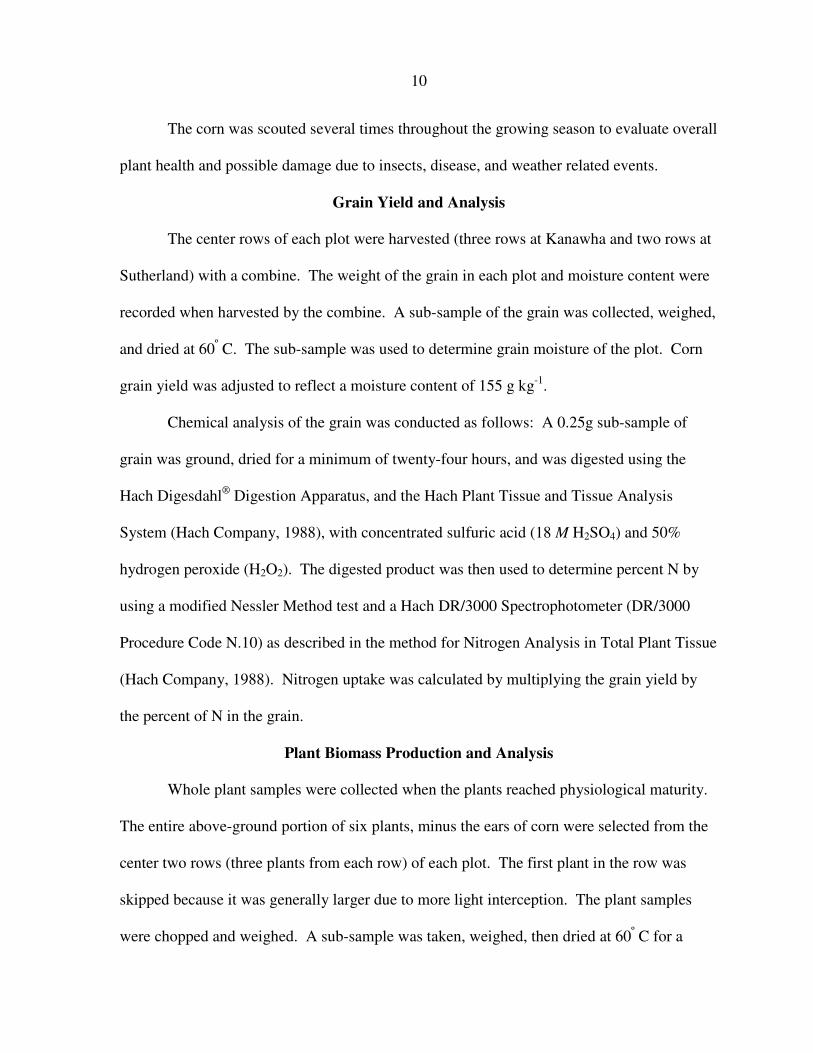
in 2003, 2006, and 2007 but in 2003 (p>F = 0.0885) there was a trend for ESN to yield
higher than urea treatments (Figure 3). In 2005, ESN treatments yielded higher than urea
treatments (p>F = <0.0001) (Table 10). Corn yields over the four site-years were variable
just as at Kanawha. In 2003 and 2006, average corn yields were higher from ESN treatments
compared to urea treatments. The higher average ESN yields could be attributed to the
coating on the ESN, which can help to prevent loss of N due to leaching out of the soil
profile. The interaction between material and N rate was significant in 2005 (p>F = 0.0191)
and 2007 (p>F = 0.0214) (Table 10).

17
Grain N uptake increased with the addition of N in 2003 (p>F = <0.0001), 2006 (p>F
= 0.001), and 2007 (p>F = <0.0001) (Table 10). Nitrogen uptake was not significant in 2005
(p>F = 0.0761) but there was a trend for ESN to have greater N uptake than the urea
treatments (Figure 4). ESN treatments had significantly higher N uptake than urea treatments
in 2005 (p>F = 0.0215) (Table 10). In 2003 and 2006, average N uptake from ESN
treatments was slightly higher than urea treatments. This could be possibly due to the
coating on the ESN.
2005-2007 Soil Analysis
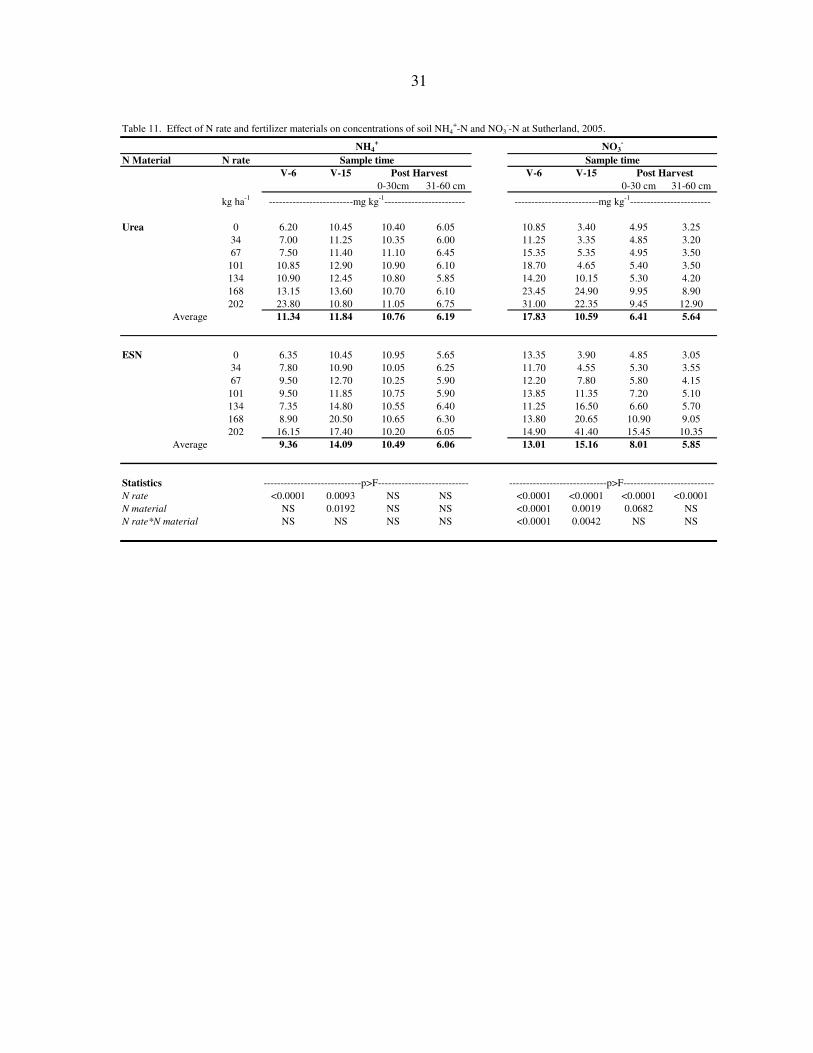
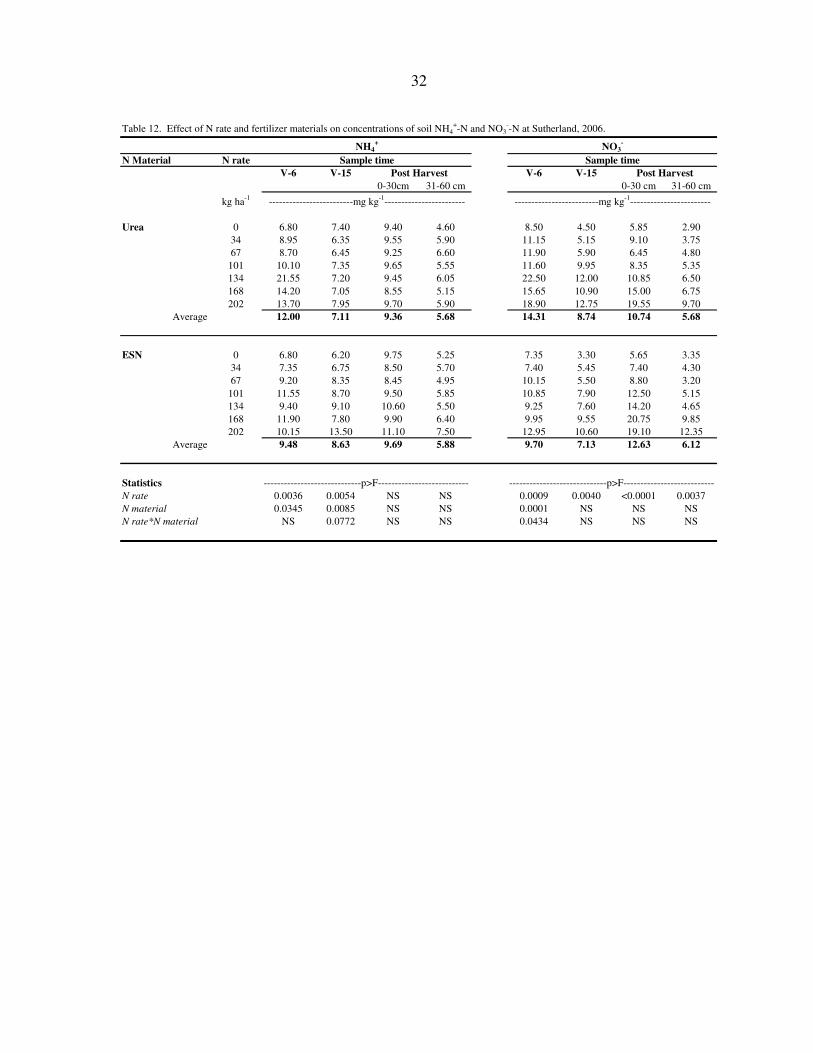
Soil NH4+-N concentrations at the V-6 sampling time increased with N rate each year
of the study (p>F = <0.0001, 0.0036, and 0.0048 respectively) (Tables 11, 12, 13). Soil
NH4+-N concentrations were higher for urea treatments in 2006 and ESN treatments in 2007
(p>F = 0.0345 and <0.0001) (Tables 12, 13). Greater concentrations of NH4+-N from urea
would be expected this early in the growing season.
When soil samples were collected at the V-15 growth stage, soil NH4+-N
concentrations increased with the addition of N during each year of the study (p>F = 0.0093,
0.0054, and <0.0001) (Tables 11, 12, 13). The ESN treatments had higher concentrations of
soil NH4+-N each year of the study (p>F = 0.0192, 0.0085, and <0.0001) (Tables 11, 12, 13).
Post harvest concentrations of NH4+-N at the 0-30 cm depth were not affected by N
rate, but in 2007 ESN treatments had slightly higher soil NH4+-N concentrations (p> F =
0.0759) (Table 13). None of the factors tested in the 31-60 cm depth were affected by N rate
or materials.
Soil NO3--N concentrations increased with N rate in every year of the study (p>F =
<0.0001, 0.0009, and <0.0001) when taken at the V-6 growth stage (Tables 11, 12, 13). The

18
differences in soil NO3--N concentrations between materials were higher for urea treatments
in every year of the study (p>F = <0.0001, 0.0001, and 0.0025) (Tables 11, 12, 13). The
interaction between N rate and material was significant at the V-6 sampling time each year of
the study (p>F = <0.0001, 0.0434, and 0.0058) (Tables 11, 12, 13).
Soil NO3--N concentrations increased as N rates increased at the V-15 sampling time
every year of the study (p>F = <0.0001, 0.0040, and <0.0001) (Tables 11, 12, 13). Using
ESN fertilizer resulted in higher NO3- -N concentrations in 2005 (p>F = 0.0019) (Table 11).
In 2006 and 2007, soil NO3-N concentrations were higher in the urea treatments compared to
ESN treatments. The interaction between N rate and material was significant in 2005 (p>F =
0.0042) (Table 11).
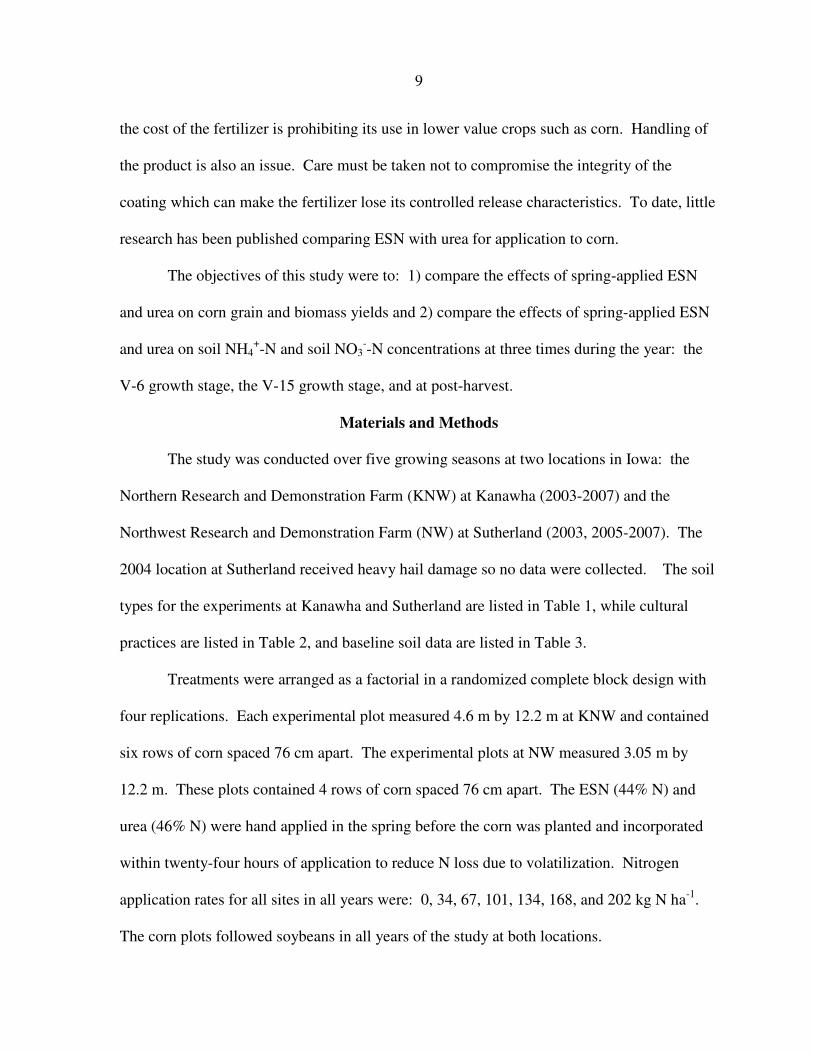
Post harvest soil NO3--N concentrations increased with N rate every year (p>F =
<0.0001) (Tables 11, 12, 13). In 2005, there was a trend for ESN treatments to have higher
concentrations of soil NO3- -N (p>F = 0.0682) (Figure 4) (Table 11), while ESN treatments
had a higher concentration of soil NO3--N than urea treatments (p>F = 0.0003) (Table 13) in
2007. Concentrations of soil NO3- -N at the 31-60 cm depth increased with N rate throughout
the study (p>F = <0.0001, 0.0037, and <0.0001) (Tables 11, 12, 13). In 2007, concentrations
of NO3- -N were higher in ESN treatments than urea treatments (p>F = <0.0001) (Table 13).
The interaction between material and N rate was significant in 2007 (p>F = 0.0286) (Table
13).
Summary and Conclusions
The addition of fertilizer N increased biomass yields at four of nine site-years.
Biomass yields were not affected by material at any of the site-years. When looking at corn
yields, the results obtained from these field studies conducted for spring-applied ESN and

19
urea only show a clear statistical advantage for using ESN at one of the nine site-years.
However, three of the nine site-years showed a trend in which ESN treatments out-yielded
urea treatments. Grain yields were affected by N rates every site-year. N uptake for biomass
and corn grain was not generally affected by fertilizer material.
Soil NH4+-N concentrations were usually higher for ESN treatments compared to urea
at the V-6 and V-15 sampling times. While this was not expected because of the time release
properties of the ESN, we can speculate that the ESN was still releasing N while NH4+-N in
the urea treatments had probably already converted to nitrate. Post harvest soil samples were
generally higher in both nitrate and ammonium from the ESN treatments. It is reasonable to
assume that a good portion of this residual N was lost over winter.
There were large differences among the years and locations in the study when
comparing biomass yield, corn grain, yield and N uptake in the biomass and grain. There
could be many reasons for the large amount of variability in biomass and grain yields such as
adverse weather conditions that can favor denitrification and leaching or possibly inhibit the
release of N from the ESN granules. Soil conditions throughout the studies could have also
been a factor in the inconsistent yields. Conditions that favor N loss could have existed in
various years throughout this study.
We did not observe any negative yield responses from the use of ESN; however ESN
did not consistently result in higher corn grain and biomass yields. The data suggest that
slightly higher concentrations of NO3--N and NH4
+-N from ESN treatments were left behind
in the soil after the corn was harvested. These residual amounts of N could have negative
consequences to crop producers due to the fact that nitrate is easily lost from the soil profile
if leaching occurs.
20
We believe that this product has the potential to increase corn grain yields in certain
situations while preventing N loss (sandy soils, high rainfall locations, etc). Currently the
cost of this product and the unpredictability of positive yield responses for ESN make it
difficult to recommend ESN to producers as an alternative fertilizer to urea in Iowa.
References
Allen, S.E. 1984. Slow-release nitrogen fertilizers. p. 195-206. In R.D. Hauck (ed.) Nitrogen
in crop production, ASA, CSSA, SSSA, Madison, WI.
Gonzalez, M. 2005. Effect of slow release nitrogen fertilizers on corn production in Iowa.
Unpublished MS thesis, Iowa State University, Ames, IA.
Hauck, R.D. 1985. Slow-release and bioinhibitor-amended nitrogen fertilizers. p. 294-319. In
O.P. Engelstad (ed.) Fertilizer technology and use, 3rd
ed. SSSA, Madison, WI.
Lachat Instruments. 1992. QuickChem method 12-107-04-1-B: nitrate (salicylate) in 2 M
KCl soil extracts. Lachat Instruments, Milwaukee, WI.
Lachat Instruments. 1993. QuickChem method 12-107-06-2-A: ammonia (salicylate) in 2 M
KCl soil extracts. Lachat Instruments, Milwaukee, WI.
Kissel, D.E. 1988. Management of urea fertilizers. North Central Regional Extension Publ.
326. Kansas State University, Manhattan, KS.
Trenkel, M.E. 1997. Improving fertilizer use efficiency. Controlled-release stabilized
Fertilizers in Agriculture. FAO and IFA, Paris. Pp. 7-27.
Wang, F.L., and A.K. Alva. 1996. Leaching of nitrogen from slow-release urea sources in
sandy soils. Soil Sci. Soc. Am. J. 60:1454–1458.

21
Figure 4. Relationship between N rate and post harvest
soil NO3
--N concentrations at Sutherland, 2005.
N Rate (kg ha-1
)
0 34 67 101 134 168 202
Soil
NO
3
- -N c
once
ntr
atio
n (
soil
ppm
)
4
6
8
10
12
14
16
Urea
ESN
Figure 3. Relationship between N rate and corn grain yield
at Sutherland, 2003.
N Rate (kg ha-1
)
0 34 67 101 134 168 202
Corn
Gra
in Y
ield
(M
g h
a-1)
4.0
4.5
5.0
5.5
6.0
6.5
7.0
7.5
Urea
ESN
Figure 1. Relationship between N rate and corn grain yield
at Kanawha, 2004.
N rate (kg ha-1
)
0 34 67 101 134 168 202
Corn
Gra
in Y
ield
(M
g h
a-1)
8
9
10
11
12
13
14
15
Urea
ESN
Figure 2. Relationship between N rate and corn grain yield
at Kanawha, 2005.
N Rate (kg ha-1
)
0 34 67 101 134 168 202
Corn
Gra
in y
ield
(M
g h
a-1)
8
9
10
11
12
13
14
15
Urea
ESN

22
Table 1. Soil types for all years in the spring-applied ESN/urea studies at Kanawha and Sutherland.
Site Year Soil type
Kanawha 2003 Nicollet Fine-loamy, mixed, superactive, mesic Aquic Hapludoll
Canisteo Fine-loamy, mixed, superactive, calcareous, mesic Typic Endoaquoll
2004 Clarion Fine-loamy, mixed, superactive, mesic Typic Hapludoll
2005 Webster Fine-loamy, mixed, superactive, mesic Typic Endoaquall
Clarion Fine-loamy, mixed, superactive, mesic Typic Hapludoll
2006 Nicollet Fine-loamy, mixed, superactive, mesic Aquic Hapludoll
Canisteo Fine-loamy, mixed, superactive, calcareous, mesic Typic Endoaquoll
2007 Webster Fine-loamy, mixed, superactive, mesic Typic Endoaquoll
Clarion Fine-loamy, mixed, superactive, mesic Typic Hapludoll
Sutherland 2003-2007 Primghar Fine-silty, mixed, superactive, mesic Aquic Hapludoll
Marcus Fine-silty, mixed, superactive, mesic Typic Endoaquoll
Soil series description
Table 2. Cultural practices for all locations and years in the spring-applied
ESN/urea studies at Kanawha and Sutherland.
Site / Planting Hybrid Population Harvest
Year date seeds/ha date
2003
Kanawha April 26 DeKalb 53-32 Bt 74,133 October 18
Sutherland May 7 DeKalb 46-28 75,368 October 16
2004
Kanawha April 28 DeKalb 53-32 Bt 79,040 October 16
2005
Kanawha April 30 DeKalb 53-32 Bt 74,100 October 15
Sutherland May 4 FC 7515R 79,040 October 19
2006
Kanawha May 22 DeKalb 53-32 Bt 81,510 October 24
Sutherland May 12 Pioneer 35Y61 79,040 October 24
2007
Kanawha May 10 Pioneer 36W69 81,510 October 6
Sutherland May 2 Kruger 8602 HX 79,040 October 11
23
Table 3. Soil chemical properties at the 0-15 cm depth at Kanawha and Sutherland, 2003-2007.
Location Year OMa
pHb
Pc
Kd
g kg-1
Kanawha 2003 49 6.2 21 109
Kanawha 2004 61 5.6 50 191
Kanawha 2005 57 5.8 44 145
Kanawha 2006 51 5.6 34 227
Kanawha 2007 53 5.9 32 255
Sutherland 2003 47 6.3 12 132
Sutherland 2005 46 6.5 11 161
Sutherland 2006 46 6.3 15 168
Sutherland 2007 47 6.3 12 155
a organic matter
b 1:1 H2O
c Bray P-1
d Ammonium Acetate
----------------mg kg-1
---------------

24
Table 4. Corn biomass response to spring-applied urea fertilizers at Kanawha, 2003-2007.
N Material N rate Yield a
N uptake a
Yield a
N uptake a
Yield a
N uptake a
Yield a
N uptake a
Yield a
N uptake a
kg ha-1
Mg ha-1
kg ha-1
Mg ha-1
kg ha-1
Mg ha-1
kg ha-1
Mg ha-1
kg ha-1
Mg ha-1
kg ha-1
Urea 0 7.10 38 3.42 18 7.53 30 8.98 49 8.60 34
34 7.04 38 3.90 20 8.05 41 8.40 49 7.81 29
67 9.07 59 4.09 21 7.80 41 10.05 65 10.26 48
101 6.80 39 3.32 15 9.48 50 9.28 60 9.75 43
134 7.84 60 4.00 22 9.30 56 10.30 76 9.69 46
168 9.02 79 4.61 27 9.95 46 11.60 79 9.60 49
202 8.92 71 4.59 31 10.30 58 11.08 86 11.06 73
Average 7.97 55 3.99 22 8.92 46 9.96 66 9.54 46
ESN 0 6.98 40 3.50 16 7.28 27 9.81 56 7.52 32
34 7.89 52 3.91 20 8.85 49 10.05 56 7.87 32
67 8.49 62 4.08 19 8.75 51 8.83 54 9.55 40
101 8.10 49 4.51 27 9.08 49 9.03 53 11.21 60
134 7.01 49 5.65 33 9.23 60 9.83 69 9.94 50
168 7.46 61 4.48 23 9.00 61 8.90 59 9.61 52
202 8.10 79 4.86 27 9.93 78 10.45 79 11.67 92
Average 7.72 56 4.43 24 8.87 54 9.56 61 9.62 51
Statistics
N rate NS <0.0001 NS NS 0.0003 <0.0001 NS 0.0005 0.0001 0.0005
Material NS NS NS NS NS 0.0050 NS NS NS NS
N rate*Material NS NS NS NS NS NS 0.0325 NS NS NS
a dry weight
-----------------------------------------------------------------------------------------------p > F-----------------------------------------------------------------------------------------------
20072003 2004 2005 2006

25
Table 5. Corn grain response to spring applied urea and ESN fertilizers at Kanawha, 2003-2007.
N Material N Rate Yield a
N uptake b
Yield a
N uptake b
Yield a
N uptake b
Yield a
N uptake b
Yield a
N uptake b
kg ha-1
Mg ha-1
kg ha-1
Mg ha-1
kg ha-1
Mg ha-1
kg ha-1
Mg ha-1
kg ha-1
Mg ha-1
kg ha-1
Urea 0 7.15 55 9.32 89 8.69 87 9.07 92 6.70 62
34 8.85 72 9.10 87 10.59 100 10.91 105 7.88 73
67 10.85 96 10.25 99 12.62 130 11.54 128 10.12 104
101 10.77 98 11.23 117 13.82 154 11.86 122 10.85 115
134 11.60 107 12.51 125 13.07 136 12.69 133 12.11 124
168 10.98 106 12.44 143 12.80 140 13.25 141 12.15 134
202 11.29 112 13.37 146 13.25 143 13.01 143 12.18 139
Average 10.21 92 11.17 115 12.12 127 11.76 123 10.28 107
ESN 0 6.99 52 8.83 84 9.57 96 8.44 85 6.24 58
34 9.33 74 9.85 90 11.48 121 10.59 108 8.86 88
67 10.57 90 11.15 112 12.69 136 11.80 124 10.07 99
101 11.46 101 11.41 117 14.33 154 12.62 126 11.20 114
134 10.96 102 12.99 136 13.57 151 13.12 145 12.08 123
168 10.98 108 13.79 157 13.01 151 12.62 135 11.86 122
202 10.59 108 13.41 151 13.63 154 12.69 128 12.08 128
Average 10.13 91 11.63 121 12.61 138 11.70 122 10.34 105
Statistics
N rate <0.0001 <0.0001 <0.0001 <0.0001 <0.0001 <0.0001 <0.0001 NS <0.0001 <0.0001
Material NS NS 0.0646 NS 0.0671 0.0066 NS NS NS NS
N rate*Material NS NS NS NS NS NS NS NS NS NS
a 155 g kg
-1
b dry weight
2007
------------------------------------------------------------------------------------p>F-----------------------------------------------------------------------------------
2003 2004 2005 2006

26
Table 6. Effect of N rate and fertilizer materials on concentrations of soil NH4
+-N and NO3
--N at Kanawha, 2005.
N Material N rate
V-6 V-15 V-6 V-15
0-30 cm 31-60 cm 0-30 cm 31-60 cm
kg ha-1
Urea 0 7.65 4.00 8.00 4.60 5.50 1.85 5.55 2.05
34 7.50 3.80 9.50 4.25 8.35 1.75 5.05 2.20
67 7.35 3.90 8.50 4.65 18.55 2.20 4.85 2.05
101 8.90 4.15 9.65 4.75 12.45 2.85 5.15 2.40
134 7.40 4.65 8.25 4.70 15.85 4.25 5.70 2.70
168 7.50 4.00 8.50 4.95 21.55 2.55 4.95 2.45
202 7.90 4.20 9.15 4.75 18.25 2.35 4.85 2.35
Average 7.74 4.10 8.79 4.66 14.36 2.54 5.16 2.31
ESN 0 7.15 3.90 8.70 4.70 4.95 1.65 4.90 1.85
34 8.75 3.70 9.05 4.85 7.90 3.90 5.20 2.35
67 13.25 4.00 8.20 4.25 9.15 2.30 5.30 2.15
101 9.05 4.20 8.65 4.45 9.25 3.65 5.10 2.45
134 15.90 5.70 9.15 4.25 10.45 8.95 6.75 3.35
168 13.25 6.70 9.05 4.45 15.15 10.20 5.75 5.50
202 14.25 4.45 9.00 5.00 10.50 11.25 6.70 5.15
Average 11.66 4.66 8.83 4.56 9.62 5.99 5.67 3.26
Statistics
N rate NS 0.0017 NS NS 0.0001 0.0025 NS 0.0007
N material 0.0007 0.0172 NS NS 0.0008 0.0001 NS 0.0014
N rate*N material NS 0.0194 NS NS NS 0.0202 NS 0.0060
-----------------------------p>F--------------------------- -----------------------------p>F---------------------------
NO3-
NH4+
Sample time
-------------------------mg kg-1
---------------------------------------------------mg kg-1
------------------------
Sample time
Post Harvest Post Harvest

27
Table 7. Effect of N rate and fertilizer materials on concentrations of soil NH4+-N and NO3
--N at Kanawha, 2006.
N Material N rate
V-6 V-15 V-6 V-15
0-30cm 31-60 cm 0-30 cm 31-60 cm
kg ha-1
Urea 0 7.10 5.85 7.35 3.65 9.45 3.10 6.70 3.10
34 9.05 5.95 7.65 5.00 14.20 4.00 6.55 6.55
67 8.15 5.65 6.95 3.80 19.20 4.25 7.75 5.35
101 9.55 5.95 7.95 2.90 24.70 8.30 9.10 3.90
134 9.40 6.20 8.15 3.00 31.95 6.90 7.25 5.40
168 8.65 9.10 7.80 3.80 31.85 10.30 8.70 5.85
202 10.25 7.75 8.20 3.65 29.85 10.50 13.75 8.15
Average 8.88 6.64 7.72 3.69 23.03 6.76 8.54 5.47
ESN 0 7.60 6.35 6.75 5.30 8.95 3.05 7.10 5.75
34 7.25 5.45 7.35 5.95 9.35 3.20 6.95 8.85
67 11.85 7.35 8.00 2.70 14.35 6.50 8.65 3.25
101 8.85 8.70 8.15 3.50 15.20 5.40 8.75 5.45
134 9.35 6.65 7.60 3.65 12.55 9.10 10.55 7.90
168 8.75 7.40 7.40 3.65 12.95 8.15 11.75 9.55
202 15.85 8.35 7.30 3.75 22.45 8.35 14.30 10.05
Average 9.93 7.18 7.51 4.07 13.69 6.25 9.72 7.26
Statistics
N rate NS NS NS NS <0.0001 0.0052 <0.0001 NS
N material NS NS NS NS <0.0001 NS NS NS
N rate*N material NS NS NS NS 0.0068 NS NS NS
-----------------------------p>F--------------------------- -----------------------------p>F---------------------------
NO3-
NH4+
Sample time
-------------------------mg kg-1
------------------------
Sample time
-------------------------mg kg-1
------------------------
Post Harvest Post Harvest
28
Table 8. Effect of N rate and fertilizer materials on concentrations of soil NH4+-N and NO3
--N at Kanawha, 2007.
N Material N rate
V-6 V-15 V-6 V-15
0-30cm 31-60 cm 0-30 cm 31-60 cm
kg ha-1
Urea 0 6.25 4.60 7.30 3.99 5.90 2.25 3.64 1.28
34 7.45 5.60 7.86 3.33 11.00 2.75 3.50 1.32
67 8.55 5.45 7.96 3.56 17.85 3.35 3.28 1.21
101 7.00 4.85 7.99 4.25 19.70 3.95 3.57 1.40
134 8.50 5.25 8.01 4.03 21.65 4.45 3.34 1.76
168 10.55 6.75 8.09 3.79 24.35 11.85 3.21 1.38
202 9.95 6.25 8.74 4.27 28.20 6.90 4.84 2.54
Average 8.32 5.54 7.99 3.89 18.38 5.07 3.63 1.56
ESN 0 6.60 6.35 7.81 3.36 5.95 3.30 3.23 1.24
34 8.95 5.50 8.61 3.36 7.55 2.90 3.04 1.20
67 6.85 6.95 8.00 4.39 8.00 4.10 3.56 1.53
101 10.60 5.80 8.35 3.93 11.25 5.35 3.39 1.41
134 10.25 6.25 8.96 4.53 17.70 7.35 3.76 1.82
168 8.00 6.30 8.18 3.78 13.40 5.25 4.54 2.58
202 10.75 10.90 8.54 3.99 11.65 10.30 4.72 2.65
Average 8.86 6.86 8.35 3.91 10.79 5.51 3.75 1.78
Statistics
N rate NS 0.0516 NS 0.0636 <0.0001 <0.0001 NS 0.0009
N material NS 0.0224 NS NS <0.0001 NS NS NS
N rate*N material NS NS NS NS 0.0475 0.0043 NS NS
-----------------------------p>F--------------------------- -----------------------------p>F---------------------------
Post Harvest Post Harvest
-------------------------mg kg-1
------------------------ -------------------------mg kg-1
------------------------
NH4+
NO3-
Sample time Sample time

29
Table 9. Corn biomass response to spring-applied urea fertilizers at Sutherland, 2003, 2005-2007.
N Material N rate Yield a
N uptake a
Yield a
N uptake a
Yield a
N uptake a
Yield a
N uptake a
kg ha-1
Mg ha-1
kg ha-1
Mg ha-1
kg ha-1
Mg ha-1
kg ha-1
Mg ha-1
kg ha-1
Urea 0 4.72 33 7.43 47 6.48 32 7.94 36
34 4.35 25 7.83 50 6.90 39 7.86 36
67 4.74 28 8.68 64 5.85 37 9.04 50
101 4.68 25 7.55 55 7.93 50 9.02 50
134 4.69 32 7.85 52 6.70 36 9.18 51
168 5.29 38 9.03 79 8.20 57 9.35 68
202 5.84 45 9.20 75 7.90 47 9.70 61
Average 4.90 32 8.22 60 7.14 43 8.87 50
ESN 0 4.36 24 7.45 48 6.03 25 7.00 32
34 4.85 28 6.85 44 6.45 39 8.41 48
67 5.37 32 9.03 67 6.45 33 7.93 49
101 4.51 25 8.78 62 7.65 54 8.75 48
134 5.09 29 9.23 74 7.55 51 8.46 49
168 4.90 38 8.03 66 7.08 42 9.28 57
202 5.36 35 8.25 64 7.43 50 9.37 63
Average 4.92 30 8.23 61 6.95 42 8.46 49
Statistics
N rate NS 0.0053 NS 0.0001 0.0343 NS 0.0066 <0.0001
Material NS NS NS NS NS NS NS NS
N rate*Material NS NS NS NS NS NS NS NS
a dry weight
-------------------------------------------------------------------------p>F--------------------------------------------------------------------------
2003 2005 2006 2007

30
Table 10. Corn grain response to spring applied urea and ESN fertilizers at Sutherland, 2003, 2005-2007.
N Material N rate Yield a
N uptake b
Yield a
N uptake b
Yield a
N uptake b
Yield a
N uptake b
kg ha-1
Mg ha-1
kg ha-1
Mg ha-1
kg ha-1
Mg ha-1
kg ha-1
Mg ha-1
kg ha-1
Urea 0 4.60 38 9.76 91 11.03 107 6.37 60
34 5.55 45 11.48 105 10.59 104 7.37 68
67 5.99 49 11.35 103 11.86 112 8.93 87
101 6.11 53 10.65 96 12.43 123 9.99 105
134 6.87 60 11.48 106 12.43 121 10.85 109
168 6.80 65 12.12 114 13.12 137 10.54 121
202 6.84 68 11.99 121 13.69 140 9.76 123
Average 6.11 54 11.26 105 12.16 121 9.12 96
ESN 0 4.94 38 11.67 108 10.21 93 6.21 56
34 5.77 46 11.80 109 9.95 90 7.85 81
67 5.98 50 11.42 109 11.61 116 8.17 84
101 6.69 58 12.31 119 12.93 131 9.88 99
134 6.98 63 12.62 124 13.07 135 9.93 101
168 6.87 64 12.62 135 13.82 144 9.57 99
202 6.74 65 12.31 123 14.97 160 10.66 116
Average 6.28 55 12.10 118 12.37 124 8.90 91
Statistics
N rate <0.0001 <0.0001 <0.0001 0.0761 <0.0001 0.001 <0.0001 <0.0001
Material 0.0885 NS <0.0001 0.0215 NS NS NS NS
N rate*Material NS NS 0.0191 NS NS NS 0.0214 0.0619
a 155 g kg
-1
b dry weight
-----------------------------------------------------------------------------p>F----------------------------------------------------------------------------
2003 2005 2006 2007
31
Table 11. Effect of N rate and fertilizer materials on concentrations of soil NH4+-N and NO3
--N at Sutherland, 2005.
N Material N rate
V-6 V-15 V-6 V-15
0-30cm 31-60 cm 0-30 cm 31-60 cm
kg ha-1
Urea 0 6.20 10.45 10.40 6.05 10.85 3.40 4.95 3.25
34 7.00 11.25 10.35 6.00 11.25 3.35 4.85 3.20
67 7.50 11.40 11.10 6.45 15.35 5.35 4.95 3.50
101 10.85 12.90 10.90 6.10 18.70 4.65 5.40 3.50
134 10.90 12.45 10.80 5.85 14.20 10.15 5.30 4.20
168 13.15 13.60 10.70 6.10 23.45 24.90 9.95 8.90
202 23.80 10.80 11.05 6.75 31.00 22.35 9.45 12.90
Average 11.34 11.84 10.76 6.19 17.83 10.59 6.41 5.64
ESN 0 6.35 10.45 10.95 5.65 13.35 3.90 4.85 3.05
34 7.80 10.90 10.05 6.25 11.70 4.55 5.30 3.55
67 9.50 12.70 10.25 5.90 12.20 7.80 5.80 4.15
101 9.50 11.85 10.75 5.90 13.85 11.35 7.20 5.10
134 7.35 14.80 10.55 6.40 11.25 16.50 6.60 5.70
168 8.90 20.50 10.65 6.30 13.80 20.65 10.90 9.05
202 16.15 17.40 10.20 6.05 14.90 41.40 15.45 10.35
Average 9.36 14.09 10.49 6.06 13.01 15.16 8.01 5.85
Statistics
N rate <0.0001 0.0093 NS NS <0.0001 <0.0001 <0.0001 <0.0001
N material NS 0.0192 NS NS <0.0001 0.0019 0.0682 NS
N rate*N material NS NS NS NS <0.0001 0.0042 NS NS
-----------------------------p>F--------------------------- -----------------------------p>F---------------------------
Post Harvest Post Harvest
-------------------------mg kg-1
------------------------ -------------------------mg kg-1
------------------------
NH4+
NO3-
Sample time Sample time
32
Table 12. Effect of N rate and fertilizer materials on concentrations of soil NH4+-N and NO3
--N at Sutherland, 2006.
N Material N rate
V-6 V-15 V-6 V-15
0-30cm 31-60 cm 0-30 cm 31-60 cm
kg ha-1
Urea 0 6.80 7.40 9.40 4.60 8.50 4.50 5.85 2.90
34 8.95 6.35 9.55 5.90 11.15 5.15 9.10 3.75
67 8.70 6.45 9.25 6.60 11.90 5.90 6.45 4.80
101 10.10 7.35 9.65 5.55 11.60 9.95 8.35 5.35
134 21.55 7.20 9.45 6.05 22.50 12.00 10.85 6.50
168 14.20 7.05 8.55 5.15 15.65 10.90 15.00 6.75
202 13.70 7.95 9.70 5.90 18.90 12.75 19.55 9.70
Average 12.00 7.11 9.36 5.68 14.31 8.74 10.74 5.68
ESN 0 6.80 6.20 9.75 5.25 7.35 3.30 5.65 3.35
34 7.35 6.75 8.50 5.70 7.40 5.45 7.40 4.30
67 9.20 8.35 8.45 4.95 10.15 5.50 8.80 3.20
101 11.55 8.70 9.50 5.85 10.85 7.90 12.50 5.15
134 9.40 9.10 10.60 5.50 9.25 7.60 14.20 4.65
168 11.90 7.80 9.90 6.40 9.95 9.55 20.75 9.85
202 10.15 13.50 11.10 7.50 12.95 10.60 19.10 12.35
Average 9.48 8.63 9.69 5.88 9.70 7.13 12.63 6.12
Statistics
N rate 0.0036 0.0054 NS NS 0.0009 0.0040 <0.0001 0.0037
N material 0.0345 0.0085 NS NS 0.0001 NS NS NS
N rate*N material NS 0.0772 NS NS 0.0434 NS NS NS
-----------------------------p>F--------------------------- -----------------------------p>F---------------------------
Post Harvest Post Harvest
-------------------------mg kg-1
------------------------ -------------------------mg kg-1
------------------------
NH4+
NO3-
Sample time Sample time

33
Table 13. Effect of N rate and fertilizer materials on concentrations of soil NH4+-N and NO3
--N at Sutherland, 2007.
N Material N rate
V-6 V-15 V-6 V-15
0-30cm 31-60 cm 0-30 cm 31-60 cm
kg ha-1
Urea 0 8.35 9.30 9.40 5.05 7.00 3.40 3.75 1.73
34 8.65 9.00 9.26 4.53 10.70 4.80 3.47 1.94
67 8.90 9.65 10.10 4.93 16.05 6.40 3.50 2.13
101 9.45 10.10 9.13 4.56 22.55 14.10 4.23 2.14
134 8.95 9.85 10.21 4.90 21.50 16.95 4.04 2.87
168 9.35 10.10 9.45 4.90 23.80 12.80 5.67 2.90
202 11.35 11.95 10.90 5.36 38.35 25.60 6.53 5.19
Average 9.29 9.99 9.78 4.89 19.99 12.01 4.46 2.70
ESN 0 9.90 9.10 9.31 5.12 6.75 3.00 3.42 2.03
34 11.00 10.20 9.93 4.59 12.05 5.55 4.40 2.37
67 12.10 11.45 9.78 4.87 13.75 7.45 4.46 2.30
101 11.70 11.45 9.20 5.24 19.05 11.90 4.33 3.18
134 13.65 11.20 9.75 4.78 23.75 9.90 7.76 5.53
168 9.95 12.40 10.95 5.21 15.75 13.95 8.39 6.11
202 15.75 15.05 10.20 4.72 26.80 18.60 7.61 6.44
Average 12.01 11.55 9.87 4.93 16.84 10.05 5.77 3.99
Statistics
N rate 0.0048 <0.0001 0.0759 NS <0.0001 <0.0001 <0.0001 <0.0001
N material <0.0001 <0.0001 NS NS 0.0025 NS 0.0003 <0.0001
N rate*N material NS NS NS NS 0.0058 NS 0.0316 0.0286
-----------------------------p>F--------------------------- -----------------------------p>F---------------------------
Post Harvest Post Harvest
-------------------------mg kg-1
------------------------ -------------------------mg kg-1
------------------------
NH4+
NO3-
Sample time Sample time

34
Comparison of ESN and aqua ammonia applied in the fall and spring as sources of
nitrogen for corn production in Iowa
A paper to be submitted to Communications in Soil Science and Plant Analysis
J.A. Moorea and R. Killorn
a
aIowa State University, Ames, IA
Abstract
Controlled release nitrogen (N) fertilizers are an alternative to using conventional N
fertilizers in corn production. A two-year field study was conducted in 2006 and 2007 at two
locations in Iowa to evaluate the effect of a controlled release N fertilizer, ESN, and aqua
ammonia on corn grain and biomass yields, N uptake, and soil N concentrations. Fertilizer
rates from 0 to 202 kg N ha-1
in 67 kg N ha -1
increments were applied in the fall and spring.
The addition of fertilizer N increased biomass yields and biomass N uptake at all four site-
years. Biomass yields were statistically higher from the use of spring-applied ESN at one of
the four site-years. Corn grain yields increased with the addition of fertilizer N at all four
site-years while corn grain N uptake increased at three of four site-years from the addition of
fertilizer N. In regards to corn grain yields, one of four site years showed a clear statistical
advantage supporting the application of ESN in the spring. Soil nitrate-N and ammonium-N
concentrations were usually higher for fall or spring-applied ESN treatments compared to
aqua ammonia treatments at all of the sampling times. These soil results are of concern
because the residual N that is left behind after crop harvest is easily leached overwinter if
field conditions are wet. We did not observe any negative yield responses from the use of
ESN at any year or location during the study.

35
Introduction
The use of fertilizer nitrogen (N) is a common practice in Iowa to improve corn grain
yields. Anhydrous ammonia is the most widely used form of nitrogen (N) in the Corn Belt
and is usually applied to fields in the fall for corn to be planted the following spring
(Kyveryga et al., 2004). Reasons for fall application compared to spring include lower cost of
N, more time for fieldwork compared to the spring, and field conditions are usually better
suited for application (Randall and Sawyer, 2005). Fall-applied N can be subject to loss over
the winter and spring, before planting, primarily from denitrification if soil conditions are
less than ideal (Nyborg, et al., 1997). Nitrogen should be applied near the time when it is
needed by the crop. Bundy (1986) concluded that fall application of N is acceptable on fine
and medium textured soils where winter temperatures will retard nitrification. However,
when N is applied under these conditions, yields are generally 10 to 15% less than spring-
applied N.
Crop producers are always looking for new ways to increase yields while keeping
input costs at a minimum. ESN is a controlled-release N fertilizer (44% N), developed by
Agrium, Inc., that has the potential to reduce loss of N from the soil while increasing plant
uptake of N. After ESN is applied and comes in contact with soil moisture, water is absorbed
through the coating and turns the urea granule into a liquid. The liquid urea then diffuses out
through the coating over the growing season. Release of the N is regulated by temperature
with higher temperatures leading to increased diffusion rates. Currently, because of higher
costs associated with controlled release N fertilizers, their use is mainly restricted to high-
value crops such as produce and turf grass (Hauck, 1985). If the cost of these fertilizers can
be reduced, or if their use can show greater yields compared to conventional N fertilizers in
36
crops such as corn, the demand for these fertilizers is likely to increase. To date, little
research has been published comparing ESN on corn grain yields.
The objectives of this study were to: 1) compare the effects of ESN and aqua
ammonia applied in the fall and spring on corn grain and biomass yields and 2) compare soil
NH4+-N and soil NO3
--N concentrations at three times during the year, the V-6 growth stage,
the V-15 growth stage, and at post-harvest.
Materials and Methods
This experiment was conducted over two growing seasons (2006-2007) at two
locations in Iowa: the Northern Research and Demonstration Farm at Kanawha and the
Curtiss Farm at Ames. The soil types for the experiments at Kanawha and Ames are listed in
Table 1, the cultural practices are listed in Table 2, and baseline soil data are listed in Table
3.
Treatments were arranged as a factorial in a randomized complete block design with
four replications. Each experimental plot measured 4.6 m by 12.2 m at Kanawha and Ames
and contained six rows of corn spaced 76 cm apart. A set of ESN (44% N) and aqua
ammonia (AA) (20% N) treatments were applied each fall and incorporated. Another set of
treatments were applied in the spring before planting. These treatments were also
incorporated within twenty-four hours. The ESN was applied by hand and the aqua ammonia
was injected into the soil using a three row applicator. Aqua ammonia was used in this study
because it is more easily handled and more accurately applied than anhydrous ammonia.
Nitrogen application rates for all sites in all years were: 0, 67, 134, and 202 kg N ha-1
. The
corn plots at Kanawha followed soybeans each year, while the plots in Ames were
continuous corn.

37
The plots were scouted several times throughout the growing season to check for
overall plant health and damage due to insects, disease, nutrient deficiencies, and weather
related events.
Grain Yield and Analysis
The center rows of each plot were harvested (three rows at Kanawha and two rows at
Ames) with a combine at Kanawha and by hand at Ames. The weight of the grain in each
plot and moisture content were recorded when harvested by the combine at Kanawha. At
Ames, after the corn was harvested it was shelled and the weight was recorded. Corn grain
yield was adjusted to reflect a moisture content of 155 g kg-1
. A sub-sample of the grain was
collected, weighed, and dried at 60º C. The sub-sample was used to determine grain moisture
of the plot.
Chemical analysis of the grain was conducted as follows: A 0.25g sub-sample of
grain was ground, dried for a minimum of twenty-four hours, and was digested using the
Hach Digesdahl® Digestion Apparatus, and the Hach Plant Tissue and Tissue Analysis
System (Hach Company, 1988), with concentrated sulfuric acid (18 M H2SO4) and 50%
hydrogen peroxide (H2O2). The digested product was then used to determine percent N by
using a modified Nessler Method test and a Hach DR/3000 Spectrophotometer (DR/3000
Procedure Code N.10) as described in the method for Nitrogen Analysis in Total Plant Tissue
(Hach Company, 1988).
Plant Biomass Production and Analysis
Whole plant samples were collected when the plants reached physiological maturity.
The entire above-ground portion of six plants, minus the ears of corn were selected from the
center two rows (three plants from each row) of each plot. The first plant in the row was

38
skipped because it was generally larger due to more light and nutrient interception. The plant
samples were chopped and weighed. A sub-sample was taken, weighed, then dried at 60º C
for a minimum of forty-eight hours, weighed again and ground. The dry weight of the sub-
sample was used to determine total above ground biomass produced per hectare.
Soil Sampling and Analysis
Soil samples were collected three times a year at each site. The timing of the samples
was at the V-6 growth stage, the V-15 growth stage, and after harvest was completed. Three
cores were randomly taken to a depth of 30 cm between the center two rows of the plot and
combined to form the sample. The post harvest sample contained samples collected from a
depth of 31-60 cm.
The soil samples were dried at 60º C for a minimum of twenty-four hours and ground
to pass through a 2 mm sieve. A 10 g sub-sample was weighed and extracted with 50 ml of 2
M KCl solution. The extract was filtered and analyzed for nitrate-N (NO3--N) and
ammonium-N (NH4+-N) using a QuikChem 8000 Automated Ion Analyzer by the QuikChem
Method 12-107-04-1-B (Lachat Instruments, 1992) for the NO3--N and QuikChem Method
12-107-06-2-A (Lachat Instruments, 1993) for NH4+-N.
Data Analysis
Statistix 8 (Analytical Software, 2003) was used to analyze the data. The analyses for
each combination of site and year were done separately. Nitrate-N and NH4+-N
concentrations for all soil sampling times were also analyzed separately. Differences at the
p>F = 0.05 level or less were considered significant. Outliers in all of the data, except for
corn yield, were identified by using residual graphs and were determined to be non-
representative if they were greater than three standard deviations from the experiment mean.
39
Results and Discussion
Ames Location
Biomass Production
Biomass yields increased significantly with N rate both years of the study (p>F =
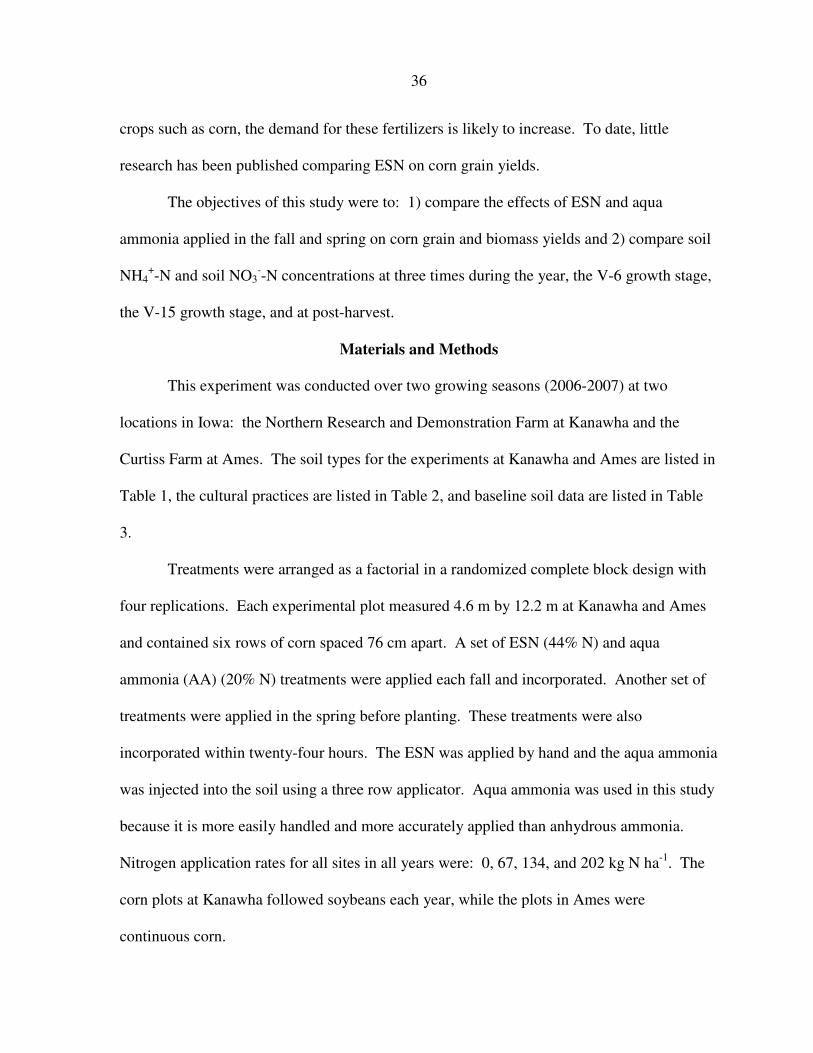
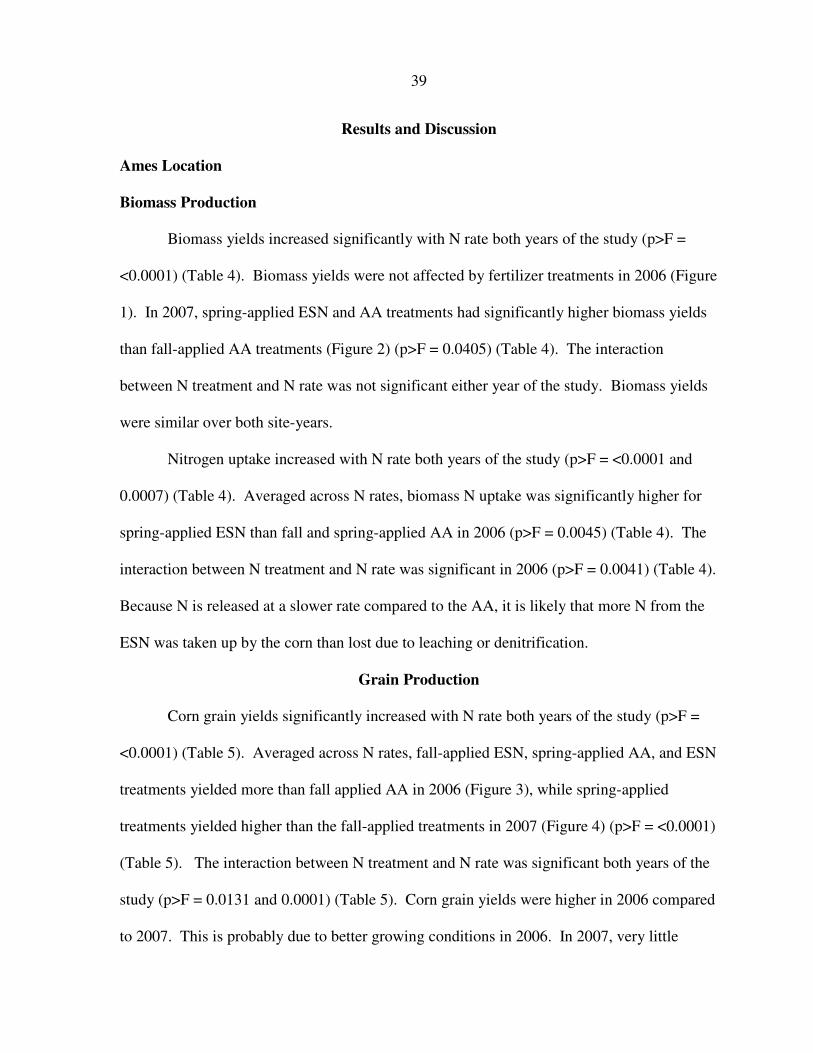
<0.0001) (Table 4). Biomass yields were not affected by fertilizer treatments in 2006 (Figure
1). In 2007, spring-applied ESN and AA treatments had significantly higher biomass yields
than fall-applied AA treatments (Figure 2) (p>F = 0.0405) (Table 4). The interaction
between N treatment and N rate was not significant either year of the study. Biomass yields
were similar over both site-years.
Nitrogen uptake increased with N rate both years of the study (p>F = <0.0001 and
0.0007) (Table 4). Averaged across N rates, biomass N uptake was significantly higher for
spring-applied ESN than fall and spring-applied AA in 2006 (p>F = 0.0045) (Table 4). The
interaction between N treatment and N rate was significant in 2006 (p>F = 0.0041) (Table 4).
Because N is released at a slower rate compared to the AA, it is likely that more N from the
ESN was taken up by the corn than lost due to leaching or denitrification.
Grain Production
Corn grain yields significantly increased with N rate both years of the study (p>F =
<0.0001) (Table 5). Averaged across N rates, fall-applied ESN, spring-applied AA, and ESN
treatments yielded more than fall applied AA in 2006 (Figure 3), while spring-applied
treatments yielded higher than the fall-applied treatments in 2007 (Figure 4) (p>F = <0.0001)
(Table 5). The interaction between N treatment and N rate was significant both years of the
study (p>F = 0.0131 and 0.0001) (Table 5). Corn grain yields were higher in 2006 compared
to 2007. This is probably due to better growing conditions in 2006. In 2007, very little

40
precipitation was received before and during pollination which could be the reason yields
were lower.
Grain N uptake increased with N rate both years of the study (p>F = <0.0001) (Table
5). The differences in N uptake among the four fertilizer treatments was higher in 2006 for
the fall and spring-applied ESN compared with the other treatments (p>F = <0.0001) (Table
5). In 2007, averaged across N rates, spring-applied AA and ESN had higher N uptake than
the other two treatments (p>F = <0.0001) (Table 5). The interaction between N treatment
and N rate was significant in 2006 and 2007 (p>F = <0.0001) (Table 5). N uptake was
higher in 2006 compared to 2007. Field conditions being more ideal likely played a major
role in the higher grain N uptakes.
Soil Analysis
Soil NH4+-N concentrations increased with N rate at the V-6 sampling time in 2006
(p>F = 0.0109) (Table 6). The differences among the four treatments was higher for spring-
applied ESN treatments than the other treatments at the V-6 sampling time in 2007 (p>F =
0.0692) (Table 7). The interaction between N treatment and N rate was not statistically
significant either year of the study.
Soil NH4+-N concentrations at V-15 were not affected by N rate or the fertilizer
treatments either year of the study. The interaction between N treatment and N rate was
significant in 2006 and 2007 (p>F = 0.0059 and 0.0261) (Tables 6, 7). Soil NH4+-N
concentrations at both post harvest sampling depths were not affected by any factors in either
year of the study.
Soil NO3--N concentrations were increased with N rate at the V-6 sampling time both
years of the study (p>F = <0.0001) (Tables 6, 7). The differences among the four fertilizer

41
treatments was significantly higher for the spring-applied AA treatments in 2006 (p>F=
<0.0001) (Table 6) and for the spring-applied ESN treatments in 2007 (p>F = 0.0023) (Table
7). The interaction between N treatment and N rate was statistically significant both years of
the study (p>F = <0.0001) (Tables 6, 7).
Soil NO3--N concentrations at the V-15 sampling time increased with N rate both
years of the study (p>F = <0.0001) (Tables 6, 7). The differences among the four treatments
were higher for the fall and spring-applied ESN treatments in 2006 (p>F= <0.0001) (Table 6)
and higher for the spring-applied ESN treatments in 2007 (p>F = <0.0001) (Table 7). The
interaction between N treatment and N rate was also significant both years of the study (p>F
= <0.0001 and 0.0007) (Tables 6, 7).
Post harvest soil NO3- -N concentrations increased with N rate in 2006 at the 0-30 cm
depth (p>F = <0.0001) (Table 6). In 2006, averaged across N rates, soil NO3- -N
concentrations from spring-applied ESN treatments were higher at the 31-60 cm sampling
depth (p>F = 0.0007) (Table 6). The interaction between N treatment and N rate was also
significant at this depth (p>F = <0.0001) (Table 6).
Kanawha Location
Biomass Production
Biomass yields significantly increased with N rate both years of the study (p>F =
0.0086 and <0.0001) (Table 8). The difference among the four fertilizer treatments was
significantly higher for spring-applied ESN in 2007 (Figure 5) (p>F = 0.0469) (Table 8).
The interaction between N treatment and N rate was not significant in either year of the
study. Biomass yields were greater in 2007 than 2006. This could be due to different
amounts of rainfall during the growing seasons.

42
Biomass N uptake was significantly increased by N rate in both years of the study
(p>F = <0.0001) (Table 8). The differences among the four fertilizer materials were not
significant either year of the study. The interaction between N treatment and N rate was not
significant either year of the study. N uptake was greater in 2007. The higher rates of N
uptake could be attributed to better growing conditions in 2007.
Grain Production
Corn grain yields increased as N rates both years of the study (p>F = <0.0001) (Table
9). Yields were significantly higher for the fall and spring-applied ESN treatments in 2006
(p>F =<0.0001) (Figure 6) (Table 9). The interaction between N treatment and N rate was
statistically significant in 2006 (p>F = 0.0165) (Table 9). Overall, grain yields were about
the same in both years of the study.
Grain N uptake increased with the addition of N in 2007 (p>F = 0.0001) (Table 9). In
2007, the spring-applied ESN had a statistically higher N uptake than the other treatments
(p>F = 0.0408) (Table 9). The interaction between N treatment and N rate was not
significant in either year of the study. Biomass N uptake was higher in 2006. In 2007 there
were more events of heavy precipitation which could have led to higher N leaching rates
compared with 2006.
Soil Analysis
Soil NH4+-N concentrations at the V-6 sampling time were increased with N rate in
2006 (p>F = 0.0152) (Table 10). In 2006 and 2007, soil NH4+-N concentrations were higher
in the spring-applied ESN treatments which was not expected due to the release
characteristics of the coating on the ESN (p>F = <0.0001 and 0.0711) (Tables 10, 11). The
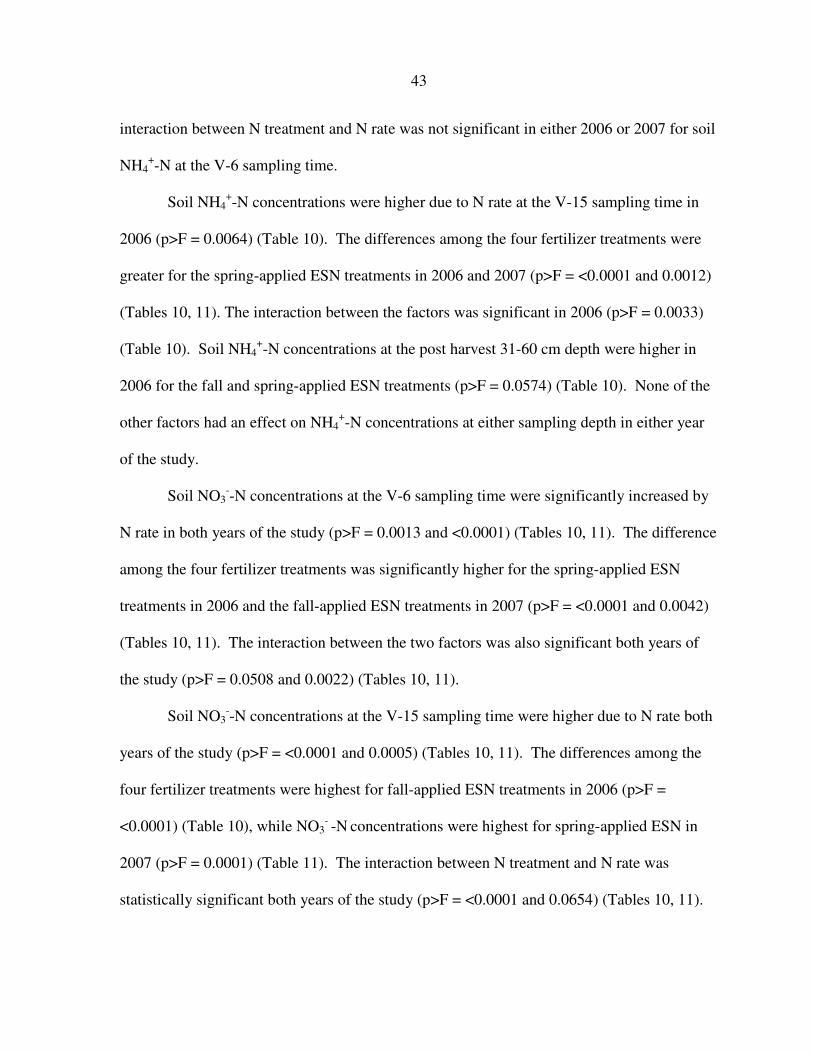
43
interaction between N treatment and N rate was not significant in either 2006 or 2007 for soil
NH4+-N at the V-6 sampling time.
Soil NH4+-N concentrations were higher due to N rate at the V-15 sampling time in
2006 (p>F = 0.0064) (Table 10). The differences among the four fertilizer treatments were
greater for the spring-applied ESN treatments in 2006 and 2007 (p>F = <0.0001 and 0.0012)
(Tables 10, 11). The interaction between the factors was significant in 2006 (p>F = 0.0033)
(Table 10). Soil NH4+-N concentrations at the post harvest 31-60 cm depth were higher in
2006 for the fall and spring-applied ESN treatments (p>F = 0.0574) (Table 10). None of the
other factors had an effect on NH4+-N concentrations at either sampling depth in either year
of the study.
Soil NO3--N concentrations at the V-6 sampling time were significantly increased by
N rate in both years of the study (p>F = 0.0013 and <0.0001) (Tables 10, 11). The difference
among the four fertilizer treatments was significantly higher for the spring-applied ESN
treatments in 2006 and the fall-applied ESN treatments in 2007 (p>F = <0.0001 and 0.0042)
(Tables 10, 11). The interaction between the two factors was also significant both years of
the study (p>F = 0.0508 and 0.0022) (Tables 10, 11).
Soil NO3--N concentrations at the V-15 sampling time were higher due to N rate both
years of the study (p>F = <0.0001 and 0.0005) (Tables 10, 11). The differences among the
four fertilizer treatments were highest for fall-applied ESN treatments in 2006 (p>F =
<0.0001) (Table 10), while NO3- -N
concentrations were highest for spring-applied ESN in
2007 (p>F = 0.0001) (Table 11). The interaction between N treatment and N rate was
statistically significant both years of the study (p>F = <0.0001 and 0.0654) (Tables 10, 11).

44
Post harvest soil NO3- -N concentrations were increased with N rate during both years
at the 0-30 cm depth (p>F = 0.0005 and 0.0197) (Tables 10, 11). Spring-applied ESN
treatments had higher concentrations of soil NO3- -N during both years of the study (p>F =
0.0004 and 0.0117) (Tables 10, 11). The interaction between the factors was significant in
2006 at the 0-30 cm depth (p>F = 0.0117) (Table 10). At the 31-60 cm sampling depth, soil
NO3- -N concentrations were increased with the addition of N during both years (p>F =
0.0014 and 0.0004) (Tables 10, 11). The differences among the treatments was higher for the
spring-applied ESN treatments over the duration of the study (p>F = 0.0044 and <0.0001)
(Tables 10, 11). The interaction between the two factors was statistically significant in 2007
(p>F = 0.0513) (Table 11).
Summary and Conclusions
Biomass and corn grain yields increased with the addition of fertilizer N all four site-
years of the study. Biomass yields were statistically higher from the use of spring-applied
ESN at one of the four site-years. In regards to corn grain yields, one of four site years
showed a clear statistical advantage supporting the application of ESN in the spring. Overall,
biomass and corn grain yield responses varied over the length of this study which is
undoubtedly due to varying environmental conditions at each location.
Soil NH4+-N and NO3
- -N concentrations were usually higher for fall or spring-
applied ESN treatments compared to aqua ammonia treatments at all of the sampling times.
This extra residual N that is left behind after the crop is harvest is of particular worry because
it can be easily leached overwinter.
We did not observe any negative yield responses from the use of ESN; however ESN
did not consistently result in higher corn grain and biomass yields. We believe that this

45
product has the potential to increase corn grain yields in certain environmental situations
such as sandy soils or areas of increased rainfall while preventing N loss. Currently, the cost
of this product and the unpredictability of positive yield responses for ESN make it difficult
to recommend ESN to producers as an alternative fertilizer to anhydrous ammonia in Iowa.
References
Bundy, L.G. 1986. Review—timing nitrogen applications to maximize fertilizer efficiency
and crop response in conventional corn production. J. Fert. Issues 3:99–106.
Randall, G.W., and J. E. Sawyer. 2005. Nitrogen application timing, forms, and additives.
Gulf hypoxia and local water quality concerns workshop. Ames, IA. September 26-
28, 2005. Iowa State University, as viewed at
www.epa.gov/msbasin/taskforce/2006symposia/6NitrogenAppRandall.pdf. (verified
26th
November 2007).
Hauck, R.D. 1985. Slow-release and bioinhibitor-amended nitrogen fertilizers. p. 294-319. In
O.P. Engelstad (ed.) Fertilizer technology and use, 3rd
ed. SSSA, Madison, WI.
Lachat Instruments. 1992. QuickChem method 12-107-04-1-B: nitrate (salicylate) in 2 M
KCl soil extracts. Lachat Instruments, Milwaukee, WI.
Lachat Instruments. 1993. QuickChem method 12-107-06-2-A: ammonia (salicylate) in 2 M
KCl soil extracts. Lachat Instruments, Milwaukee, WI.
Kyveryga, P.M., A.M. Blackmer, J.W. Ellsworth, and R. Isla. 2004. Soil pH effects on
nitrification of fall-applied anhydrous ammonia. Soil Sci. Soc. Am. J. 68: 545-551.
Nyborg M., Laidlaw J.W., Solberg E.D., and Malhi S.S. 1997. Denitrification and nitrous
oxide emissions from a Black Chernozemic soil during spring thaw in Alberta. Can. J.
Soil Sci. 77:153-160.
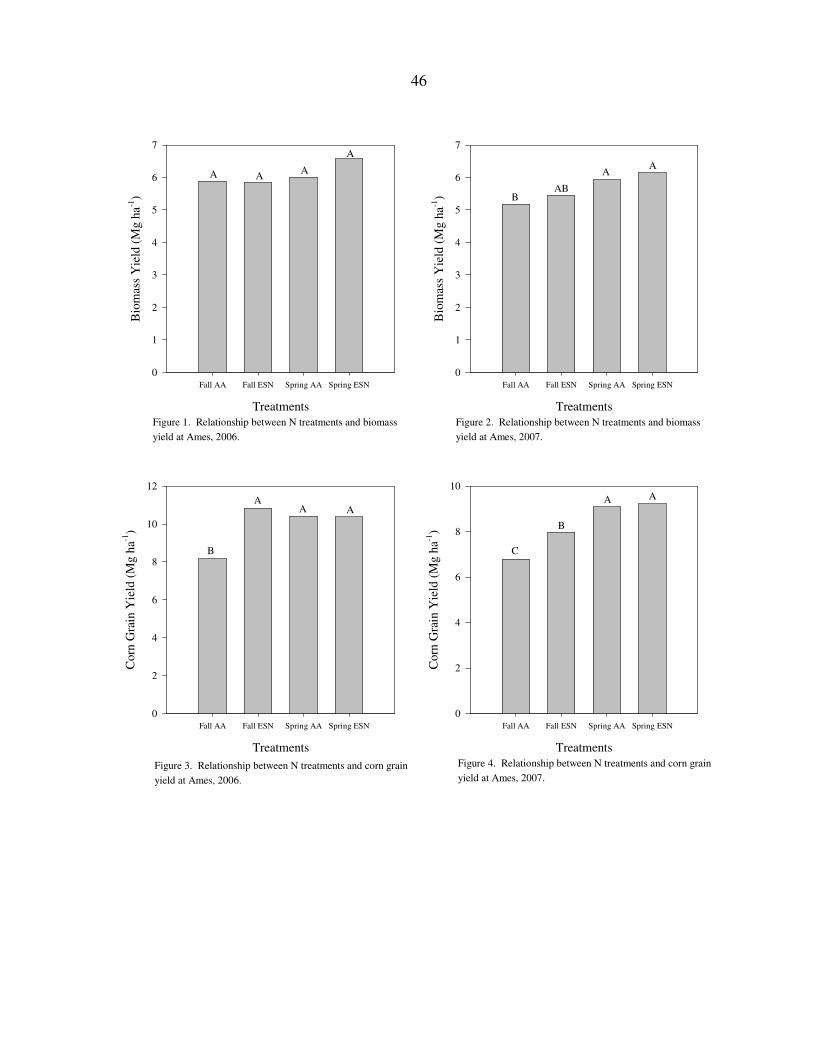
46
Treatments
Fall AA Fall ESN Spring AA Spring ESN
Bio
mas
s Y
ield
(M
g h
a-1)
0
1
2
3
4
5
6
7
A AA
A
Treatments
Fall AA Fall ESN Spring AA Spring ESN
Bio
mas
s Y
ield
(M
g h
a-1)
0
1
2
3
4
5
6
7
Treatments
Fall AA Fall ESN Spring AA Spring ESN
Corn
Gra
in Y
ield
(M
g h
a-1)
0
2
4
6
8
10
12
Treatments
Fall AA Fall ESN Spring AA Spring ESN
Corn
Gra
in Y
ield
(M
g h
a-1)
0
2
4
6
8
10
Figure 2. Relationship between N treatments and biomass
yield at Ames, 2007.
Figure 1. Relationship between N treatments and biomass
yield at Ames, 2006.
Figure 4. Relationship between N treatments and corn grain
yield at Ames, 2007.
Figure 3. Relationship between N treatments and corn grain
yield at Ames, 2006.
BAB
AA
B
AA A
C
B
A A

47
Figure 5. Relationship between N treatments and biomass
yield at Kanawha, 2007.
Treatments
Fall AA Fall ESN Spring AA Spring ESN
Bio
mas
s Y
ield
(M
g h
a-1)
0
2
4
6
8
10
12
B B B
A
Figure 6. Relationship between N treatments and corn grain
yield at Kanawha, 2006.
Treatments
Fall AA Fall ESN Spring AA Spring ESN
Corn
Gra
in Y
ield
(M
g h
a-1)
0
2
4
6
8
10
12
C
B
AAB
Table 1. Soil types for all years in the studies at Kanawha and Ames.
Site Year Soil type
Kanawha 2006 Nicollet Fine-loamy, mixed, superactive, mesic Aquic Hapludoll
Canisteo Fine-loamy, mixed, superactive, calcareous, mesic Typic Endoaquoll
2007 Webster Fine-loamy, mixed, superactive, mesic Typic Endoaquall
Ames 2006 Nicollet Fine-loamy, mixed, superactive, mesic Aquic Hapludoll
2007 Nicollet Fine-loamy, mixed, superactive, mesic Aquic Hapludoll
Soil series description

48
Table 2. Cultural practices in the fall and spring applied ESN and aqua ammonia
studies at Ames and Kanawha, 2006-2007.
Site / Planting Hybrid Population Harvest
Year date seeds/ha date
2006
Ames May 8 AgriGold 6395 RW 73,853 October 19
Kanawha May 22 Dekalb 53-32 Bt 81,510 October 24
2007
Ames May 11 AgriGold 6395 RW 74,100 October 12
Kanawha May 10 Pioneer 36W69 81,510 October 6
Table 3. Soil chemical properties at the 0-15 cm depth at Ames and Kanawha, 2006-2007.
Location Year OMa
pHb
Pc
Kd
g kg-1
Ames 2006 45 6.1 29 127
Ames 2007 39 6.0 39 161
Kanawha 2006 51 5.6 34 227
Kanawha 2007 53 5.9 32 255
a organic matter
b 1:1 H2O
c Bray P-1
d Ammonium Acetate
----------------mg kg-1
---------------

49
Table 4. Corn biomass response to fall and spring applied ESN and aqua ammonia
at Ames, 2006-2007.
N Treatment N rate Yield a
N uptake a
Yield a
N uptake a
kg ha-1
Mg ha-1
kg ha-1
Mg ha-1
kg ha-1
Fall AA 0 4.93 22 4.09 22
67 6.43 33 5.22 26
134 6.23 25 4.96 25
202 5.98 29 6.44 34
Average 5.89 27 5.18 27
Fall ESN 0 4.73 20 4.57 20
67 5.90 29 5.39 23
134 4.95 25 5.13 25
202 7.83 55 6.71 42
Average 5.85 32 5.45 28
Spring AA 0 4.88 24 5.38 30
67 5.88 29 5.61 26
134 6.85 38 6.16 34
202 6.43 35 6.57 39
Average 6.01 31 5.93 32
Spring ESN 0 4.38 18 4.28 20
67 6.23 33 5.69 24
134 7.33 45 7.18 38
202 8.38 67 7.45 48
Average 6.58 41 6.15 33
Statistics
N rate <0.0001 <0.0001 <0.0001 0.0007
Treatment NS 0.0045 0.0405 NS
N rate*N Treatment NS 0.0041 NS NS
a dry weight
-----------------------------------p > F-----------------------------------
2006 2007
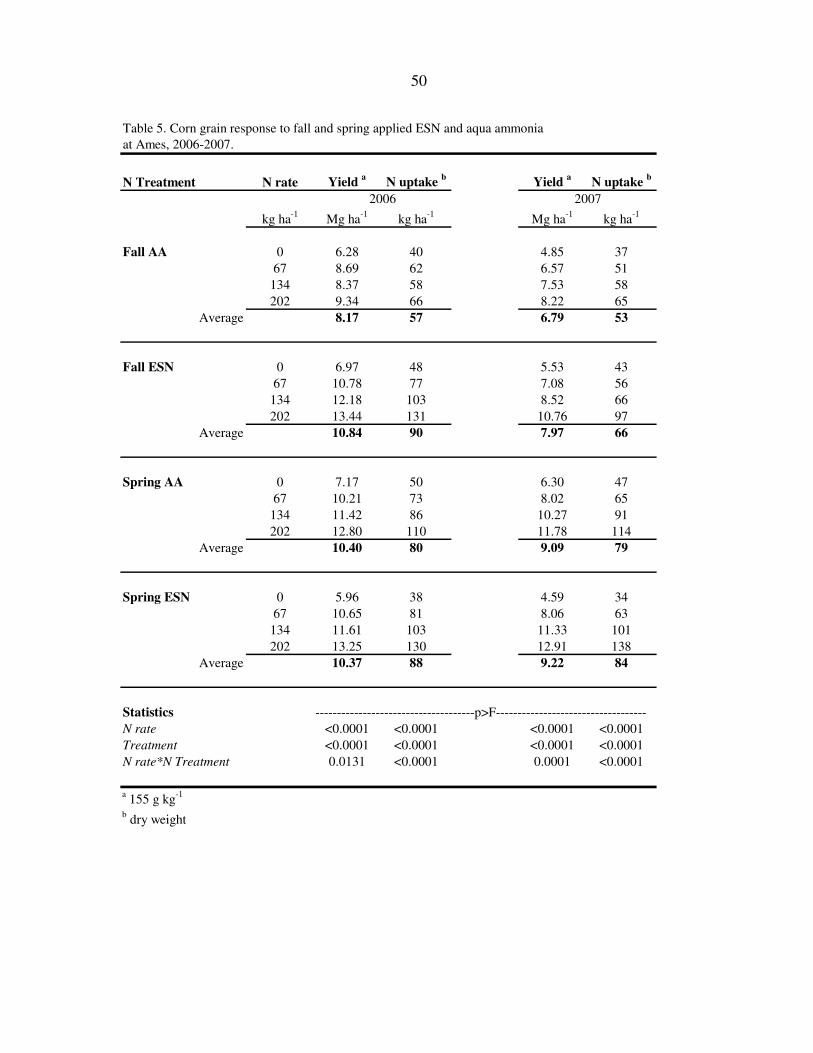
50
Table 5. Corn grain response to fall and spring applied ESN and aqua ammonia
at Ames, 2006-2007.
N Treatment N rate Yield a
N uptake b
Yield a
N uptake b
kg ha-1
Mg ha-1
kg ha-1
Mg ha-1
kg ha-1
Fall AA 0 6.28 40 4.85 37
67 8.69 62 6.57 51
134 8.37 58 7.53 58
202 9.34 66 8.22 65
Average 8.17 57 6.79 53
Fall ESN 0 6.97 48 5.53 43
67 10.78 77 7.08 56
134 12.18 103 8.52 66
202 13.44 131 10.76 97
Average 10.84 90 7.97 66
Spring AA 0 7.17 50 6.30 47
67 10.21 73 8.02 65
134 11.42 86 10.27 91
202 12.80 110 11.78 114
Average 10.40 80 9.09 79
Spring ESN 0 5.96 38 4.59 34
67 10.65 81 8.06 63
134 11.61 103 11.33 101
202 13.25 130 12.91 138
Average 10.37 88 9.22 84
Statistics
N rate <0.0001 <0.0001 <0.0001 <0.0001
Treatment <0.0001 <0.0001 <0.0001 <0.0001
N rate*N Treatment 0.0131 <0.0001 0.0001 <0.0001
a 155 g kg
-1
b dry weight
2006 2007
-------------------------------------p>F-----------------------------------
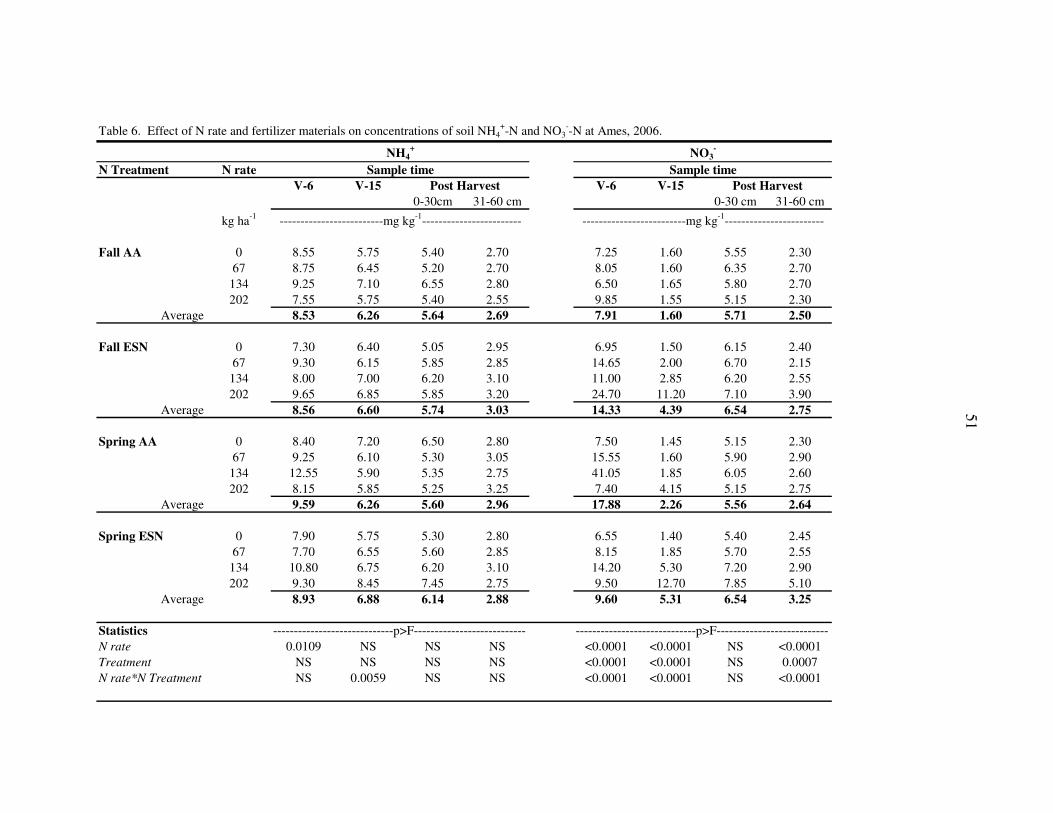
51
Table 6. Effect of N rate and fertilizer materials on concentrations of soil NH4+-N and NO3
--N at Ames, 2006.
N Treatment N rate
V-6 V-15 V-6 V-15
0-30cm 31-60 cm 0-30 cm 31-60 cm
kg ha-1
Fall AA 0 8.55 5.75 5.40 2.70 7.25 1.60 5.55 2.30
67 8.75 6.45 5.20 2.70 8.05 1.60 6.35 2.70
134 9.25 7.10 6.55 2.80 6.50 1.65 5.80 2.70
202 7.55 5.75 5.40 2.55 9.85 1.55 5.15 2.30
Average 8.53 6.26 5.64 2.69 7.91 1.60 5.71 2.50
Fall ESN 0 7.30 6.40 5.05 2.95 6.95 1.50 6.15 2.40
67 9.30 6.15 5.85 2.85 14.65 2.00 6.70 2.15
134 8.00 7.00 6.20 3.10 11.00 2.85 6.20 2.55
202 9.65 6.85 5.85 3.20 24.70 11.20 7.10 3.90
Average 8.56 6.60 5.74 3.03 14.33 4.39 6.54 2.75
Spring AA 0 8.40 7.20 6.50 2.80 7.50 1.45 5.15 2.30
67 9.25 6.10 5.30 3.05 15.55 1.60 5.90 2.90
134 12.55 5.90 5.35 2.75 41.05 1.85 6.05 2.60
202 8.15 5.85 5.25 3.25 7.40 4.15 5.15 2.75
Average 9.59 6.26 5.60 2.96 17.88 2.26 5.56 2.64
Spring ESN 0 7.90 5.75 5.30 2.80 6.55 1.40 5.40 2.45
67 7.70 6.55 5.60 2.85 8.15 1.85 5.70 2.55
134 10.80 6.75 6.20 3.10 14.20 5.30 7.20 2.90
202 9.30 8.45 7.45 2.75 9.50 12.70 7.85 5.10
Average 8.93 6.88 6.14 2.88 9.60 5.31 6.54 3.25
Statistics
N rate 0.0109 NS NS NS <0.0001 <0.0001 NS <0.0001
Treatment NS NS NS NS <0.0001 <0.0001 NS 0.0007
N rate*N Treatment NS 0.0059 NS NS <0.0001 <0.0001 NS <0.0001
NH4+
NO3-
Sample time Sample time
-----------------------------p>F--------------------------- -----------------------------p>F---------------------------
Post Harvest Post Harvest
-------------------------mg kg-1
------------------------ -------------------------mg kg-1
------------------------

52
Table 7. Effect of N rate and fertilizer materials on concentrations of soil NH4+-N and NO3
--N at Ames, 2007.
N Treatment N rate
V-6 V-15 V-6 V-15
0-30cm 31-60 cm 0-30 cm 31-60 cm
kg ha-1
Fall AA 0 6.45 5.90 5.38 2.51 5.45 2.05 4.23 2.35
67 6.95 6.20 5.68 2.48 6.90 2.20 4.64 2.42
134 6.95 6.65 4.96 2.48 7.00 2.35 4.93 2.60
202 7.55 6.60 5.65 2.28 7.25 2.05 4.56 2.27
Average 6.98 6.34 5.42 2.44 6.65 2.16 4.59 2.41
Fall ESN 0 6.50 5.60 4.88 2.53 5.65 2.25 4.11 2.17
67 6.90 6.75 4.79 2.17 7.55 2.00 3.66 2.00
134 7.50 7.25 5.51 2.27 9.60 2.70 4.43 2.10
202 7.15 6.70 6.39 2.51 19.70 3.50 4.90 2.69
Average 7.01 6.58 5.39 2.37 10.63 2.61 4.28 2.24
Spring AA 0 7.60 7.25 5.89 2.84 5.25 2.10 4.14 2.38
67 7.60 6.55 5.11 2.55 12.50 1.90 3.91 2.24
134 7.20 6.30 4.79 2.33 13.20 3.80 4.02 2.49
202 7.00 6.40 4.78 2.79 6.30 4.05 4.13 2.60
Average 7.35 6.63 5.14 2.63 9.31 2.96 4.05 2.43
Spring ESN 0 6.10 5.85 4.88 2.21 4.40 1.85 3.43 1.88
67 7.65 7.05 5.24 2.40 6.15 2.80 4.43 2.42
134 11.90 6.40 5.11 2.25 13.95 6.15 4.42 2.27
202 9.70 8.85 5.19 2.49 28.70 10.20 5.27 2.70
Average 8.84 7.04 5.11 2.34 13.30 5.25 4.39 2.32
Statistics
N rate NS NS NS NS <0.0001 <0.0001 NS NS
Treatment 0.0692 NS NS NS 0.0023 <0.0001 NS NS
N rate*N Treatment NS 0.0261 NS NS <0.0001 0.0007 NS NS
NH4+
NO3-
Sample time Sample time
-----------------------------p>F--------------------------- -----------------------------p>F---------------------------
Post Harvest Post Harvest
-------------------------mg kg-1
------------------------ -------------------------mg kg-1
------------------------

53
Table 8. Corn biomass response to fall and spring applied ESN and aqua ammonia
at Kanawha, 2006-2007.
N Treatment N rate Yield a
N uptake a
Yield a
N uptake a
kg ha-1
Mg ha-1
kg ha-1
Mg ha-1
kg ha-1
Fall AA 0 5.53 23 7.42 34
67 8.58 38 9.17 48
134 6.60 33 10.19 59
202 8.50 45 9.56 57
Average 7.30 35 9.09 49
Fall ESN 0 6.18 21 7.80 32
67 7.83 39 9.40 43
134 9.87 62 9.38 49
202 6.50 37 10.09 69
Average 7.60 40 9.17 48
Spring AA 0 5.50 23 7.71 32
67 8.58 37 9.33 49
134 6.73 33 9.95 58
202 9.65 61 9.99 58
Average 7.62 39 9.25 49
Spring ESN 0 7.23 34 9.45 44
67 7.70 36 10.62 50
134 8.23 43 10.77 65
202 8.00 59 9.37 59
Average 7.79 43 10.05 55
Statistics
N rate 0.0086 <0.0001 <0.0001 <0.0001
Treatment NS NS 0.0469 NS
N rate*N Treatment NS NS NS NS
a dry weight
------------------------------------p > F-----------------------------------
2006 2007

54
Table 9. Corn grain response to fall and spring applied ESN and aqua ammonia
fertilizers at Kanawha, 2006-2007.
N Treatment N rate Yield a
N uptake b
Yield a
N uptake b
kg ha-1
Mg ha-1
kg ha-1
Mg ha-1
kg ha-1
Fall AA 0 7.48 75 6.79 63
67 6.91 78 10.21 101
134 9.83 102 10.77 99
202 10.84 110 12.18 121
Average 8.77 91 9.99 96
Fall ESN 0 7.48 79 6.06 53
67 10.65 108 10.38 100
134 11.61 129 11.66 114
202 11.61 121 12.26 127
Average 10.34 109 10.08 98
Spring AA 0 6.08 63 6.51 59
67 9.57 102 10.33 96
134 11.16 119 12.41 125
202 12.43 146 12.43 123
Average 9.81 108 10.41 101
Spring ESN 0 7.74 80 8.49 83
67 10.91 116 10.07 98
134 11.99 137 11.93 123
202 12.62 137 11.88 125
Average 10.81 118 10.59 107
Statistics
N rate <0.0001 NS <0.0001 0.0001
Treatment <0.0001 NS NS 0.0408
N rate*N Treatment 0.0165 NS 0.0699 NS
a 155 g kg
-1
b dry weight
2006 2007
-------------------------------------p>F-----------------------------------

55
Table 10. Effect of N rate and fertilizer materials on concentrations of soil NH4+-N and NO3
--N at Kanawha, 2006.
N Treatment N rate
V-6 V-15 V-6 V-15
0-30cm 31-60 cm 0-30 cm 31-60 cm
kg ha-1
Fall AA 0 7.55 4.60 6.90 3.00 7.40 3.35 7.10 2.20
67 7.65 5.25 9.40 2.70 9.25 2.95 9.00 2.95
134 8.60 4.35 6.90 2.90 8.15 3.65 7.95 2.40
202 7.60 4.10 6.50 3.10 7.45 2.75 7.60 3.20
Average 7.85 4.58 7.43 2.93 8.06 3.18 7.91 2.69
Fall ESN 0 6.30 4.65 7.95 4.05 8.60 3.20 6.80 2.45
67 8.70 4.85 7.25 3.05 13.50 5.10 7.55 2.20
134 8.55 5.85 7.10 3.05 17.15 10.65 10.05 3.00
202 10.60 5.40 8.00 3.10 23.70 10.25 10.70 3.80
Average 8.54 5.19 7.58 3.31 15.74 7.30 8.78 2.86
Spring AA 0 7.65 4.05 6.80 2.75 7.20 3.10 6.00 2.00
67 8.00 4.35 7.40 2.75 7.80 3.15 8.35 2.45
134 9.15 5.30 8.00 3.05 10.30 4.95 8.65 3.50
202 7.30 4.75 8.05 2.75 8.05 3.90 8.10 2.85
Average 8.03 4.61 7.56 2.83 8.34 3.78 7.78 2.70
Spring ESN 0 7.60 4.50 6.95 2.85 7.00 3.45 7.75 2.05
67 12.30 7.05 7.80 3.25 11.45 5.10 9.15 2.90
134 16.55 6.00 7.30 3.55 11.75 7.00 11.60 5.40
202 16.85 8.65 7.60 3.90 16.30 12.20 18.90 7.55
Average 13.33 6.55 7.41 3.39 11.63 6.94 11.85 4.48
Statistics
N rate 0.0152 0.0064 NS NS 0.0013 <0.0001 0.0005 0.0014
Treatment <0.0001 <0.0001 NS 0.0574 <0.0001 <0.0001 0.0004 0.0044
N rate*N Treatment NS 0.0033 NS NS 0.0508 <0.0001 0.0117 NS
NH4+
NO3-
Sample time Sample time
-----------------------------p>F--------------------------- -----------------------------p>F---------------------------
Post Harvest Post Harvest
-------------------------mg kg-1
------------------------ -------------------------mg kg-1
------------------------

56
Table 11. Effect of N rate and fertilizer materials on concentrations of soil NH4+-N and NO3
--N at Kanawha, 2007.
N Treatment N rate
V-6 V-15 V-6 V-15
0-30cm 31-60 cm 0-30 cm 31-60 cm
kg ha-1
Fall AA 0 9.75 4.30 8.90 3.46 5.65 2.55 3.09 1.25
67 10.10 4.25 8.70 3.83 7.70 2.50 3.40 1.40
134 8.85 4.65 8.49 4.04 11.30 2.50 3.80 1.50
202 8.75 4.30 10.13 4.09 10.20 2.90 4.33 1.60
Average 9.36 4.38 9.06 3.86 8.71 2.61 3.66 1.44
Fall ESN 0 10.55 4.15 8.11 4.48 5.75 2.70 3.21 1.74
67 12.15 4.40 9.58 4.39 12.90 3.05 4.39 1.58
134 9.35 4.05 8.15 3.75 13.95 3.30 3.93 1.47
202 10.35 5.95 8.35 3.53 28.25 5.05 4.06 1.79
Average 10.60 4.64 8.55 4.04 15.21 3.53 3.90 1.65
Spring AA 0 8.55 4.15 8.38 4.00 5.55 2.25 3.30 1.41
67 9.50 4.20 9.16 4.49 14.45 2.95 3.30 1.48
134 10.70 4.00 8.73 3.68 16.75 4.55 3.48 1.46
202 10.25 3.90 7.40 3.57 8.70 3.35 3.72 1.63
Average 9.75 4.06 8.42 3.94 11.36 3.28 3.45 1.50
Spring ESN 0 10.70 4.90 9.29 4.87 7.70 2.85 4.27 1.65
67 11.10 5.75 9.49 4.58 11.75 4.10 3.48 1.74
134 13.05 6.15 8.40 4.19 14.45 6.05 4.59 1.91
202 15.70 6.15 8.83 3.91 20.80 8.15 5.36 2.65
Average 12.64 5.74 9.00 4.39 13.68 5.29 4.43 1.99
Statistics
N rate NS NS NS NS <0.0001 0.0005 0.0197 0.0004
Treatment 0.0711 0.0012 NS NS 0.0042 0.0001 0.0117 <0.0001
N rate*N Treatment NS NS NS NS 0.0022 0.0654 NS 0.0513
NH4+
NO3-
Sample time Sample time
-----------------------------p>F--------------------------- -----------------------------p>F---------------------------
Post Harvest Post Harvest
-------------------------mg kg-1
------------------------ -------------------------mg kg-1
------------------------

57
Comparison of ESN and aqua ammonia applied in the spring as sources of nitrogen for
corn production in Iowa
A paper to be submitted to Communications in Soil Science and Plant Analysis
J.A. Moorea and R. Killorn
a
aIowa State University, Ames, IA
Abstract
Controlled-release nitrogen (N) fertilizers currently are not commonly used in corn
production. They have been proven to increase yields and reduce N loss compared to
conventional fertilizers in certain crops. A two-year field study was conducted in 2006 and
2007 at one location in northwest Iowa to compare the effects of a controlled-release N
fertilizer, ESN, and aqua ammonia on corn grain and biomass yields, N uptake and soil N
concentrations. Fertilizer rates from 0 to 202 kg N ha-1
in 67 kg N ha-1
increments were
spring-applied. The addition of fertilizer N increased biomass yields one year and biomass N
uptake both years. The addition of ESN or aqua ammonia did not significantly increase
biomass yields either year. The addition of fertilizer N increased corn grain yields and N
uptake during both years of the study. There was no difference in corn grain yields due to
fertilizer materials. Soil nitrate-N and ammonium-N concentrations were usually higher for
ESN treatments compared to aqua ammonia treatments at all sampling times. These results
suggest that the use of ESN could have negative environmental impacts because the residual
N that is left behind after the crop harvest is easily leached overwinter if field conditions are
saturated. We did not observe any negative yield responses from the use of ESN at any year
during the study.
58
Introduction
The use of nitrogen (N) fertilizer in Iowa is a common practice to increase corn grain
yields. Fall application of anhydrous ammonia is widely practiced in the Corn Belt due to
factors such as lower cost of N, more time for fieldwork compared to the spring, and field
conditions are usually better suited for application (Randall and Sawyer, 2005). However,
nitrate can easily be lost in leachate and subsurface drainage, particularly when precipitation
exceeds evapotranspiration, which usually occurs every year in Iowa. Nitrate losses from fall
application of anhydrous ammonia can be significantly greater compared with spring
application because of more time for nitrification before N uptake by plants (Randall and
Vetsch, 2005).
Producers are always looking for new ways to increase crop yields while keeping
input costs at a minimum. ESN is a controlled-release N fertilizer (44% N), developed by
Agrium, Inc., that has the potential to reduce loss of N from the soil while increasing grain
yields and plant uptake of N. After ESN is applied and comes in contact with soil moisture,
water is absorbed through the coating and turns the urea granule into a liquid. The liquid
urea then diffuses out through the coating over the growing season. Release of the N is
regulated by temperature with higher temperatures leading to increased diffusion rates.
However, current use of controlled-release fertilizers is not widespread in crops such
as corn due to the higher cost when compared to conventional N fertilizers. The higher cost
of these fertilizers has restricted their use to high value crops such as ornamentals and turf
grass (Hauck, 1985). If the cost can be reduced or increased yields can offset the higher cost
of these fertilizers, these types of fertilizers have a higher chance of increased usage. To
59
date, little research has been published comparing ESN with aqua ammonia for application to
corn.
The objectives of this study were to: 1) compare the effects of ESN and aqua
ammonia applied in the spring on corn grain and biomass yields and 2) compare the effects
of spring-applied ESN and aqua ammonia on soil NH4-N and soil NO3-N concentrations at
three times during the year, the V-6 growth stage, the V-15 growth stage, and at post-harvest.
Materials and Methods
This experiment was conducted at the Northwest Research and Demonstration Farm
near Sutherland, Iowa in 2006 and 2007. The soil types for the experiment are listed in Table
1 while the cultural practices are listed in Table 2 and baseline soil data are listed in Table 3.
Treatments were arranged as a factorial in a randomized complete block design with
four replications. The experimental plots measured 3.05 m by 12.2 m. These plots contained
4 rows of corn spaced 76 cm apart. A set of ESN (44% N) and aqua ammonia (20% N)
treatments were applied in the spring of each year. The ESN treatments were applied by hand
and the aqua ammonia was injected into the soil using a two row applicator. Aqua ammonia
was used in this study because it is more easily handled and more accurately applied than
anhydrous ammonia. Nitrogen application rates for this site in both years were: 0, 67, 134,
and 202 kg N ha-1
. The corn plots followed soybeans each year. The plots were scouted
several times throughout the growing season to check for overall plant health, damage due to
insects, disease, and nutrient deficiencies.

60
Grain Yield and Analysis
The center two rows of each plot were harvested by combine. The weight of the
grain in each plot and moisture content were recorded when harvested. A sub-sample of the
grain was collected, weighed, and dried at 60º C. The sub-sample was used to determine
grain moisture of the plot. Corn grain yield was adjusted to reflect a moisture content of 155
g kg-1
.
Chemical analysis of the grain was conducted as follows: A 0.25g sub-sample of
grain was ground, dried for a minimum of twenty-four hours, and was digested using the
Hach Digesdahl® Digestion Apparatus, and the Hach Plant Tissue and Tissue Analysis
System (Hach Company, 1988), with concentrated sulfuric acid (18 M H2SO4) and 50 %
hydrogen peroxide (H2O2). The digested product was then used to determine percent N by
using a modified Nessler Method test and a Hach DR/3000 Spectrophotometer (DR/3000
Procedure Code N.10) as described in the method for Nitrogen Analysis in Total Plant Tissue
(Hach Company, 1988). Nitrogen uptake was calculated by multiplying grain dry weight by
the percent of N in the grain.
Plant Biomass Production and Analysis
Whole plant samples were collected when the plants reached physiological maturity.
The entire above ground portion of the plant, minus the ears of corn were selected from the
center two rows (three plants from each row) of each plot. The first plant in the row was
skipped because it was generally larger due to more light interception. The plant samples
were chopped and weighed. A sub-sample was taken, weighed, then dried at 60º C for a
minimum of forty-eight hours, weighed again, and ground. The dry weight of the sub-
sample was used to determine total above ground biomass produced per hectare.
61
Soil Sampling and Analysis
Soil samples were collected three times during the season each year of the study. The
timing of the samples was at the V-6 growth stage, the V-15 growth stage, and post harvest.
Three cores were randomly taken to a depth of 30 cm between the center two rows of the plot
and combined to form the sample. The post harvest sample included samples collected from
a depth of 31-60 cm.
The soil samples were dried at 60º C for a minimum of twenty-four hours and ground
to pass through a 2 mm sieve. A 10 g sub-sample was weighed and extracted with 50 ml of 2
M KCl solution. The extract was filtered and analyzed for nitrate-N (NO3-N) and
ammonium-N (NH4-N) using a QuikChem 8000 Automated Ion Analyzer by the QuikChem
Method 12-107-04-1-B (Lachat Instruments, 1992) for the NO3-N and QuikChem Method
12-107-06-2-A (Lachat Instruments, 1993) for NH4-N.
Data Analysis
Statistix 8 (Analytical Software, 2003) was used to analyze the data. The analyses for
each combination of site and year were done separately. Nitrate-N and NH4+-N content for
all soil sampling times were also analyzed separately. Differences at the p>F = 0.05 level or
less were considered significant. Outliers in the data, except for corn grain yield, were
identified by using residual graphs and were determined to be non-representative if they were
greater that three standard deviations from the experiment mean.
Results and Discussion
Biomass Production
Biomass yields increased with N rate in 2007 (p>F = <0.0001) (Table 4) but were not
affected by N rate in 2006. The difference between the ESN and aqua ammonia and the

62
interaction between material and N rate was not significant either year of the study. Biomass
yields varied between the two years of the study but were higher in 2007. This could be due
to different environmental conditions experienced each year.
Biomass N uptake increased when N rate increased both years of the study (p>F =
0.0463 and 0.0002) (Table 4). The difference between the two materials and the interaction
between material and N rate was not significant during either year of the study. N uptake in
the biomass also varied from year to year. It was higher in 2007, which is most likely due to
better growing conditions.
Grain Production
Corn grain yield increased as N rate increased both years of the study (p>F =
<0.0001) (Table 5). The difference between the materials and the interaction between
material and N rate was not significant either year of the study. Grain yields varied over the
length of the study. Average yields were higher in 2007 which was more than likely due to
better environmental growing conditions.
Grain N uptake increased with N rate both years of the study (p>F = <0.0001) (Table
5). The difference in N uptake between the two fertilizer materials was not significant either
year of the study. The interaction between material and N rate was also not significant either
year of the study. Grain N uptake was almost identical during both years of the study.
Soil Analysis
Soil NH4-N concentrations were not affected by N rate at the V-6 sampling time
either year of the study. Averaged over N rates, ESN treatments had higher NH4+-N
concentrations both years of the study (p>F = 0.0285 and 0.0144) (Tables 6 and 7). The

63
interaction between material and N rate was not significant for soil NH4-N at the V-6
sampling time.
Soil NH4-N concentrations increased with N rate (p>F = 0.0242 and 0.0002) at the V-
15 sampling time in 2006 and 2007 (Tables 6, 7). The difference between the two materials
was significantly higher for ESN both years of the study (p>F = 0.0002 and <0.0001) (Tables
6, 7). The interaction between material and N rate was significant in 2007 (p>F = 0.0020)
(Table 7).
Post harvest samples at both the 0-30 and 31-60 cm depth were not significantly
affected by any of the factors. Soil NH4+-N concentrations from the ESN treatments were
slightly higher both years and at both depths.
Soil NO3-N concentrations increased significantly when N rate increased at the V-6
sampling time in 2007 (p>F = <0.0001) (Table 7). The difference between the two fertilizer
materials was significantly higher for the ESN treatments both years of the study (p>F =
0.0528 and <0.0001) (Tables 6, 7). The interaction between material and N rate was
significant in 2007 for soil NO3-N at the V-6 sampling time (p>F = <0.0001) (Table 7).
At the V-15 sampling time, soil NO3-N concentrations were significantly increased
with N rate in 2006 and 2007 (p>F = 0.0002 and 0.0001) (Tables 6, 7). The difference
between the ESN and AA treatments was significantly higher for the ESN treatments both
years of the study (p>F = 0.0020 and <0.0001) (Tables 6, 7). In 2006 and 2007, the
interaction between material and N rate was statistically significant (p>F = 0.0752 and
0.0003) (Tables 6, 7).
Post harvest soil NO3- -N concentrations at the 0-30 cm depth increased with N rate
(p>F = <0.0001 and 0.0515) both years of the study (Tables 6, 7). Averaged over N rates,

64
the ESN treatments had higher NO3- -N concentrations in 2006 at the 0-30 cm depth in 2006
(p>F = 0.0013) (Table 6). The interaction between material and N rate was significant in
2006 (p>F = 0.0003) (Table 6). At the 31-60 cm sampling depth, soil NO3- -N concentrations
were increased when N was applied both years of the study (p>F = 0.0028 and 0.0262)
(Tables 6, 7). Higher concentrations of soil NO3- -N were found in the ESN treatments in
2006 (p>F = 0.0197) (Table 6). The interaction between material and N rate was significant
(p>F = 0.0057) at the 31-60 cm depth in 2006 (Table 6).
Summary and Conclusions
The addition of fertilizer N increased biomass yields one year of the study and corn
grain yields in both years. The source of N did not have any effect on biomass or corn grain
yields. We did not observe any negative yield responses from the use of ESN; however ESN
did not consistently result in higher corn grain and biomass yields. The data suggest slightly
higher concentrations of nitrate and ammonium from ESN treatments remained in the soil
after the corn was harvested. These residual amounts of N could have negative consequences
to crop producers due to the fact that nitrate is easily lost from the soil profile if leaching
occurs.
We believe that this product has the potential to increase corn grain yields in certain
situations while preventing N loss (sandy soils, high rainfall locations, etc). Currently the
cost of this product and the unpredictability of positive yield responses for ESN make it
difficult to recommend ESN to producers as an alternative fertilizer to anhydrous ammonia in
northwest Iowa.
65
References
Hach Company. 1988. Plant tissue and sap analysis manual. Hach Company, Loveland, CO.
Hauck, R.D. 1985. Slow-release and bioinhibitor-amended nitrogen fertilizers. p. 294-319. In
O.P. Engelstad (ed.) Fertilizer technology and use, 3rd
ed. SSSA, Madison, WI.
Lachat Instruments. 1992. QuickChem method 12-107-04-1-B: nitrate (salicylate) in 2 M
KCl soil extracts. Lachat Instruments, Milwaukee, WI.
Lachat Instruments. 1993. QuickChem method 12-107-06-2-A: ammonia (salicylate) in 2 M
KCl soil extracts. Lachat Instruments, Milwaukee, WI.
Randall, G.W., and J.A. Vetsch. 2005 Corn production on a sub-surface drained mollisol as
affected by fall versus spring application of nitrogen and nitrapyrin. Agron. J.
97:472-478
Randall, G.W., and J. E. Sawyer. 2005. Nitrogen application timing, forms, and additives.
Gulf hypoxia and local water quality concerns workshop. Ames, IA. September 26-
28, 2005. Iowa State University, as viewed at
www.epa.gov/msbasin/taskforce/2006symposia/6NitrogenAppRandall.pdf. (verified
26th
November 2007).

66
Table 1. Soil types in the study at Sutherland, 2006-2007.
Site Year Soil type
Sutherland 2006 Marcus Fine-silty, mixed, superactive, mesic Typic Endoaquoll
2007 Sac Fine-silty, mixed, superactive, mesic Oxyaquic Hapludoll
Primghar Fine-silty, mixed, superactive, mesic Aquic Hapludoll
Soil series description
Table 2. Cultural practices for the study at Sutherland, 2006-2007.
Site / Planting Hybrid Population Harvest
Year date seeds/ha date
2006
Sutherland May 12 Pioneer 35Y61 79,040 October 24
2007
Sutherland May 2 Kruger 8602 HX 79,040 October 11
Table 3. Soil chemical properties at the 0-15 cm depth at Sutherland, 2006-2007.
Year OMa
pHb
Pc
Kd
g kg-1
2006 46 5.1 22 248
2007 46 5.8 21 176
a organic matter
b 1:1 H2O
c Bray P-1
d Ammonium Acetate
----------------mg kg-1
---------------
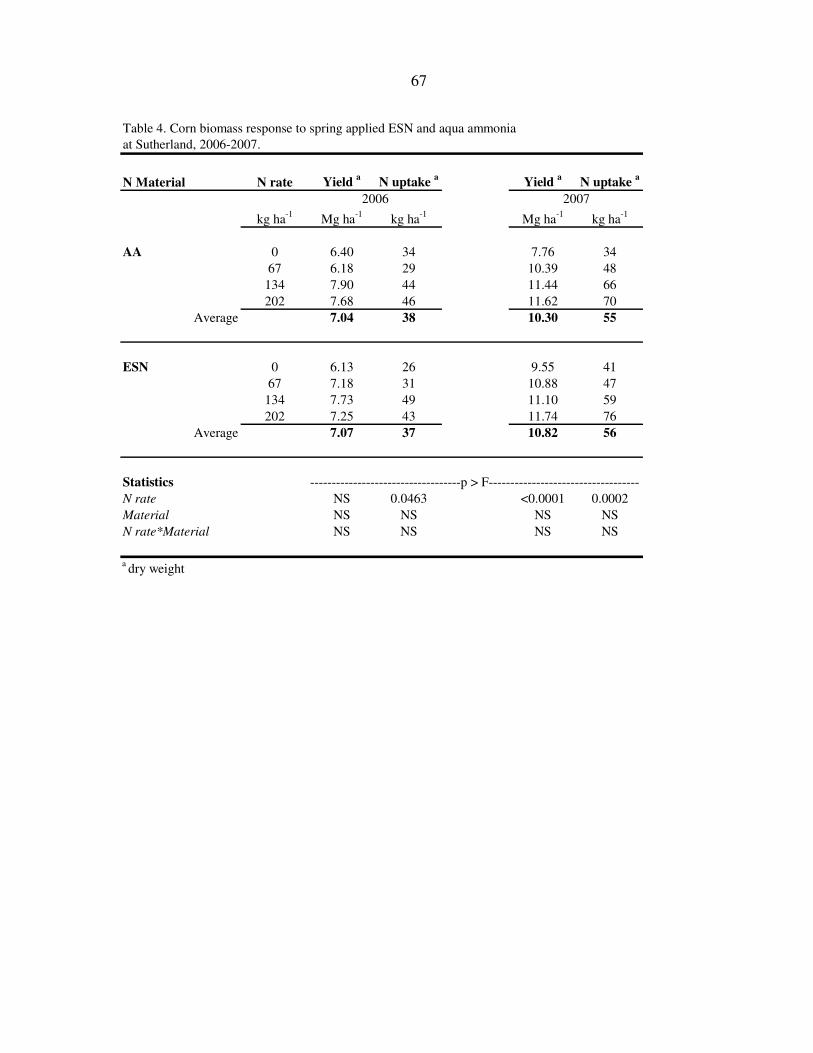
67
Table 4. Corn biomass response to spring applied ESN and aqua ammonia
at Sutherland, 2006-2007.
N Material N rate Yield a
N uptake a
Yield a
N uptake a
kg ha-1
Mg ha-1
kg ha-1
Mg ha-1
kg ha-1
AA 0 6.40 34 7.76 34
67 6.18 29 10.39 48
134 7.90 44 11.44 66
202 7.68 46 11.62 70
Average 7.04 38 10.30 55
ESN 0 6.13 26 9.55 41
67 7.18 31 10.88 47
134 7.73 49 11.10 59
202 7.25 43 11.74 76
Average 7.07 37 10.82 56
Statistics
N rate NS 0.0463 <0.0001 0.0002
Material NS NS NS NS
N rate*Material NS NS NS NS
a dry weight
-----------------------------------p > F-----------------------------------
2006 2007

68
Table 5. Corn grain response to spring applied ESN and aqua ammonia fertilizers
at Sutherland, 2006-2007.
N Material N rate Yield a
N uptake b
Yield a
N uptake b
kg ha-1
Mg ha-1
kg ha-1
Mg ha-1
kg ha-1
AA 0 9.07 93 8.96 81
67 11.42 129 11.80 116
134 12.80 153 12.71 139
202 11.29 136 13.82 154
Average 11.14 127 11.82 122
ESN 0 9.07 91 9.49 85
67 10.53 113 12.06 117
134 12.80 147 12.76 138
202 11.99 146 13.14 151
Average 11.10 124 11.86 123
Statistics
N rate <0.0001 <0.0001 <0.0001 <0.0001
Material NS NS NS NS
N rate*Material NS NS NS NS
a 155 g kg
-1
b dry weight
2006 2007
----------------------------------p>F---------------------------------
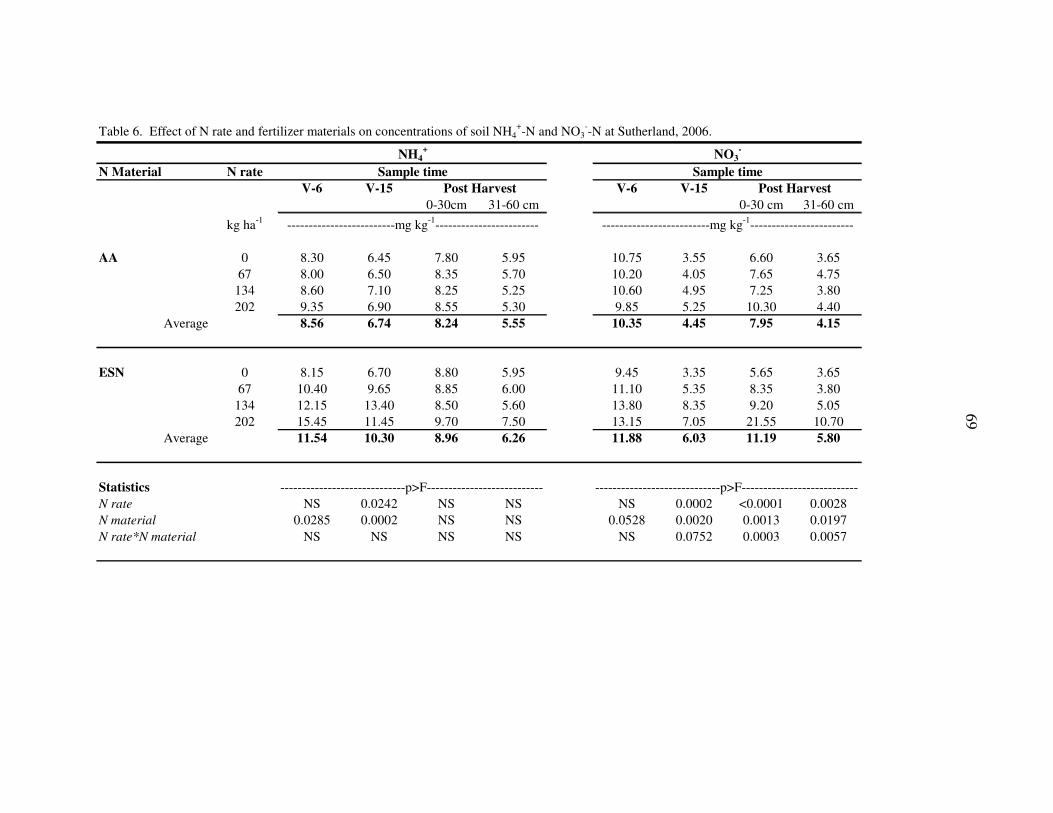
69
Table 6. Effect of N rate and fertilizer materials on concentrations of soil NH4+-N and NO3
--N at Sutherland, 2006.
N Material N rate
V-6 V-15 V-6 V-15
0-30cm 31-60 cm 0-30 cm 31-60 cm
kg ha-1
AA 0 8.30 6.45 7.80 5.95 10.75 3.55 6.60 3.65
67 8.00 6.50 8.35 5.70 10.20 4.05 7.65 4.75
134 8.60 7.10 8.25 5.25 10.60 4.95 7.25 3.80
202 9.35 6.90 8.55 5.30 9.85 5.25 10.30 4.40
Average 8.56 6.74 8.24 5.55 10.35 4.45 7.95 4.15
ESN 0 8.15 6.70 8.80 5.95 9.45 3.35 5.65 3.65
67 10.40 9.65 8.85 6.00 11.10 5.35 8.35 3.80
134 12.15 13.40 8.50 5.60 13.80 8.35 9.20 5.05
202 15.45 11.45 9.70 7.50 13.15 7.05 21.55 10.70
Average 11.54 10.30 8.96 6.26 11.88 6.03 11.19 5.80
Statistics
N rate NS 0.0242 NS NS NS 0.0002 <0.0001 0.0028
N material 0.0285 0.0002 NS NS 0.0528 0.0020 0.0013 0.0197
N rate*N material NS NS NS NS NS 0.0752 0.0003 0.0057
-----------------------------p>F--------------------------- -----------------------------p>F---------------------------
Post Harvest Post Harvest
-------------------------mg kg-1
------------------------ -------------------------mg kg-1
------------------------
NH4+
NO3-
Sample time Sample time

70
Table 7. Effect of N rate and fertilizer materials on concentrations of soil NH4+-N and NO3
--N at Sutherland, 2007.
N Material N rate
V-6 V-15 V-6 V-15
0-30cm 31-60 cm 0-30 cm 31-60 cm
kg ha-1
AA 0 8.45 8.40 9.66 5.39 6.05 3.15 4.27 2.34
67 8.85 8.45 9.31 5.68 8.05 4.40 4.58 2.41
134 9.40 8.70 9.26 5.24 7.45 4.00 4.71 2.52
202 8.15 9.30 9.31 5.88 8.60 5.45 5.31 3.68
Average 8.71 8.71 9.39 5.55 7.54 4.25 4.72 2.74
ESN 0 10.00 8.25 9.74 5.36 6.70 3.25 4.04 2.45
67 12.90 9.70 9.01 5.67 14.95 6.45 4.75 2.22
134 10.15 14.35 10.44 6.06 15.50 17.25 6.21 5.00
202 14.40 15.55 9.40 5.65 21.35 13.35 5.14 3.91
Average 11.86 11.96 9.65 5.69 14.63 10.08 5.04 3.40
Statistics
N rate NS 0.0002 NS NS <0.0001 0.0001 0.0515 0.0262
N material 0.0144 <0.0001 NS NS <0.0001 <0.0001 NS NS
N rate*N material NS 0.0020 NS NS <0.0001 0.0003 NS NS
-----------------------------p>F--------------------------- -----------------------------p>F---------------------------
Post Harvest Post Harvest
-------------------------mg kg-1
------------------------ -------------------------mg kg-1
------------------------
NH4+
NO3-
Sample time Sample time

71
General Conclusions
Our objectives for these studies were to compare the effects of a controlled release N
fertilizer, ESN, urea, and aqua ammonia on corn grain and biomass yields, N uptake, and soil
N concentrations. The field studies did not show a consistent advantage for using ESN as a
fertilizer N source for corn production in Iowa. There were large differences in biomass and
corn grain yields among the sites and years. Soil nitrogen and plant and grain N uptake were
also variable over the duration of the studies. One trend that was observed in all studies and
locations was the higher content of nitrate and ammonium-N in the ESN treatments that was
usually present in the soil. These higher concentrations of residual N could be detrimental to
the environment because nitrate-N can be easily lost through leaching.
The inconsistency in the results among years can be interpreted as being due to
factors such as climatic conditions over growing seasons or soil conditions. Conditions for
leaching and/or denitrification might have been present in some years or locations. Taking
more soil samples throughout the season would have been a good idea in order to get a better
idea of how quickly ESN releases N over a wide range of climatic and soil conditions.
It should be noted that we did not observe a negative yield response to ESN over the
length of these studies. We conclude that ESN may increase yields and prevent N loss in
certain situations such as sandy soils and areas of increased rainfall. The cost of ESN will
more than likely be the biggest factor that determines how it is used by crop producers. If
increased yields can pay for the extra cost of the fertilizer, the use of ESN could become a
viable option for corn production in Iowa. If producers should decide to use ESN as an N
fertilizer for corn production in Iowa, they should exercise caution since there is risk
involved with recovering the added costs of the fertilizer.

72
Acknowledgements
I would like to thank Dr. Randy Killorn for making my time here an enjoyable
experience and for all of his guidance and help. I would like to thank Agrium, Inc. for
making this research possible. I thank my family and friends for encouraging me and helping
me get through the hard times.
Finally, I thank all the rest of the people who helped with getting the work done,
Dave Rueber, Mike Fiscus, Dave Haden, Dave Starrett, and all of the employees of the ISU
Soil and Plant Analysis Laboratory who analyzed my soil samples. I especially thank Brad
Hammes, Bernardo Thompson, Rachel Unger and Maggie Lampo for the countless hours of
work they put in to help collect and analyze samples.