Comparison of environmental performance of waste-to …€¦ · · 2014-04-17Comparison of...
40
Comparison of environmental performance of waste-to-energy (WTE) plants in France with Denmark and Germany Yohann Benhamou Advisor: Professor Nickolas J. Themelis Submitted in partial fulfillment of the requirements for the M.S. in Earth ddddddd d dand Environmental Engineering, Columbia University November 2010 Research partially sponsored by the Earth Engineering Center, Columbia University
Transcript of Comparison of environmental performance of waste-to …€¦ · · 2014-04-17Comparison of...

Comparison of environmental performance of waste-to-energy (WTE) plants in France with Denmark and Germany
Yohann Benhamou
Advisor: Professor Nickolas J. Themelis
Submitted in partial fulfillment of the requirements for the M.S. in Earth ddddddd d dand Environmental Engineering, Columbia University
November 2010
Research partially sponsored by the
Earth Engineering Center, Columbia University
2
Comparison of management of municipalf solid waste and
environmental performance in France with Denmark and Germany by Yohann Benhamou
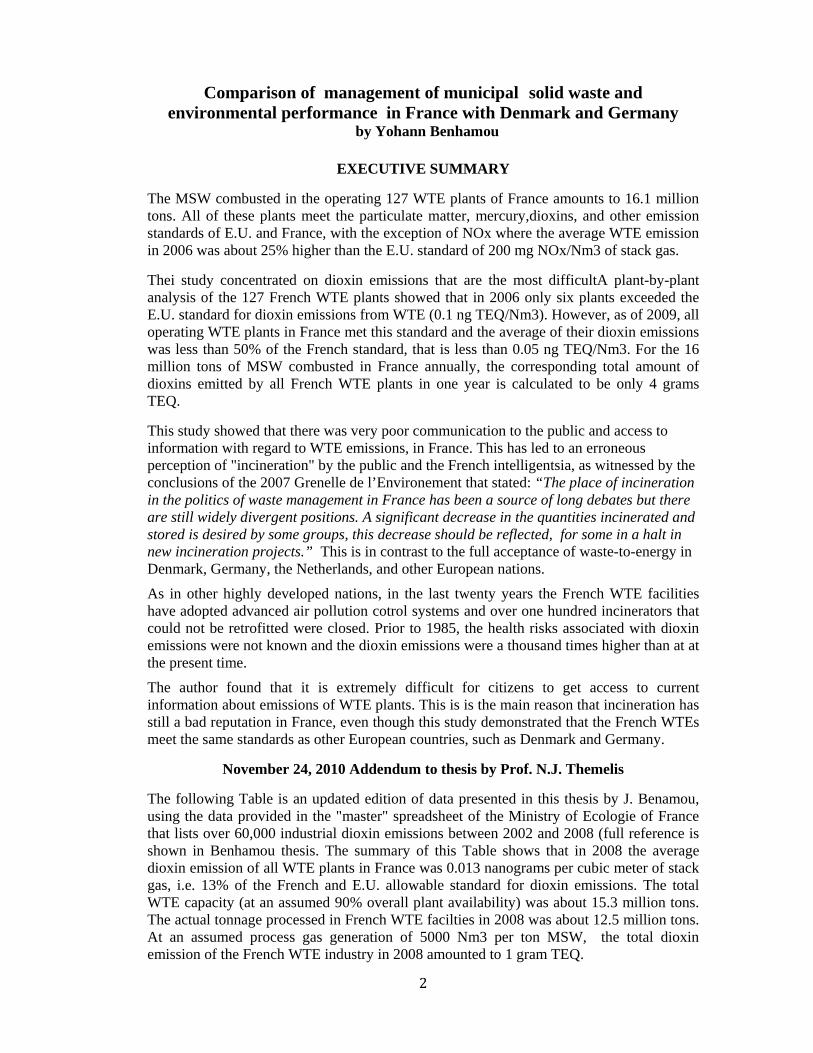
EXECUTIVE SUMMARY
The MSW combusted in the operating 127 WTE plants of France amounts to 16.1 million tons. All of these plants meet the particulate matter, mercury,dioxins, and other emission standards of E.U. and France, with the exception of NOx where the average WTE emission in 2006 was about 25% higher than the E.U. standard of 200 mg NOx/Nm3 of stack gas.
Thei study concentrated on dioxin emissions that are the most difficultA plant-by-plant analysis of the 127 French WTE plants showed that in 2006 only six plants exceeded the E.U. standard for dioxin emissions from WTE (0.1 ng TEQ/Nm3). However, as of 2009, all operating WTE plants in France met this standard and the average of their dioxin emissions was less than 50% of the French standard, that is less than 0.05 ng TEQ/Nm3. For the 16 million tons of MSW combusted in France annually, the corresponding total amount of dioxins emitted by all French WTE plants in one year is calculated to be only 4 grams TEQ.
This study showed that there was very poor communication to the public and access to information with regard to WTE emissions, in France. This has led to an erroneous perception of "incineration" by the public and the French intelligentsia, as witnessed by the conclusions of the 2007 Grenelle de l’Environement that stated: “The place of incineration in the politics of waste management in France has been a source of long debates but there are still widely divergent positions. A significant decrease in the quantities incinerated and stored is desired by some groups, this decrease should be reflected, for some in a halt in new incineration projects.” This is in contrast to the full acceptance of waste-to-energy in Denmark, Germany, the Netherlands, and other European nations.
As in other highly developed nations, in the last twenty years the French WTE facilities have adopted advanced air pollution cotrol systems and over one hundred incinerators that could not be retrofitted were closed. Prior to 1985, the health risks associated with dioxin emissions were not known and the dioxin emissions were a thousand times higher than at at the present time.
The author found that it is extremely difficult for citizens to get access to current information about emissions of WTE plants. This is is the main reason that incineration has still a bad reputation in France, even though this study demonstrated that the French WTEs meet the same standards as other European countries, such as Denmark and Germany.
November 24, 2010 Addendum to thesis by Prof. N.J. Themelis
The following Table is an updated edition of data presented in this thesis by J. Benamou, using the data provided in the "master" spreadsheet of the Ministry of Ecologie of France that lists over 60,000 industrial dioxin emissions between 2002 and 2008 (full reference is shown in Benhamou thesis. The summary of this Table shows that in 2008 the average dioxin emission of all WTE plants in France was 0.013 nanograms per cubic meter of stack gas, i.e. 13% of the French and E.U. allowable standard for dioxin emissions. The total WTE capacity (at an assumed 90% overall plant availability) was about 15.3 million tons. The actual tonnage processed in French WTE facilties in 2008 was about 12.5 million tons. At an assumed process gas generation of 5000 Nm3 per ton MSW, the total dioxin emission of the French WTE industry in 2008 amounted to 1 gram TEQ.

3
Addendum: List of French WTE plants, capacities, 2008 dioxin emissions (N.J. Themelis, November 24, 2010)
Plant NAME, location (start‐up year of each unit)
Capacity tons/y
Dioxins, ng TEQ/Nm3
ANGERS GEVAL, Sainte Gemmes s/Loire (1974, 1974, 1974) 118,000 0.005ANGOULEME, Charentes, Angoulême (1986) 33,000 0.000ANNECY, Chavanod (1986, 1994, 2001) 128,000 0.004ANTIBES, Antibes, Alpes Maritimes (1970, 1970) 150,000 0.027ARCANTE, Blois (2000, 2000) 87,000 0.010ARGENTEUIL, Argenteuil, IdF (1975, 1975, 1998, 2006) 307,000 0.014AUREADE, Chalons sur Marne (2006) 99,000 0.004AVIGNON, Avignon, Vedène (1995, 1995, 1996) 142,000 0.032BAYET RONAVAL, Bayet (1982, 1988) 71,000 0.007BELFORT BOUROGNE, Belfort (2002, 2002) 98,000 0.009BELLEGARDE, Bellegarde s/Valserine (1998, 1998) 126,000 0.140BENESSE‐MAREMNE, Benesse‐M., Landes (1972, 1985) 59,000 0.006BESANCON SNC BIVAL, Besançon (1976, 2002) 55,000 0.002BESSIERES, Bessières (2000, 2000) 180,000 0.016BORDEAUX, Bègles (1998, 1998, 1998) 260,000 0.008BORN, Pontenx‐les‐Forges (1997) 42,000 0.001BOURG D'OISANS RONAVAL, Bourg d'oisans, Livet (1998) 20,000 0.002BOURG SAINT MAURICE CORREZE, Bellentre (1991) 26,000 0.002BOURGOIN JALLIEU RONAVAL, Bourgoin J. (1986,1995) 87,000 0.014BREST GEVAL, Brest (1988, 1988) 142,000 0.001BRIEC, Briec de l'Odet (1996, 1996) 32,000 0.008BRIVE, Saint‐Pantaléon‐de‐Larche (1973, 1973, 1973) 83,000 0.007CAEN, Colombelles (1971, 1972) 126,000 0.006CALCE, Usine de Perpignan, Calce (2003, 2003) 171,000 0.006CARHAIX, Carhaix (1994) 32,000 0.000CARRIERES s/POISSY, Carrieres sous‐Poissy (1998, 1998) 118,000 0.006CARRIERES s/SEINE, Carrières s/Seine, IdF (1977, 1988) 158,000 0.008CENON, Cenon, Gironde (1984, 1984) 126,000 0.002CERGY CGECP, Cergy Pontoise (1995, 1995) 166,000 0.008CHAMBÉRY, Chambéry (1977, 1977, 1996) 114,000 0.002CHARTRES, Mainvilliers (1999, 1999) 118,000 0.014CHATEAUDUN, Chaumont (1976) 27,000 0.006CHAUMONT SHMVD, Chaumont (1998, 1998) 79,000 0.002CHEDDE‐PASSY, Passy (1995) 59,130 0.001CHINON, INOVA, Saint‐Benoît‐La‐Forêt (1983) 22,000 0.001CLUSES, Cluses Marignier (1991) 39,000 0.000COLMAR, Colmar (1988, 1988) 95,000 0.010CONCARNEAU GEVAL, Concarneau (1989, 1989) 61,495 0.005DIEPPE, Rouxmesnil‐Bouteilles (1971, 1971) 29,000 0.008DIJON UICA, Dijon (1974, 1974) 181,000 0.002DOUCHY, Douchy les Mines, Nord (1977, 1977) 88,000 0.002ESIANE, Villers‐Saint‐Paul, Ile de France (2004, 2004) 173,448 0.003EVREUX, sud de l'Eure, Guichainville (2003, 2003) 88,000 0.004GIEN, Gien, Loiret (1999, 1999) 79,000 0.006GRENOBLE, Grenoble, Tronche (1974, 1974, 1996) 195,000 0.025

4
Addendum: List of French WTE plants, capacities, 2008 dioxin emissions (N.J. Themelis, November 24, 2010)
HAGUENAU, Schweighouse s/Moder (1990, 1990) 79,000 0.005HALLUIN, Halluin (2000, 2000, 2000) 343,000 0.031HENIN‐BEAUMONT, Henin‐Beaumont (1972, 1974) 95,000 0.007ISSEANE, Issy‐les‐Moulineaux, Paris (2008, 2008) 481,000 0.062IVRY, Ivry sur Seine, Val de Marne, IdF (1969, 1969) 788,000 0.063LA ROCHELLE SETRAD, Rochelle (1988, 1988) 63,000 0.002LABEUVRIÈRE, Labeuvrière, Pas de Calais (1979, 1979, 1979) 158,000 0.002LAGNY, St Thibault des Vignes (1985, 1995) 158,000 0.010LAMBALLE, Planguenoual (1993) 47,000 0.005LASSE, Lasse. Salamandre (2004) 99,000 0.001LE MANS SEC, Le Mans (1973, 1991, 2003) 229,000 0.005LIMOGES, Limoges (1989, 1989, 1992) 118,000 0.020LONS‐LE‐SAUNIER, Lons‐le‐Saunier (1994) 39,000 0.011LUNEL, Lunel‐Viel (1999, 1999) 126,000 0.003LYON NORD, Rillieux (1989, 1989) 189,000 0.010LYON SUD, Lyon (1989, 1989, 1989) 284,000 0.005MANTES, Guerville (1997, 1997, 1997) 95,000 0.004MARTINIQUAISE, Fort de France (2002) 110,000 0.009MASSY, Massy (1985, 1986) 87,000 0.011MAUBEUGE, Maubeuge (2001, 2001) 87,000 0.001MELUN, Vaux‐le‐Penil (2003, 2003) 126,000 0.010MESSANGES, Messanges (1976) 24,000 0.001METZ, Metz (2001, 2001) 126,000 0.004MONTARGIS, Amilly (1969) 22,000 0.003MONTAUBAN, Montauban (1986) 39,000 0.002MONTERAU, Monterau Fault Yonne (1973) 25,000 0.004Monthyon, Monthyon (1998, 1998, 1998) 142,000 0.106MONTVALOR, Montbéliard (1988, 1988) 63,000 0.005Mourenx, Mourenx (1990) 16,000 0.006MULHOUSE, Sausheim, Nord‐es, Haut Rin (1999, 1999) 166,000 0.099NANCY ENERGIE, Ludres (1995, 1995) 126,000 0.012NANTES ARC EN CIEL, Nantes (1987, 1987) 130,000 0.007NANTES, Couëron (1994, 1994) 89,000 0.019NEVERS SONIRVAL, Nevers, Fourchambault (2002) 47,000 0.005NICE SONITHERM, Nice (1977, 1977, 1982, 1998) 426,000 0.014NIMES EVOLIA, Nîmes (2004) 110,000 0.004NOYELLES SOUS LENS, Noyelles s. L., Pas de Calais (1973) 106,000 0.030PAILLE, Surgères (1981) 28,000 0.004PAU, Sud‐Ouest, Lescar, Pyrenees Atlantique (1987, 1990) 87,000 0.008PITHIVIERS, Pithiviers (1985) 26,000 0.008PLOUHARNEL, Plouharnel (1971) 33,000 0.004PLUZUNET VEOLIA, Pluzunet (1997) 55,000 0.002POITIERS SETRAD, Poitiers (1984, 1984) 63,000 0.006PONTARLIER, Pontarlier (1989) 39,000 0.001PONTCHARRA RONAVAL, Pontcharra (1977) 22,000 0.002PONTIVY, Pontivy (1990) 32,000 0.000

5
Addendum: List of French WTE plants, capacities, 2008 dioxin emissions (N.J. Themelis, November 24, 2010)
PONTMAIN, Pontmain (1983, 2003) 55,000 0.001RAMBERVILLIERS SOVVAD, Rambervillers (1983, 1983, 2002) 102,000 0.099RAMBOUILLET, Ouarville (2000, 2000) 126,000 0.004REIMS REMIVAL, Reims (1989, 1989) 102,000 0.015RENNES SOBREC, Rennes (1968, 1968, 1996) 142,000 0.006ROCHEFORT SETRAD, Echillais (1990) 39,000 0.001ROSIER D'EGLETONS, Rosier d'Egletons (1997) 42,000 0.002ROUEN SNV VESTA, Grand Quevilly (2000, 2000, 2000) 343,000 0.072RUNGIS SOTRIS, Rungis (1985, 1985) 134,028 0.012SAINT OUEN, Saint Ouen (1990, 1990, 1990) 662,000 0.095SAINT‐JEAN‐D. F., Saint‐Jean‐d. F. (1970, 1975) 126,000 0.004SARAN, Saran (1995, 1995) 110,000 0.005SARCELLES, Sarcelles (1978, 1978) 158,000 0.010SENS, Sens (1988) 24,000 0.006SETE SETOM, Sète (1992) 44,000 0.005ST PIERRE D'OLÉRON, St Pierre d'oléron (1974, 1974) 79,000 0.009STRASBOURG, Strasbourg (1975, 1975, 1975, 1975) 356,000 0.018SYTEVOM, Noidans‐le‐Ferroux (2007) 79,000 0.001TADEN, Dinan (1998, 1998) 126,000 0.012THIVERVAL GRIGON, Thiverval‐Grignon (1974, 1974, 1993) 275,000 0.050THONON LES BAINS, Thonon les Bains (1988) 39,000 0.000TIGNES RONAVAL, Tignes (1985) 11,826 0.001TOULON, Toulon (1983, 1984, 1984) 300,000 0.010TOULOUSE SETMI, Toulouse Mirail (1969, 1969, 1975, 1997) 315,000 0.002TRONVILLE EN BARROIS, Tronville en Barrois (1983) 32,000 0.004VALENCIENNES, Saint Saulve (1977, 1977, 1977) 130,000 0.003VAULX, Vaux‐le‐Penil (2003, 2003) 126,000 0.007VERNOU‐EN‐SOLOGNE, Vernou‐en‐Sologne (1986) 18,000 0.001VERT LE GRAND, Vert le Grand (1999, 1999) 221,000 0.016VILLEFRANCE, Villefranche sur Saône (1984, 2002) 87,000 0.013VILLEJUST, Villejust. Ile de France (1972, 1984) 110,000 0.004VITRÉ, Vitré (1988) 32,000 0.002
Total WTE capacity (at 90% plant availabilility): 15,267,927 0.013Number of plants listed: 128E.U. and French standard as of 2002: 0.1 ng TEQ/ Nm3
Average dioxin emission of all WTE: 0.013 ng TEQ/Nm3 2008 Dioxin emissions of all French WTE plants, grams TEQ: 1.01 gram TEQ
6
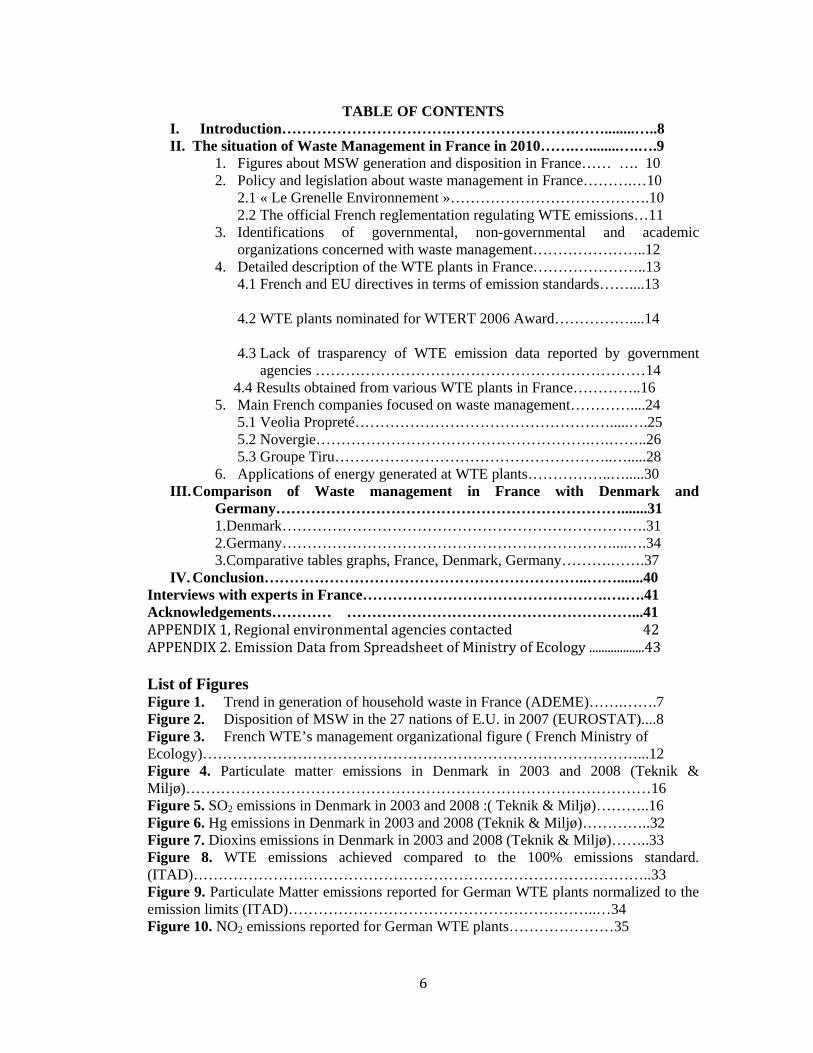
TABLE OF CONTENTS
I. Introduction…………………………….…………………….……........…..8 II. The situation of Waste Management in France in 2010…….…........….….9
1. Figures about MSW generation and disposition in France…… …. 10 2. Policy and legislation about waste management in France……….…10
2.1 « Le Grenelle Environnement »………………………………….10 2.2 The official French reglementation regulating WTE emissions…11
3. Identifications of governmental, non-governmental and academic organizations concerned with waste management…………………..12
4. Detailed description of the WTE plants in France…………………..13 4.1 French and EU directives in terms of emission standards……....13
4.2 WTE plants nominated for WTERT 2006 Award……………....14
4.3 Lack of trasparency of WTE emission data reported by government
agencies …………………………………………………………14 4.4 Results obtained from various WTE plants in France…………..16
5. Main French companies focused on waste management…………....24 5.1 Veolia Propreté…………………………………………….....….25 5.2 Novergie……………………………………………….….……..26 5.3 Groupe Tiru………………………………………………..….....28
6. Applications of energy generated at WTE plants……………..….....30 III. Comparison of Waste management in France with Denmark and
Germany…………………………………………………………….......31 1.Denmark……………………………………………………………….31 2.Germany…………………………………………………………....….34 3.Comparative tables graphs, France, Denmark, Germany……….…….37
IV. Conclusion………………………………………………………..…….......40 Interviews with experts in France………………………………………….….….41 Acknowledgements………… …………………………………………………...41 APPENDIX 1, Regional environmental agencies contacted 42 APPENDIX 2. Emission Data from Spreadsheet of Ministry of Ecology ..................43 List of Figures Figure 1. Trend in generation of household waste in France (ADEME)…….…….7 Figure 2. Disposition of MSW in the 27 nations of E.U. in 2007 (EUROSTAT)....8 Figure 3. French WTE’s management organizational figure ( French Ministry of Ecology)……………………………………………………………………………...12 Figure 4. Particulate matter emissions in Denmark in 2003 and 2008 (Teknik & Miljø)…………………………………………………………………………………16 Figure 5. SO2 emissions in Denmark in 2003 and 2008 :( Teknik & Miljø)………..16 Figure 6. Hg emissions in Denmark in 2003 and 2008 (Teknik & Miljø)…………..32 Figure 7. Dioxins emissions in Denmark in 2003 and 2008 (Teknik & Miljø)……..33 Figure 8. WTE emissions achieved compared to the 100% emissions standard. (ITAD)………………………………………………………………………………..33 Figure 9. Particulate Matter emissions reported for German WTE plants normalized to the emission limits (ITAD)……………………………………………………..…34 Figure 10. NO2 emissions reported for German WTE plants…………………35

7
Figure 11. SO2 emissions reported for German WTE plants normalized to the emission limits (ITAD)………………………………………………………………36 Figure 12. Mercury emissions reported for German WTE plants normalized to the emission limits (ITAD)………………………………………………………………36 List of Tables Table 1. Disposition of MSW in E.U. nf2007 …………………………………..9 Table 2. Average emissions of the nominated WTE plants for the WTERT 2006 f 12 Table 3. Location, capacity, and year of construction of French WTE units 15ocation Table 4. ffff Emissions of two Novergie WTE plants (Novergie website)……….21 Table 5. ggg2010 list of operating Novergie plants …………………………….24 Table 6. ggList of Tiru plants 26 Table 7. Overview of the main characteristics of WTE plants in Denmark (from vvvvvvvvvvTeknik & Miljø: Affald-Reform)…………………………………….. 27 Table 7. WTE German standards and emiison values in 2007 …………………... 30 Table 8. Average yearly emissions of all French plants………... 32

8
I. Introduction
Fifty million tons of municipal solid waste (MSW) were generated in 2006 in France according to the ADEME, the French Environmental and Energy Agency. The annual production of MSW has been stabilized in the past five years. However, a the population of France continues to grow, there will be more and more waste produced. According to Eurostat statistics, 18% of the French MDSW is recycled, 15% is composted, 32% is incinerated and 36% is landfilled. In 1993, there were about 300 incinerators (WTE plant) in France, some of which had a very small capacity. Today, there are 128 incinerators operating. This includes 110 plants with energy production and 18 without energy production.
Incinerators, called Waste-to-Energy (WTE) in the U.S. and E.U. reduce the volume of municipal solid waste by about 90%, by burning it. Also, electrical energy is generated by the combustion of this waste and, in addition, thermal energy can be recovered and used for district heating. Incinerators can also burn dangerous waste, such as chemical products, that otherwise may pollute the soil in which they are landfilled.
Despite the fact that one thrid of the French MSW is processed in incinerators,t there is a fear about WTE technology in France. This is expressed clearly in the Grenelle Environnement, the French political guideline for environmental and energy policy that was written in 2007 (Grenelle Environnement’s website):
“The place of incineration in the politics of waste management in France has been a source of long debates but there are still widely divergent positions. A significant decrease in the quantities incinerated and stored is desired by some groups, this decrease should be reflected, for some in a halt in new incineration projects.” The above excerpt clearly shows that the French opinion about incinerators is largely divergent and that some people are strictly opposed to the construction of new incinerators. There is no precise measure that deals with further development of waste to energy plants because the community is afraid of them.(as if they were scaring the French community). . There are several possible reasons for the poor opinion of WTE in France. First, there is a lack of adequate communication from either the WTE industry or government agencies regarding WTE technology and practices to the French population. Therefore, incineration appears as something hazardous, scary and unnecessary. Second, there may be some WTE plants that do not comply with the EU emission standards, especially in the case of small plants that would require a relatively large amount of money for their Air Pollution Control (APC) systems to be retrofitted to comply with European and also French regulations. In the past, there was a major concern about health effects of WTE, due to to a high incidence of cancers next to some incinerators that were emitting high concentrations of pollutants. An article published by ADEME in 2000 (http://www.ademe.fr/htdocs/publications/lettre/63/63technique.htm) reported that it would cost 700 million Francs (120 million euros approximately) to modernize the Air Pollution Control (APC) system of MSW incinerators of a capacity of more than 150 tons per day. Therefore, it is possible that many incinerators have not been upgraded to modern emission control standards.
The main objective of this study is to collect precise and up-to-date data about all the operating WTE plants in France and to determine whether some of them are still not complying with the European standards in terms of emissions. It is possible that the French WTE industry may still include some small plants that have not retrofitted their

9
control systems to E.U standards and therefore have relatively high emissions. This may be a reason why the French have such a bad impression of WTE plants.
In view of the positive attitude of the Danish and German public towards WTE, this thesis also compares French environmental monitoring and reporting WTE emissions with the corresponding practice in Denmark and Germany.
II. The situation of Waste management in France inl2010
This section, describes how the Waste to Energy plants are organized in France. It discusses, the governmental entities that h are monitoring WTE emisions, the French regulations regarding allowable emission concentrations of various contaminants in the WTE stack gas, and other information about this sector.
II. 1. Figures about MSW generation and disposition in France
According to the Agence de l’Environnement et de la Maîtrise de l’Energie (ADEME), the French Environmental and Energy Agency, 868 millions tons of all kinds of wastes (industrial, agricultural, etc.) were generated during the year 2006 (Les Déchets en chiffre, ADEME Edition 2009). This amount included 50 million tons of municipal solid waste. The amount of MSW produced solely by households was estimated to 20 million tons (about 354 kg per capita in 2008 Source : http://europa.eu/rapid/pressReleasesAction.do?reference=STAT/10/43&format=HTML&aged=0&language=EN&guiLanguage=en). The rest accounted for waste from local communities, bulky waste, and the waste gathered with MSW. Figure 1 shows a stabilization in the annual generation of household waste per inhabitant around the years 2000. In 2008, the amount of MSW generated in Frnace was equal to 543 kg per capita.
Figure 1. Trend in generation of household waste in France fffffffff Source: Ademe (Les Déchets en chiffre, ADEME Edition 2009)

10
Figure 2. Disposition of MSW in the 27 nations of E.U. in 2007 fffffff f (Source : EUROSTAT)
Figure 2 shows the four principal methods used for disposing of municipal solid waste among the 27 European states in 2008. The blue color represents the percentage that is landfilled. The green represents the amount that is composted, the red represents the amount incinerated and the purple the amount recycled.
This graph shows that northern countries, such as Denmark, Sweden, the Netherlands, and Germany, are the most advanced in terms of environmental management of municipal solid waste; they landfill less than 5% of the total MSW generated. Germany is the best in terms of recycling policy with a recycling percentage over 40%.
France is doing better than many other E.U. nations but, in 2008, it still landfilled 36% of its MSW, incinerated 32%, composted 15% and recycled 18%.
Table 1 shows the data used in Figure 2. It has ranked the different countries from the most «environmentally friendly», in terms of waste management practice, to the least.

11
Table 1. Disposition of MSW in the 27 nations of E.U. in 2007 (Source : EUROSTAT)
Landfilled Incinerated Composted Recycled
Municipal waste
generated, kg per person
EU27 40 20 17 23 524 Germany 1 35 17 48 581 Netherlands 1 39 27 32 622 Sweden 3 49 13 35 515 Austria 3 27 40 29 601 Denmark 4 54 18 24 802 Belgium 5 36 25 35 493 Luxembourg 19 36 20 25 701 France 36 32 15 18 543 Italy 44 11 34 11 561 Finland 50 17 8 25 522 United Kingdom
55 10 12 23 565
Spain 57 9 20 14 575 Ireland 62 3 3 32 733 Portugal 65 19 8 9 477 Slovenia 66 1 2 31 459 Hungary 74 9 2 15 453 Estonia 75 0 8 18 515 Greece 77 0 2 21 453 Slovakia 83 10 5 3 328 Czech Republic
83 13 2 2 306
Cyprus 87 0 0 13 770 Poland 87 1 4 9 320 Latvia 93 0 1 6 331 Lithuania 96 0 1 3 407 Malta 97 0 0 3 696 Romania 99 0 0 1 382 Bulgaria 100 0 0 0 467
II. 2. Policy and Legislation about waste management in France
II.2.1 « Le Grenelle Environnement »
« Le Grenelle Environnement » consists of series of political meetings that were organized in France in October 2007 where influential people met to to disucss and decidem onn French long-term policies regarding environmental issues and sustainable development. The « Grenelle » was announced on May 18th 2007 by Alain Juppé, the French minister of Ecology at that time. This particular « Grenelle » brought togetherd politicians, professional organizations, and NGOs to consider how to deal with present and future challenges in terms of environmental issues.
With regard to the subject of this thesis, it is interesting to review the concrete measures taken with regard to solid waste management in France, as stated explicitly in the published results of the« Grenelle ». (Grenelle Environnement’s website) There was a report describing conclusions reached as to what kind of measures were proposed in terms of waste management. The first main goal discussed was the prevention of waste: «Reducing the waste produced and developing recycling ». The second goal was to ensure a « Clear reduction in the health and environmental impacts of waste management

12
policies ». This was to be achieved by prioritizing the evaluation of the environmental and health impacts of waste management policies (i.e. the waste management hierarchy). The third goal was to «raise awareness and (provide) information to the French citizens ». The author will return later to this third point as it is a major reason why incineration has had such a bad reputation in France over the past years.
The fourth and final goal dealt with the position of incineration. What emrged from the « Grenelle » was the highly ambiguous statement that «there are divergent opinions on that matter and no concrete objective has been fixed by the Grenelle ». The Grenelle noted that the “place of incineration in the politics of waste management in France has been a source of long debates but there are still widely divergent positions. A significant decrease in the quantities incinerated and stored is desired by some groups, this decrease would be reflected for some in a halt in new incineration projects.”
It can be seen that the “Grenelle Environnement” focused on prevention and recycling and did nolt take any clear position on incineration/WTE, despite the fact that 34% of the French MSW is combusted in 110 WTE and 18 incinerator plants.
Furthermore, , the “Grenelle” provided numerical targets for increasing recycling and decreasing incineration.
- Reducing the amount of household waste produced by 7% during the next 5 years.
- Increasing recycling to a rate of 35% in 2012 and 45% in 2015 for household garbage, as compared with 24% in 2004.
- Reducing the amount of waste going to incineration or landfilling by an average of about 15% before 2012. This measure gives time to the concerned actors to deal with their waste management policies.
In summary, the Grenelle, contrary to what is happening in the most advanced EU nations (Table 1), did not indicate that WTE is an environmentallypreferable technology to landfilling. In fact, it treated both WTE and landfilling as undesirable technologies. This left a vacuum in attaining sustainable waste management in France, since international experience has shown that it is impossible to reduce landfilling appreciably, in the absence of WTE (Table 1, Figure 2).
It is interesting to note that despite the negative image imparted by « Grenelle » on WTE, one of the largest and most important WTEs in the world, the Isseane plant in Paris, started operations in 2008 in the heart of the most visited city and five kilometers from the Eiffel Tower.
II.2.2 The official French reglementation regulating WTE emissions
The official text regulating the WTE plants’ emissions was issued bythe French Ministry of Ecology on March 17, 2005 (Ineris website). It defines the requirements and emission standards that must be met by WTE plants. These standards are presented in another section of trhis report.
II.3 Identification of governmental, non-governmental and academic organizations concerned with waste management

13
In this section, we will describe government agencies concerned with waste management in France.
Figure 3 on the next page explains schematically how are the emissions monitored :
France is divided into 22 Regions. Each WTE plant reports annually its emissions to a DREAL (Direction Régionale de l’Environnement, de l’Aménagement et du logement) which represents the French Ministry of Ecology at at the regional level.
Figure 3, French WTE’s management organizational figure fffffffffffffffffffffffff(Source :French Ministry of Ecology)
Each DREAL then reports the emissions of all the WTE plants in its region to the DPPR (Direction de la Prévention des Pollutions et des Risques), an agency that monitors and prevents every pollution risk associated to a given activity through the authority of the Ministry of Ecology.
The IREP (Registre Français des émissions polluantes) is supposed to publish all the declarations of emissions sent to the DREALs at a unique website. The E-PRTR (European Pollutant Release and Transfer Register) gathers the same kind of data on a European scale.
The ADEME (Agence de l’Environnement et de la Maîtrise de l’Energie) is a public institution placed under the authority of both the Ministry of Ecology and the Ministry of Education and Research. It is supposed to implement the public policies in the field of Environment, Energy, and Sustainable Development. This agency advises and provides its expertise to companies, citizens, cities or any other entites that need to improve their environmental performance. The ADEME also helps in financing various projects in the fields of waste management, soil preservation, energy efficiency, sustainable energies, air quality, and noise prévention. This agency had 930 employees in 2009 and its overall budget is 832 million euros.
The INERIS (Institut National de l’Environnement industriel et des Risques) is a public institution placed under the authority of the Ministry of Ecology. Its mission is to conduct

14
research and studies aiming to help preventing any risk that economic activities might induce. The organization had over 580 employees in 2009, including 336 engineers, researchers, and executives and its overall budget is 60 million euros.
The SVDU (Syndicat national du traitement et de la Valorisation des Déchets urbains et assimilés) rallies all the different players in the field of waste management in France. Its website gives information about the different WTE plants and about the technology in general.
II.4 Detailed description of the WTE plants in France
This section the operating WTE facilities in France and also what they currently achieve with regard to the principal emissions: Particulate Matter, SO2, NOx, Total Organic Compounds (TOC), CO, Mercury, and dioxins. In a later section, these results are compared with E.U. and French regulations, as well with the levels of emissions obtained by the WTE industries in Denmark and Germany.
II.4.1 French and EU directives in terms of emission standards
The French regulation for WTE emissions is is the official ordinance of the French Ministry of Ecology, issued on March 17th 2005 (Ineris Website). The European Directive on WTE emissions is the official document published by the European Parliament on December 28th 2000. The French and European Regulations have been fully harmonized over the past years.
II.4.2 WTE plants nominated for WTERT 2006 Award
Table 3 compares the emissions of ten WTE plants that were nominated for the WTERT 2006 Award for "one of the best WTEs in the world" to the E.U. standards: ASM in Brescia, SYSAV in Malmo, AEB in Amsterdam, Veolia SELCHP in London, Montenay in Montgomery, Covanta in Montgomery, Montenay in York, Spittelau in Vienna, and Umea in Sweden.
Table 2. Average emissions of the WTE plants that were nominated to the WTERT 2006 Award Source : www.wtert.org)
Average of all ten WTEs
EU Standard Average as % of EU standard
Emissions in mg/Nm3
Particulate matter 3.09 10 31%
SO2 6.8 50 14%
NOx 129 200 65%
TOC 1.02 10 10%
CO 21.9 50 44%
Mercury 0.01 0.05 15%
Dioxins (ng 0.02 0.1 24%

15
TEQ/Nm3)
II.4.3 Lack of trasparency of WTE emission data reported by government agencies
Before presenting and analysing the results obtained from the different WTE plants in France, it should be stressed that it was very difficult to obtain these numbers. Indeed, there is not a single website where the emissions can be easily found for every year and every operating WTE.
The French official website of the IREP, or Registre français des émissions polluantes sur Internet, which is expected to reference those emissions is not at all up to date. For example, if one seeks information on the emissions of the Novergie WTE plant located in Amilly, here is what is provided on the IREP website:
Figure 3. Description of the Novergie WTE plant located in Amilly Source : IREP

16
Figure 4. Emissions of the Novergie WTE plant located in Amilly Source : IREP
It can be seen that the only emissions reported are carbon dioxide and HCFC. Even those data are presented in terms of kilograms per year which makes it difficult to compater with the emission standards that are expressed as emission concentrations. This site is clearly inadequate to show whether the plant is complying with the French emission standards. The major polluttants such as particulate matter, SO2, NOx, total organic compounds, carbon monoxide, heavy metals, and dioxins are not even mentioned.
As norted earlier, each DREAL is supposed to collect and report the emissions from all the incinerators in its Region. However, no such information is provided in their web pages. A request for such information was sent to some DREAL but they replied that this information is available on the IREP website, which clearly is not the case. Some DREALs also proposed that we contact directly the plant in question to get their emission data which is is quite disturbing, since the DREAL is the governmental entity responsible for collecting and reporting the emissions from all the WTE plants in its region.
Therefore, there is clearly a lack of transparency in the governmental reporting of WTE emission data to the public. Further analysis of the emissions of various WTE plants, obtained during this study will provide a a precise insight of the WTE industry in France and will show that there is no reason for not publicizing fully the emissions of WTE facilities in France.
II.4.4 Results obtained from various WTE plants in France
The national waste processing capacity is about 16 million tons of MSWper year. A quick calculation shows that this figure is higher than Eurostat data since there are 63 million people living on French soil and produce 543 kg of MSW per capita. Assuming the Eurostat incineration rate in France of 32%, yields :
63,000,000*543*0.32*(1/1,000,000,000)=11 million tons

17
On the basis of a master file of 60,000 industrial emissions obtained from the Ministry of the Ecology, the author constructed the spreadsheet shown in Appendix 2 this Report. However, the emissions reported by the Ministry of Ecology, and also in the spreadsheet of Appendix 2, are expressed in kg/year. In order to be able to compare these values to the environmental standards that are expressed as concentrations, the author converted these units to ng/Nm3 for dioxins, using the following conversion equation. Here is the detailed calculation :
It is assumed that each WTE in France emits 5000 Nm3 per ton of MSW combusted. Therefore, the concentration of dioxins in the stack gas is :
a1,000g
kg109 ng
g
b 5,000Nm3
ton
where a is the amount of dioxins emitted in kg/year and b is the annual plant’s capacity in tons.
Table 3 shows an up-to-date list of all the units of all operating WTE plants in France as of April 2010.
Table 3. Location, year of construction, and capacity of all operating WTE units in France
Plant Name Plant Location Year of Construction
Plant Capacity (tons/hour)
Plant Capacity (tons/year)
Vernou-en-Sologne Mère 1986 2.3 18216 Messanges Messanges 1976 3 23760 Mourenx Mourenx 1990 2 15840 Ivry 1st plant Paris 1969 50 396000 Ivry 2nd plant Paris 1969 50 396000 Saint Ouen Saint Ouen 1990 28 221760 Saint Ouen Saint Ouen 1990 28 221760 Saint Ouen Saint Ouen 1990 28 221760 Antibes 1st plant Antibes 1970 9.5 75240 Antibes 2nd plant Antibes 1970 9.5 75240 Rouen 2 plant 1 Grand Quevilly 2000 14.5 114840 Rouen 2 plant 2 Grand Quevilly 2000 14.5 114840 Rouen 2 plant 3 Grand Quevilly 2000 14.5 114840 Halluin 1st plant Halluin 2000 14.5 114840 Halluin 2nd plant Halluin 2000 14.5 114840 Halluin 3rd plant Halluin 2000 14.5 114840 Nîmes Nîmes 2004 14 110880 Vert le Grand 1st plant Vert le Grand 1999 14 110880 Vert le Grand 2nd plant Vert le Grand 1999 14 110880 Aureade La Veuve 2006 12.5 99000 Lasse Sivert Lasse 2004 12.5 99000 Lyon Sud 1st plant Lyon 7ème 1989 12 95040 Lyon Sud 2nd plant Lyon 7ème 1989 12 95040

18
Lyon Sud 3rd plant Lyon 7ème 1989 12 95040 Nice 1st plant Nice 1977 12 95040 Nice 2nd plant Nice 1977 12 95040 Nice 3rd plant Nice 1982 12 95040 Nice 4th plant Nice 1998 18 142560 Lyon Nord Rilleux 1989 12 95040 Lyon Nord Rilleux 1989 12 95040 Toulon 1st plant Toulon 1984 12 95040 Toulon 2nd plant Toulon 1984 12 95040 Toulon 3rd plant Toulon 1983 14 110880 Mulhouse 1st plant Sausheim 1999 10.5 83160 Mulhouse 2nd plant Sausheim 1999 10.5 83160 Bessières Bessières 2000 11.4 90288 Bessières Bessières 2000 11.4 90288 Strasbourg Plant 1 Strasbourg 1975 11.3 89496 Strasbourg Plant 2 Strasbourg 1975 11.3 89496 Strasbourg Plant 3 Strasbourg 1975 11.3 89496 Strasbourg Plant 4 Strasbourg 1975 11.3 89496 Bordeaux 1st planst Bègles 1998 11 87120 Bordeaux 2nd plant Bègles 1998 11 87120 Bordeaux 3rd plant Bègles 1998 11 87120 Esiane Villers-Saint-Paul 2004 11 87120 Esiane Villers-Saint-Paul 2004 11 87120 Cergy 1st plant Cergy Pontoise 1995 10.5 83160 Cergy 2nd lpant Cergy Pontoise 1995 10.5 83160 Carrières sur Seine 1st plant
Carrières sur Seine 1977 10 79200
Carrières sur Seine 2nd plant
Carrières sur Seine 1988 10 79200
Sarcelles 1st plant Sarcelles 1978 10 79200 Sarcelles 2nd plant Sarcelles 1978 10 79200 Arras Arras 2004 3.3 26136 Thivernal-Grignon 1st plant Thivernal-Grignon 1974 10.1 79992 Thivernal-Grignon 2nd plant Thivernal-Grignon 1974 10.1 79992 Thivernal Grigon 3rd plant Thivernal-Grignon 1993 14.7 116424 Toulouse 1st plant Toulouse Mirail 1969 10 79200 Toulouse 2d plant Toulouse Mirail 1969 8 63360 Toulouse 3rd plant Toulouse Mirail 1975 8 63360 Toulouse 4th plant Toulouse Mirail 1997 14 110880 Nantes (1st plant) Nantes 1987 9.5 75240 Nantes (2nd plant) Nantes 1987 9.5 75240 Dijon 1st plant Dijon 1974 11.5 91080 Dijon 2nd plant Dijon 1974 11.5 91080 Brest 1st plant Brest 1988 9 71280 Brest 2nd plant Brest 1988 9 71280 Rungis 1st plant Rungis 1985 8.5 67320 Rungis 2nd plant Rungis 1985 8.5 67320 Bellegarde sur Valserine 1s t plant 1998 8 63360 Bellegarde sur valserine 2nd plant
Bellegarde sur valserine 1998 8 63360
UIOM de Cenon 1st plant Cenon 1984 8 63360 UIOM de Cenon 2nd Cenon 1984 8 63360

19
plant Grenoble 1st plant Grenoble 1974 8.25 65340 Grenoble 2nd plant Grenoble 1974 8.25 65340 Grenoble 3rd plant Grenoble 1996 8.25 65340 Nancy energie 1st plant Ludres 1995 8 63360 Nancy energie 2nd plant Ludres 1995 8 63360 Lunel 1st plant Lunel-Viel 1999 8 63360 Lunel 2nd plant Lunel-Viel 1999 8 63360 Rambouillet 1st plant Ouarville 2000 8 63360 Rambouillet 2nd lpant Ouarville 2000 8 63360 Saint-Jean-De-Folleville 1st plant
Saint-Jean-De-Folleville 1970 8 63360
Saint-Jean-De-Folleville 2nd plant
Saint-Jean-De-Folleville 1975 8 63360
Lagny 1st plant St Thibault des Vignes 1985 8 63360
Lagny 2nd plant St Thibault des Vignes 1995 12 95040
Melun 1st plant Vaulx-le-Penil 2003 8 63360 Melun 2nd plant Vaux-le-Penil 2003 8 63360 Caen 1st plant Colombelles 1971 8 63360 Caen 2nd plant Colombelles 1972 8 63360 Argenteuil (1st plant) Argenteuil 1975 7.5 59400 Argenteuil (2nd plant) Argenteuil 1975 7.5 59400 Argenteuil (3rd plant) Argenteuil 1998 9 71280 Argenteuil (4th plant) Argenteuil 2006 15 118800 Carrières-sous-Poissy 1st lant
Carrières sous Poissy 1998 7.5 59400
Carrières-sous-Poissy 2n plant
Carrières sous Poissy 1998 7.5 59400
Chedde-Passy Le Fayet 1995 7.5 59400 Chartres 2 1st plant Mainvilliers 1999 7.5 59400 Chartres 2 2nd plant Mainvilliers 1999 7.5 59400 Nantes 1st plant Coeuron 1994 7 55440 Nantes 2nd plant Coueron 1994 7 55440 Martiniquaise de valorisation 1st plant 2002 7 55440 Martiniquaise de valorisation 2nd plant Fort de France 2002 7 55440 Monthyon 1st plant Monthyon 1998 7 55440 Monthyon 2nd plant Monthyon 1998 7 55440 Monthyon 3rd plant Monthyon 1998 4 31680 Pluzunet Pluzunet 1997 7 55440 Saran 1st plant Saran 1995 7 55440 Saran 2nd plant Saran 1995 7 55440 Dinan 2 1st plant Taden 1998 8 63360 Dinan 2 2nd Plant Taden 1998 8 63360 Noyelles sous lens 1st plant Lens 1973 6.7 53064 Noyelles sous Lens 2nd plant Lens 1973 6.7 53064

20
Nevers Fourchambault 2002 6 47520 Reims 1st plant Reims 1989 6.5 51480 Reims 2nd plant Reims 1989 6.5 51480
Villefranche 1st plant Villefranche sur Saône 1984 4.5 35640
Villefranche 2nd plant
Villefranche sur Saône 2002 6.5 51480
Colmar 1st plant Colmar 1988 6 47520 Colmar 2nd plant Colmar 1988 6 47520 Metz 1st plant Metz 2001 8 63360 Metz 2nd plant Metz 2001 8 63360 Avignon 1st plan Vedène 1995 6 47520 Avignon 2nd plnat Vedène 1995 6 47520 Avignon 3rd plant Vedène 1996 6 47520 Evreux Sud 1st plant Guichainville 2003 5.6 44352 Evreux Sud 2nd plant Guichainville 2003 5.6 44352 Lamballe Planguenoual 1993 5.9 46728 Sète Sète 1992 5.6 44352 Blois (1st plant) Blois 2000 5.5 43560 Blois (2nd plant) Blois 2000 5.5 43560 Douchy 1st plant Douchy les Mines 1977 5.5 43560 Douchy 2nd plant Douchy les Mines 1977 5.5 43560 Massy 1st plant Massy 1985 5.5 43560 Massy 2nd plant Massy 1986 5.5 43560 Maubeuge 1st plant Maubeuge 1980 closed in 2002 Maubeuge 2nd plant Maubeuge 1980 closed in 2002 Maubeuge 3rd plant Maubeuge 2001 5.5 Maubeuge 4th plant Maubeuge 2001 5.5 43560 Valenciennes 1st plant Saint Saulve 1977 5.5 Valenciennes 2nd plant Saint Saulve 1977 5.5 Valenciennes 3rd plant Saint Saulve 1977 5.5 43560 Born 2 Pontx-les-Forges 1997 5.3 41976 Rosier d'Egletons Rosier d'Egletons 1997 5.3 41976 Gien 1st plant Arrabloy 1999 5 39600 Gien 2nd plant Arrabloy 1999 5 39600 Labeuvrière 1st plant Béthune 1979 5 39600 Labeuvrière 2nd plant Béthune 1979 5 39600 Labeuvrière 3rd plant Béthune 1979 10 79200 Bourgoin Jallieu 1st plant Bourgoin Jallieu 1986 5 39600 Bourgoin Jallieu 2nd plant Bourgoin Jallieu 1995 6 47520 Chaumont 1st plant Chaumont 1998 5 39600 Chaumont 2nd plant Chaumont 1998 5 39600 Pau 1st plant Lescar 1987 5 39600 Pau 2nd lpant Lescar 1990 6 47520 Limoges 1st plant Limoges 1989 5 39600 Limoges 2nd plant Limoges 1989 5 39600 Limoges 3rd plant Limoges 1992 5 39600 Lons-le-Saunier Lons-le-Saunier 1994 5 39600 Cluses/Marignier Marignier 1991 5 39600 Montauban Montauban 1986 5 39600

21
Agen Pessac 1991 5 39600 Pontarlier Pontarlier 1989 5 39600 Rennes 1st plant Rennes 1968 5 39600 Rennes 2nd plant Rennes 1968 5 39600 Rennes 3rd plant Rennes 1996 8 63360
Angers 1st plant Sainte Gemmes sur Loire-Angers 1974 5 39600
Angers 2nd plant Sainte Gemmes sur Loire-Angers 1974 5 39600
Angers 3rd plant Sainte Gemmes sur Loire-Angers 1974 5 39600
Haguenau 1st line Schweighouse sur Moder 1990 5 39600
Haguenau 2nd line Schweighouse sur Moder 1990 5 39600
Thonon les Bains Thonon les Bains 1988 5 39600
Villejust 1st plant Villefranche sur Saône 1972 6 47520
Villejust 2nd plant Villejust 1984 8 63360 Henin-Beaumont 1st plant Henin-Beaumont 1972 6 47520 Henin-Beaumont 2nd plant Henin-Beaumont 1974 6 47520 Chambéry 1st plnat Chambéry 1977 4.2 33264 Chambéry 2nd plant Chambéry 1977 4.2 33264 Chambéry 3rd plant Chambéry 1996 6 47520 Annecy 1st plant Cran Gevrier 1986 4.2 33264 Annecy 2nd plant Cran Gevrier 1994 6 47520 Annecy 3rd plant Cran Gevrier 2001 6 47520 Angoulême La Couronne 1986 4.2 33264 Plouharnel Plouharnel 1971 4.2 33264 Belfort 1s tplant Bourogne 2002 6.2 49104 Belfort 2nd plant Bourogne 2002 6.2 49104 Briec 1st plant Briec de l'Odet 1996 2 15840 Briec 2nd plant Briec de l'Odet 1996 2 15840 Carhaix Carhaix 1994 4 31680 La Rochelle 1st plant La Rochelle 1988 4 31680 La Rochelle 2nd plant La Rochelle 1988 4 31680 Montbéliard 1st plant Montbéliard 1988 4 31680 Montbéliard 2nd plant Montbéliard 1988 4 31680 Pontivy Pontivy 1990 4 31680
Bayet 1st plant Saint Pourcain sur Sioule 1982 4 31680
Bayet 2n plant Saint Pourcain sur Sioule 1988 5 39600
tronville en Barrois tronville en Barrois 1983 4 31680
Vitré Vitré 1988 4 31680 concarneau 1st plant Concarneau 1989 3.9 30888 Concarneau 2nd plant Concarneau 1989 3.9 30888 Brive 1st plant Brive la Gaillarde 1973 3.5 27720 Brive 2ndplant Brive la Gaillarde 1973 3.5 27720 Brive 3rd plant Brive la Gaillarde 1973 3.5 27720 Paille Surgères 1981 3.5 27720 Chateaudun Chateaudun 1976 3.4 26928

22
Bourg Saint Maurice Bellentre 1991 3.3 26136 Mantes 1st plant Guerville 1997 4 31680 Mantes 2nd plant Guerville 1997 4 31680 Mantes 3rd plant Guerville 1997 4 31680 Poitiers 1st plant Poitiers 1984 4 31680 Poitiers 2ns plant Poitiers 1984 4 31680 Pithiviers Pithiviers 1985 3.25 25740 Monterau Fault Yonne
Monterau Fault Yonne 1973 3.2 25344
Pontmain 1st plant Pontmain 1983 3 23760 Pontmain 2nd plant Pontmain 2003 4 31680 Benesse Maremne 1st plant Benesse-Maremne 1972 3 23760 Benesse Maremne 2nd plant Benesse-Maremne 1985 4.5 35640 Besançon 1st plant Besançon 1976 3 23760 Besançon 2nd plant Besançon 2002 4 31680 Dieppe 1st plant Dieppe 1971 2.5 19800 Dieppe 2nd plant Dieppe 1971 2.5 19800 Epinal 1st plant Rambervillers 1983 3.5 27720 Epinal 2nd plant Rambervillers 1983 3.5 27720 Epinal 3rd plant Rambervillers 2002 6 47520 Sens Sens 1988 3 23760 Montargis Amilly 1969 2.8 22176 Pontcharra Pontcharra 1977 2.7 21384 Créteil 1st lpant Créteil 2000 15 118800 Créteil 2nd plant Créteil 2000 15 118800 Créteil 3r plant Créteil 1994 2 15840 Rochefort 1st plant Echillais 1990 2.5 19800 Rochefort 2nd plant Echillais 1990 2.5 19800 Bourg d'oisans Livet 1998 2.5 19800 St Pierre d'oléron 1st plant St Pierre d'oléron 1974 5 39600 St Pierre d'oléron 2nd plant St Pierre d'oléron 1974 5 39600 Tignes Tignes 1985 1.5 11880 Aurillac Aurillac 1988 1 7920
SYTEVOM Noidans-le-Ferroux 2007 10 79200
SYCTOM Isséane Issy-les-Moulineaux 2010 30.5 241560
SYCTOM Isséane Issy-les-Moulineaux 2010 30.5 241560
UIOM de Brive Saint-Pantaléon-de-Larche 1973 3.5 27720
UIOM de Brive Saint-Pantaléon-de-Larche 1973 3.5 27720
UIOM de Brive Saint-Pantaléon-de-Larche 1973 3.5 27720
UIOM de Calce Plant 1 Calce 2003 11 87120 UIOM de Calce Plant 2 Calce 2003 11 87120 Le mans 1st plant Le Mans 1973 8 63360 Le Mans 2nd plant Le Mans 1991 9 71280 Le Mans 3rd plant Le Mans 2003 12 95040 UIOM Inova Saint-Benoît-La- 1983 2.8 22176

23
Forêt Vaulx 1st plant Vaux-le-Penil 2003 8 63360 Vaulx 2nd plant Vaux-le-Penil 2003 8 63360
Let us now examine some results about the different pollutants’ emissions collected for the different plants.
The official French and European standards have established an upper limit for mercury and heavy metal emssions at, respectively, 0.05 and 0.5 mg/m3. The average mercury and heavy metal emissions in 2006 (see the Excel Spreadsheet in Appendix 2) were 0.014 mg/Nm3
and 0.13 mg/Nm3, both of which are less than one third of the regulatory requirement.
Table 4 shows the emissions of two Novergie WTE facilities :Arcante and Valorena. The Arcante plant is located in Blois and has capacity of 86,500 tons per year whereas the Valoréna WTE has capacityof 140,000 tons per year.
Table 4. Emissions of two Novergie WTE plants Source : Novergie website
Arcante Arcante Valorena Valorena E.U Standard 1st Plant 2nd Plant 1st Plant 2nd Plant EMISSIONS in mg/Nm3 Particulate Matter 0.3 0.29 0.28 0.2 10 SO2 18.8 29.3 0.4 2.9 50 NOx 317.1 287.4 58.5 48.2 200
TOC 0.8 10CO 8.4 9 4 3.4 50 Mercury vvvv0.00095 ffffff0.00083 0.05 Dioxin 1st measurement (ng/Nm3) 0.038 0.038 0.1 Dioxin 2nd measurement (ng/Nm3) 0.018 0.018 0.1
Table 4 shows that with the exception of the NOx standard that was exceeded by Arcante, all other emissions were well below the standards.
On the list below are referenced all the currently operating WTE plants in France. As noted earlier, collecting emission data of French WTEs has been a really difficult job since there are no regional or national websites exclusively dedicated to WTE plants and that provide a list of operating WTE and their emissions in a form that can be easily compared with the national standards. Fortunately there are two national sources that include data on WTE plants and were brought to the attention of the author by Prof. A. Vardelle of the University of Limoges:
http://installationsclassees.ecologie.gouv.fr/
www.pollutionsindustrielles.ecologie.gouv.fr/.
The first one references emissions of all industrial plants in France, without a separate section on WTEs. The WTE data need to be sorted out from a spreadsheet that includes nearly 60,000 rows of emission data. The second provides some plants’ emissions but it is not at all up-to-date. As noted above, a common problem with the reporting of emission

24
data in these sites is that they are in the form of kilograms per year which makes comparison with emission standards, that are reported in mg per cubic meter of stack gas, very difficult. In this study, the kilograms of dioxins reported by the ministry of ecologie were converted to individual emissions for each plant by assuming that the volume of gas generated per ton of MSW combusted at each plant was 5000 standrad cubic meters per ton.
II.5 Main French companies focused on waste management
In this section we will list all the major French companies dealing with waste management in France and abroad.
II.5.1 Veolia Propreté
The first and largest company in France is Veolia Propreté, which is one of the four business lines of Veolia Environnement, the only group worldwide that unites under a single brand all environmental services sectors of water, waste management, energy services and transportation. Veolia Propreté plays a major role in waste management, in the public as well as in the private sector.
http://www.veolia.com/fr/groupe/activites/
Veolia Propreté has realised sales of 10.1 billion euros in 2008, is present in more than 33 countries and has 97,406 employees.
It provides different kinds of services such as :
- Services to local communities : The company’s employees collect the waste produced and transport it to the appropriate structure where it is being processed. The company also has in charge the local communities’ cleanliness and has to maintain this cleanliness as much as possible.
- Services to companies : Veolia Propreté proposes to companies, whatever their size may be, solutions in terms of waste valorization and a set of industrial services associated.
- Treatment and valorization : Veolia Propreté processes and valorizes waste in order to take advantage of it. For example, it can burn waste to produce heating or electricity for surrounding habitants.
- Management of special and hazardous waste : Veolia has an expertise in terms of special and hazardous waste and has a well-known knowledge in terms of this kind of waste management.

25
Veolia Propreté has 852 plants which include 100 WTE plants. It has collected in 2008 more than 45.9 million tons of waste, has processed 66.6 million tons, recycled 12.3 million tons and has sold 5.2 million MWh of electric energy which corresponds to the electric needs of more than 900,000 europeans.
In France in 2008, Veolia Propreté has .. plants It has collected 15,529 ktons, has processed 17,823 ktons and valorized 5072 ktons of waste to produce 1788 GWh of thermal energy and 950 GWh of electric energy.
http://www.veolia-proprete.com/veolia/ressources/files/1/349,chiffres-cles-france-08.pdf
http://www.veolia-proprete.com/apropos/chiffres-cles/
II.5.2 Novergie
Novergie, which is a subsidiary of Suez Environnement (GDF Suez Group) is the second major group in terms of waste management in France. Novergie builds, realises and exploits around 40 WTE plants in France.
Novergie has realised sales of 377 million euros in 2007 and has 1341 employees.
Novergie has been working with local communities on their waste management policy since 1962. It designs, builds and exploits about 40 WTE plants and 6 waste sorting centers.
Novergie focuses on 4 main kind of activities :
- Waste to Energy plants operation : This activity is Novergie’s main one with 39 WTE plants in operation.
- Waste valorization : Novergie operates 6 plants which have a global capacity of 131,500 tons per year. These plants enable to valorize waste. For example, in 2006, 84% of the entering waste has been valorized including 68% of paper, 18% cardboard and 9% plastics. The waste that cannot be valorized are sent to WTE plants to be valorized energetically either to produce heat or electricity.
- Multitype treatment : Novergie provides an «tailor-made » solution given the type of waste it has to valorize and its potential. For example, for a specific waste, it might be more appropriate to incinerate it than to try recycling it and Novergie has the skills to determine the best solution.

26
- Research and Development : The R&D programs at Novergie are established in close cooperation with the French Ministry of Ecology and are based over several years. Many programs engaged are looking at a way to diminish some pollutant’s emission concentrations in order to fit the French and European standards.
Novergie has processed more than 3.9 million tons of waste and sold 701,000 MWh of electric energy in 2006.
Table 5 shows the Novergie WTE plants currently in operation :
Table 5. 2010 list of the operating Novergie plants with their capacity, heat and electricity generated Source : Novergie website
Name of WTE Location Capacity (tons/year)
Heat generated (MWh/year)
Electricity generated
(MWh/year)
Argenteuil Argenteuil 173,000 63,600 100,000
Azalys Carrières-sous-Poissy
115,000 N/A 44,400
Carrières sur Seine Carrières sur Seine
123,000 38,000 10,100
CIE Créteil 225,000 N/A 128,100
Eslane Villiers-St-Paul 157,500 N/A 63,700
Name Location Capacity (tons/year)
Heat generated (MWh/year)
Electricity generated (MWh/year)
Meuse Energie Tronville-en-Barrois
30,000 14,200 N/A
Saint Thibault-des-vignes
St-Thibault-des-vignes
140,000 N/A 70,000
Sausheim Sausheim 165,000 N/A 64,700
Schweighouse Schweighouse 70,000 44,500 9,100
Sovvad Rambervilliers 95,000 1700 38,600
Valoryele Ouarville 120,000 N/A 60,000
Arcante Blois 86,500 1400 45,500
Carhaix Carhaix 30,000 N/A 9,500
Evreux Evreux 90,000 N/A 47,100
Lamballe Planguenoual 42,000 N/A 12,300

27
Montargis Amilly 29,500 0 0
Oréade Saint Jean de Folleville
192,000 N/A 84,400
Orisane Mainvilliers 110,000 N/A 65,500
Sirac (Caen) Colombelles 114,000 89,400 N/A
Smeco Pontmain 54,000 77,000 N/A
Valoréna Nantes 140,000 137,000 N/A
Vitré Vitré 28,000 21,000 1,500
Name Location Capacity (tons/year)
Heat generated (MWh/year)
Electricity generated (MWh/year)
Amétyst Montpellier 203,000 0 30,000
CCUAT Toulon 285,000 14,200 96,900
Juratrom Lons-le-Saunier 37,000 22,000 5,000
Ocréal Lunel-Viel 120,000 N/A 62,600
Pontarlier Pontarlier 37,500 34,000 N/A
SET Faucigny Bellegarde 120,000 N/A 54,800
SET Mont-blanc (Passy)
La Fayet 60,000 N/A 21,300
Valezan Valezan 24,000 0 0
Valorly (Lyon) Rillieux le Pape 180,000 94,000 30,600
Vedène Vedène 205,000 N/A 105,000
Angoulême La Couronne 32,000 0 0
Astria Bègles 273,000 N/A 122,000
Corrèze incinération
Rosier d’Egletons
40,000 N/A 13,400
Econotre Bessières 170,000 N/A 93,000
Montauban Montauban 37,500 18,500 N/A
Pau Lescar 82,000 N/A 20,700
Sogad (Agen) Le Passage 32,000 23,500 N/A

28
Source :www.novergie.fr/page/groupe/groupe-chiffres.php
II.5.3 Groupe Tiru
Groupe Tiru is the third largest waste management group in France. It is co-owned by the EDF group (51%), the GDF Suez group (25%) and Veolia (24%). The Groupe Tiru is specialized in municipal solid waste valorization and produces district heating and electricity. Groupe Tiru has 30 plants worldwide that include 21 WTE plants.
Groupe Tiru focuses on three main kind of activities :
- Thermal valorization by incineration, which produces electricity and heat.
- Biological valorization with the production of biogas and compost.
- Technical engineering amont the division Tiru Ingenierie which provides technical assistance, project management of complete units, and technological eve.
Each year, more than 4.2 million tons of waste are processed. Groupe Tiru has also managed to sell more than 3,660,000 MWh of electricity and heat which corresponds to providing heating to 447,000 habitants. Groupe Tiru has valorized more than 60,000 tons of scrap metal, 620,000 tons of clinker, and has sorted more than 170,000 tons of waste.
The following is a listing of the Groupe Tiru WTE plants in France.
Table 6. 2010 list of the operating Groupe Tiru plants (Source : Groupe Tiru website)
Calais Hénin-Beaumont Pontenx-les-forges Saint-Saulve
Calce (Perpignan) Issy-les-moulineaux (Isseane)
Pontivy Strasbourg (Protires)
Créteil Ivry-Paris XIII Rosiers d’egletons Villefranche-sur-saône
Douchy-les- Mines Mont-de-marsan Saint Barthélémy Villers-saint-paul
Gien Paillé Saint-Ouen

29
II.6 Uses of energy generated at WTE plants
The two main applications of the energy produced by WTE plants are the production of heat for district heating and the production of electricity. In 2009, 3763 GWh of electricity have been produced by energy valorization. WTE production amounts for 3206 GWh, which represented 85% of the total electricity prodution. (Les Déchets en chiffre, ADEME Edition 2009)
The national electricity production in 2009 was 520 TWh, therefore WTE energy valorization amounteed to about 0.7% of the total.
There have been 7348 GWh of thermal energy produced in 2009, and WTE’s production amounts for 6700 GWh, which represents 91%.
The Isséane WTE, for example, is located on the bank of Seine River at Issy-les-Moulineaux of Paris and treats more than 460,000 tons of waste per year and provides district heating.
III. Comparison of Waste management in France with Denmark and Germany
In this final part, we are going to take a look at two foreign examples and models in terms of Waste management in Europe : Denmark and Germany.
We will take a look at the Danish and German laws in terms of Waste management, take a look at a couple of « good » Danish and German plants, and then compare a couple of the data collected with the French data on WTE plants.
III.1 Denmark
In this section, we will present the Danish situation in terms of waste management and the evolution of some major emissions between the year 2003 and 2008.
Danish municipal solid waste represents around 3 million tons per year which is much smaller than the 11 million tons we have in France. Denmark has around 30 plants with an average capacity of 17 tons/hour. (ISWA). Table 7 provides an overview of the Danish WTE plants configuration on a national scale. This table includes 25 WTE plants, exclusively electricity generating ones. It classifies the number of plants with regard to their air pollution control system.
Table 7. Overview of the main characteristics of WTE plants in Denmark gggg gSource : Document from Teknik & Miljø: Affald-Reform, Politik og inspiration
Number of plants
Dioxin removal system
SNCR system for Nox
Capacity tons/year % of capacity
Type of air pollution control system
Dry Scrubber and Bagfilter 2 3 2 216,040 7
Semi‐Dry Scrubber and Bagfilter 6 6 4 648,406 21
Bagfilter and Water Scrubber 3 3 2 728,144 24
Electrofilter and Water Scrubber 7 7 5 538,641 18
Electrofilter and Bagfilter 7 6 4 893,479 30
Total: 25 25 17 3,022,710 100

30
The following figures give the evolution in terms of emissions for a series of pollutants between 2003 and 2008, according to their air pollution control system. ESP+WET+FB stands for Electrofilters, water scrubbers and bagfilters, SD+FB stands for Semi-Dry scrubber and bagfilter and ESP+WET stands for Electrofilters and bagfilter.
The emission standards are those of the European Union, as presented on page 14.
We can see that a huge effort has been made in pollution prevention between those two years as the concentration of pollutant emitted has decreased noticeably.
The most important decrease is for the plants equipped with ESP+WET technologies which represent, according to Table 7, 18% of the overall capacity.
Figure 4 : Particulate matter emissions in Denmark in 2003 and 2008 fffffffffffffffffffffffffffffffffffffSource : Teknik & Miljø
Figure 5 : SO2 emissions in Denmark in 2003 and 2008, fSource : Teknik & Miljø

31
Figure 6 : Hg emissions in Denmark in 2003 and 2008, Source : Teknik & Miljø
Figure 7 : Dioxins emissions in Denmark in 2003 and 2008, Source : Teknik & Miljø

32
III.2 Germany
In this section, we will present the German WTE emissions.. Germany has about 70 WTE plants on its soil with an average capacity of 36 tons/hour. (ISWA). The amount of German municipal solid waste incinerated was about15 million tons per year in 2004
The ITAD website gathers information about WTE management in Germany and was very helpful in building the following tables and charts.
Table 8 gives an insight about the German regulations in terms of WTE plants emissions, and the average values of emissions reported for all the WTE plants in Germany. It can be seen that all values are substantially lower than the national standards. This confirms Germany’s leading position in terms of environmental control of WTE emissions..
Table 8. WTE German standards and 2007 lowest emissions reported in Germany (Source: ITAD)
Daily Values (mg/m3) German standards Lowest values reported Particulate matter 10 0.3 SO2 50 1.35 Nox 200 28.8 TOC 10 0.2 CO 50 6.05 Mercury 0.03 0.001 Heavy metals 0.51 0.0162 Dioxins (ng/Nm3) 0.11 0.00058
Figure 8 shows a graphical representation of the average emissions of all German WTE, expressed as percent of the German standards..
Figure 8. WTE emissions achieved by German WTE plants, presented as percent of the 100% emissions standard. Source : ITAD (1 :PM ; 2 :SO2 ; 3 :NOx ; 4 :TOC ; 5 : CO; 6: Hg; 7 heavy metals; 8: dioxins)

33
The following graph (Figure 9) shows the particulate emissions of individual German plants, vs the E.U. and German standard of 10 mg/Nm3 of dry stack gas. It can be seen that the highest reported emission was only 20% of the standard value of 10 mg/Nm3.
.
Figure 9. Particulate matter emissions reported for German WTE plants vs the German emission standard (Source : ITAD)
Figure 10 shows that all German WTE plants were below the German standard of 200 mg/Nm3. Figures 11 and 12 show that the sulfur dioxide and mercury emissions of all WTEs were substantially lower than the corresponding standards.
Figure 10. NO2 emissions reported for German WTE plants vs the German emission standard (Source : ITAD)
Figure 11. SO2 emissions reported for German WTE plants vs the German emission standard (Source : ITAD)
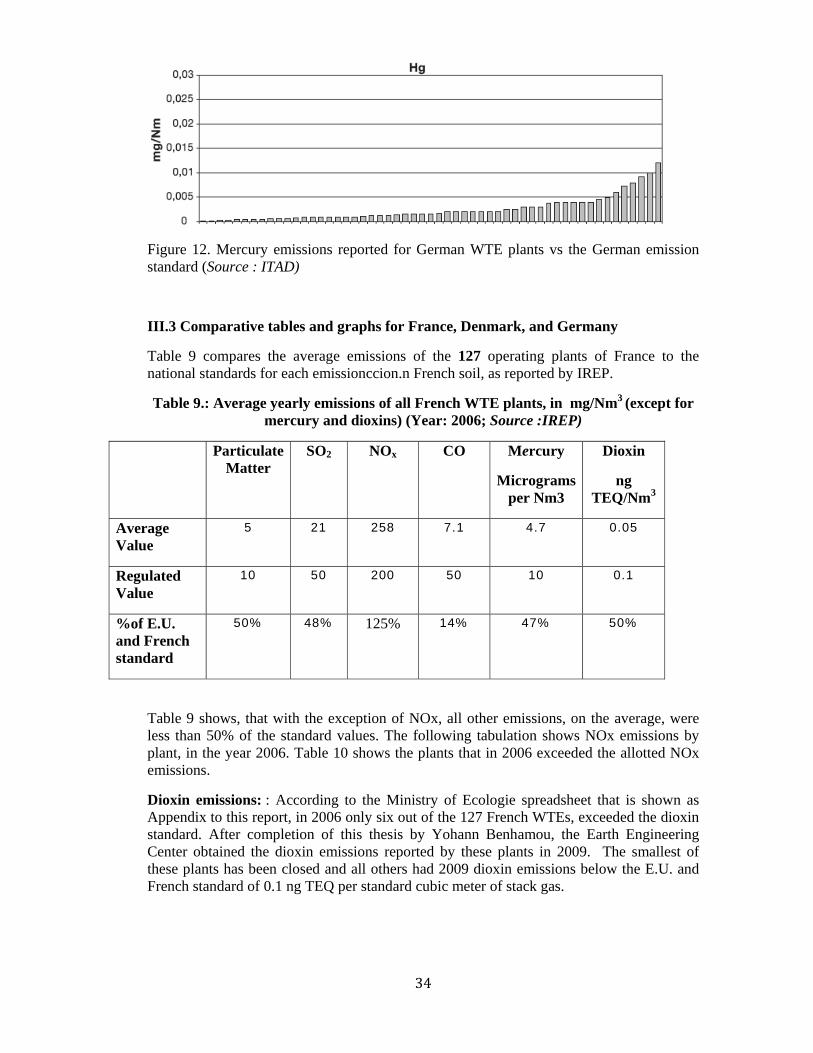
34
Figure 12. Mercury emissions reported for German WTE plants vs the German emission standard (Source : ITAD)
III.3 Comparative tables and graphs for France, Denmark, and Germany
Table 9 compares the average emissions of the 127 operating plants of France to the national standards for each emissionccion.n French soil, as reported by IREP.
Table 9.: Average yearly emissions of all French WTE plants, in mg/Nm3 (except for mercury and dioxins) (Year: 2006; Source :IREP)
Particulate Matter
SO2 NOx CO Mercury
Micrograms per Nm3
Dioxin
ng TEQ/Nm3
Average Value
5
21
258 7.1 4.7 0.05
Regulated Value
10
50
200 50
10
0.1
%of E.U. and French standard
50% 48% 125% 14% 47% 50%
Table 9 shows, that with the exception of NOx, all other emissions, on the average, were less than 50% of the standard values. The following tabulation shows NOx emissions by plant, in the year 2006. Table 10 shows the plants that in 2006 exceeded the allotted NOx emissions.
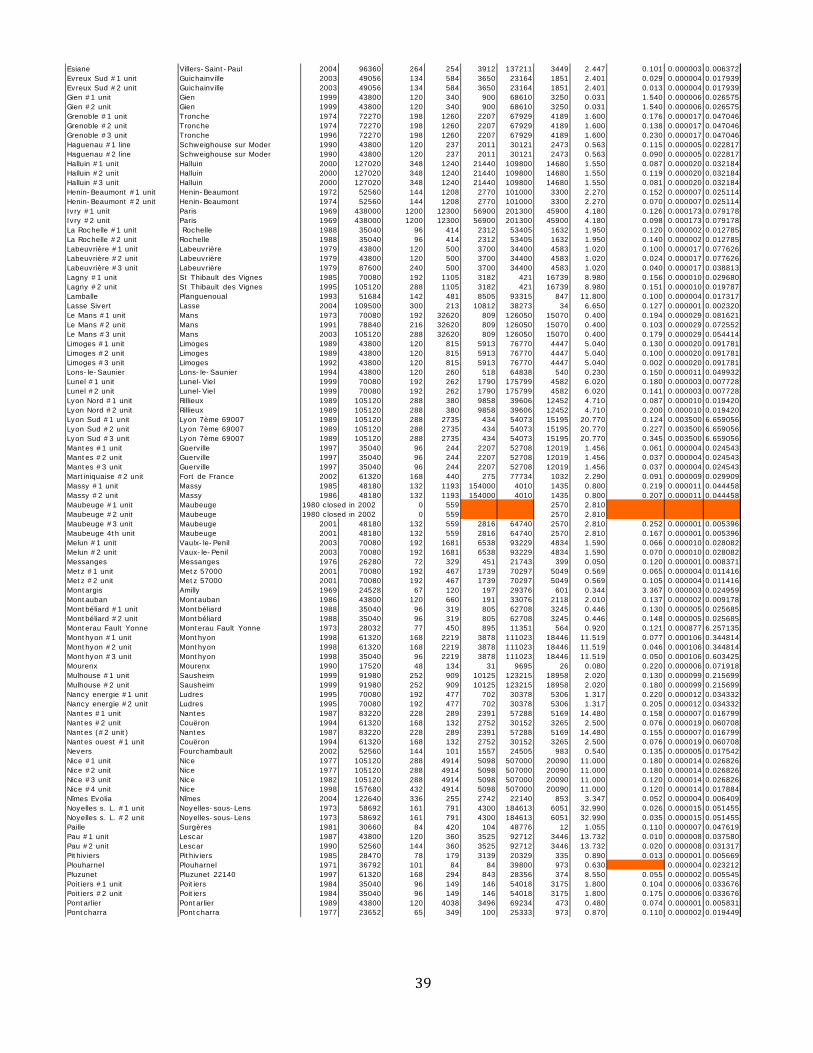
Dioxin emissions: : According to the Ministry of Ecologie spreadsheet that is shown as Appendix to this report, in 2006 only six out of the 127 French WTEs, exceeded the dioxin standard. After completion of this thesis by Yohann Benhamou, the Earth Engineering Center obtained the dioxin emissions reported by these plants in 2009. The smallest of these plants has been closed and all others had 2009 dioxin emissions below the E.U. and French standard of 0.1 ng TEQ per standard cubic meter of stack gas.

35
V. Conclusions
The total tons of MSW combusted in the operating 127 WTE plants of France are 16.1 million tons. All of these plants meet the particulate matter, mercury,dioxins, and all other emission standards of E.U. and France, with the exception of NOx where the average WTE emission is about 20% higher than the standard of 200 mg NOx/Nm3 of stack gas.
A detailed analysis of the 127 French WTE plants showed that in 2006 only six plants exceeded the E.U. standard for dioxin emissions from WTE (0.1 ng TEQ/Nm3). However, as of 2009 all operating WTE plants in France met this standard. The average of dioxin emissions of all French WTE facilities was less than 50% of the French standard, that is less than 0.05 ng TEQ/Nm3. For the 16 million tons of MSW combusted in France annually, the corresponding total amount of dioxins emitted by all French WTE plants in one year is calculated to be only 4 (four) grams TEQ.
This study showed that there is very poor communication to the public and access to information with regard to WTE emissions, in France. This has led to an erroneous perception by the public and the French intelligentsia, as witnessed by the published conclusions of the 2007 Grenelle de l’Environement.
Appendix 1. Interviews and information provided by experts in France
Interview with M. François NICOL, head of the Department « Energétique et Procédés », VEOLIA Environnement Recherche et Innovation
Interview with Ange NZIHOU, head of Research Group on Waste Treatment and Beneficial Use at the RAPSODEE research center, Ecole des Mines d’Albi-Carmaux, France:
Prof. Ange Nzihou discussed with the author people’s opinion on WTE plants in France. Before 1991, there were no precise emission standards documents enacted for particulate matter and therefore, these particles were the one that were the most absorbing pollutants such as heavy metals or nanofuranes and would then get into the atmosphere and contaminate the environment and affect human health. Therefore, in the old generation of WTE plants, there was a risk for people living next to these plants, risk due to heavy metals, furanes and dioxins.
This is what has contributed to creating poor perception for WTE plants, and since there has not been adequate information disseminated to the public in recent years, people are ignorant of the progress made, and ignorance is the first step to fear.
There are therefore two main problems that lead to that opinion : First, the lack of information provided and, second, the lack of communication. According to Prof. Nzihou, many plants do not post their emissions’ record on their website because they are afraid about this information beibng misused by opponents to incineration.
Prof. Ange Nzihou truly believes that incineration is essential in order to deal with the landfill space constraints that France will experience in the years to come.
References provided by Prof. Armelle Vardelle, E.N.S.I.L., Universite de Limoges, Limoges, France
Prof. Vardelle provided the most crucial source to this study : The master spreadshhet of the Ministry of Ecologie on all French industrial sources of air emissions

36
Directive n°2000/76/CE du Parlement européen et du Conseil du 4 décembre 2000 sur l’incinération des déchets.
French Ministry of Ecology website : http://www.ecologie.gouv.fr/-Dechets-.html
ADEME’s website: http://www.ecologie.gouv.fr/Les-reseaux-de-mesure-de-la.html
http://www.developpement-durable.gouv.fr/energie/renou/biomasse/incineration-om.htm
References provided by M. Luc Valaize, representative of WTE plants to Confederation of European WTE Planrs (CEWEP)
www.incineration.org
References provided by Bettina Kamuk, Market Director/Project Director at Ramboll
Document from Teknik & Miljø: Affald-Reform, Politik og inspiration page 44-46
References provided by Cindy Letrouve, in charge of the registry on polluting emissions, Ministry of Ecology, France
Excel file gathering the emissions from all the operating plants in France.
Acknowledgements
This work would not be possible without the help and support of these people, for whom I would like to thank :
Professor N.J Themelis : for his assistance and support throughout the process and for the reviews and constructive advice.
Professor Ange Nzihou, who helped me a lot in finding the data I was looking for.
I would also like to thank my family and friends for their support in writing this thesis.
APPENDIX 1, . Regional Environmental Agencies (DREAL) contacted by e‐mail in French, requesting WTE emission data (only one response was received)
[email protected], [email protected], [email protected], [email protected], [email protected], [email protected], [email protected], [email protected], [email protected], [email protected], [email protected], [email protected], [email protected], [email protected], [email protected], [email protected], [email protected],

37
[email protected], [email protected], [email protected], [email protected] Subject: Request for information to To Regional DREA
APPENDIX 2. Emission Data Obtained from Spreadsheet provided by Ministry of Ecology (see References above; the Excel Spreadsheet is shown as three pages in the following three pages).

38
Name of plant Plant location Year of Capacity Capacity PM SO2 Nox CO Mercury Heavy metals Dioxins Dioxinsstart-up tons/year tons/day kg/year kg/year kg/year kg/year kg/year kg/year kg/year ng/Nm3
Agen Pessac 1991 43800 120 32 179 23872 399 0.089Angers #1 unit Sainte Gemmes sur Loire-Angers 1974 43800 120 676 2768 145317 7033 1.700 0.102 0.000005 0.024658Angers #2 unit Sainte Gemmes sur Loire-Angers 1974 43800 120 676 2768 145317 7033 1.700 0.262 0.000005 0.024658Angers #3 unit Sainte Gemmes sur Loire-Angers 1974 43800 120 676 2768 145317 7033 1.700 0.370 0.000005 0.024658Angoulême Angoulême 1986 36792 101 181 362 56952 435 0.029 0.144 0.000380 2.065666Annecy #1 unit Cran Gevrier 1986 36792 101 116 97 14219 1040 0.128Annecy #2 unit Cran Gevrier 1994 52560 144 116 97 14219 1040 0.070Annecy #3 unit Cran Gevrier 2001 52560 144 116 97 14219 1040 0.040Antibes #1 unit Antibes 1970 83220 228 1162 3473 31136 4440 0.750 4.570 0.000027 0.065655Antibes #2 unit Antibes 1970 83220 228 1162 3473 31136 4440 0.750 4.570 0.000027 0.065655Argenteuil #1 unit Argenteuil 1975 65700 180 3748 1176 52719 2490 7.470 66.500 0.000014 0.043836Argenteuil #2 unit Argenteuil 1975 65700 180 3748 1176 52719 2490 7.470 66.500 0.000014 0.043836Argenteuil #3 unit Argenteuil 1998 78840 216 3748 1176 52719 2490 7.470 66.500 0.000014 0.036530Argenteuil #4 unit Argenteuil 2006 131400 360 3748 1176 52719 2490 7.470 66.500 0.000014 0.021918Arras Arras 2004 28908 79 98547 6800 38.550Aureade Veuve 2006 109500 300 86 6500 65931 1509 0.004 0.289 0.000004 0.006738Aurillac Aurillac 1988 8760 24 57 229 8534 82 0.073 0.371 0.000001 0.022831Avignon #1 unit Vedène 1995 52560 144 8978 8658 116208 3587 3.200 0.299 0.000032 0.121766Avignon #2 unit Vedène 1995 52560 144 8978 8658 116208 3587 3.200 0.072 0.000032 0.121766Avignon #3 unit Vedène 1996 52560 144 8978 8658 116208 3587 3.200 0.061 0.000032 0.121766Bayet #1 unit Saint Pourcain sur Sioule 1982 35040 96 141 51 8747 376 0.420 0.104Bayet #2 unit Saint Pourcain sur Sioule 1988 43800 120 141 51 8747 376 0.420 0.047Belfort #1 unit Bourogne 2002 54312 149 6 698 70500 113735 2.500 0.148 0.000009 0.031301Belfort #2 unit Bourogne 2002 54312 149 6 698 70500 113735 2.500 0.317 0.000009 0.031301Bellegarde s.V. #1 unit Bellegarde sur valserine 1998 70080 192 461 3563 96046 2834 1.520 4.320 0.000142 0.405251Bellegarde s.V. #2 unit Bellegarde sur Valserine 1998 70080 192 461 3563 96046 2834 1.520 4.320 0.000142 0.405251Benesse Maremne #1 unit Benesse-Maremne 1972 26280 72 784 643 30337 1325 0.100 1.000 0.000006 0.043379Benesse Maremne #2 unit Benesse-Maremne 1985 39420 108 784 643 30337 1325 0.100 1.000 0.000006 0.028919Besançon #1 unit Besançon 1976 26280 72 171 314 74854 4716 0.190 2.700 0.000002 0.012542Besançon #2 unit Besançon 2002 35040 96 171 314 74854 4716 0.190 2.700 0.000002 0.009406Bessières #1 unit Bessières 2000 99864 274 1631 7428 115704 4509 2.250 81.570 0.000016 0.031042Bessières #2 unit Bessières 2000 99864 274 1631 7428 115704 4509 2.250 81.570 0.000016 0.031042Blois #1 unit Blois 2000 48180 132 140 8668 317 4350 0.700 0.016 0.000010 0.041511Blois #2 unit Blois 2000 48180 132 140 8668 287 4350 0.700 0.008 0.000010 0.041511Bordeaux #1 unit Bègles 1998 96360 264 542 6547 7370 9952 18.000 24.000 0.000008 0.015567Bordeaux #2 unit Bègles 1998 96360 264 542 6547 7370 9952 18.000 24.000 0.000008 0.015567Bordeaux #3 unit Bègles 1998 96360 264 542 6547 7370 9952 18.000 24.000 0.000008 0.015567Born 2 Pontenx-les-Forges 1997 46428 127 523 3542 91386 2850 0.300 0.010 0.000001 0.003015Bourg d'oisans Livet 1998 21900 60 12 1368 30644 59 1.250 0.130 0.000002 0.014612Bourg Saint Maurice Bellentre 1991 28908 79 319 170 22856 420 0.650 1.200 0.000002 0.010827Bourgoin Jallieu #1 unit Bourgoin Jallieu 1986 43800 120 844 4269 47057 2592 3.840 0.034 0.000014 0.063927Bourgoin Jallieu #2 unit Bourgoin Jallieu 1995 52560 144 844 4269 47057 2592 3.840 0.079 0.000014 0.053272Brest #1 unit Brest 1988 78840 216 682 5364 40616 7085 3.240 0.034 0.000001 0.002867Brest #2 unit Brest 1988 78840 216 682 5364 40616 7085 3.240 0.025 0.000001 0.002867Briec #1 unit Briec de l'Odet 1996 17520 48 243 2301 40652 1254 1.320 0.036 0.000008 0.086758Briec #2 unit Briec de l'Odet 1996 17520 48 243 2301 40652 1254 1.320 0.028 0.000008 0.086758Brive #1 unit Brive la Gaillarde 1973 30660 84 2223 77 43 12 0.062Brive #2unit Brive la Gaillarde 1973 30660 84 2223 77 43 12 0.062Brive #3 unit Brive la Gaillarde 1973 30660 84 2223 77 43 12 0.062Caen #1 unit Colombelles 1971 70080 192 1 455 40769 2323 2.540 0.013 0.000006 0.017123Caen #2 unit Colombelles 1972 70080 192 1 455 40769 2323 2.540 0.052 0.000006 0.017123Carhaix Carhaix 1994 35040 96 287 1524 33469 70 0.620 0.065 0.000000 0.000588Carrières sur Seine #1 unit Carrières sur Seine 1977 87600 240 2700 7286 42001 3309 10.390 0.137 0.000008 0.018240Carrières sur Seine #2 unit Carrières sur Seine 1988 87600 240 2700 7286 42001 3309 10.390 0.209 0.000008 0.018240Carrières-sous-Poissy #1 unit Carrières sous Poissy 1998 65700 180 530 4270 11290 7080 2.950 0.055 0.000006 0.018874Carrières-sous-Poissy #2 unit Carrières sous Poissy 1998 65700 180 530 4270 11290 7080 2.950 0.102 0.000006 0.018874Cergy #1 unit Cergy Pontoise 1995 91980 252 820 8963 74780 6949 20.500 0.394 0.000008 0.017443Cergy #2 lpant Cergy Pontoise 1995 91980 252 820 8963 74780 6949 20.500 0.595 0.000008 0.017443Chambéry #1 unit Chambéry 1977 36792 101 20 2930 34300 1320 0.570 0.105 0.000002 0.008891Chambéry #2 unit Chambéry 1977 36792 101 20 2930 34300 1320 0.570 0.018 0.000002 0.008891Chambéry #3 unit Chambéry 1996 52560 144 20 2930 34300 1320 0.570 0.017 0.000002 0.006223Chartres 2 #1 unit Mainvilliers 1999 65700 180 299 7945 191432 6205 1.316 0.404 0.000014 0.041108Chartres 2 #2 unit Mainvilliers 1999 65700 180 299 7945 191432 6205 1.316 0.391 0.000014 0.041108Chateaudun Chateaudun 1976 29784 82 1442 522 48134 3950 1.560 0.016 0.000006 0.036933Chaumont #1 unit Chaumont 1998 43800 120 636 13153 60311 3871 0.011 0.087 0.000002 0.008630Chaumont #2 unit Chaumont 1998 43800 120 636 13153 60311 3871 0.011 0.036 0.000002 0.008630Chedde-Passy Passy 1995 65700 180 201 3802 43444 974 0.530 0.055 0.000001 0.002131Cluses/Marignier Marignier 1991 43800 120 111 56 11815 3228 0.100 0.152 0.000000 0.000890Colmar #1 unit Colmar 1988 52560 144 800 2200 77600 2600 2.000 0.110 0.000005 0.018645Colmar #2 unit Colmar 1988 52560 144 800 2200 77600 2600 2.000 0.120 0.000005 0.018645Concarneau #1 unit Concarneau 1989 34164 94 475 7883 62175 1688 0.350 0.073 0.000005 0.027105Concarneau #2 unit Concarneau 1989 34164 94 475 7883 62175 1688 0.350 0.594 0.000005 0.027105Créteil #1 unit Créteil 2000 131400 360 3546 5387 75850 12580 19.529 0.330 0.000000 0.000152Créteil #2 unit Créteil 2000 131400 360 3546 5387 75850 12580 19.529 1.040 0.000000 0.000152Créteil 3r unit Créteil 1994 17520 48 3546 5387 75850 12580 19.529 0.000000 0.001142Dieppe #1 unit Rouxmesnil-Bouteilles 1971 21900 60 1923 8035 86750 4392 0.731 0.122 0.000004 0.035341Dieppe #2 unit Rouxmesnil-Bouteilles 1971 21900 60 1923 8035 86750 4392 0.731 0.122 0.000004 0.035341Dijon #1 unit Dijon 1974 100740 276 1175 3609 55000 29000 8.000 0.078 0.000002 0.003971Dijon #2 unit Dijon 1974 100740 276 1175 3609 55000 29000 8.000 0.039 0.000002 0.003971Dinan 2 #1 unit Taden 1998 70080 192 167 5525 208267 2251 4.400 0.129 0.000170 0.485160Dinan 2 #2 unit Taden 1998 70080 192 167 5525 208267 2251 4.400 0.047 0.000170 0.485160Douchy #1 unit Douchy les Mines 1977 48180 132 860 68 66000 3200 7.100 0.041 0.000002 0.009132Douchy #2 unit Douchy les Mines 1977 48180 132 860 68 66000 3200 7.100 0.041 0.000002 0.009132Epinal #1 unit Rambervillers 1983 30660 84 116 2054 145567 6213 7.358 0.321 0.000028 0.180691Epinal #2 unit Rambervillers 1983 30660 84 116 2054 145567 6213 7.358 0.321 0.000028 0.180691Epinal #3 unit Rambervillers 2002 52560 144 116 2054 145567 6213 7.358 0.063 0.000028 0.105403Esiane Villers-Saint-Paul 2004 96360 264 254 3912 137211 3449 2.447 0.105 0.000003 0.006372
39
Esiane Villers-Saint-Paul 2004 96360 264 254 3912 137211 3449 2.447 0.101 0.000003 0.006372Evreux Sud #1 unit Guichainville 2003 49056 134 584 3650 23164 1851 2.401 0.029 0.000004 0.017939Evreux Sud #2 unit Guichainville 2003 49056 134 584 3650 23164 1851 2.401 0.013 0.000004 0.017939Gien #1 unit Gien 1999 43800 120 340 900 68610 3250 0.031 1.540 0.000006 0.026575Gien #2 unit Gien 1999 43800 120 340 900 68610 3250 0.031 1.540 0.000006 0.026575Grenoble #1 unit Tronche 1974 72270 198 1260 2207 67929 4189 1.600 0.176 0.000017 0.047046Grenoble #2 unit Tronche 1974 72270 198 1260 2207 67929 4189 1.600 0.138 0.000017 0.047046Grenoble #3 unit Tronche 1996 72270 198 1260 2207 67929 4189 1.600 0.230 0.000017 0.047046Haguenau #1 line Schweighouse sur Moder 1990 43800 120 237 2011 30121 2473 0.563 0.115 0.000005 0.022817Haguenau #2 line Schweighouse sur Moder 1990 43800 120 237 2011 30121 2473 0.563 0.090 0.000005 0.022817Halluin #1 unit Halluin 2000 127020 348 1240 21440 109800 14680 1.550 0.087 0.000020 0.032184Halluin #2 unit Halluin 2000 127020 348 1240 21440 109800 14680 1.550 0.119 0.000020 0.032184Halluin #3 unit Halluin 2000 127020 348 1240 21440 109800 14680 1.550 0.081 0.000020 0.032184Henin-Beaumont #1 unit Henin-Beaumont 1972 52560 144 1208 2770 101000 3300 2.270 0.152 0.000007 0.025114Henin-Beaumont #2 unit Henin-Beaumont 1974 52560 144 1208 2770 101000 3300 2.270 0.070 0.000007 0.025114Ivry #1 unit Paris 1969 438000 1200 12300 56900 201300 45900 4.180 0.126 0.000173 0.079178Ivry #2 unit Paris 1969 438000 1200 12300 56900 201300 45900 4.180 0.098 0.000173 0.079178La Rochelle #1 unit Rochelle 1988 35040 96 414 2312 53405 1632 1.950 0.120 0.000002 0.012785La Rochelle #2 unit Rochelle 1988 35040 96 414 2312 53405 1632 1.950 0.140 0.000002 0.012785Labeuvrière #1 unit Labeuvrière 1979 43800 120 500 3700 34400 4583 1.020 0.100 0.000017 0.077626Labeuvrière #2 unit Labeuvrière 1979 43800 120 500 3700 34400 4583 1.020 0.024 0.000017 0.077626Labeuvrière #3 unit Labeuvrière 1979 87600 240 500 3700 34400 4583 1.020 0.040 0.000017 0.038813Lagny #1 unit St Thibault des Vignes 1985 70080 192 1105 3182 421 16739 8.980 0.156 0.000010 0.029680Lagny #2 unit St Thibault des Vignes 1995 105120 288 1105 3182 421 16739 8.980 0.151 0.000010 0.019787Lamballe Planguenoual 1993 51684 142 481 8505 93315 847 11.800 0.100 0.000004 0.017317Lasse Sivert Lasse 2004 109500 300 213 10812 38273 34 6.650 0.127 0.000001 0.002320Le Mans #1 unit Mans 1973 70080 192 32620 809 126050 15070 0.400 0.194 0.000029 0.081621Le Mans #2 unit Mans 1991 78840 216 32620 809 126050 15070 0.400 0.103 0.000029 0.072552Le Mans #3 unit Mans 2003 105120 288 32620 809 126050 15070 0.400 0.179 0.000029 0.054414Limoges #1 unit Limoges 1989 43800 120 815 5913 76770 4447 5.040 0.130 0.000020 0.091781Limoges #2 unit Limoges 1989 43800 120 815 5913 76770 4447 5.040 0.100 0.000020 0.091781Limoges #3 unit Limoges 1992 43800 120 815 5913 76770 4447 5.040 0.002 0.000020 0.091781Lons-le-Saunier Lons-le-Saunier 1994 43800 120 260 518 64838 540 0.230 0.150 0.000011 0.049932Lunel #1 unit Lunel-Viel 1999 70080 192 262 1790 175799 4582 6.020 0.180 0.000003 0.007728Lunel #2 unit Lunel-Viel 1999 70080 192 262 1790 175799 4582 6.020 0.141 0.000003 0.007728Lyon Nord #1 unit Rillieux 1989 105120 288 380 9858 39606 12452 4.710 0.087 0.000010 0.019420Lyon Nord #2 unit Rillieux 1989 105120 288 380 9858 39606 12452 4.710 0.200 0.000010 0.019420Lyon Sud #1 unit Lyon 7ème 69007 1989 105120 288 2735 434 54073 15195 20.770 0.124 0.003500 6.659056Lyon Sud #2 unit Lyon 7ème 69007 1989 105120 288 2735 434 54073 15195 20.770 0.227 0.003500 6.659056Lyon Sud #3 unit Lyon 7ème 69007 1989 105120 288 2735 434 54073 15195 20.770 0.345 0.003500 6.659056Mantes #1 unit Guerville 1997 35040 96 244 2207 52708 12019 1.456 0.061 0.000004 0.024543Mantes #2 unit Guerville 1997 35040 96 244 2207 52708 12019 1.456 0.037 0.000004 0.024543Mantes #3 unit Guerville 1997 35040 96 244 2207 52708 12019 1.456 0.037 0.000004 0.024543Martiniquaise #2 unit Fort de France 2002 61320 168 440 275 77734 1032 2.290 0.091 0.000009 0.029909Massy #1 unit Massy 1985 48180 132 1193 154000 4010 1435 0.800 0.219 0.000011 0.044458Massy #2 unit Massy 1986 48180 132 1193 154000 4010 1435 0.800 0.207 0.000011 0.044458Maubeuge #1 unit Maubeuge 1980 closed in 2002 0 559 2570 2.810Maubeuge #2 unit Maubeuge 1980 closed in 2002 0 559 2570 2.810Maubeuge #3 unit Maubeuge 2001 48180 132 559 2816 64740 2570 2.810 0.252 0.000001 0.005396Maubeuge 4th unit Maubeuge 2001 48180 132 559 2816 64740 2570 2.810 0.167 0.000001 0.005396Melun #1 unit Vaulx-le-Penil 2003 70080 192 1681 6538 93229 4834 1.590 0.066 0.000010 0.028082Melun #2 unit Vaux-le-Penil 2003 70080 192 1681 6538 93229 4834 1.590 0.070 0.000010 0.028082Messanges Messanges 1976 26280 72 329 451 21743 399 0.050 0.120 0.000001 0.008371Metz #1 unit Metz 57000 2001 70080 192 467 1739 70297 5049 0.569 0.065 0.000004 0.011416Metz #2 unit Metz 57000 2001 70080 192 467 1739 70297 5049 0.569 0.105 0.000004 0.011416Montargis Amilly 1969 24528 67 120 197 29376 601 0.344 3.367 0.000003 0.024959Montauban Montauban 1986 43800 120 660 191 33076 2118 2.010 0.137 0.000002 0.009178Montbéliard #1 unit Montbéliard 1988 35040 96 319 805 62708 3245 0.446 0.130 0.000005 0.025685Montbéliard #2 unit Montbéliard 1988 35040 96 319 805 62708 3245 0.446 0.148 0.000005 0.025685Monterau Fault Yonne Monterau Fault Yonne 1973 28032 77 450 895 11351 564 0.920 0.121 0.000877 6.257135Monthyon #1 unit Monthyon 1998 61320 168 2219 3878 111023 18446 11.519 0.077 0.000106 0.344814Monthyon #2 unit Monthyon 1998 61320 168 2219 3878 111023 18446 11.519 0.046 0.000106 0.344814Monthyon #3 unit Monthyon 1998 35040 96 2219 3878 111023 18446 11.519 0.050 0.000106 0.603425Mourenx Mourenx 1990 17520 48 134 31 9695 26 0.080 0.220 0.000006 0.071918Mulhouse #1 unit Sausheim 1999 91980 252 909 10125 123215 18958 2.020 0.130 0.000099 0.215699Mulhouse #2 unit Sausheim 1999 91980 252 909 10125 123215 18958 2.020 0.180 0.000099 0.215699Nancy energie #1 unit Ludres 1995 70080 192 477 702 30378 5306 1.317 0.220 0.000012 0.034332Nancy energie #2 unit Ludres 1995 70080 192 477 702 30378 5306 1.317 0.205 0.000012 0.034332Nantes #1 unit Nantes 1987 83220 228 289 2391 57288 5169 14.480 0.158 0.000007 0.016799Nantes #2 unit Couëron 1994 61320 168 132 2752 30152 3265 2.500 0.076 0.000019 0.060708Nantes (#2 unit) Nantes 1987 83220 228 289 2391 57288 5169 14.480 0.155 0.000007 0.016799Nantes ouest #1 unit Couëron 1994 61320 168 132 2752 30152 3265 2.500 0.076 0.000019 0.060708Nevers Fourchambault 2002 52560 144 101 1557 24505 983 0.540 0.135 0.000005 0.017542Nice #1 unit Nice 1977 105120 288 4914 5098 507000 20090 11.000 0.180 0.000014 0.026826Nice #2 unit Nice 1977 105120 288 4914 5098 507000 20090 11.000 0.180 0.000014 0.026826Nice #3 unit Nice 1982 105120 288 4914 5098 507000 20090 11.000 0.120 0.000014 0.026826Nice #4 unit Nice 1998 157680 432 4914 5098 507000 20090 11.000 0.120 0.000014 0.017884Nîmes Evolia Nîmes 2004 122640 336 255 2742 22140 853 3.347 0.052 0.000004 0.006409Noyelles s. L. #1 unit Noyelles-sous-Lens 1973 58692 161 791 4300 184613 6051 32.990 0.026 0.000015 0.051455Noyelles s. L. #2 unit Noyelles-sous-Lens 1973 58692 161 791 4300 184613 6051 32.990 0.035 0.000015 0.051455Paille Surgères 1981 30660 84 420 104 48776 12 1.055 0.110 0.000007 0.047619Pau #1 unit Lescar 1987 43800 120 360 3525 92712 3446 13.732 0.010 0.000008 0.037580Pau #2 unit Lescar 1990 52560 144 360 3525 92712 3446 13.732 0.020 0.000008 0.031317Pithiviers Pithiviers 1985 28470 78 179 3139 20329 335 0.890 0.013 0.000001 0.005669Plouharnel Plouharnel 1971 36792 101 84 84 39800 973 0.630 0.000004 0.023212Pluzunet Pluzunet 22140 1997 61320 168 294 843 28356 374 8.550 0.055 0.000002 0.005545Poitiers #1 unit Poitiers 1984 35040 96 149 146 54018 3175 1.800 0.104 0.000006 0.033676Poitiers #2 unit Poitiers 1984 35040 96 149 146 54018 3175 1.800 0.175 0.000006 0.033676Pontarlier Pontarlier 1989 43800 120 4038 3496 69234 473 0.480 0.074 0.000001 0.005831Pontcharra Pontcharra 1977 23652 65 349 100 25333 973 0.870 0.110 0.000002 0.019449

40
Pontivy Pontivy 1990 35040 96 558 1443 44345 1885 0.403 0.266 0.000000 0.001998Pontmain #1 unit Pontmain 1983 26280 72 805 5914 73318 2342 1.000 0.022 0.000001 0.006979Pontmain #2 unit Pontmain 2003 35040 96 805 5914 73318 2342 1.000 0.017 0.000001 0.005234Rambouillet #1 unit Ouarville 2000 70080 192 729 3452 206961 1878 12.630 0.093 0.000004 0.012272Rambouillet #2 unit Ouarville 2000 70080 192 729 3452 206961 1878 12.630 0.096 0.000004 0.012272Reims Remival #1 unit Reims 51689 1989 56940 156 140 6844 106847 3968 11.510 0.041 0.000008 0.026944Reims Remival #2 unit Reims 51689 1989 56940 156 140 6844 106847 3968 11.510 0.063 0.000008 0.026944Rennes #1 unit Rennes 1968 43800 120 14 14112 111920 10299 8.200 0.035 0.000006 0.026301Rennes #2 unit Rennes 1968 43800 120 14 14112 111920 10299 8.200 0.103 0.000006 0.026301Rennes #3 unit Rennes 1996 70080 192 14 14112 111920 10299 8.200 0.016 0.000006 0.016438Rochefort #1 unit Echillais 1990 21900 60 4911 2040 36596 1455 1.253 0.210 0.000000 0.004475Rochefort #2 unit Echillais 1990 21900 60 4911 2040 36596 1455 1.253 0.056 0.000000 0.004475Rosier d'Egletons Rosier d'Egletons 1997 46428 127 183 1736 50974 255 2.140 0.130 0.000002 0.009219Rouen 2 #3 unit Grand Quevilly 2000 127020 348 4583 12865 88129 19747 3.710 0.007 0.000024 0.037506Rouen 2 #1 unit Grand Quevilly 2000 127020 348 4583 12865 88129 19747 3.710 0.005 0.000024 0.037506Rouen 2 #2 unit Grand Quevilly 2000 127020 348 4583 12865 88129 19747 3.710 0.005 0.000024 0.037506Rungis #1 unit Rungis 1985 74460 204 3586 1517 23618 13102 3.450 0.007 0.000018 0.049396Rungis #2 unit Rungis 1985 74460 204 3586 1517 23618 13102 3.450 0.005 0.000018 0.049396Saint Ouen #1 unit Saint Ouen 93400 1990 245280 672 5000 65177 147386 48000 39.000 0.103 0.000032 0.025930Saint Ouen #2 unit Saint Ouen 93400 1990 245280 672 5000 65177 147386 48000 39.000 0.114 0.000032 0.025930Saint Ouen #3 unit Saint Ouen 93400 1990 245280 672 5000 65177 147386 48000 39.000 0.126 0.000032 0.025930Saint-Jean-d. F. #1 unit Saint-Jean-De-Folleville 1970 70080 192 1174 4439 43201 3628 7.990 0.037 0.000035 0.099886Saint-Jean-d. F. #2 unit Saint-Jean-De-Folleville 1975 70080 192 1174 4439 43201 3628 7.990 0.043 0.000035 0.099886Saran #1 unit Saran 1995 61320 168 770 2500 151441 467 1.200 0.050 0.000005 0.015003Saran #2 unit Saran 1995 61320 168 770 2500 151441 467 1.200 0.056 0.000005 0.015003Sarcelles #1 unit Sarcelles 1978 87600 240 125 4211 33714 5475 2.670 0.066 0.000010 0.022831Sarcelles #2 unit Sarcelles 1978 87600 240 125 4211 33714 5475 2.670 0.390 0.000010 0.022831Sens Sens 1988 26280 72 552 4387 23572 976 1.285 0.110 0.005200 ######Sète Sète 1992 49056 134 664 1591 20598 6 0.615 0.170 0.000005 0.022138St Pierre d'oléron #1 unit St Pierre d'oléron 1974 43800 120 101 521 17063 1185 0.562 0.052 0.000001 0.004018St Pierre d'oléron #2 unit St Pierre d'oléron 1974 43800 120 101 521 17063 1185 0.562 0.064 0.000001 0.004018Strasbourg #1 unit Strasbourg 1975 98988 271 2099 282 67519 29 4.600 0.140 0.000018 0.036368Strasbourg #2 unit Strasbourg 1975 98988 271 2099 282 67519 29 4.600 0.140 0.000018 0.036368Strasbourg #3 unit Strasbourg 1975 98988 271 2099 282 67519 29 4.600 0.140 0.000018 0.036368Strasbourg #4 unit Strasbourg 1975 98988 271 2099 282 67519 29 4.600 0.140 0.000018 0.036368SYCTOM Isséane #2 unit Issy-les-Moulineaux 2010 267180 732 3500 9600 101000 3100 3.000 0.000500 0.374280SYCTOM Isséane #1 unit Issy-les-Moulineaux 2010 267180 732 3500 9600 101000 3100 3.000 0.000500 0.374280SYTEVOM Noidans-le-Ferroux 2007 87600 240 265 28 28675 636 1.330 0.000001 0.001142Thivernal Grigon #3 unit Thivernal-Grignon 1993 128772 353 4966 6514 203264 20566 5.530 0.082 0.000050 0.077657Thivernal-Grignon #1 unit Thivernal-Grignon 1974 88476 242 4966 6514 203264 20566 5.530 0.057 0.000050 0.113025Thivernal-Grignon #2 unit Thivernal-Grignon 1974 88476 242 4966 6514 203264 20566 5.530 0.097 0.000050 0.113025Thonon les Bains Thonon les Bains 1988 43800 120 187 1003 894 33 1.650 0.256 0.000000 0.000236Tignes Tignes 1985 13140 36 261 1280 16476 652 0.590 0.105 0.000001 0.010654Toulon #1 unit Toulon 1984 105120 288 356 16051 188145 12231 0.290 0.102 0.000010 0.019639Toulon #2 unit Toulon 1984 105120 288 356 16051 188145 12231 0.290 0.177 0.000010 0.019639Toulon #3 unit Toulon 1983 122640 336 356 16051 188145 12231 0.290 0.089 0.000010 0.016833Toulouse #1 unit Toulouse Mirail 1969 87600 240 262 24019 6137 158 0.220 0.402 0.000000 0.000391Toulouse #2 unit Toulouse Mirail 1969 70080 192 262 24019 6137 158 0.220 0.187 0.000000 0.000489Toulouse #3 unit Toulouse Mirail 1975 70080 192 262 24019 6137 158 0.220 0.864 0.000000 0.000489Toulouse #4 unit Toulouse Mirail 1997 122640 336 262 24019 6137 158 0.220 0.247 0.000000 0.000279Tronville en Barrois Tronville en Barrois 1983 35040 96 209 1046 29996 809 3.520 0.253 0.000004 0.023973UIOM de Brive #3 unit Saint-Pantaléon-de-Larche 1973 30660 84 118 1269 98470 5984 8.728 0.062 0.000001 0.005095UIOM de Brive #1 unit Saint-Pantaléon-de-Larche 1973 30660 84 118 1269 98470 5984 8.728 0.062 0.000001 0.005095UIOM de Brive #2 unit Saint-Pantaléon-de-Larche 1973 30660 84 118 1269 98470 5984 8.728 0.062 0.000001 0.005095UIOM de Calce #1 unit Calce 2003 96360 264 811 15419 67916 8142 5.470 0.200 0.000006 0.012453UIOM de Calce #2 unit Calce 2003 96360 264 811 15419 67916 8142 5.470 0.100 0.000006 0.012453UIOM de Cenon #1 unit Cenon 1984 70080 192 29 172 68265 7253 0.640 0.067 0.000002 0.006478UIOM de Cenon #2 unit Cenon 1984 70080 192 29 172 68265 7253 0.640 0.012 0.000002 0.006478UIOM Inova Saint-Benoît-La-Forêt 1983 24528 67 363 1070 33855 3014 0.328 0.021 0.000001 0.004664Valenciennes #1 unit Saint Saulve 1977 48180 132 459 18740 107099 6388 0.240 0.873 0.000003 0.011208Valenciennes #2 unit Saint Saulve 1977 48180 132 459 18740 107099 6388 0.240 0.444 0.000003 0.011208Valenciennes #3 unit Saint Saulve 1977 48180 132 459 18740 107099 6388 0.240 0.285 0.000003 0.011208Vaulx #1 unit Vaux-le-Penil 2003 70080 192 1681 6538 93229 4834 1.590 0.066 0.000010 0.028082Vaulx #2 unit Vaux-le-Penil 2003 70080 192 1681 6538 93229 4834 1.590 0.070 0.000010 0.028082Vernou-en-Sologne Vernou-en-Sologne 1986 20148 55 277 246 9696 69 2.480 0.189 0.000001 0.005460Vert le Grand #1 unit Vert le Grand 1999 122640 336 2400 40296 76721 7697 14.490 0.094 0.000016 0.025277Vert le Grand #2 unit Vert le Grand 1999 122640 336 2400 40296 76721 7697 14.490 0.048 0.000016 0.025277Villefranche #1 unit Villefranche sur Saône 1984 39420 108 250 3490 47710 470 0.100 0.167 0.000013 0.066464Villefranche #2 unit Villefranche sur Saône 2002 56940 156 250 3490 47710 470 0.100 0.065 0.000013 0.046013Villejust #1 unit Villejust 1972 52560 144 420 3800 22150 1500 5.491 0.084 0.000004 0.014699Villejust #2 unit Villejust 1984 70080 192 420 3800 22150 1500 5.491 0.036 0.000004 0.011025Vitré Vitré 1988 35040 96 200 80 20502 545 1.750 0.156 0.000002 0.010451
Total Capacity 17201136 47126 Total number of units 248Total number of plants 128Average Values 1637 7268 77550 7177 5 2.486 ##### #####Regulated Values 150000 150000 100000 500000 10 200 0.0001 0.1
:Not Available
Source: French Ministry of Ecology