Comparison of one-dimensional HEC-RAS with two-dimensional ...

Proceedings World Geothermal Congress 2015
Melbourne, Australia, 19-25 April 2015
1
Comparison of Coupled One-Dimensional Subsidence Models
Wesley Koros1, John O’Sullivan
1, Justin Pogacnik
1, Mike O’Sullivan
1 and Graham Ryan
2
Department of Engineering Science1 and IESE2, University of Auckland, Private Bag 92019, Auckland 1142, New Zealand
Keywords: Subsidence, Compaction, FEHM, TOUGH2, ABAQUS, Numerical Modelling
ABSTRACT
Subsidence as a result of the extraction of geothermal fluids for energy production is a significant problem at many sites around the
world. At Wairakei geothermal field in New Zealand, subsidence has occurred since the onset of production in 1958. Subsidence is
non-uniform and reaches as much as 15m in a small area known as the Wairakei subsidence bowl. The high level of subsidence is
caused by a reduction of pore pressure in soft patches in the Huka Falls Formation (HFF), which is composed of pumice breccia
and mudstone. In this study, one-dimensional models are used to investigate subsidence at the Wairakei Bowl. Two different
approaches are used for handling compaction: the first couples a TOUGH2 simulation of heat and mass transfer with a simple
manual calculation of compaction, while the second uses FEHM to calculate both the heat and mass transfer and the rock
deformation. The results obtained using both methods are compared with field measurements from Wairakei and with previously
published work (Allis & Zhan, 2000).
1. INTRODUCTION
Subsidence above oil, gas, water and geothermal reservoirs from which fluid is withdrawn is a phenomenon that is well known
worldwide. As the fluid is withdrawn the reservoir pressure drops and the effective stress in the rock matrix increases thus inducing
compaction. The effects of compaction appear at the surface as subsidence. A few examples of areas where subsidence has
occurred are given in Table 1.
Table 1: Examples of major subsidence due to fluid withdrawal. Modified after (Gambolati et al., 2006).
Area Depth of fluid extraction(m) Maximum observed
subsidence (m)
Size of area affected
(km²)
Year of main
occurrence Oil Groundwater
Ravenna, Italy - 80 – 450 1 400 1955 – 1985
San Joaquin Valley,
California
- 60-900 9 13500 1930 – 1975
Las Vegas, Nevada - 200-300 2 250 1935 to present
Ping-Tung County,
Taiwan
- 70-180 3.1 105 1972 to present
Ekofisk, North Sea 3000-3200 6.7 40 1970 to present
Wilmington,
California
600-1200 9 70 1926 –1968
Lake Maracaibo,
Venezuela
500-1000 4.5(1986) 500(1986) 1928 to present
In many instances, numerical methods have been used to investigate subsidence (e.g. Gambolati et al. 1991). The following options
need to be considered in choosing a modelling technique:
a) Tight or Loose coupling. In the loosely coupled or uncoupled models fluid flow equations are solved to obtain pressures.
These pressures are used to calculate pressure changes throughout a time interval which in turn are used to solve a quasi-static
rock mechanics problem for the subsidence. In the geothermal context this will involve first using a reservoir simulator to
calculate pressures and temperatures over many years (say 20-50). Then a rock mechanics code can be used to calculate
subsidence, say every five years, solving a static solid mechanics problem each time. This approach was used by one of the
authors to study subsidence at Wairakei (O’Sullivan and Yeh, 2007; Bromley et al., 2010).
In a fully coupled approach both the heat and mass transfer problem and the rock mechanics problem are solved at every time
step and the material properties such as porosity and permeability which control heat and mass transfer are allowed to vary
with the stresses determined from the rock mechanics problem. The fully coupled thermo-hydro-mechanical (THM) approach
has been used for studying problems such as permeability enhancement by cold water injection in geothermal reservoirs (e.g.

Koros et al.
2
Pogacnik, et al., 2014) but has not been used for modelling subsidence and is probably more complicated than is necessary
for this purpose.
Other levels of coupling are possible: for example the Finite Element Heat and Mass simulator (FEHM) (Zyvoloski et al.,
1997; Zyvoloski, 2007) allows for updating of porosity and permeability to be lagged behind by one time step.
For our model we use an uncoupled model with the heat and mass transfer problem solved first followed by the solution of a
sequence of quasi-static rock mechanics problems.
b) Constitutive relationship. Most past numerical models of subsidence in geothermal fields have assumed a linear elastic stress-
strain relationship (e.g. Allis and Zhan, 2000; Lewis and Schrefler, 1987; Yeh and O'Sullivan, 2007). A few have used elasto-
plastic models allowing for yielding (e.g. Bromley et al., 2013)
c) Dimensions. Past studies have used 1D models (Allis and Zhan, 2000; Bromley et al., 2013), 2D models (Terzaghi, 2004;
White et al., 2005) and general 3D models (Yeh and O’Sullivan 2007, Bromley et al., 2010). In the current study a 1D model
is used, although in the heat and mass transfer model some lateral recharge is allowed and so it could be considered as a 1.5D
flow model.
d) Software. For modelling subsidence in geothermal fields the coupled heat and mass transfer processes must be considered
requiring the use of a geothermal simulator such as TOUGH2 (Pruess et al., 1999) or FEHM (Zyvoloski et al., 1997;
Zyvoloski, 2007). FEHM has a built-in rock mechanics solver whereas TOUGH2 does not. Various THM studies have used
TOUGH2 coupled with commercial rock mechanics codes such as FLAC3D (Rutqvist et al. 2002, 2006) or ABAQUS
(ABAQUS, 2003; Yeh and O’Sullivan, 2007). The originators of the TOUGH2/FLAC3D combination coined the name
TOUGH-FLAC (Rutqvist, 2011) for the coupled codes. TOUGH-FLAC has been used for a few studies of subsidence in
geothermal fields (e.g. Kiryukhin et al., 2014).
Some studies of geothermal subsidence have used software that couples isothermal single phase flow in a porous medium
with stress-strain analysis. For example Allis and Zhan (2000) used a finite element code of this type to analyse subsidence at
Wairakei and Ohaaki geothermal fields. The models of subsidence at Wairakei developed by Terzaghi and co-workers
(Terzaghi 2004, White et al., 2005) used a finite-element package, PLAXIS, which simulates coupled compaction and
isothermal fluid flow.
In the present study we use two approaches: the first couples TOUGH2 for modelling heat and mass transfer with a simple
manual calculation of rock deformation and the second uses FEHM for the whole THM simulation.
2. SUBSIDENCE AT WAIRAKEI
The Wairakei-Tauhara geothermal system is located to the north of Lake Taupo, at the centre of the North Island, New Zealand.
Subsidence was detected soon after the geothermal power plant started operation at Wairakei in 1958. The subsidence rates
increased from the 1950s to a peak in the 1970s, followed by a decrease down to much lower rates at present (Currie, 2010, Allis et
al., 2009, Bromley et al., 2013). In the most intense subsidence area, the Wairakei subsidence bowl near the Eastern Borefield, the
peak rate was 498mm/year in 1978 but it has now slowed to a rate of 58mm/year (Currie, 2009). The centre of the Wairakei bowl
has dropped a total of approximately 15m since the 1950s. The extent of the bowl where the subsidence rate is abnormally higher
than surrounding areas is approximately 1km2. Subsidence at a slower rate of between 5 and 100mm/year has occurred over most of
the Wairakei-Tauhara area.
Recent surveys have shown the existence of three subsidence bowls in the Tauhara area at Crown Road, Rakaunui Road and the
Spa Valley. These are shown by Allis et al. (2009) and by Bromley et al. (2013).
The pressure of the deep Wairakei reservoir has dropped by around 25bar since the development of the field in the 1950s (Allis,
2000; Bixley et al., 2009). Unlike the localised subsidence, the area of pressure drawdown is wide-spread and reasonably uniform
within the resistivity boundary, which encloses more than 20km2 in area. The deep reservoir pressure drawdown has also
propagated to the Tauhara area.
3. PREVIOUS WORK ON MODELLING SUBSIDENCE AT WAIRAKEI
Allis (Allis and Zhan 2000, Allis 2004) has studied subsidence at Wairakei-Tauhara for more than 15 years. He used Geertsma’s
techniques (Geertsma, 1973) to try to identify the geological layer that contributes most to the subsidence bowl at Wairakei. Allis
also used a one-dimensional finite-element model that couples compaction and fluid flow in porous materials to simulate the
subsidence at Wairakei. The code was originally developed by Lewis and collaborators (Lewis and Schrefler 1987, Schrefler and
Zhan 1993). Allis used it to set up one-dimensional models to match subsidence at the levelling bench marks at Wairakei. Some
good fits were obtained, however, the models are limited because they are only one-dimensional and some three-dimensional
effects may be important (Terzaghi, 2004, p. 15). Another limitation of Allis’s modelling technique is that it only allows for single-
phase flow. Thus the flow in the two-phase zones of Wairakei-Tauhara cannot be accurately represented.
Terzaghi and co-workers (Terzaghi 2004, White et al., 2005) also developed models of subsidence at Wairakei, using a finite-
element package, PLAXIS that simulates coupled compaction and fluid flow. Several two-dimensional cross-sectional models were
used to calculate subsidence at both the Wairakei bowl and the more recent Tauhara subsidence bowls. However the Terzaghi
(2004) models are limited because they cannot represent two-phase flow, and also they are two-dimensional rather than three-
dimensional.

Koros et al.
3
All of these models give results that agree reasonably well with the past subsidence history at the selected points or along cross-
sections. However, the authors of the different studies disagreed about the cause of the anomalous subsidence at the subsidence
bowls and the available field data was insufficient to resolve the areas of disagreement.
After the extensive program of drilling, coring and scientific investigations undertaken by Contact Energy Ltd. during 2007-2009
much more became known about the rock properties in and around the subsidence bowls at Wairakei and Tauhara (see Bromley et
al., 2013; Pender et al., 2013). This new information was used in the 3D modelling study carried out by O’Sullivan and Yeh
(included in the report by Bromley et al., 2010) based on the coupling of TOUGH2 and ABAQUS as discussed by Yeh and
O’Sullivan (2007). The data were also used in recent studies by Bromley (Bromley et al., 2010, Bromley et al., 2013) who used a
simple 1D compaction calculation, including some yielding, to obtain a reasonable match to the subsidence at Wairakei and
Tauhara. These calculations were based on measured and estimated pressures rather than pressures calculated from a reservoir
simulator. Wanninayake (2010) used the same pressures as Bromley as input for a 1D numerical model implemented in FLAC3D
(Itasca Consulting Group, 1997). He included a Cam-clay constitutive model calibrated using K0 triaxial test data.
4. THEORY OF SUBSIDENCE
Mechanical compaction of clastic sediments by progressive increase in effective stress causes irreversible reduction in porosity as
the sediments yields (Biot, 1941). Sediments responsible for compaction in Wairakei field consist of mudstone and pumice breccia
in Huka Falls Formation (HFF). The HFF overlies the Waiora Formation that hosts the production reservoir (Rosenberg et al.,
2009). The HFF undergoes normal compaction when mean effective stress acting on the sediments increases due to geothermal
production. Goulty (2004) showed that compaction theory by Biot (1941) is simplistic for irreversible mechanical compaction
process, though entirely valid for describing reversible poroelastic response to stress changes.
A useful concept in describing the behaviour of fluid saturated porous rock is that of effective stress. The effective stress tensor is
defined as (Biot, 1941, 1956):
𝜎𝑖𝑗′ = 𝜎𝑖𝑗 − 𝛼𝑃𝑝𝛿𝑖𝑗 (1)
Here 𝜎𝑖𝑗′ is effective stress tensor, 𝜎𝑖𝑗 is total stress tensor, 𝑃𝑝 is pore pressure and 𝛿𝑖𝑗 is Kronecker delta with 𝛿𝑖𝑗 = 1 if i=j and 0
otherwise. Biot’s coefficient 𝛼 describes the relative contribution of total stress and pore pressure to the deformation of the rock.
There has been much discussion in the geotechnical literature about the factor in (1). In some earlier work on modelling
subsidence we followed the 1956 paper by Biot and used , where is the porosity (Yeh and O’Sullivan, 2007). However in the
earlier work by Biot (1941) the following formula was used:
𝛼 = 1 −𝐾g
𝐾𝑠 (2)
where 𝐾𝑔 is the bulk modulus of solid skeleton and 𝐾𝑠 is the bulk modulus of solid material without pores (see Nur, 1971). A
review article by Lade and de Boer (1997) concluded that (2) should be used in the calculation of effective stress. Pender (private
communication) has evaluated using properties typical of the Tauhara formations and obtained values for close to 1.0. Biot’s
definition of effective stress with =1 is the same as the formulation proposed earlier by Terzaghi (1936).
Production in a geothermal reservoir results in pressure drawdown causing an increase in effective stress. Consequently, sediments
overlying the reservoir undergo mechanical compaction during production. The horizontally structured sediments become
mechanically compacted under zero horizontal strain conditions with a reduction in thickness. Ratio of horizontal effective stress to
vertical effective stress yields a coefficient of the lithostatic pressure at rest, 𝐾0 given by:
𝐾0 =𝜎𝑥𝑥−𝑃𝑝
𝜎𝑧𝑧−𝑃𝑝 (3)
Here 𝜎𝑧𝑧 represent lithostatic stress, 𝜎𝑙𝑖𝑡ℎ, at depth resulting from the weight of overburden and water above the point of interest. It
can be expressed as:
𝜎𝑙𝑖𝑡ℎ = 𝑝𝑎𝑡𝑚 + 𝜌𝑟𝑜𝑐𝑘𝑔ℎ + 𝜌𝑤𝑎𝑡𝑒𝑟𝑔ℎ (4)
In (3) and (4) 𝑃𝑝 is pore pressure, 𝜎𝑥𝑥 is minimum horizontal stress, 𝜌𝑟𝑜𝑐𝑘 is density of the overlying rock, 𝜌𝑤𝑎𝑡𝑒𝑟 is density of
water, ℎ is depth, 𝑝𝑎𝑡𝑚 is atmospheric pressure and 𝑔 is acceleration due to gravity. Under these conditions, horizontal stresses are
isotropic, so that 𝜎𝑦𝑦 = 𝜎𝑥𝑥 .
Laboratory measurements by Jones (1994) show that 𝐾0 is constant for a given lithology.
Reservoir compaction studies usually assume that the rock is linearly elastic and isotropic and thus Hookes’ law applies. Thus the
stress-strain law can be expressed in terms of Young’s modulus 𝐸 and Poisson’s ratio 𝜈 as follows:
휀𝑥𝑥 =1
𝐸[𝜎𝑥𝑥 − 𝜈(𝜎𝑦𝑦 + 𝜎𝑧𝑧)] (5a)
휀𝑦𝑦 =1
𝐸[𝜎𝑦𝑦 − 𝜈(𝜎𝑥𝑥 + 𝜎𝑧𝑧)] (5b)
휀𝑧𝑧 =1
𝐸[𝜎𝑧𝑧 − 𝜈(𝜎𝑦𝑦 + 𝜎𝑥𝑥)] (5c)

Koros et al.
4
Here 𝐸 is Young’s modulus, which is a measure of the stiffness of a rock and 𝜈 is 𝑃𝑜𝑖𝑠𝑠𝑜𝑛′𝑠 𝑟𝑎𝑡𝑖𝑜, which is a measure of lateral
expansion relative to longitudinal contraction.
The deformation of rocks in a reservoir can be expressed in terms of changes in effective stress, using the initial state (prior to
production) as the reference for strains, as follows:
𝐸휀𝑥𝑥 = ∆𝜎𝑥𝑥′ − 𝜈(∆𝜎𝑦𝑦
′ + ∆𝜎𝑧𝑧′ ) (6a)
𝐸휀𝑦𝑦 = ∆𝜎𝑦𝑦′ − 𝜈(∆𝜎𝑥𝑥
′ + ∆𝜎𝑧𝑧′ ) (6b)
𝐸휀𝑧𝑧 = ∆𝜎𝑧𝑧′ − 𝜈(∆𝜎𝑦𝑦
′ + ∆𝜎𝑥𝑥′ ) (6c)
This is the constitutive law used by Allis and Zhan (2000) (as discussed by Lewis and Schrefler 1987, p. 99).
From the vertical strain 휀𝑧𝑧, the change in thickness ∆ℎ of a layer of rock of thickness ℎ can be calculated using
∆ℎ = −휀𝑧𝑧ℎ (7)
Then the surface subsidence can be calculated by summing ∆ℎ for all the layers in the reservoir.
For the one-dimensional subsidence considered here, we assume that the lateral strain is very small i.e.
휀𝑥𝑥 = 휀𝑦𝑦 ≅ 0 (8)
By substituting (8) into (6a,b) we obtain
∆𝜎𝑥𝑥′ = ∆𝜎𝑦𝑦
′ =𝜈
1−𝜈∆𝜎𝑧𝑧
′ (9)
The total vertical stress acting on the reservoir remains constant during production as the total weight of the overburden remains
constant and therefore ∆𝜎𝑧𝑧 = 0, which gives:
∆𝜎𝑧𝑧′ = ∆𝜎𝑧𝑧 − 𝛼∆𝑃𝑝 = −𝛼∆𝑃𝑝 (10)
By combining (9), (10), (6c) and (7) we arrive at the following expression for compaction in a layer:
∆ℎ
ℎ=
1
𝐸[
(1+𝜈)(1−2𝜈)
(1−𝜈)] 𝛼∆𝑃𝑝 (11)
Compaction resulting from pore pressure reduction can now be deduced from (11), provided the elastic properties (𝐸 and 𝜈) ,
poroelastic coefficient (𝛼) and layer thickness (ℎ) are known.
The compaction coefficient, 𝐶𝑚, is defined by
∆ℎ
ℎ= 𝐶𝑚𝛼∆𝑃𝑝 (12)
The coefficient 𝐶𝑚 can be related to other moduli of rock. It is equal to the inverse of the uniaxial compaction modulus and
comparing (11) and (12) the following expression can be deduced:
𝐶𝑚 =1
𝐸[
(1+𝜈)(1−2𝜈)
(1−𝜈)] (13)
5. DESIGN OF THE MODEL AND RESULTS
The 1D model considered here was designed to be the same as that considered by Allis and Zhan (2000). They set up a 1D column
model to simulate the subsidence at a bench mark called A97 close to the Wairakei subsidence bowl.
5.1 TOUGH2 Model
For our first model we used TOUGH2 for the heat and mass transfer calculation and used a manual calculation of the deformation.
The geometry used for the model is shown in Figure 1 below. The model consists of a 150m column consisting of a lower layer of
mudstone (100m) and an upper layer of pumice breccia (50m). We ran two versions of the model: first a natural state model to
establish the pre-exploitation pressure and temperature profiles and then a production model covering a period of 50 years.
We experimented with various options for the top and bottom boundary conditions for the model. At first we tried specifying a
mass withdrawal at the base of the model and allowing for an unsaturated zone at the top of the model with a falling water table. It
proved to be difficult with this approach to exactly match the pressure vs. time plots shown by Allis and Zhan (2000) at the top and
bottom of their model and we switched to specifying pressure vs. time at the top and bottom of our model. TOUGH2 does not allow
for the implementation of time varying pressure boundary conditions but we were able to implement them by using pyTOUGH
(Croucher, 2013; Wellmann et al., 2012) to adjust boundary pressures at each time step. The pressure at the top boundary shown by
Allis and Zhan (2000) became negative after about 1990. To avoid this kind of unphysical behaviour, which cannot be reproduced
by TOUGH2, we added 0.3MPa to all pressures. In the plots shown below the 0.3MPa has been subtracted again so that our results
can be directly compared with those of Allis and Zhan (2000).

Koros et al.
5
We included a temperature variation in our model with a temperature of 112oC at the bottom of the model and 15oC at the top, a
profile typical of the shallow zone at Wairakei, outside areas of steaming ground where temperatures are higher The non-isothermal
effects are very small and our results agree closely with those of Allis and Zhan who used a constant temperature throughout their
model.
In our first version of the production model we did not include any lateral recharge but were unable to obtain results for pressure vs.
depth that were close to those of Allis and Zhan (2000). When we added in lateral recharge (as shown in Figure 1) and adjusted the
recharge coefficient we were then able to obtain a good match to the pressure profiles of Allis and Zhan (2000) (see Figures 2 and
4). The recharge formula used in TOUGH2 is:
qm = A (Pres − P0) (14)
Here Pres is the pressure in the model, P0 is the reference pressure (usually taken as the initial pressure in the reservoir block), qm is
the mass flow into or out of the model block and A is the recharge coefficient (usually taken proportional to the model
permeability).
Figure 1: Geometry of the model showing the thickness of the mudstone and pumice layers and the boundary conditions.
We then used (11), with the aid of a spreadsheet, to calculate the compaction in each layer in our model and then the total
subsidence at the surface. We used the same values for rock properties as Allis and Zhan (2000) (see Table 2) and the initial
conditions given in Table 3. Allis and Zhan (2000) did not give a value for the Biot coefficient but we found it necessary to use
=0.5 in order to obtain the good match to the subsidence results of Allis and Zhan (2000) shown in Figures 3 and 5. This value is
in the range 0.4-0.6 reported by Suarez-Rivera (2013) and Fjᴂr (2008) for mudstones.
Table 2: Model parameters
Property Mudstone Pumice breccia
Young’s modulus 𝐸(MPa) 6.6228 94.706
Poisson’s ratio 𝜈 0.15 0.15
Vertical permeability 𝑘𝑧 (m2) 6.3E-17 1.0E-13
Porosity 0.1 0.1
Thermal conductivity K (W/m K) 2.5 2.5
Density of rock rock (kg/m3) 2500 2500
Specific heat of rock C (J/kg K) 1000 1000
Recharge coefficient A 3E-8 9E-6
Biot coefficient 𝛼 0.5 0.5
Layer thickness (m) 100 50
Table 3: Other parameters used
Initial pressure (MPa) Bottom 2.09812
Top 0.60135
Initial temperature (oC) Bottom 112.0
Top 15.0
15
0 m
Pumice bracia Pumice bracia 15
0 m
Fixed P
Fixed P
No
flowNo
flow
(a) Natural state
P variable in
time, t,
P variable in
time, t,
Side
recharge
boundary
condition
Side
recharge
boundary
condition1
00
m5
0 m
(b) Production
A
B
C
D
Pumice
MudstoneMudstone
Pumice

Koros et al.
6
(a) (b)
(c)
Figure 2: Pressure profiles from 1950-2000. (a) Allis and Zhan, (2000), (b) FEHM, (c) TOUGH2
(a) (b)
(c)
Figure 3: Displacement versus elevation at 5 year increments. (a) Allis and Zhan, (2000), (b) FEHM, (c) TOUGH2
Koros et al.
7
(a) (b)
(c)
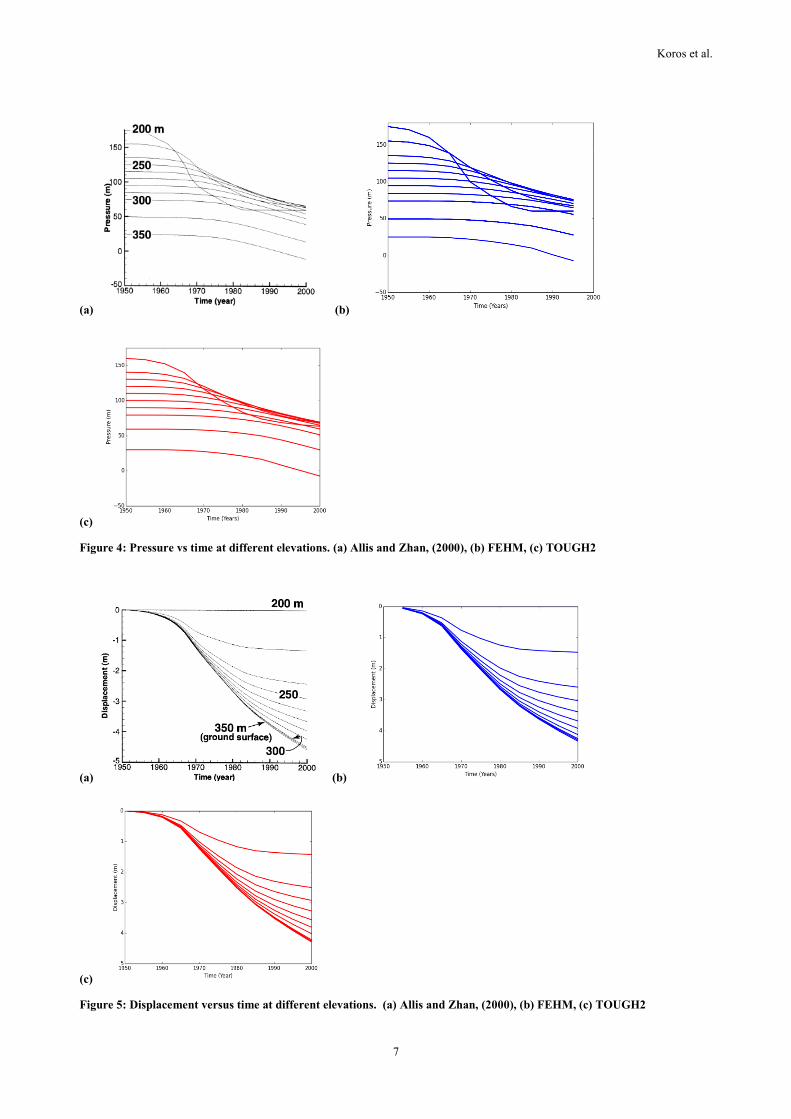
Figure 4: Pressure vs time at different elevations. (a) Allis and Zhan, (2000), (b) FEHM, (c) TOUGH2
(a) (b)
(c)
Figure 5: Displacement versus time at different elevations. (a) Allis and Zhan, (2000), (b) FEHM, (c) TOUGH2

Koros et al.
8
5.2 FEHM model
The second model we set up was essentially the same as our first model but instead of using TOUGH2 and a manual deformation
calculation we used FEHM for the whole THM simulation. FEHM has the same functionality as TOUGH2 for heat and mass
transfer calculations but has a slightly different system for defining the block structure and the boundary conditions. With FEHM
we were able to directly specify the time varying top and bottom boundary pressures. For our TOUGH2 model we used 30 blocks,
each 5m thick, in our model whereas in FEHM we used a “half” block, 2.5m thick, next to the top and bottom boundaries.
For the deformation problem FEHM uses a finite element grid whose nodes form the corners of the finite volume blocks used in the
heat and mass transfer calculation. For the deformation problem we used the following boundary conditions:
Bottom nodes: zero displacement in all directions
Side nodes: zero perpendicular displacement, zero shear stress
Top nodes: zero perpendicular displacement, zero shear stress, zero vertical stress
The results generated with FEHM are shown in Figures 2-5. Reassuringly they agree well with the TOUGH2 results and those of
Allis and Zhan (2000).
5.3 Updated rock parameters
Recently a major study of subsidence at Wairakei-Tauhara was commissioned by the field operator Contact Energy Limited and
rock properties were measured (Bromley et al., 2010; Pender et al., 2013). The values of Young’s modulus for samples taken from
the Wairakei subsidence bowl are listed in Table 4, together with layer thicknesses of Mudstone and Pumice breccia which have
been switched to match in situ conditions reported in Bromley, et al., (2010).
Table 4: Compressibility properties of rock at the Wairakei subsidence bowl.
Property Mudstone Pumice breccia
Young’s modulus
𝐸(MPa)
4.0 42.0
Poisson’s ratio 𝜈 0.25 0.25
Biot coefficient 𝛼 0.5 0.5
Layer thickness(m) 50 100
We then re-ran the FEHM model using the measured rock properties shown in Table 4. All of the other model parameters were left
unchanged. The results obtained for total subsidence at the surface are shown in Figure 6.
Figure 6: Total subsidence at the surface using rock properties from Allis and Zhan (2000) (red) and measured data (blue).
The results from the model using measured rock properties do not match the results from the Allis and Zhan (2000) model which
was calibrated to match the field data reasonably well. However the model used unchanged permeabilities and recharge coefficients
and some re-calibration of these parameters is warranted. In general a low Young’s modulus will be associated with a low
permeability and probably a variable permeability should be used in the model, matching the variation in Young’s modulus. The
model with measured material properties in Figure 6 depicts less subsidence, though equivalent Young’s modulus is actually lower.
This is due to a higher value of Poisson’s ratio besides an increase in thickness of Pumice layer where horizontal recharge rates
were higher. A higher recharge rate results in less pore fluid pressure decline thus less subsidence.

Koros et al.
9
6. CONCLUSIONS
We have been able to reproduce the results of Allis and Zhan (2000) in modelling subsidence at the A97 bench mark near the
Wairakei subsidence bowl. In order to achieve this good match to their results some unsatisfactory features had to be used in our
model. For example we imposed a time dependent pressure at the top boundary of our model corresponding to the boundary
condition used by Allis and Zhan (2000). It would be more physically realistic to extend the model up to ground surface and
include an unsaturated zone at the top of the model. Then, if the model is working well, the water table should fall in a manner
which matches the change of pressure with time at the top of the model discussed above.
When we modified our model to include values of Young’s modulus measured from core samples taken near the Wairakei
subsidence bowl the match of our model results to the field data is degraded. However further re-calibration of the model adjusting
permeabilities and recharge coefficients may recover the quality of the match. This work will be carried out in the future.
Also in future work we wish to investigate the use of more complex constitutive laws for the deformation of rock, possibly
including elasto-plastic yielding behaviour by utilising a more advanced solid mechanics simulator –such as ABAQUS (ABAQUS
2003).
The importance of the lateral recharge coefficient in determining the behaviour of our 1D column model is an indication that the 1D
approach is not adequate and in the future we will investigate radially symmetric (r-z) models and fully 3D models.
REFERENCES
ABAQUS Inc.: ABAQUS Analysis User’s Manual Version 6.4, ABAQUS Inc., Pawtucket, RI (2003).
Allis, R. G.: Review of subsidence at Wairakei field, New Zealand, Geothermics, 29, (2000), 455–478.
Allis, R. G.: In the matter of the Resource Management Act 1991 and in the matter of an application by Contact Energy Limited for
resource consents for the Wairakei Geothermal Power Plant. New Zealand, (2004).
Allis, R.G. and Zhan, X.: Predicting subsidence at Wairakei and Ohaaki geothermal fields, New Zealand. Geothermics, 29, (2000),
479-497.
Allis, R., Bromley, C. and Currie, S.: Update on subsidence in the Wairakei-Tauhara geothermal system, New Zealand,
Geothermics, 38, (2009), 169-180.
Biot, M.A.: General Theory of Three-Dimensional Consolidation. Journal of Applied Physics, 12(2), (1941), 155-164.
Biot, M. A.: General solutions of the equations of elasticity and consolidation for a porous material, Journal of Applied Mechanics,
23, (1965), 91–96.
Bixley, P.F., Clotworthy, A.W., Mannington, W.I.: Evolution of the Wairakei geothermal reservoir during 50 years of production.
Geothermics 38, (2009), 145–154.
Bromley, C.J, Currie, S., Ramsay, G., Rosenberg, M., Pender, M., O’Sullivan, M., Lynne, B., Lee, S-G., Brockbank, K., Glynn-
Morris, T., Mannington, W., & Garvey, J.: Tauhara Stage II Geothermal Project: Subsidence Report, GNS Science
Consultancy Report 2010/151 (and appendices 1-10). Published by Contact Energy Ltd. 154p, (2010).
Bromley, C., Brockbank, K., Glynn-Morris, T., Rosenberg, M., Pender, M., O'Sullivan, M. J., Currie, S.. Geothermal subsidence
study at Wairakei-Tauhara, New Zealand. Proceedings of the Institution of Civil Engineers: Geotechnical Engineering, 166
(GE2), (2013), 211-223.
Croucher, A.: PyTOUGH User's Guide. University of Auckland, Auckland (2013).
Currie, S.: Wairakei - Tauhara regional precise Leveling Survey, Report by Energy Surveys Ltd, January (2009).
De Boer, R. and Lade, P.V.: The concept of effective stress for soil, concrete and rock. Geotechnique, 47(1), (1997), 61-78.
Fjᴂr, E., Holt, M.R., Horsrud, P., Raaen, A. and Risnes, R. (Editors): Petroleum Related Rock Mechanics. Development in
petroleum Science, 53, Newhaven,Church Street, Wrexham LL13,UK, 1-491 pp (2008).
Gambolati, G., Ferronato, M. and Teatini, P.: Reservoir compaction and land subsidence. Revue Européenne de Génie Civil, 10(6-
7), (2006), 731-762.
Gambolati, G., Riccerti, G., Bertoni, W., Brighenti, G. and Vuillermin, E.: Mathematical simulation of the subsidence of Ravenna.
Water Resources Research, 27(11), (1991), 2899-2918.
Geertsma, J.: Land subsidence above compacting oil and gas reservoirs, Journal of Petroleum Technology, 25, (1973),734-744.
Goulty, N.R.: Mechanical compaction behaviour of natural clays and implications for pore pressure estimation. Petroleum
geoscience, 10(1), (2004), 73-79.
Hettema, H.M., Schutjens, P.M.T.M., Verboom, B.J.M. and Gussinklo, H.J.: Production-Induced Compaction of a Sandstone
reservoir: The Strong Influence of Stress Path. SPE Reservoir Evaluation & Engineering, 3(4), (2000) 342-347.
Itasca Consulting Group Inc.: FLAC3D Manual: Fast Lagrangian Analysis of Continua in 3 dimensions—Version 2.0. Itasca
Consulting Group Inc., Minnesota, USA, (1997).
Kiryukhin A.V., Rutqvist J.and Maguskin M.A.: Thermal-Hydrodynamic-Mechanical Modeling of Subsidence During Exploitation
of the Mutnovsky Geothermal Field, Kamchatka. Proceedings, 39th Workshop on Geothermal Reservoir Engineering
Stanford University, Stanford, CA (2014).

Koros et al.
10
Lade, P.V. and de Boer, R.: The concept of effective stress for soil, concrete and rock, Geotechnique, 47(1), (1997), 61-78.
Lewis, R. W. and Schrefler, B. A.: The Finite-Element Method in the Deformation and Consolidation of Porous Media, Wiley,
Chichester, England, (1987).
Jones, M.: Mechanical principles of sediment deformation. In Maltman,A.(Ed.), The Geological Deformation of Sediments. London
(Chapman and Hall), pp. 37-71, (1994).
Nur, A.: An Exact Effective Stress Law for Elastic Deformation of Rock with Fluids. Geophysical Research, 76(26), (1971) 6414-
6419.
Pender, M., Bromley, C., Brockbank, K., Glynn-Morris, T., Rosenberg, M., O'Sullivan, M. J., Currie, S.: Rock compressibility at
theWairakei-Tauhara geothermal field, New Zealand. Proceedings of the Institution of Civil Engineers: Geotechnical
Engineering, 166 (GE2), (2013), 224-234.
Pogacnik, J., O'Sullivan, M., and O'Sullivan, J.: A Damage Mechanics Approach to Modeling Permeability Enhancement in
Thermo-Hydro-Mechanical Simulations, Proceedings, Thirty-Ninth Workshop on Geothermal Reservoir Engineering,
Stanford University, Stanford, California, February 24-26, (2014).
Pruess, K., Oldenburg, C. and Moridis, G.: TOUGH2 User’s Guide Version 2.0, University of California, Berkeley, California,
USA, (1999).
Rosenberg, D.M., Bignall, G. and Rae, J.A.: The geological framework of theWairakei–Tauhara Geothermal System,New Zealand.
Geothermics, 38, (2009) 72-84.
Rutqvist, J.: Status of the TOUGH-FLAC simulator and recent applications related to coupled fluid flow and crustal deformations.
Computers & Geosciences 37, (2011), 739–750.
Rutqvist, J., Wu, Y.-S, Tsang, C.-F. and Bodvarsson, G.: A modelling approach for analysis of coupled multiphase fluid flow, heat
transfer, and deformation in fractured porous rock, International Journal of Rock Mechanics, 39, (2002), 429–442.
Rutqvist, J., Birkholzer, J., Cappa, F.d.r., Oldenburg, C. and Tsang, C.-F.: Shear-slip analysis in multiphase fluid-flow reservoir
engineering applications using TOUGH-FLAC. Proceedings, TOUGH Symposium Lawrence Berkeley National Laboratory,
Berkeley, California, (2006).
Schrefler, B. A. and Zhan, X.: A fully coupled model for water flow and airflow in deformable porous media, Water Resources
Research, 29, (1993), 155–167.
Suarez_Rivera, R. and Fjᴂr, E.: Evaluating the poroelastic effect on anisotropic, organic-rich mudstone systems. Rock Mech Rock
Eng, 46, (2013), 569-580.
Terzaghi, K.: The shearing resistance of saturated soils and the angle between planes of shear. Proceedings, SMFE Conference,
Harvard Mass., (1936), pp. 54-56.
Terzaghi, S.: In the matter of the Resource Management Act 1991 and in the matter of a hearing by Waikato Regional Council of a
submission by Taupo District Council in relation to applications by Contact Energy Limited for the resource consents
required for activities related to the use of the Wairakei-Tauhara geothermal system for electricity generation purposes. New
Zealand. (2004).
Wanninayake, A., Davidson, R., Gillani, I.: One-dimensional subsidence analyses for Wairakei-Tauhara geothermal fields. Report
for Contact Energy Ltd by URS Australia Pty Ltd. (2010).
Wellmann, F. J., Croucher, A., & Regenauer-Lieb, K.: Python scripting libraries for subsurface fluid and heat flow simulations with
TOUGH2 and SHEMAT. Computers & Geosciences, 43(0), (2012),197-206. http://dx.doi.org/10.1016/j.cageo.2011.10.011
White, P. J., Lawless, J. V., Terzaghi, S. and Okada, W.: Advances in subsidence modelling of exploited geothermal fields,
Proceedings, World Geothermal Congress, Antalya, Turkey, 24-29 April (2005).
Yeh, A. and O’Sullivan, M.J.: Computer modelling subsidence in geothermal fields, Proceedings, 29th New Zealand Geothermal
Workshop, University of Auckland. (2007).
Zyvoloski, A.G.: FEHM: A Control Volume Finite Element Code for Simulating Subsurface Multi-phase Multi-fluid Heat and
Mass Transfer Los Alamos National Laboratory New Mexico. (2007).
Zyvoloski, A.G., Robinson, A.B., Dash, V.Z. and Trease, L.L.: User's Manual for the FEHM Application–A Finite-Element-Heat-
and Mass-Transfer Code, Los Alamos, California. (1997).