Comparison of Carbon Dioxide Emissions of the Ordinary ...
16
sustainability Article Comparison of Carbon Dioxide Emissions of the Ordinary Reinforced Concrete Slab and the Voided Slab System During the Construction Phase: A Case Study of a Residential Building in South Korea Inkwan Paik 1 and Seunguk Na 2, * 1 Super-Tall Building Global R & BD Centre, The 2nd Engineering Hall, 152 Jukjeon-ro, Yongin-si, Gyeonggi-do 31116, Korea 2 .Department of Architectural Engineering, College of Architecture, 152 Jukjeon-ro, Yongin-si, Gyeonggi-do 31116, Korea * Correspondence: [email protected]; Tel.: +82-31-8005-3707 Received: 7 June 2019; Accepted: 26 June 2019; Published: 28 June 2019 Abstract: The construction industry not only consumes a lot of energy but also emits large volumes of carbon dioxide. Most countries have established target reduction values of the carbon dioxide emissions to alleviate environmental burdens and promote sustainable development. The reduction in carbon dioxide emissions in the construction industry has been taking place in various ways as buildings produce large quantities of the carbon dioxide over their construction life cycle. The aim of this study is to assess and compare the carbon dioxide emissions of an ordinary reinforced concrete slab and the voided slab system applied to a case study involving a commercial-residential complex building in South Korea. Process-based life-cycle assessment (LCA) is adopted to compute the carbon dioxide emissions during the construction phase, which includes all processes from material production to the end of construction. The results indicate that the total CO 2 emissions are 257,230 and 218,800 kg CO 2 for the ordinary reinforced concrete slab and the voided slab system, respectively. The highest contributor to CO 2 reduction is the embodied carbon dioxide emissions of the building materials, which accounts for 34,966 kg CO 2 . The second highest contributor is the transportation of the building materials, accounting for 3417 kg CO 2 . Keywords: reinforced concrete slab; void slab; residential building; life cycle assessment; process-based; carbon dioxide 1. Introduction It is recognised that the construction industry not only consumes a lot of energy but also emits a large volume of carbon dioxide per [1–9]. According to the report of the Intergovernmental Panel on Climate Change (IPCC), the construction industry accounts for approximately 40% of global energy consumption and contributes up to 30% to the total global carbon dioxide emissions [10]. Moreover, carbon dioxide emissions from the construction industry are expected to more than double in the next 20 years unless activities to reduce their quantity are undertaken, owing to rapid urbanisation and limited global housing stock [11]. According to the 1992 Framework Convention on Climate Change, nearly 200 countries have consented to limit the consumption of fossil energy to mitigate anthropogenic climate changes [12]. To alleviate the environmental burdens and promote sustainable development, most countries have established target reduction values for carbon dioxide emissions. The South Korean Government, for example, announced a voluntary target value to reduce domestic greenhouse gases by up to 37% compared to the business as usual (BAU) scenario [13]. In a similar Sustainability 2019, 11, 3571; doi:10.3390/su11133571 www.mdpi.com/journal/sustainability
Transcript of Comparison of Carbon Dioxide Emissions of the Ordinary ...

sustainability
Article
Comparison of Carbon Dioxide Emissions of theOrdinary Reinforced Concrete Slab and the VoidedSlab System During the Construction Phase: A CaseStudy of a Residential Building in South Korea
Inkwan Paik 1 and Seunguk Na 2,*1 Super-Tall Building Global R & BD Centre, The 2nd Engineering Hall, 152 Jukjeon-ro, Yongin-si,
Gyeonggi-do 31116, Korea2 .Department of Architectural Engineering, College of Architecture, 152 Jukjeon-ro, Yongin-si,
Gyeonggi-do 31116, Korea* Correspondence: [email protected]; Tel.: +82-31-8005-3707
Received: 7 June 2019; Accepted: 26 June 2019; Published: 28 June 2019�����������������
Abstract: The construction industry not only consumes a lot of energy but also emits large volumesof carbon dioxide. Most countries have established target reduction values of the carbon dioxideemissions to alleviate environmental burdens and promote sustainable development. The reductionin carbon dioxide emissions in the construction industry has been taking place in various ways asbuildings produce large quantities of the carbon dioxide over their construction life cycle. The aim ofthis study is to assess and compare the carbon dioxide emissions of an ordinary reinforced concreteslab and the voided slab system applied to a case study involving a commercial-residential complexbuilding in South Korea. Process-based life-cycle assessment (LCA) is adopted to compute thecarbon dioxide emissions during the construction phase, which includes all processes from materialproduction to the end of construction. The results indicate that the total CO2 emissions are 257,230and 218,800 kg CO2 for the ordinary reinforced concrete slab and the voided slab system, respectively.The highest contributor to CO2 reduction is the embodied carbon dioxide emissions of the buildingmaterials, which accounts for 34,966 kg CO2. The second highest contributor is the transportation ofthe building materials, accounting for 3417 kg CO2.
Keywords: reinforced concrete slab; void slab; residential building; life cycle assessment;process-based; carbon dioxide
1. Introduction
It is recognised that the construction industry not only consumes a lot of energy but also emits alarge volume of carbon dioxide per [1–9]. According to the report of the Intergovernmental Panel onClimate Change (IPCC), the construction industry accounts for approximately 40% of global energyconsumption and contributes up to 30% to the total global carbon dioxide emissions [10]. Moreover,carbon dioxide emissions from the construction industry are expected to more than double in thenext 20 years unless activities to reduce their quantity are undertaken, owing to rapid urbanisationand limited global housing stock [11]. According to the 1992 Framework Convention on ClimateChange, nearly 200 countries have consented to limit the consumption of fossil energy to mitigateanthropogenic climate changes [12]. To alleviate the environmental burdens and promote sustainabledevelopment, most countries have established target reduction values for carbon dioxide emissions.The South Korean Government, for example, announced a voluntary target value to reduce domesticgreenhouse gases by up to 37% compared to the business as usual (BAU) scenario [13]. In a similar
Sustainability 2019, 11, 3571; doi:10.3390/su11133571 www.mdpi.com/journal/sustainability

Sustainability 2019, 11, 3571 2 of 16
vein, the Chinese government has set up a 20% greenhouse gas reduction target by 2020. Likewise, theconstruction industry has been exploring various approaches to achieve the target reduction valueof carbon dioxide emissions. Many experts expect that efforts to mitigate carbon dioxide emissionsin the construction sector, which produces a significant amount of carbon dioxide emissions, wouldcontribute to a reduction in the total global carbon dioxide emissions [5,6,14–17].
The reduction in carbon dioxide emissions in the construction industry has been taking placein various ways as buildings produce large quantities of carbon dioxide over their entire life cycle,which includes manufacturing building materials, transporting the building materials, construction,operation, and demolition. Research focused on CO2 emissions during the entire life cycle of a buildingrevealed that the construction, operation, and demolition stages account for approximately 13%, 85%,and 2% of CO2 emissions, respectively [7,18–21]. Studies on reducing carbon dioxide emissions inthe construction industry have focused on the operational stages rather than other phases, as the lifecycle of buildings and facilities is relatively long and accounts for a relatively large proportion ofcarbon dioxide emissions [20–23]. Several studies have suggested numerous technologies, strategies,and policies to lower the carbon dioxide emissions in the operating stage of buildings [15–18,24–26].In particular, with the increased application of advanced energy-efficient equipment in buildings, theCO2 produced from the operational stage of buildings has been reduced [24–27]. Furthermore, studieshave focused more on reducing carbon dioxide emissions from the operation stage because the lifespanof a building is 50 years or more, which is relatively longer than those of other products. On the otherhand, there has been little interest in the carbon dioxide emitted during the construction phase as theamount of carbon dioxide in this stage is relatively smaller than that during the operation stage of abuilding. Although the amount of carbon dioxide emissions from the construction phase are small, theoverall impact of operational carbon dioxide is large [23].
Moreover, several studies have dealt with the impact and significance of the construction phaseregarding carbon dioxide emissions [7,8,15–17,19,25,28,29] In particular, most studies have concludedthat cutting down the carbon dioxide emissions released by construction materials would be oneof the most effective approaches [17,29–31]. González and Navarro [16] found that the selection oflow environmental impact materials would reduce carbon dioxide emissions by up to 28% at theconstruction site. Cho and Chae [32] suggested methods that use recycled materials or industrialby-products and shortening of the manufacturing process of the construction materials to lowermaterial utilisation during the construction phase. Likewise, replacing high-strength materials such ashigh-strength rebars and concrete would be one of the effective methods for reducing carbon dioxideemissions. For example, Tae et al. [33] indicate that application of high-strength reinforced concretewould result in a lowering of rebars in reinforced concrete structures as well as extend the life spanof buildings. In addition, Cho and Na [34] show that replacing the high-strength reinforcing barsin different structural systems would be advantageous to reducing the emissions of carbon dioxide.Alternatively, some of the research suggests that design optimizations with different structural systemswould be beneficial to the construction industry with regards to environmental impact. Xing et al. [28]conducted a comparative study which indicated the differences in the life cycle energy consumption andcarbon dioxide emissions of steel and reinforced concrete structures. In this study, they demonstratedthat steel structured buildings are more environmentally friendly as they emit half of the CO2 persquare meter emitted by a reinforced concrete building. In other words, the construction materials andstructural system of buildings could be crucial factors determining the emissions of the carbon dioxideduring the construction phase.
The voided slab system or hollow core slab system is a hybrid structural system incorporatingconcrete with void formers to reduce the amount of construction materials. Structurally, the voidedslab system is an effective method for extending the span of a building or structure as it reducesthe weight of concrete. Several researchers have maintained that the voided slab system would beadvantageous not only in terms of structural and economic aspects but also because of its environmentalfriendliness [35–37]. From the structural design perspective, there are several studies that have examined

Sustainability 2019, 11, 3571 3 of 16
and confirmed the stability and reliability of the voided slab system. Lee et al. [38], for instance, verifiedthe performance of the TVS, which applies lightweight balls to the concrete slab in two-way voidedslab-to-column connections. According to Chung et al. [39], the flexural capacities of the two-wayvoided slab system that is associated with donut-type void formers in the slab are similar to those ofconventional reinforced concrete slabs. Moreover, the voided slab system has been adopted graduallyin apartment housing in South Korea as an alternative to reduce interlayer noise complaints issues.It was reported that the Seoul Housing and Communities Corporation (SH Corporation), and theLand and Housing Corporation (LH Corporation Korea) have applied the voided slab system to newlybuilt apartment housing as a countermeasure to reduce interlayer noise. Although there have beenseveral studies dealing with the structural performance of the voided slab system, studies on theenvironmental performance and impact of the voided slab system are limited. Based on previousstudies, it is considered that the voided slab system has a dual aspect to maximise the structuralperformance of a structure and to minimise its environmental impacts.
The purpose of this study was, therefore, to assess and compare the carbon dioxide emissionsof an ordinary reinforced concrete slab and the voided slab system applied to a case study involvinga commercial-residential complex building in South Korea. In this study, process-based life-cycleassessment (LCA) was adopted to compute the carbon dioxide emissions during the constructionphase, which embraces all the processes from materials production to the end of construction (i.e.cradle to pre-operation). The comparison was conducted for the following five stages: buildingmaterials before transporting them to the construction site; transporting the building materials tothe site; fuel consumptions from the construction equipment; usage of electricity at the site; andtransporting the construction waste. The analysed data of this research is further discussed to illustratethe environmental impacts of the ordinary reinforced concrete slab and the voided slab system duringthe construction phase.
2. Research Method
2.1. Overview of the CO2 Calculation Method
There are various quantification tools for assessing the environmental impacts of buildings.The methods for quantification and evaluation adopted in previous studies can be categorized intoprocess-based and economic input-output analyses [40–44]. The process-based analysis investigatesrelevant data from manufacturing to demolition of a product and determine the energy consumptionand carbon dioxide emissions from the collected data. This approach is a bottom-up method thatcomplies with ISO 14044 [45] and ISO 21930 [46] for assessing the environmental impacts of productsand services based on the production processes. In this method, the environmental impacts andcarbon dioxide emissions would be measured by the amount of materials produced and the energyconsumed during the production process. For example, Gustavsson and Sathre [47] compared theenergy consumption and carbon dioxide emissions of building materials with a focus on wood andconcrete by adopting the process-based analysis. When the life cycle of a building is considered to be incompliance with the process-based approach, it is divided into the stages of production, transportation,construction, operation, and demolition. Yan et al. [16] conducted a case study to evaluate the emissionsof greenhouse gases in a building construction phase considering the five relevant stages. Similarly,Lee et al. [8] analysed the carbon dioxide emissions in an apartment housing project, which is one ofthe most popular dwelling types in South Korea. In addition, Dong et al. [25] conducted a comparativestudy that evaluated the CO2 emissions of precast and cast-in-situ concrete methods by applyingthe process-based approach. For the process-based perspective, the assessment of carbon dioxideemissions would vary depending on how the assessor would establish the system boundary of thetargeted products and services.
The economic input-output analysis is also applied to evaluate the carbon dioxide emissionsof products and services. This approach is a top-down method which considers not only direct

Sustainability 2019, 11, 3571 4 of 16
environmental impacts but also indirect impacts of the targeted products or services. The datain economic input-output analysis are normally derived from statistical or census data related tomanufacturing a product or delivering a service. In general, it is practical to predict the directand indirect industrial impacts of products or services on the national economy even though it istime-consuming and expensive to collect all the relevant and available data. Moreover, one of thefeatures of the economic input-output analysis is that enhanced accuracy of the computed results isachieved when the quantity and scope of the data are secured. The application of the input-outputanalysis in the construction industry is frequently observed in studies conducted in the USA andJapan because the collection of data takes place in more than 400 sectors related to this industry.For example, Suzuki and Oka [48] and Hong et al. [7] carried out research to calculate the carbondioxide emissions during the construction stage by performing an economic input-output analysis.Likewise, Cho and Na [34] assessed the variation in CO2 emissions from three different structuraltypes buildings replaced ordinary strength rebars with high-strength reinforcement by adopting aneconomic input-output analysis. Various studies applying the input-output analysis to evaluate theCO2 emissions during the construction phase have ignored the stages related to transporting materialsand waste (e.g. transportation of materials and waste).
In this study, a process-based analysis is used to assess and compare the carbon dioxide emissionsfrom two different slab systems during the construction phase. The construction phase of both slabsystems is bounded from the material production to pre-operation stages. It is divided into four stages,which are manufacturing of building materials, transportation of the building materials from themanufacturing location to the construction site, construction, and disposal of the construction waste(See Figure 1).
Sustainability 2019, 11, x FOR PEER REVIEW 4 of 15
manufacturing a product or delivering a service. In general, it is practical to predict the direct and indirect industrial impacts of products or services on the national economy even though it is time-consuming and expensive to collect all the relevant and available data. Moreover, one of the features of the economic input-output analysis is that enhanced accuracy of the computed results is achieved when the quantity and scope of the data are secured. The application of the input-output analysis in the construction industry is frequently observed in studies conducted in the USA and Japan because the collection of data takes place in more than 400 sectors related to this industry. For example, Suzuki and Oka [48] and Hong et al. [7] carried out research to calculate the carbon dioxide emissions during the construction stage by performing an economic input-output analysis. Likewise, Cho and Na [34] assessed the variation in CO2 emissions from three different structural types buildings replaced ordinary strength rebars with high-strength reinforcement by adopting an economic input-output analysis. Various studies applying the input-output analysis to evaluate the CO2 emissions during the construction phase have ignored the stages related to transporting materials and waste (e.g. transportation of materials and waste).
In this study, a process-based analysis is used to assess and compare the carbon dioxide emissions from two different slab systems during the construction phase. The construction phase of both slab systems is bounded from the material production to pre-operation stages. It is divided into four stages, which are manufacturing of building materials, transportation of the building materials from the manufacturing location to the construction site, construction, and disposal of the construction waste (See Figure 1).
Figure 1 System boundary of the study (Source: own elaboration).
To calculate the emission of carbon dioxide, the four stages of the construction phase are divided into five parts:
1) Embodied carbon dioxide emissions of building materials before the materials are transported to the construction site;
2) Carbon dioxide emissions from transporting the building materials to the construction site, which are the result of fuel consumption during the transportation process;
3) Carbon dioxide emissions from fuel consumption due to operation of equipment and machinery on site;
4) Carbon dioxide emissions from electricity usage at the construction site;
5) Carbon dioxide emissions from fuel consumption due to transporting the construction waste.
The evaluated case of this study is a commercial-residential complex building located in Seoul, South Korea, whose construction started in 2012 and was completed in 2014. The building’s structural system was designed in accordance with ACI 318-05 [49] and ASCE/SEI 7-10 [50] and the basic
Figure 1. System boundary of the study (Source: own elaboration).
To calculate the emission of carbon dioxide, the four stages of the construction phase are dividedinto five parts:
(1) Embodied carbon dioxide emissions of building materials before the materials are transported tothe construction site;
(2) Carbon dioxide emissions from transporting the building materials to the construction site, whichare the result of fuel consumption during the transportation process;
(3) Carbon dioxide emissions from fuel consumption due to operation of equipment and machineryon site;
(4) Carbon dioxide emissions from electricity usage at the construction site;(5) Carbon dioxide emissions from fuel consumption due to transporting the construction waste.
Sustainability 2019, 11, 3571 5 of 16
The evaluated case of this study is a commercial-residential complex building located in Seoul,South Korea, whose construction started in 2012 and was completed in 2014. The building’s structuralsystem was designed in accordance with ACI 318-05 [49] and ASCE/SEI 7-10 [50] and the basic attributesof the building are shown in Table 1. In the early stage of the design, the structural system of the slabwas designed such that it would be an ordinary reinforced concrete slab. During the value analysisstage prior to construction documentation, the voided slab system was proposed as an alternativesystem as it has a remarkable performance against noise insulation as well as the possibility of spacevariations with increased span. Additionally, because the void formers are easier to install thanconventional hollow core slab systems, the void slab system was adopted in this study.
Table 1. The structural attributes of the building.
Design guidance
American Concrete Institute (ACI 318-05, Building code requirement forreinforced concrete [49])
American Society of Civil Engineers (ASCE/SEI 7-10, Minimum designloads and associated criteria for buildings and other structures [50])
Compressive strength of theconcrete fck = 24 MPa
Tensile strength of the rebars fy = 400 MPa
Dead load 7.94 kN/m2
Live load 4.00 kN/m2
2.2. Calculation Method for Carbon Dioxide Emissions of Building Materials
The elements for calculating the emissions of carbon dioxide from building materials beforetransporting the materials to the construction site are the amount of each building material (in kg, m3,and m2) and CO2 emission factors (in kg CO2-eq / unit) for the building materials. The equation 1was used to calculate the embodied carbon dioxide emissions of building materials for the ordinaryreinforced slab and the voided slab system.
E1 =∑
Mi × fi (1)
where E1 represents the total embodied carbon dioxide emissions of building materials (in kg CO2 eq);Mi is the amount of the building material i; and fi is the CO2 emission factor for the building material i(in kg CO2-eq / unit). The amounts of building materials for the ordinary reinforced concrete slab andthe voided slab system were computed from the bill of quantities and daily construction work reports.The CO2 emission factors for building materials were obtained from the Korean national life-cycleinventory database (KLCI DB) as shown in Table 2 [51].
Table 2. Life-cycle inventory database.
Materials Unit Emission Factors(kg CO2-eq/unit) Resource
Ready-mixed concrete (25-240-15) m3 4.20 × 10²The Korean National
Life-Cycle Inventory Database(KLCI DB)
Rebars kg 3.40 × 101
Forms m2 1.46 × 10²
Expanded polystyrene (EPS) kg 1.87 × 101
Steel decking m2 3.85 × 101

Sustainability 2019, 11, 3571 6 of 16
2.3. Calculation Method for Transportation of Building Materials
The main factors needed to calculate the CO2 emission due to transportation of constructionmaterials were the amount of construction materials and the fuel consumed by the transportationmethods. Equation (2) shows the calculation formula for CO2 emissions from transporting constructionmaterials to the construction site.
E2 =∑
(FC ×NTrans) × ftrans2)=
∑[(Dm/FEm) × (Mm/CCap)] × ftrans (2)
where E2 represents the total CO2 emissions from transportation of all construction materials (in kgCO2 eq); Fc is the amount of fuel consumed in the transportation stage (in kg CO2); NTrans is thenumber of vehicles for construction materials; and ftrans represents the CO2 emission factors for thetransportation method (kg CO2-eq/kg). The amount of consumed fuel for each transportation method(Fc) was estimated based on the distance between the suppliers’ location and the construction site,and the fuel efficiency. In addition, the number of vehicles for transporting the construction materialswas determined in consideration of the amount of construction materials and the capacity of thetransportation method for each material (see Equation (3)).
E2 =∑
[(Dm/FEm) × (Mm/CCap)] × ftrans (3)
where Dm is the distance from the supplier’s location to the construction site; FEm is the fuel efficiencyof the transportation method (e.g. the fuel efficiency of a concrete mixer and 4.5-ton lorry); Mm is theamount of construction materials (in m3 for ready-mixed concrete, and kg for reinforcing bars, andsteel decking and forms); and Ccap is the capacity of the transportation method. The transportationdistance applied in this study was calculated based on the actual distance indicated in the constructionwork log as shown in Table 3. In this study, the transportation methods of construction materials weredifferent for each material. For example, the ready-mixed concrete was transported by a concrete mixer,and reinforcing bars and steel decking were delivered by 11.5-ton lorries, and forms and void formerswere conveyed by 4.5-ton lorries.
Table 3. Materials and type of transportation of the construction materials (Source: own elaboration).
Materials Distance (Unit: km) Type of Transportation
Ready mixed concrete 25 Concrete mixer
Reinforcing bars 380 Lorry (11.5 ton)
Steel decking 110 Lorry (11.5 ton)
Forms 30 Lorry (4.5 ton)
Void formers 40 Lorry (4.5 ton)
2.4. Calculation Method for Carbon Dioxide Emissions from Fuel Consumption of ConstructionEquipment Operation
In this study, we considered that the amount of carbon dioxide emissions given off by theconstruction equipment was closely related to the quantity of fuel consumed by the constructionequipment on site. The amount of fuel consumed by the construction equipment was divided intotwo types: that consumed during actual operation and that consumed during idling time. Whenthe construction equipment was operated in the construction fields, it was noticed that most of themachinery and equipment on site were turned on but standing by rather than only being turned onwhen needed for particular operations. For this reason, we considered that it would be reasonableto estimate the amount of fuel consumption from the construction machinery and equipment in twotypes as mentioned above (i.e. the fuel consumption during operation and idling time).

Sustainability 2019, 11, 3571 7 of 16
Based on this consideration, the total emissions of CO2 from the construction equipment is thesum of CO2 emissions in the operation and idling time. Equation (4) represents the emissions of carbondioxide in the construction stage from operation of the equipment. The carbon dioxide emissions forEoper and Eidle were estimated by applying the following formulae, which calculated the amount ofconsumed fuel for the construction equipment.
E3 = Eoper + Eidle=∑
(Lope × fi) + (Lidle × fi) (4)
where E3 represents the total carbon dioxide emissions during the construction stage resulting fromconstruction equipment usage (in kg CO2 eq); Eoper are the carbon dioxide emissions released owing tofuel consumption in operation of the construction equipment (in kg CO2 eq); Eidle is the amount of CO2
emitted by the construction equipment during the idling time (in kg CO2 eq); Lope is the amount of fuelconsumed during operation of the construction equipment; fi is the carbon dioxide emission factor offuel i; and Lidle is the amount of fuel consumed by the construction equipment in the idling time. Thecarbon dioxide emissions factors for types of fuel are indicated in Table 4. The fuel consumed duringoperation of construction equipment and idling time was calculated using Equations (5) and (6).
Loper = (Q/Rmax) × FEoper (5)
where Q is the capacity of concrete that is used by the construction equipment (m3); Rmax is the actualmaximum output capacity of the concrete pump car; and FEoper is the fuel efficiency of the concretepump car in the operation time (in m3/l).
Lidle = [Tconc − (Q/Rmax)] × FEidle (6)
where Tconc is the required time for concrete work; and FEidle is the fuel efficiency of the concretepump car in the idling time (in m3/l). In this study, the required time for concrete work and thefuel consumption in the operation and idling time were adopted from the Korean National Databaseof the construction material environmental information and the Korean Standard Specification [52].Furthermore, the amount of fuel consumed by the construction equipment was calculated based onthe actual amount, which was determined from the bill of quantities and the construction daily report.Through the application of the actual data from the construction site, enhanced accuracy of the carbondioxide emissions from the construction equipment and machinery would be expected.
Table 4. The carbon dioxide emissions factors for type of fuel.
Type of fuel Unit Emission Factors(kg CO2-eq/unit) Resource
Diesel kg 6.82 × 10⁻² National LCI DB [51]
Petrol kg 8.32 × 10⁻² National LCI DB [1]
2.5. Calculation Method for Carbon Dioxide Emissions from Electricity Usage at the Construction Site
The carbon dioxide emissions due to electricity usage at the construction site were calculated bythe use of Equation (7).
E4 =∑
E j × f (7)
where E4 are the total carbon dioxide emissions from electricity usage at the construction site (in kgCO2); Ej is the quantity of electricity purchased from power company j (in kWh); and f is the carbondioxide emission factor for the electricity in South Korea (in kg CO2/kWh). The carbon dioxide emissionfactor for the electricity in South Korea is a nation-wide value of 0.4961 kg CO2 eq/kWh because it isprovided by only one company that is the Korea Electric Power Corporation.
Sustainability 2019, 11, 3571 8 of 16
2.6. Calculation Method for Carbon Dioxide Emission from Fuel Consumption Due to Transportation ofConstruction Waste
Equation (8) was applied to calculate the carbon dioxide emissions from the fuel combustion thatoccurred when construction waste was transported from the construction site to the landfill.
E5 =∑
[(Dw/FEm) × (Mw/CCap)] × f (8)
where E5 are the total CO2 emissions from fuel consumption of the transportation method; Dw is thedistance from the construction site to the waste-processing facilities location; FEm is the fuel efficiencyof the transporting method (in this study, the method of the transporting construction waste was 15-tondump trucks); Mw is the amount of the construction waste generated during the construction work(in m3); and Ccap is the capacity of the transportation method. The distance between the constructionsite and the landfill was adopted from the construction log and the distance was 28 km from the site tothe landfill.
3. Data Analysis
3.1. Total CO2 Emissions of the Ordinary Reinforced Concrete Slab and the Voided Slab System
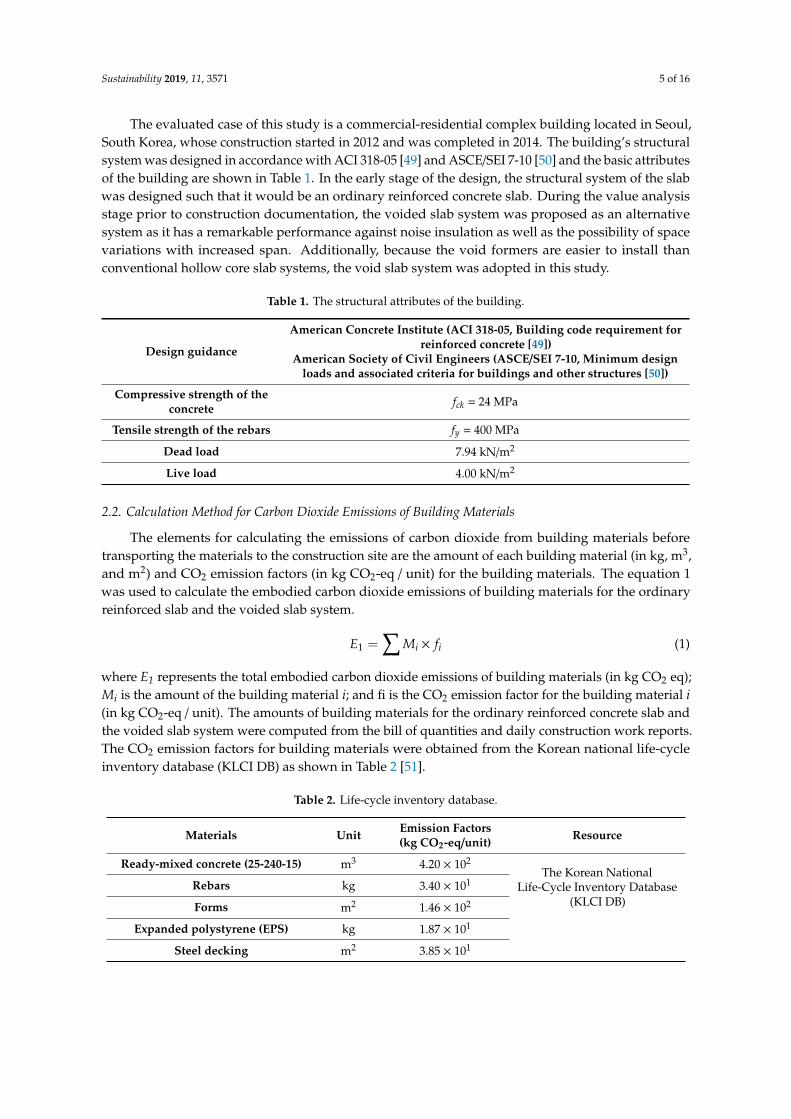
According to formulas (1)–(8), Total carbon dioxide emissions from the construction phase areshown in Table 5. The total carbon dioxide in the construction phase of the ordinary reinforced concreteslab and the voided slab system are 257,230 and 218,800 kg CO2, respectively. In both cases, themajority of the carbon dioxide emissions are due to manufacturing the building materials, whichaccounts for approximately 96%. A reduction of 38,394 kg CO2 was seen in the voided slab system,which is approximately 14.9% less than that of the ordinary reinforced concrete slab.
Column 8 in Table 5 indicates the contribution proportion of each emissions source to the totalcarbon dioxide emission reduction due to the application of the voided slab system over the ordinaryreinforced concrete slab. A total of 14.2% of the carbon dioxide emission reduction are due to themanufacturing of building materials (E1); 39.1% of the reductions are due to the energy consumption oftransporting the building materials to the construction site (E2); and 1.2% and 1.1% of carbon dioxideemission reduction are from on-site electricity usage (E4) and the transportation of the constructionwaste (E5), respectively. However, a slight increase of 3.2% was shown in the consumption of fuel fromoperation of the construction equipment in the voided slab system compared to the ordinary reinforcedconcrete slab (E3). This was only observed in the voided slab system, and it would be regarded ashaving a negative effect on the carbon dioxide emission reduction in the voided slab system.
Table 5. Total CO2 emissions from the construction phase (Source: own elaboration).
SourcesOrdinary Reinforced Concrete Slab (O) Voided Slab System (V) Reduction Percentage
([O - V] / O)CO2 % CO2 % O - V %
E1 246,082 95.6 211,116 96.5 34,966 91.1 14.2
E2 8744 3.4 5327 2.4 3417 8.9 39.1
E3 351 0.14 363 0.17 -12 -0.03 -3.2
E4 830 0.32 820 0.37 10 0.03 1.2
E5 1223 0.50 1174 0.54 13 0.03 1.1
Total 257,230 100 218,800 100 38,394 100 14.9
As shown in Table 5, the manufacturing of the building materials is the dominant source of thecarbon dioxide emissions both in the ordinary reinforced slab and the voided slab system whichaccount for 95.5% and 96.3%, respectively (See Figure 2). The second largest contributor to the carbon

Sustainability 2019, 11, 3571 9 of 16
dioxide emissions is the transportation of the building materials (E2), accounting for 3.6% and 1.7% inthe ordinary reinforced concrete slab and the voided slab system, respectively (see Figure 2).
Sustainability 2019, 11, x FOR PEER REVIEW 8 of 15
was 15-ton dump trucks); Mw is the amount of the construction waste generated during the construction work (in m3); and Ccap is the capacity of the transportation method. The distance between the construction site and the landfill was adopted from the construction log and the distance was 28 km from the site to the landfill.
3. Data Analysis
3.1. Total CO2 Emissions of the Ordinary Reinforced Concrete Slab and the Voided Slab System
According to formulas 1–8, Total carbon dioxide emissions from the construction phase are shown in Table 5. The total carbon dioxide in the construction phase of the ordinary reinforced concrete slab and the voided slab system are 257,230 and 218,800 kg CO2, respectively. In both cases, the majority of the carbon dioxide emissions are due to manufacturing the building materials, which accounts for approximately 96%. A reduction of 38,394 kg CO2 was seen in the voided slab system, which is approximately 14.9% less than that of the ordinary reinforced concrete slab.
Column 8 in Table 5 indicates the contribution proportion of each emissions source to the total carbon dioxide emission reduction due to the application of the voided slab system over the ordinary reinforced concrete slab. A total of 14.2% of the carbon dioxide emission reduction are due to the manufacturing of building materials (E1); 39.1% of the reductions are due to the energy consumption of transporting the building materials to the construction site (E2); and 1.2% and 1.1% of carbon dioxide emission reduction are from on-site electricity usage (E4) and the transportation of the construction waste (E5), respectively. However, a slight increase of 3.2% was shown in the consumption of fuel from operation of the construction equipment in the voided slab system compared to the ordinary reinforced concrete slab (E3). This was only observed in the voided slab system, and it would be regarded as having a negative effect on the carbon dioxide emission reduction in the voided slab system.
Table 5. Total CO2 emissions from the construction phase (Source: own elaboration).
Sources Ordinary reinforced concrete slab (O) Voided slab system (V) Reduction Percentage
([O - V] / O) CO2 % CO2 % O - V % E1 246,082 95.6 211,116 96.5 34,966 91.1 14.2 E2 8,744 3.4 5,327 2.4 3,417 8.9 39.1 E3 351 0.14 363 0.17 -12 -0.03 -3.2 E4 830 0.32 820 0.37 10 0.03 1.2 E5 1,223 0.50 1174 0.54 13 0.03 1.1
Total 257,230 100 218,800 100 38,394 100 14.9
(a) CO2 emissions of the ordinary reinforced concrete slab
Sustainability 2019, 11, x FOR PEER REVIEW 9 of 15
(b) CO2 emissions of the voided slab system
Figure 2. CO2 emissions of the ordinary reinforced concrete slab and the voided slab system (Source: own elaboration).
As shown in Table 5, the manufacturing of the building materials is the dominant source of the carbon dioxide emissions both in the ordinary reinforced slab and the voided slab system which account for 95.5% and 96.3%, respectively (See Figure 2). The second largest contributor to the carbon dioxide emissions is the transportation of the building materials (E2), accounting for 3.6% and 1.7% in the ordinary reinforced concrete slab and the voided slab system, respectively (see Figure 2).
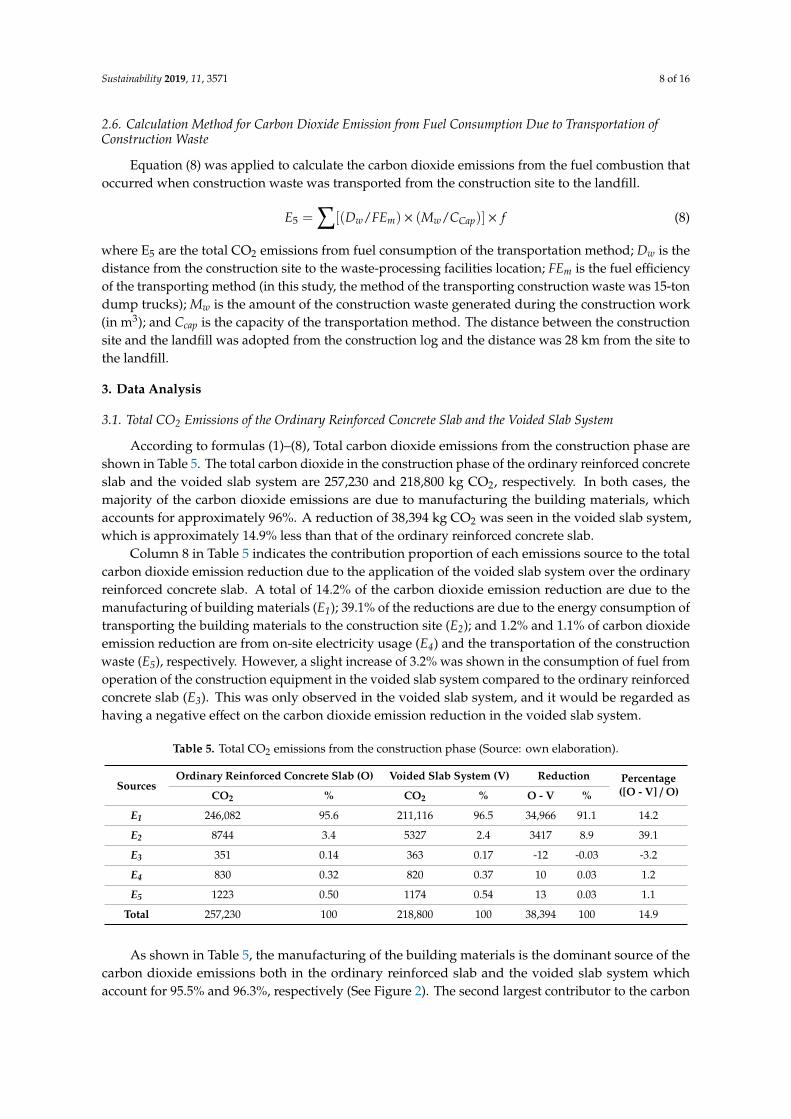
The analysed data indicate that manufacturing of the building materials contributes the most of carbon dioxide emissions in building construction phases, as indicated in Figure 3. Overall, the voided slab system emits approximately 15% less carbon dioxide emissions than the ordinary reinforced slab. Thus, when the carbon dioxide emissions of the voided slab system are compared to those of the ordinary reinforced concrete slab, all the elements of the building construction phases emit less carbon dioxide.
Figure 3. Total carbon dioxide emissions (Unit: kg CO2 eq) (Source: own elaboration).
3.2. Carbon Dioxide Emissions of the Building Materials
As the largest source of total carbon dioxide emissions in both types of slab systems, the emissions of carbon dioxide depend on the types of materials used in each slab system. As for the total carbon dioxide emissions, the voided slab system emits 38,394 kg CO2 less, which accounts for about 15% (see Table 5).
Figure 2. CO2 emissions of the ordinary reinforced concrete slab and the voided slab system (Source:own elaboration).
The analysed data indicate that manufacturing of the building materials contributes the most ofcarbon dioxide emissions in building construction phases, as indicated in Figure 3. Overall, the voidedslab system emits approximately 15% less carbon dioxide emissions than the ordinary reinforcedslab. Thus, when the carbon dioxide emissions of the voided slab system are compared to those ofthe ordinary reinforced concrete slab, all the elements of the building construction phases emit lesscarbon dioxide.
3.2. Carbon Dioxide Emissions of the Building Materials
As the largest source of total carbon dioxide emissions in both types of slab systems, the emissionsof carbon dioxide depend on the types of materials used in each slab system. As for the total carbondioxide emissions, the voided slab system emits 38,394 kg CO2 less, which accounts for about 15% (seeTable 5).
Sustainability 2019, 11, 3571 10 of 16
Sustainability 2019, 11, x FOR PEER REVIEW 9 of 15
(b) CO2 emissions of the voided slab system
Figure 2. CO2 emissions of the ordinary reinforced concrete slab and the voided slab system (Source: own elaboration).
As shown in Table 5, the manufacturing of the building materials is the dominant source of the carbon dioxide emissions both in the ordinary reinforced slab and the voided slab system which account for 95.5% and 96.3%, respectively (See Figure 2). The second largest contributor to the carbon dioxide emissions is the transportation of the building materials (E2), accounting for 3.6% and 1.7% in the ordinary reinforced concrete slab and the voided slab system, respectively (see Figure 2).
The analysed data indicate that manufacturing of the building materials contributes the most of carbon dioxide emissions in building construction phases, as indicated in Figure 3. Overall, the voided slab system emits approximately 15% less carbon dioxide emissions than the ordinary reinforced slab. Thus, when the carbon dioxide emissions of the voided slab system are compared to those of the ordinary reinforced concrete slab, all the elements of the building construction phases emit less carbon dioxide.
Figure 3. Total carbon dioxide emissions (Unit: kg CO2 eq) (Source: own elaboration).
3.2. Carbon Dioxide Emissions of the Building Materials
As the largest source of total carbon dioxide emissions in both types of slab systems, the emissions of carbon dioxide depend on the types of materials used in each slab system. As for the total carbon dioxide emissions, the voided slab system emits 38,394 kg CO2 less, which accounts for about 15% (see Table 5).
Figure 3. Total carbon dioxide emissions (Unit: kg CO2 eq) (Source: own elaboration).
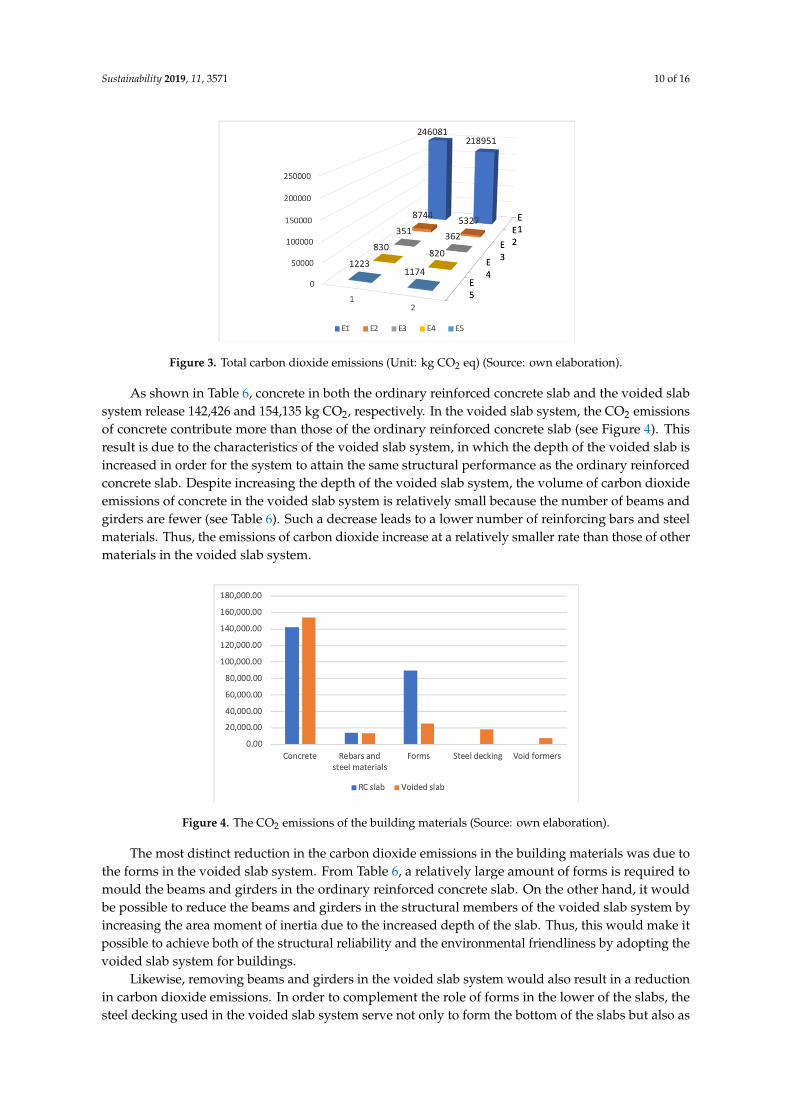
As shown in Table 6, concrete in both the ordinary reinforced concrete slab and the voided slabsystem release 142,426 and 154,135 kg CO2, respectively. In the voided slab system, the CO2 emissionsof concrete contribute more than those of the ordinary reinforced concrete slab (see Figure 4). Thisresult is due to the characteristics of the voided slab system, in which the depth of the voided slab isincreased in order for the system to attain the same structural performance as the ordinary reinforcedconcrete slab. Despite increasing the depth of the voided slab system, the volume of carbon dioxideemissions of concrete in the voided slab system is relatively small because the number of beams andgirders are fewer (see Table 6). Such a decrease leads to a lower number of reinforcing bars and steelmaterials. Thus, the emissions of carbon dioxide increase at a relatively smaller rate than those of othermaterials in the voided slab system.
Sustainability 2019, 11, x FOR PEER REVIEW 10 of 15
Figure 4. The CO2 emissions of the building materials (Source: own elaboration).
As shown in Table 6, concrete in both the ordinary reinforced concrete slab and the voided slab system release 142,426 and 154,135 kg CO2, respectively. In the voided slab system, the CO2 emissions of concrete contribute more than those of the ordinary reinforced concrete slab (see Figure 4). This result is due to the characteristics of the voided slab system, in which the depth of the voided slab is increased in order for the system to attain the same structural performance as the ordinary reinforced concrete slab. Despite increasing the depth of the voided slab system, the volume of carbon dioxide emissions of concrete in the voided slab system is relatively small because the number of beams and girders are fewer (see Table 6). Such a decrease leads to a lower number of reinforcing bars and steel materials. Thus, the emissions of carbon dioxide increase at a relatively smaller rate than those of other materials in the voided slab system.
The most distinct reduction in the carbon dioxide emissions in the building materials was due to the forms in the voided slab system. From Table 6, a relatively large amount of forms is required to mould the beams and girders in the ordinary reinforced concrete slab. On the other hand, it would be possible to reduce the beams and girders in the structural members of the voided slab system by increasing the area moment of inertia due to the increased depth of the slab. Thus, this would make it possible to achieve both of the structural reliability and the environmental friendliness by adopting the voided slab system for buildings.
Table 6. Carbon dioxide emissions of the construction materials (Source: own elaboration).
Materials Ordinary reinforced
concrete Voided slab
system Reduction Sources
kg CO2 % kg CO2 % kg CO2 %
KLCI DB [51]
Concrete
Slab 61,043 24.8 92,820 43.9 –31,777 -
12.9 Beams and
girders 81,383 33.1 61,315 29.0 20,068 8.2
Sub-total 142,426 57.9 154,135 72.9 –11,709 –4.7
Rebars and steel materials
Slab 4,403 1.8 6,617 3.1 –459 –0.2 Beams and
girders 9,750 4.0 6,929 3.3 587 0.3
Sub-total 13,546 5.8 13,546 6.4 125 0.1
Forms
Slab 48,110 19.6 0 0 48,110 19.6 Beams and
girders 41,392
16.8
25,269 12.0 16,123 6.6
Sub-total 89,502 36.4 25,269 12.0 64,233 26.2
Figure 4. The CO2 emissions of the building materials (Source: own elaboration).
The most distinct reduction in the carbon dioxide emissions in the building materials was due tothe forms in the voided slab system. From Table 6, a relatively large amount of forms is required tomould the beams and girders in the ordinary reinforced concrete slab. On the other hand, it wouldbe possible to reduce the beams and girders in the structural members of the voided slab system byincreasing the area moment of inertia due to the increased depth of the slab. Thus, this would make itpossible to achieve both of the structural reliability and the environmental friendliness by adopting thevoided slab system for buildings.
Likewise, removing beams and girders in the voided slab system would also result in a reductionin carbon dioxide emissions. In order to complement the role of forms in the lower of the slabs, thesteel decking used in the voided slab system serve not only to form the bottom of the slabs but also as
Sustainability 2019, 11, 3571 11 of 16
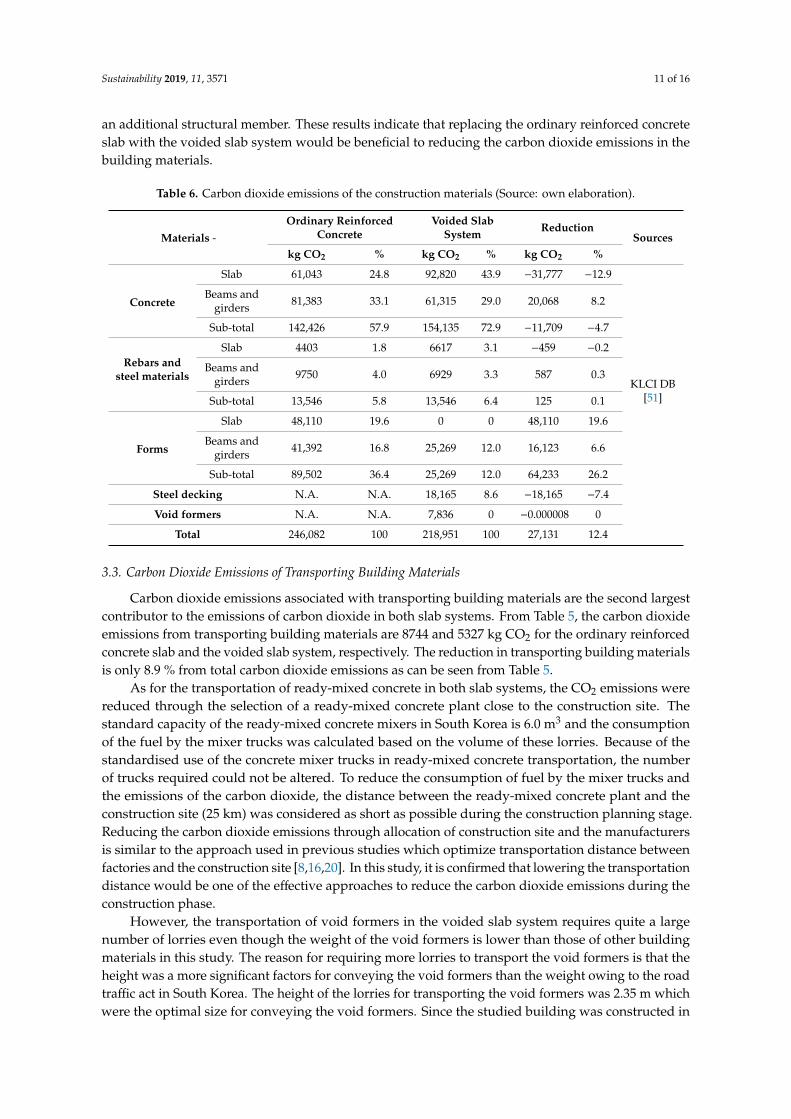
an additional structural member. These results indicate that replacing the ordinary reinforced concreteslab with the voided slab system would be beneficial to reducing the carbon dioxide emissions in thebuilding materials.
Table 6. Carbon dioxide emissions of the construction materials (Source: own elaboration).
Materials -Ordinary Reinforced
ConcreteVoided Slab
System ReductionSources
kg CO2 % kg CO2 % kg CO2 %
Concrete
Slab 61,043 24.8 92,820 43.9 −31,777 −12.9
KLCI DB[51]
Beams andgirders 81,383 33.1 61,315 29.0 20,068 8.2
Sub-total 142,426 57.9 154,135 72.9 −11,709 −4.7
Rebars andsteel materials
Slab 4403 1.8 6617 3.1 −459 −0.2
Beams andgirders 9750 4.0 6929 3.3 587 0.3
Sub-total 13,546 5.8 13,546 6.4 125 0.1
Forms
Slab 48,110 19.6 0 0 48,110 19.6
Beams andgirders 41,392 16.8 25,269 12.0 16,123 6.6
Sub-total 89,502 36.4 25,269 12.0 64,233 26.2
Steel decking N.A. N.A. 18,165 8.6 −18,165 −7.4
Void formers N.A. N.A. 7,836 0 −0.000008 0
Total 246,082 100 218,951 100 27,131 12.4
3.3. Carbon Dioxide Emissions of Transporting Building Materials
Carbon dioxide emissions associated with transporting building materials are the second largestcontributor to the emissions of carbon dioxide in both slab systems. From Table 5, the carbon dioxideemissions from transporting building materials are 8744 and 5327 kg CO2 for the ordinary reinforcedconcrete slab and the voided slab system, respectively. The reduction in transporting building materialsis only 8.9 % from total carbon dioxide emissions as can be seen from Table 5.
As for the transportation of ready-mixed concrete in both slab systems, the CO2 emissions werereduced through the selection of a ready-mixed concrete plant close to the construction site. Thestandard capacity of the ready-mixed concrete mixers in South Korea is 6.0 m3 and the consumptionof the fuel by the mixer trucks was calculated based on the volume of these lorries. Because of thestandardised use of the concrete mixer trucks in ready-mixed concrete transportation, the numberof trucks required could not be altered. To reduce the consumption of fuel by the mixer trucks andthe emissions of the carbon dioxide, the distance between the ready-mixed concrete plant and theconstruction site (25 km) was considered as short as possible during the construction planning stage.Reducing the carbon dioxide emissions through allocation of construction site and the manufacturersis similar to the approach used in previous studies which optimize transportation distance betweenfactories and the construction site [8,16,20]. In this study, it is confirmed that lowering the transportationdistance would be one of the effective approaches to reduce the carbon dioxide emissions during theconstruction phase.
However, the transportation of void formers in the voided slab system requires quite a largenumber of lorries even though the weight of the void formers is lower than those of other buildingmaterials in this study. The reason for requiring more lorries to transport the void formers is that theheight was a more significant factors for conveying the void formers than the weight owing to the roadtraffic act in South Korea. The height of the lorries for transporting the void formers was 2.35 m whichwere the optimal size for conveying the void formers. Since the studied building was constructed in

Sustainability 2019, 11, 3571 12 of 16
the city centre, the 4.5-ton lorries with the height of 2.35 m were the best possible option in this project.In addition, as the distances of the expanded polystyrene (EPS) plant, which is the raw material ofthe void formers, are far greater than those of other materials, emissions of carbon dioxide occurredduring the transportation of the void formers.
3.4. Carbon Dioxide Emissions from Fuel Consumption of Construction Equipment Operation
The emissions of carbon dioxide from the construction phase were calculated by computing theamount of consumed fuel from the construction equipment and machinery. As indicated in Table 7,the consumed fuel in the construction phase was calculated based on the input amount of machineryand equipment from the daily construction report and log.
Table 7. Consumption of fuel and carbon dioxide emissions (Source: own elaboration).
Ordinary Reinforced Concrete Slab Voided Slab System
Volume of concrete (m3) 339.11 366.99
Concrete pouring time (hour) 9.0 9.7
Fuel in the active time (l) 66.69 72.17
Fuel in the idling time (l) 50.78 54.57
CO2 emissions (kg CO2) 351 363
In this study, the operating time of the construction equipment and machinery was divided intothe active and the idling time. The reason for considering the active and idling time of the constructionequipment separately is that construction equipment and machinery are left in the idle mode so that itis easier to operate them when needed at the construction site. As the amount of fuel consumed duringthe idling time is quite large, this study considered the fuel consumed during idling and operationseparately. Based on the consumed fuel amount, it is indicated that the carbon dioxide emissionsfrom the construction machinery and equipment operation are 351 and 363 kg CO2 for the ordinaryreinforced concrete slab and the voided slab system, respectively.
As indicated in Table 7, the fuel consumption during the idling time is approximately 42% and43% for the ordinary reinforced concrete slab and the voided slab system, respectively. In addition,75% of consumed fuel is consumed during the idling time. In other words, this means that the amountof fuel from the idling time in the equipment and machinery operation is quite large and it shouldbe considered to minimize the emissions of carbon dioxide from the construction machinery andequipment during the construction stage.
3.5. Carbon Dioxide Emissions from Electricity Usage and Construction Waste Transportation
The CO2 emissions from electricity usage on site were 830 and 820 kg CO2 for the ordinaryreinforced concrete slab and the voided slab system, respectively (see Table 5). In the case of the voidedslab system, void formers and steel decking, which replace the rebars and steel materials, are used toanchor void formers to lower reinforcement in the slabs, were the main factors that reduced electricityusage during the steel materials process stage as well as the carbon dioxide emissions during theconstruction stage. In addition, the lowering of the rebars and steel materials would make it possibleto reduce the generation of construction waste. Thus, replacement of the ordinary reinforced concreteslab with the voided slab system would contribute to a reduction in carbon dioxide emissions fromelectricity usage and the generation of construction waste on site.
3.6. Comparison of the Carbon Dioxide Emissions by Structural Members
The carbon dioxide emissions of the structural members in the ordinary reinforced concrete slaband the voided slab system were significantly different in this study. In the case of the voided slab

Sustainability 2019, 11, 3571 13 of 16
system, the numbers of beams and girders were significantly less than those for the ordinary reinforcedconcrete slab. As a result of the decrease in the number of beams and girders, it was observed thatthe forms and reinforcing bars were the main elements reducing the carbon dioxide emissions in thevoided slab system (see Figure 5). As seen in Table 7, forms are the significant reduction factor in thevoided slab system, resulting in a reduction of approximately 65%.
Sustainability 2019, 11, x FOR PEER REVIEW 12 of 15
Fuel in the active time (l) 66.69 72.17 Fuel in the idling time (l) 50.78 54.57 CO2 emissions (kg CO2) 351 363
In this study, the operating time of the construction equipment and machinery was divided into
the active and the idling time. The reason for considering the active and idling time of the construction equipment separately is that construction equipment and machinery are left in the idle mode so that it is easier to operate them when needed at the construction site. As the amount of fuel consumed during the idling time is quite large, this study considered the fuel consumed during idling and operation separately. Based on the consumed fuel amount, it is indicated that the carbon dioxide emissions from the construction machinery and equipment operation are 351 and 363 kg CO2 for the ordinary reinforced concrete slab and the voided slab system, respectively.
As indicated in Table 7, the fuel consumption during the idling time is approximately 42% and 43% for the ordinary reinforced concrete slab and the voided slab system, respectively. In addition, 75% of consumed fuel is consumed during the idling time. In other words, this means that the amount of fuel from the idling time in the equipment and machinery operation is quite large and it should be considered to minimize the emissions of carbon dioxide from the construction machinery and equipment during the construction stage.
3.5. Carbon Dioxide Emissions from Electricity Usage and Construction Waste Transportation
The CO2 emissions from electricity usage on site were 830 and 820 kg CO2 for the ordinary reinforced concrete slab and the voided slab system, respectively (see Table 5). In the case of the voided slab system, void formers and steel decking, which replace the rebars and steel materials, are used to anchor void formers to lower reinforcement in the slabs, were the main factors that reduced electricity usage during the steel materials process stage as well as the carbon dioxide emissions during the construction stage. In addition, the lowering of the rebars and steel materials would make it possible to reduce the generation of construction waste. Thus, replacement of the ordinary reinforced concrete slab with the voided slab system would contribute to a reduction in carbon dioxide emissions from electricity usage and the generation of construction waste on site.
Figure 5. Carbon dioxide emissions of structural members (Source: own elaboration).
3.6. Comparison of the Carbon Dioxide Emissions by Structural Members
The carbon dioxide emissions of the structural members in the ordinary reinforced concrete slab and the voided slab system were significantly different in this study. In the case of the voided slab system, the numbers of beams and girders were significantly less than those for the ordinary reinforced concrete slab. As a result of the decrease in the number of beams and girders, it was observed that the forms and reinforcing bars were the main elements reducing the carbon dioxide emissions in the voided slab system (see Figure 5). As seen in Table 7, forms are the significant reduction factor in the voided slab system, resulting in a reduction of approximately 65%.
Figure 5. Carbon dioxide emissions of structural members (Source: own elaboration).
4. Conclusions
The purpose of this study was to compare the carbon dioxide emissions of the ordinary reinforcedconcrete slab and the voided slab system during the construction phase, which includes all processesfrom manufacturing the building materials to the pre-operation stage. The building construction phaseemits significant quantities of the carbon dioxide emissions from both slab systems. The voided slabsystem is an alternative to the ordinary reinforced concrete slab. In this study, five sources of carbondioxide emissions for the ordinary reinforced concrete slab and the voided slab system are identifiedfor comparing the emissions of CO2. These include embodied carbon dioxide emissions of buildingmaterials, transporting the building materials, operation of the construction equipment and machinery,electricity usage at the construction site, and transportation of the construction waste on site.
The results reveal total CO2 emissions of 257,230 and 218,800 kg CO2 for the ordinary reinforcedconcrete slab and the voided slab system, respectively. Among the five sources of CO2 emissionsduring the construction phase, the embodied carbon from the building materials accounts for 246,082and 211,116 kg CO2 for the ordinary reinforced concrete slab and the voided slab system, respectively.Moreover, the greatest contributor to CO2 reduction is the embodied carbon dioxide emissions ofthe building materials, which accounts for 34,966 kg CO2. The second highest contributor is thetransportation of the building materials, accounting for 3417 kg CO2. On the other hand, the negativecontributor is the operation of the construction equipment and machinery on site, which offset 3.2% ofthe total emissions reduction. The main factors that reduce the emissions of carbon dioxide from thevoided slab system are the forms for casting the beams, girders, and slabs in the ordinary reinforcedconcrete slab. In this study, the potential reduction elements in the voided slab system compared to theordinary reinforced concrete was investigated and it would be beneficial to lower the carbon dioxideemissions in the construction industry.
This study presents an examination of the carbon dioxide emissions in the ordinary reinforcedconcrete slab and the voided slab system in the construction stage. Analysis of the characteristicsand comparisons of the CO2 emissions between them indicates that there are different sources andfactors related to the carbon dioxide emissions. In this study, the voided slab system results in feweremissions compared with the ordinary reinforced concrete slab, although the amount of the reductionis not significant which is indicated 830 and 820 kg CO2 for the ordinary reinforced concrete slaband the voided slab system, respectively. This result illustrates that the reduction potential, whichwas approximately 15%, exists in the construction phase in the voided slab system over the ordinaryreinforced concrete slab. In this study, the economic friendliness of the voided slab over the ordinary

Sustainability 2019, 11, 3571 14 of 16
reinforced concrete was corroborated empirically. Moreover, it is considered that the application ofthe voided slab system would contribute to the reduction of CO2 in the construction industry bothdomestically and internationally.
A limitation of this study is that it is focused only on one project to compare the ordinary reinforcedconcrete slab and the voided slab system. To corroborate the practicability and sustainability, as well asto broaden the applicability, of the voided slab system, a future study that investigates more practicalcases for multiple examination of the correlation between the voided slab system and carbon dioxideemissions is required.
Author Contributions: I.P. conducted the design of two structural system of the studied building. S.N. carriedout the assessment of carbon dioxide emissions of both systems.
Acknowledgments: This work was supported by the National Research Foundation of Korea (NRF) grant fundedby the Korea government Ministry of Education. (No. NRF-2017R1D1A1B03033452).
Conflicts of Interest: There are no conflicts of interests between the authors.
References
1. Kim, T.H.; Chae, C.U.; Kim, G.H.; Jang, H.J. Analysis of CO2 emissions characteristics of concrete used atconstruction sites. Sustainability 2016, 8, 348. [CrossRef]
2. Baek, C.; Tae, S.; Kim, R.; Shin, S. Life cycle CO2 assessment by block type changes of apartment housing.Sustainability 2016, 8, 752. [CrossRef]
3. Martí, J.V.; García-Segura, T.; Yepes, V. Structural design of precast-prestressed concrete U-beam road bridgesbased on embodied energy. J. Clean. Prod. 2016, 120, 231–240. [CrossRef]
4. Kim, T.; Tae, S. A study on the development of an evaluation system of CO2 emission in the production ofconcrete. J. Korea Concr. Inst. 2010, 22, 787–796. [CrossRef]
5. Asdrubali, F.; Baldassarri, C.; Fthenakis, V. Life cycle analysis in the construction sector: Guiding theoptimization of conventional Italian buildings. Energy Build. 2013, 64, 73–89. [CrossRef]
6. Hammond, G.P.; Jones, C.I. Embodied energy and carbon in construction materials. Proc. Inst. Civ. Eng.-Energy2008, 161, 87–98. [CrossRef]
7. Hong, J.; Shen, G.Q.; Feng, Y.; Lau, W.S.-T.; Mao, C. Greenhouse gas emissions during the construction phaseof a building: A case study in China. J. Clean. Prod. 2015, 103, 249–259. [CrossRef]
8. Lee, J.; Tae, S.; Kim, R. A Study on the analysis of CO2 emissions of apartment housing in the constructionprocess. Sustainability 2018, 10, 365. [CrossRef]
9. Wang, J.; Tam, V.W.Y. Construction industry carbon dioxide emissions in Shenzhen, China. In Proceedings ofthe Institution of Civil Engineers-Waste and Resource Management; Thomas Telford Ltd.: London, UK, 2016;Volume 169, pp. 114–122.
10. Intergovernmental Panel on Climate Change. Global Warming of 1.5C; Intergovernmental Panel on ClimateChange: Incheon, South Korea, 2018.
11. United Nations Environment Programme. Annual Report 2015; UNEP: Nairobi, Kenya, 2015.12. Campisi, D.; Gitto, S.; Morea, D. An evaluation of energy and economic efficiency in residential buildigns
sector: A multi-criteria analysis on an Italian case study. Int. J. Energy Econ. Policy 2018, 8, 185–196.13. Yi, I.S.; Seo, K.S. Social Indicators in Korea; National Statistical Office: Seoul, Korea, 2010.14. Cole, R.J. Energy and greenhouse gas emissions associated with the construction of alternative structural
systems. Build. Environ. 1999, 34, 335–348. [CrossRef]15. Yan, H.; Shen, Q.; Fan, L.C.; Wang, Y.; Zhang, L. Greenhouse gas emissions in building construction: A case
study of One Peking in Hong Kong. Build. Environ. 2010, 45, 949–955. [CrossRef]16. González, M.J.; Navarro, J.G. Assessment of the decrease of CO2 emissions in the construction field through
the selection of materials: Practical case study of three houses of low environmental impact. Build. Environ.2006, 41, 902–909. [CrossRef]
17. Park, J.; Tae, S.; Kim, T. Life cycle CO2 assessment of concrete by compressive strength on construction site inKorea. Renew. Sustain. Energy Rev. 2012, 16, 2940–2946. [CrossRef]
Sustainability 2019, 11, 3571 15 of 16
18. Mao, C.; Shen, Q.; Shen, L.; Tang, L. Comparative study of greenhouse gas emissions between off-siteprefabrication and conventional construction methods: Two case studies of residential projects. Energy Build.2013, 66, 165–176. [CrossRef]
19. Zhang, X.; Wang, F. Assessment of embodied carbon emissions for building construction in China:Comparative case studies using alternative methods. Energy Build. 2016, 130, 330–340. [CrossRef]
20. Peng, C. Calculation of a building’s life cycle carbon emissions based on Ecotect and building informationmodeling. J. Clean. Prod. 2016, 112, 453–465. [CrossRef]
21. Li, L.; Chen, K. Quantitative assessment of carbon dioxide emissions in construction projects: A case studyin Shenzhen. J. Clean. Prod. 2017, 141, 394–408. [CrossRef]
22. Kumar, V.; Hewage, K.; Sadiq, R. Life cycle assessment of residential buildings: A case study in Canada.Int. J. Energy Environ. Eng. 2015, 9, 1017–1025.
23. You, F.; Hu, D.; Zhang, H.; Guo, Z.; Zhao, Y.; Wang, B.; Yuan, Y. Carbon emissions in the life cycle of urbanbuilding system in China—A case study of residential buildings. Ecol. Complex. 2011, 8, 201–212. [CrossRef]
24. Gan, V.J.; Chan, C.; Tse, K.; Lo, I.M.; Cheng, J.C. A comparative analysis of embodied carbon in high-risebuildings regarding different design parameters. J. Clean. Prod. 2017, 161, 663–675. [CrossRef]
25. Dong, Y.H.; Jaillon, L.C.; Chu, P.; Poon, C. Comparing carbon emissions of precast and cast-In-Situ constructionmethods—A case study of high-rise private building. Constr. Build. Mater. 2015, 99, 39–53. [CrossRef]
26. Guggemos, A.A.; Horvath, A. Comparison of environmental effects of steel-and concrete-framed buildings.J. Infrastruct. Syst. 2005, 11, 93–101. [CrossRef]
27. Han, Y.-S.; Kim, S.-D. A comparative study on CO2 amount of construction material in structural design.J. Archit. Inst. Korea 2005, 25, 203–206.
28. Xing, S.; Xu, Z.; Jun, G. Inventory analysis of LCA on steel-and concrete-construction office buildings. EnergyBuild. 2008, 40, 1188–1193. [CrossRef]
29. Kim, T.; Chae, C.; Kim, G.; Jang, H. Analysis of CO2 emission characteristics of concrete used at constructionsites. Sustainability 2016, 8. [CrossRef]
30. Lee, S.; Park, W.; Lee, H. Life cycle CO2 assessment method for concrete using CO2 balance and suggestionto decrease LCCO2 of concrete in South-Korean apartment. Energy Build. 2013, 58, 93–102. [CrossRef]
31. Cho, S.-H.; Chae, C.-U. A study on life cycle CO2 emissions of low-carbon building in South Korea.Sustainability 2016, 8, 579. [CrossRef]
32. Cho, S.H.; Chae, C.-U. The comparative study on the environmental impact assessment of constructionmaterial through the application of carbon reducing element-focused on global warming potential of concreteproducts. Int. J. Korea Inst. Ecol. Archit. Environ. 2015, 33, 149–156.
33. Tae, S.; Baek, C.; Shin, S. Life cycle CO2 evaluation on reinforced concrete structures with high-strengthconcrete. Environ. Impact Assess. Rev. 2011, 31, 253–260. [CrossRef]
34. Cho, S.; Na, S. The reduction of CO2 emissions by application of high-strength reinforcing bars to threedifferent structural systems in South Korea. Sustainability 2017, 9, 1652.
35. Aldejohann, M.; Schnellenbach-Held, M. Investigations on the shear capacity of biaxial hollow slabs-testresults and evaluation. Darmstadt Concr. 2003, 18, 532–545.
36. Cho, S.; Na, S. Evaluation of the Flexural Performance and CO2 Emissions of the Voided Slab. Adv. Mater.Sci. Eng. 2018, 2018. [CrossRef]
37. Ibrahim, I.; Elliott, K.; Abdullah, R.; Kueh, A.; Sarbini, N. Experimental study on the shear behaviour ofprecast concrete hollow core slabs with concrete topping. Eng. Struct. 2016, 125, 80–90. [CrossRef]
38. Lee, K.; Lee, G.; Hwang, H. Hollow Core Slab by Light Weight Assembly. Patent 1009584070000, 10 May2010.
39. Chung, J.-H.; Jung, H.-S.; Bae, B.-I.; Choi, C.-S.; Choi, H.-K. Two-Way Flexural Behavior of Donut-TypeVoided Slabs. Int. J. Concr. Struct. Mater. 2018, 12, 26. [CrossRef]
40. Lave, L.; Hendrickson, C.; Horvath, A.; Joshi, S. Economic input-output models for environment life-cycleassessment. Environ. Sci. Technol. 2002, 32, e191.
41. Miller, R.E.; Blair, P.D. Input-Output Analysis: Foundations and Extensions; Cambridge University Press:Cambridge, UK, 2009.
42. Gay, P.W.; Proops, J.L. Carbon dioxide production by the UK economy: An input-output assessment.Appl. Energy 1993, 44, 113–130. [CrossRef]

Sustainability 2019, 11, 3571 16 of 16
43. Minx, J.C.; Wiedmann, T.; Wood, R.; Peters, G.; Lenzen, M.; Owen, A.; Scott, K.; Barrett, J.; Hubacek, K.;Baiocchi, G.; et al. Input–output analysis and carbon footprinting: An overview of applications. Econ. Syst.Res. 2009, 21, 187–216. [CrossRef]
44. Cabeza, L.F.; Rincón, L.; Vilarino, V.; Perez, G.; Castell, A. Life cycle assessment (LCA) and life cycle energyanalysis (LCEA) of buildings and the building sector: A review. Renew. Sustain. Energy Rev. 2014, 29, 394–416.[CrossRef]
45. International Organization for Standardization. ISO14044: Life Cycle Assessment (Requirement and Guidelines);International Organization for Standardization: Geneva, Switzerland, 2006.
46. International Organization for Standardization. ISO:21930: Environmental Declaration of Building Product; ISO:Geneva, Switzerland, 2007.
47. Gustavsson, L.; Joelsson, A.; Sathre, R. Life cycle primary energy use and carbon emission of an eight-storeywood-framed apartment building. Energy Build. 2010, 42, 230–242. [CrossRef]
48. Suzuki, M.; Oka, T. Estimation of life cycle energy consumption and CO2 emission of office buildings inJapan. Energy Build. 1998, 28, 33–41. [CrossRef]
49. American Concrete Institute. Building Code Requirements for Structural Concrete (ACI 318-05) and Commentary(ACI 318R-05); American Concrete Institute: Farmington Hills, MI, USA, 2005.
50. American Society of Civil Engineers. Minimum Design Loads and Associated Criteria for Buildings and OtherStructures (7–10); American Society of Civil Engineers: Reston, VA, USA, 2010.
51. The Korea Environmental Industry & Technology Institute (KEITI). Korea LCI DB Information Network.2017. Available online: http://www.epd.or.kr/en/lci/lci_intro.asp (accessed on 2 April 2019).
52. Korea Ministry of Land, Infrastructure and Transport. Standard Specification for Construction; Korea Ministryof Land, Infrastructure and Transport: Sejong, Korea, 2013.
© 2019 by the authors. Licensee MDPI, Basel, Switzerland. This article is an open accessarticle distributed under the terms and conditions of the Creative Commons Attribution(CC BY) license (http://creativecommons.org/licenses/by/4.0/).


![Human carbon dioxide emissions [ Mt C]](https://static.fdocuments.in/doc/165x107/56813d0c550346895da6bffd/human-carbon-dioxide-emissions-mt-c.jpg)