Comparison between Conditional Probability Function and Nonparametric Regression for Fine Particle...
7
Atmospheric Environment 38 (2004) 4667–4673 Comparison between Conditional Probability Function and Nonparametric Regression for Fine Particle Source Directions Eugene Kim a , Philip K. Hopke b, * a Department of Civil and Environmental Engineering, Clarkson University, Box 5708, Potsdam, NY 13699, USA b Department of Chemical Engineering, Clarkson University, Box 5708, Potsdam, NY 13699, USA Received 18 March 2004; accepted 26 May 2004 Abstract The objective of this study is to examine the use of conditional probability function (CPF) and nonparametric regression (NPR) to identify directions of PM 2.5 (particulate matter p2.5 mm in aerodynamic diameter) sources using data collected from multiple monitoring sites across the US NPR has been used on cyclohexane data from Houston, TX and correctly showed the direction of the source. In recent source apportionment studies using positive matrix factorization (PMF), ambient PM 2.5 compositional data sets from 24-h integrated samples including eight individual carbon fractions collected at four monitoring sites, Atlanta, GA, Washington, DC, Brigantine, NJ, and Seattle, WA, were analyzed identifying 10–11 sources. To analyze local point source impacts from various wind directions, CPF and NPR were calculated using the source contributions estimated from PMF coupled with wind direction measured on site. The comparison between CPF and NPR demonstrated that both methods agreed well with the locations of known local point sources. CPF was simpler and easier to calculate than NPR. In contrast, NPR provided PM 2.5 concentrations and associated uncertainties. This study indicates that both methods can be utilized to enhance source apportionment study of ambient PM 2.5 . r 2004 Elsevier Ltd. All rights reserved. Keywords: Conditional probability function; Nonparametric regression; Positive matrix factorization; Source apportionment; Source direction 1. Introduction Since US Environmental Protection Agency promul- gated new national ambient air quality standards for airborne particulate matter less than 2.5 mm in aero- dynamic diameter (PM 2.5 ), advanced source apportion- ment methods for PM 2.5 are required for the source- specific community epidemiology as well as in the implementation planning process for attaining the air quality standards. Positive matrix factorization (PMF) (Paatero, 1997) has been used to assess PM 2.5 source contributions (Ramadan et al., 2000; Polissar et al., 2001; Song et al., 2001; Lee et al., 2002; Kim et al., 2003). In recent source apportionment studies using PMF method, ambient PM 2.5 compositional data sets of daily integrated samples including eight individual carbon fractions collected at four monitoring sites, Atlanta, GA, Washington, DC, Brigantine, NJ, and Seattle, WA, were analyzed identifying 10–11 sources. In these studies, a method is needed to find the directions of high values of PMF estimated source contributions that are likely to be related with the directions of sources. The conditional probability function (CPF) has been successfully used to analyze point source impacts in ARTICLE IN PRESS *Corresponding author. Fax: +1-315-268-6654. E-mail address: [email protected] (P.K. Hopke). 1352-2310/$ - see front matter r 2004 Elsevier Ltd. All rights reserved. doi:10.1016/j.atmosenv.2004.05.035
-
Upload
eugene-kim -
Category
Documents
-
view
221 -
download
0
Transcript of Comparison between Conditional Probability Function and Nonparametric Regression for Fine Particle...

Atmospheric Environment 38 (2004) 4667–4673
ARTICLE IN PRESS
*Correspond
E-mail addr
1352-2310/$ - se
doi:10.1016/j.at
Comparison between Conditional Probability Function andNonparametric Regression for Fine Particle Source Directions
Eugene Kima, Philip K. Hopkeb,*aDepartment of Civil and Environmental Engineering, Clarkson University, Box 5708, Potsdam, NY 13699, USA
bDepartment of Chemical Engineering, Clarkson University, Box 5708, Potsdam, NY 13699, USA
Received 18 March 2004; accepted 26 May 2004
Abstract
The objective of this study is to examine the use of conditional probability function (CPF) and nonparametric
regression (NPR) to identify directions of PM2.5 (particulate matter p2.5mm in aerodynamic diameter) sources using
data collected from multiple monitoring sites across the US NPR has been used on cyclohexane data from Houston, TX
and correctly showed the direction of the source. In recent source apportionment studies using positive matrix
factorization (PMF), ambient PM2.5 compositional data sets from 24-h integrated samples including eight individual
carbon fractions collected at four monitoring sites, Atlanta, GA, Washington, DC, Brigantine, NJ, and Seattle, WA,
were analyzed identifying 10–11 sources. To analyze local point source impacts from various wind directions, CPF and
NPR were calculated using the source contributions estimated from PMF coupled with wind direction measured on
site. The comparison between CPF and NPR demonstrated that both methods agreed well with the locations of known
local point sources. CPF was simpler and easier to calculate than NPR. In contrast, NPR provided PM2.5
concentrations and associated uncertainties. This study indicates that both methods can be utilized to enhance source
apportionment study of ambient PM2.5.
r 2004 Elsevier Ltd. All rights reserved.
Keywords: Conditional probability function; Nonparametric regression; Positive matrix factorization; Source apportionment; Source
direction
1. Introduction
Since US Environmental Protection Agency promul-
gated new national ambient air quality standards for
airborne particulate matter less than 2.5 mm in aero-
dynamic diameter (PM2.5), advanced source apportion-
ment methods for PM2.5 are required for the source-
specific community epidemiology as well as in the
implementation planning process for attaining the air
quality standards. Positive matrix factorization (PMF)
(Paatero, 1997) has been used to assess PM2.5 source
ing author. Fax: +1-315-268-6654.
ess: [email protected] (P.K. Hopke).
e front matter r 2004 Elsevier Ltd. All rights reserve
mosenv.2004.05.035
contributions (Ramadan et al., 2000; Polissar et al.,
2001; Song et al., 2001; Lee et al., 2002; Kim et al.,
2003).
In recent source apportionment studies using PMF
method, ambient PM2.5 compositional data sets of daily
integrated samples including eight individual carbon
fractions collected at four monitoring sites, Atlanta,
GA, Washington, DC, Brigantine, NJ, and Seattle, WA,
were analyzed identifying 10–11 sources. In these
studies, a method is needed to find the directions of
high values of PMF estimated source contributions that
are likely to be related with the directions of sources.
The conditional probability function (CPF) has been
successfully used to analyze point source impacts in
d.

ARTICLE IN PRESSE. Kim, P.K. Hopke / Atmospheric Environment 38 (2004) 4667–46734668
these four studies as well as other source apportionment
studies (Kim et al., 2003, 2004a; Zhou et al., 2004;
Begum et al., 2004). Nonparametric regression (NPR)
has been tested using cyclohexane data from Houston,
TX and correctly pointed in the direction of the source
(Henry et al., 2002).
The objective of this study is to explore the use of
CPF and NPR to identify directions of PM2.5 sources
using data collected at multiple motoring site across US.
To analyze source impacts from various wind directions,
CPF and NPR are calculated using source contributions
estimated from PMF coupled with wind direction
measured on sites. The CPF values for each source are
compared with corresponding NPR results.
2. Experiment
2.1. Sample collection and chemical analysis
Atlanta PM2.5 samples were collected at the South-
Eastern Aerosol Research and CHaracterization
(SEARCH) (Kim et al., 2003; Hansen et al., 2003)
monitoring site located in Atlanta, GA. Daily integrated
PM2.5 samples were collected using the particulate
composition monitor (PCM, Atmospheric Research
and Analysis, Inc.) that permits simultaneous sampling
on a 3-stage filter pack (Teflon, Nylon, and cellulose
filter), a Nylon filter, and a quartz filter.
The PM2.5 samples from Washington, DC, Brigan-
tine, NJ, and Seattle, WA were collected on Wednesdays
and Saturdays at the Interagency Monitoring of
Protected Visual Environments (IMPROVE) (Malm
et al., 1994) monitoring site. Integrated 24-h PM2.5
samples were collected on Teflon, Nylon, and quartz
filters. The quartz filters collected by both SEARCH and
IMPROVE studies were analyzed via the thermal optical
reflectance (TOR) method (Chow et al., 1993) for eight
temperature resolved carbon fractions (OC1-OC4, EC1-
EC3) (Desert Research Institute, Reno, NV).
For the Atlanta study, 529 daily samples collected
between August 1998 and August 2000 were used. A
total of 718 samples collected between August 1988 and
December 1997 and 910 samples collected between
March 1992 and May 2001 were used for the Washing-
ton, DC and Brigantine studies, respectively. For the
Seattle study, 384 samples collected between March
1996 and February 2000 were analyzed. Detailed filter
analyses and summaries of PM2.5 speciation data used in
these PMF analyses are provided in Kim et al. (2004b,c)
and Kim and Hopke (2004a,b).
2.2. Source apportionment
The general receptor modeling problem can be stated
in terms of the contribution from p independent sources
to all chemical species in a given sample as follows
(Miller et al., 1972; Hopke, 1985)
xij ¼Xp
k¼1
gikfkj þ eij ; ð1Þ
where xij is the jth species concentration measured in the
ith sample, gik is the particulate mass concentration from
the kth source contributing to the ith sample, fkj is the
jth species mass fraction from the kth source, eij is
residual associated with the jth species concentration
measured in the ith sample, and p is the total number of
independent sources. PMF provides a solution that
minimizes a weighted sum of squared residuals (Paatero,
1997; Polissar et al., 1998). PM2.5 compositional data
measured in Atlanta, GA, Washington, DC, and
Brigantine, NJ were analyzed using PMF2, and those
measured in Seattle, WA was analyzed using more
flexible multivariate modeling tool, the multilinear
engine (Paatero, 1999).
The application of PMF depends on the estimated
uncertainties for each of the data values. The uncer-
tainty estimation provides a useful tool to decrease the
weight of missing and below detection limit data in the
solution. The procedure of Polissar et al. (1998) was
used to assign measured data and the associated
uncertainties. The final PMF solutions were determined
by experiments with different number of sources with
the final choice based on the evaluation of the resulting
source profiles as well as the quality of the species fits.
The 11–, 10 –, 11– and 11-source models provided the
most physically reasonable source profiles for the
Atlanta, Washington, DC, Brigantine, and Seattle
studies, respectively. A summary of the PMF resolved
average source contributions to PM2.5 mass concentra-
tions at four monitoring sites used in this study is shown
in Table 1.
2.3. Conditional probability function
CPF (Ashbaugh et al., 1985) analyzes point source
impacts from varying wind directions using the source
contribution estimates from PMF coupled with the wind
direction values measured on site (Kim et al., 2003). The
CPF estimates the probability that a given source
contribution from a given wind direction will exceed a
predetermined threshold criterion.. The same daily
contribution was assigned to each hour of a given day
to match to the hourly wind data. The CPF is defined as
CPFDy ¼mDy
nDy; ð2Þ
where mDy is the number of occurrence from wind sector
Dy that exceeded the threshold criterion, and nDy is the
total number of data from the same wind sector. In this
study, 24 sectors were used (Dy ¼ 15�). Calm wind
(o1m s�1) periods were excluded from this analysis due

ARTICLE IN PRESS
Table 1
The PMF resolved average source contributions (mgm�3) to PM2.5 mass concentrations at four monitoring sites
Average source contribution (standard error)
Atlanta, GAa Washington, DCb Brigantine, NJc Seattle, WAd
Secondary sulfate aerosol 2.2 (0.10)
Secondary sulfate aerosol (carbon-low) 8.3 (0.3)
Secondary sulfate aerosol (summer-high) 7.7 (0.3) 5.4 (0.2)
Secondary sulfate aerosol (winter-high) 1.1 (0.03) 0.6 (0.02)
Secondary sulfate aerosol (carbon-rich) 1.0 (0.03) 1.9 (0.07) 0.7 (0.02)
Diesel emissions 1.8 (0.07) 0.3 (0.01) 0.4 (0.01) 1.9 (0.10)
Gasoline vehicle 1.1 (0.04) 3.8 (0.1) 1.4 (0.04) 0.8 (0.06)
Nitrate-rich secondary aerosol 1.4 (0.06) 1.6 (0.06) 0.6 (0.03) 0.4 (0.02)
Airborne soil 0.5 (0.02) 0.3 (0.02) 0.4 (0.02) 0.6 (0.03)
Incinerator 0.7 (0.02) 0.2 (0.01)
Aged sea salt 0.4 (0.01) 0.8 (0.03) 0.7 (0.03)
Oil combustion 0.3 (0.01) 0.1 (0.005) 0.2 (0.02)
Sea salt 0.5 (0.03) 0.3 (0.04)
Wood smoke 1.1 (0.04) 1.4 (0.09)
Paper mill 0.2 (0.01)
Metal processing 0.6 (0.03) 0.1 (0.005)
Railroad traffic 0.4 (0.01)
Cement kiln/carbon-rich 0.3 (0.01)
Bus maintenance facility/highway traffic 0.3 (0.02)
aKim et al., 2004b.bKim and Hopke, 2004a.cKim and Hopke, 2004b.dKim et al., 2004c.
E. Kim, P.K. Hopke / Atmospheric Environment 38 (2004) 4667–4673 4669
to the isotropic behavior of wind vane under calm
winds. From tests with several different percentile of the
fractional contribution from each source, a threshold
criterion of the upper 25 percentile was chosen to define
the directionality of the sources. The sources are likely
to be located to the direction that have high conditional
probability values.
2.4. Nonparametric regression
NPR (Hardle, 1990) is a regression model without
parameters since it estimates the expected value of
concentration given wind direction. To find the direc-
tions of peaks in the ambient concentrations, Henry et al.
(2002) suggested NPR using a Gaussian kernel as a
nonsubjective alternative to the usual bar chart method
that is highly dependent on the location and size of Dy:NPR produces statistical confidence intervals as well as
estimates of the location of peaks, and is able to separate
closely located peaks. NPR was applied to the hourly
measured cyclohexane data from two sites in Houston,
TX. The triangulation of the peak directions estimated
from two sites correctly pointed to the source (Henry
et al., 2002).
The average concentration over a sliding window of
width Dy centered at y is generalized to use Dy as a
smoothing parameter.
%Cðy;DyÞ ¼Pn
i¼1 Kððy� WiÞ=DyÞCiPni¼1 Kððy� WiÞ=DyÞ
; ð3Þ
where Wi is the measured wind direction and Ci is the
measured concentration for the ith sample, and n is the
total number of samples. To give different weights to the
measurements, a Gaussian kernel function, K(x), is used
and defined as
KðxÞ ¼1ffiffiffiffiffiffi2p
p expð�0:5x2Þ: ð4Þ
This function gives maximum weight to the measure-
ments near y: Henry et al. (2002) defined Dy in terms of
the full width of the peak in kernel function measured at
the point where the curve has fallen to half of its
maximum value. The optimal Dy is the one that
minimize the sum of squared difference (V ðDyÞ) betweenthe measured concentration and the estimated concen-
tration leaving out one observation.
V ðDyÞ ¼Xn
j¼1
ðCj � %CjðWj ;DyÞÞ2; ð5Þ
ARTICLE IN PRESS
Fig. 2. Comparison between (a) CPF and (b) NPR plots for the
oil combustion in Seattle, WA.
E. Kim, P.K. Hopke / Atmospheric Environment 38 (2004) 4667–46734670
where
%CjðWj ;DyÞ ¼
Piaj KððWj � WiÞ=DyÞCiP
iaj KððWj � WiÞ=DyÞ: ð6Þ
The confidence intervals in the estimated concentra-
tions are based on the asymptotic normal distribution
(Hardle, 1990) and defined as
S2ðyÞ ¼Ck %sðyÞnDy %fðyÞ
; ð7Þ
where
Ck ¼1ffiffiffiffiffiffi2p
p ; ð8Þ
%fðyÞ ¼ ðnDyÞ�1Xn
i¼1
Ky� Wi
Dy
� �; ð9Þ
%s2ðyÞ ¼ ðn %fðyÞÞ�1Xn
i¼1
Ky� Wi
Dy
� �ðCi � %Cðy;DyÞÞ2: ð10Þ
In this study, the same daily contribution deduced by
PMF was assigned to each hour of a given day as Ci in
Eq. (3) to match to the hourly wind data. Calm winds
were also excluded from this analysis.
3. Results and discussion
To determine the optimal Dy for the calculation of
NPR, a variety of angular intervals were tested. The
final Dy for each of the forty-three source contributions
to particle mass at the four monitoring sites ranged from
3� to 14�. These values were determined based on the
evaluation of the measured concentrations and the
estimated concentrations leaving out one observation
(Eq. (5)).
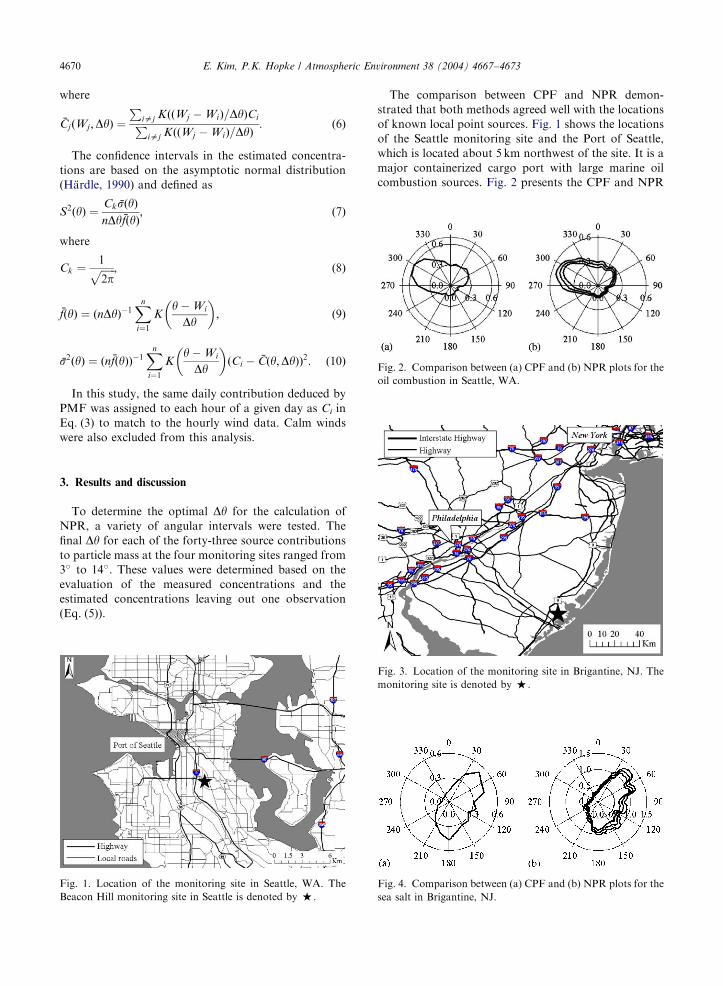
Fig. 1. Location of the monitoring site in Seattle, WA. The
Beacon Hill monitoring site in Seattle is denoted by %.
The comparison between CPF and NPR demon-
strated that both methods agreed well with the locations
of known local point sources. Fig. 1 shows the locations
of the Seattle monitoring site and the Port of Seattle,
which is located about 5 km northwest of the site. It is a
major containerized cargo port with large marine oil
combustion sources. Fig. 2 presents the CPF and NPR
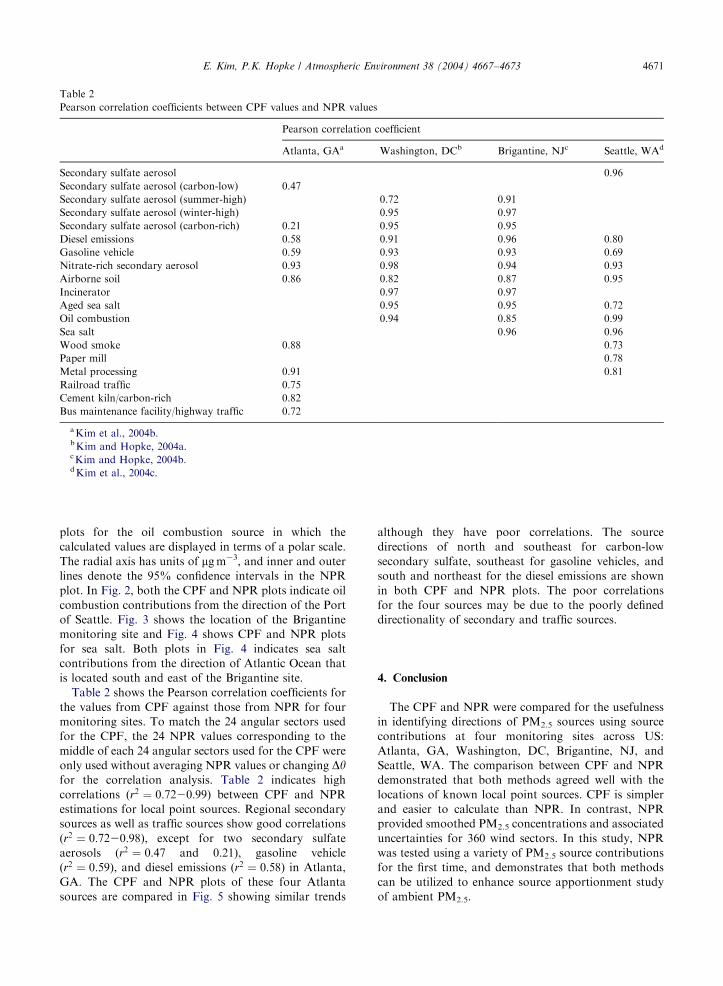
Fig. 3. Location of the monitoring site in Brigantine, NJ. The
monitoring site is denoted by %.
Fig. 4. Comparison between (a) CPF and (b) NPR plots for the
sea salt in Brigantine, NJ.
ARTICLE IN PRESS
Table 2
Pearson correlation coefficients between CPF values and NPR values
Pearson correlation coefficient
Atlanta, GAa Washington, DCb Brigantine, NJc Seattle, WAd
Secondary sulfate aerosol 0.96
Secondary sulfate aerosol (carbon-low) 0.47
Secondary sulfate aerosol (summer-high) 0.72 0.91
Secondary sulfate aerosol (winter-high) 0.95 0.97
Secondary sulfate aerosol (carbon-rich) 0.21 0.95 0.95
Diesel emissions 0.58 0.91 0.96 0.80
Gasoline vehicle 0.59 0.93 0.93 0.69
Nitrate-rich secondary aerosol 0.93 0.98 0.94 0.93
Airborne soil 0.86 0.82 0.87 0.95
Incinerator 0.97 0.97
Aged sea salt 0.95 0.95 0.72
Oil combustion 0.94 0.85 0.99
Sea salt 0.96 0.96
Wood smoke 0.88 0.73
Paper mill 0.78
Metal processing 0.91 0.81
Railroad traffic 0.75
Cement kiln/carbon-rich 0.82
Bus maintenance facility/highway traffic 0.72
aKim et al., 2004b.bKim and Hopke, 2004a.cKim and Hopke, 2004b.dKim et al., 2004c.
E. Kim, P.K. Hopke / Atmospheric Environment 38 (2004) 4667–4673 4671
plots for the oil combustion source in which the
calculated values are displayed in terms of a polar scale.
The radial axis has units of mgm�3, and inner and outer
lines denote the 95% confidence intervals in the NPR
plot. In Fig. 2, both the CPF and NPR plots indicate oil
combustion contributions from the direction of the Port
of Seattle. Fig. 3 shows the location of the Brigantine
monitoring site and Fig. 4 shows CPF and NPR plots
for sea salt. Both plots in Fig. 4 indicates sea salt
contributions from the direction of Atlantic Ocean that
is located south and east of the Brigantine site.
Table 2 shows the Pearson correlation coefficients for
the values from CPF against those from NPR for four
monitoring sites. To match the 24 angular sectors used
for the CPF, the 24 NPR values corresponding to the
middle of each 24 angular sectors used for the CPF were
only used without averaging NPR values or changing Dyfor the correlation analysis. Table 2 indicates high
correlations (r2 ¼ 0:7220:99) between CPF and NPR
estimations for local point sources. Regional secondary
sources as well as traffic sources show good correlations
(r2 ¼ 0:7220:98), except for two secondary sulfate
aerosols (r2 ¼ 0:47 and 0:21), gasoline vehicle
(r2 ¼ 0:59), and diesel emissions (r2 ¼ 0:58) in Atlanta,
GA. The CPF and NPR plots of these four Atlanta
sources are compared in Fig. 5 showing similar trends
although they have poor correlations. The source
directions of north and southeast for carbon-low
secondary sulfate, southeast for gasoline vehicles, and
south and northeast for the diesel emissions are shown
in both CPF and NPR plots. The poor correlations
for the four sources may be due to the poorly defined
directionality of secondary and traffic sources.
4. Conclusion
The CPF and NPR were compared for the usefulness
in identifying directions of PM2.5 sources using source
contributions at four monitoring sites across US:
Atlanta, GA, Washington, DC, Brigantine, NJ, and
Seattle, WA. The comparison between CPF and NPR
demonstrated that both methods agreed well with the
locations of known local point sources. CPF is simpler
and easier to calculate than NPR. In contrast, NPR
provided smoothed PM2.5 concentrations and associated
uncertainties for 360 wind sectors. In this study, NPR
was tested using a variety of PM2.5 source contributions
for the first time, and demonstrates that both methods
can be utilized to enhance source apportionment study
of ambient PM2.5.

ARTICLE IN PRESS
Fig. 5. The comparison between (a) CPF and (b) NPR plots for
Atlanta, GA.
E. Kim, P.K. Hopke / Atmospheric Environment 38 (2004) 4667–46734672
Acknowledgements
We would like to thank Dr. Ronald Henry for
providing his script for the NPR calculation. This work
was supported by the United States Environmental
Protection Agency (US EPA)’s the Science to Achieve
Results (STAR) program under Grant R83107801.
Although the research described in this article has been
funded by the US EPA, the views expressed herein are
solely those of the authors and do not represent the
official policies or positions of the US EPA.
References
Ashbaugh, L.L., Malm, W.C., Sadeh, W.Z., 1985. A residence
time probability analysis of sulfur concentrations at Grand
Canyon national park. Atmospheric Environment 19 (8),
1263–1270.
Begum, A.B., Kim, E., Biswas, S.K., Hopke, P.K., 2004.
Investigation of sources of atmospheric aerosol at urban
and semi-urban areas in Bangladesh. Atmospheric Environ-
ment 38, 3025–3038.
Chow, J.C., Watson, J.G., Pritchett, L.C., Pierson, W.R.,
Frazier, C.A., Purcell, R.G., 1993. The DRI thermal/optical
reflectance carbon analysis system: description, evaluation
and applications in US. air quality studies. Atmospheric
Environment 27A (8), 1185–1201.
Hansen, D.A., Edgerton, E.S., Hartsell, B.E., Jansen, J.J.,
Kandasamy, N., Hidy, G.M., Blanchard, C.L., 2003. The
southeastern aerosol research and characterization study:
part 1—overview. Journal of Air and Waste Management
Association 53, 1460–1471.
Hardle, W., 1990. Applied Nonparametric Regression.
Cambridge University Press, Cambridge.
Henry, R.C., Chang, Y.-S., Spiegelman, C.H., 2002. Location
nearby sources of air pollution by nonparametric regression
of atmospheric concentrations on wind direction. Atmo-
spheric Environment 36, 2237–2244.
Hopke, P.K., 1985. Receptor Modeling in Environmental
Chemistry. Wiley, New York.
Kim, E., Hopke, P.K., 2004a. Source apportionment of fine
particles at Washington, DC utilizing temperature resolved
carbon fractions. Journal of Air and Waste Management
Association 54, 773–785.
Kim, E., Hopke, P.K., 2004b. Improving source identification
of fine particles in a rural northeastern US area utilizing
temperature resolved carbon fractions. Journal of Geophy-
sical Research 109, D09204.
Kim, E., Hopke, P.K., Edgerton, E.S., 2003. Source identifica-
tion of atlanta aerosol by positive matrix factorization.
Journal of Air and Waste Management Association 53,
731–739.
Kim, E., Hopke, P.K., Larson, T.V., Covert, D.S., 2004a.
Analysis of ambient particle size distributions using positive
matrix factorization and unmix. Environmental Science and
Technology 38, 202–209.
Kim, E., Hopke, P.K., Edgerton, E.S., 2004b. Improving source
identification of Atlanta aerosol using temperature resolved
carbon fractions in positive matrix factorization. Atmo-
spheric Environment 38, 3349–3362.
Kim, E., Hopke, P.K., Larson, T.V., Maykut, N.N., Lewtas, J.,
2004c. Factor analysis of Seattle fine particles. Aerosol
Science and Technology, in press.
Lee, J.H., Yoshida, Y., Turpin, B.J., Hopke, P.K., Poirot, R.L.,
Lioy, P.J., Oxley, J.C., 2002. Identification of sources
contributing to mid-Atlantic regional aerosol. Journal of
Air and Waste Management Association 52, 1186–1205.

ARTICLE IN PRESSE. Kim, P.K. Hopke / Atmospheric Environment 38 (2004) 4667–4673 4673
Malm, W.C., Sisler, J.F., Huffman, D., Eldred, R.A., Cahill,
T.A., 1994. Spatial and seasonal trends in particle concen-
tration and optical extinction in the United States. Journal
of Geophysical Research 99 (D1), 1347–1370.
Miller, M.S., Friedlander, S.K., Hidy, G.M., 1972. A chemical
element balance for the Pasadena aerosol. Journal of
Colloid and Interface Science 39, 165–176.
Paatero, P., 1997. Least square formulation of robust non-
negative factor analysis. Chemometrics and Intelligent
Laboratory Systems 37, 23–35.
Paatero, P., 1999. The multilinear engine-a table driven, least
square program for solving multilinear problems, including
the n-way parallel factor analysis model. Journal of
Computational and Graphical Statistics 8 (4), 854–888.
Polissar, A.V., Hopke, P.K., Paatero, P., Malm, W.C., Sisler,
J.F., 1998. Atmospheric aerosol over Alaska 1. Elemental
composition and sources. Journal of Geophysical Research
103 (D15), 19045–19057.
Polissar, A.V., Hopke, P.K., Poirot, R.L., 2001. Atmospheric
aerosol over Vermont: chemical composition and sources.
Environmental Science and Technology 35, 4604–4621.
Ramadan, Z., Song, X.H., Hopke, P.K., 2000. Identification of
sources of Phoenix aerosol by positive matrix factorization.
Journal of Air and Waste Management Association 50,
1308–1320.
Song, X.H., Polissar, A.V., Hopke, P.K., 2001. Source of fine
particle composition in the northeastern US. Atmospheric
Environment 35, 5277–5286.
Zhou, L., Kim, E., Hopke, P.K., Stanier, C., Pandis, S., 2004.
Advanced factor analysis on Pittsburgh particle size
distribution data. Aerosol Science and Technology 38 (51),
118–132.