Comparison Analysis of Different Time-Scale Heart Rate ...
12
Research Article Comparison Analysis of Different Time-Scale Heart Rate Variability Signals for Mental Workload Assessment in Human- Robot Interaction Shiliang Shao , 1,2 Ting Wang , 1,2 Yawei Li, 1,2,3 Chunhe Song , 1,2 Yihan Jiang, 1,2,4 and Chen Yao 1,2 1 State Key Laboratory of Robotics, Shenyang Institute of Automation, Chinese Academy of Sciences, Shenyang 110016, China 2 Institutes for Robotics and Intelligent Manufacturing, Chinese Academy of Sciences, Shenyang 110169, China 3 University of Chinese Academy of Sciences, Beijing 100049, China 4 Shenyang Ligong University, School of Automation and Electrical Engineering, Shenyang 110159, China Correspondence should be addressed to Shiliang Shao; [email protected] and Ting Wang; [email protected] Received 21 June 2021; Revised 19 August 2021; Accepted 31 August 2021; Published 6 October 2021 Academic Editor: Fa Zhu Copyright © 2021 Shiliang Shao et al. This is an open access article distributed under the Creative Commons Attribution License, which permits unrestricted use, distribution, and reproduction in any medium, provided the original work is properly cited. Excessive mental workload affects human health and may lead to accidents. This study is motivated by the need to assess mental workload in the process of human-robot interaction, in particular, when the robot performs a dangerous task. In this study, the use of heart rate variability (HRV) signals with different time scales in mental workload assessment was analyzed. A humanoid dual-arm robot that can perform dangerous work was used as a human-robot interaction object. Electrocardiogram (ECG) signals of six subjects were collected in two states: during the task and in a relaxed state. Multiple time-scale (1, 3, and 5 min) HRV signals were extracted from ECG signals. Then, we extracted the same linear and nonlinear features from the HRV signals at different time scales. The performance of machine learning algorithms using the different time-scale HRV signals obtained during the human-robot interaction was evaluated. The results show that for the per-subject case with a 3 min HRV signal length, the K -nearest neighbor classifier achieved the best mental workload classification performance. For the cross- subject case with a 5 min time-scale signal length, the gentle boost classifier achieved the best mental workload classification accuracy. This study provides a novel research idea for using HRV signals to measure mental workload during human-robot interaction. 1. Introduction Nowadays, robots, instead of humans, work in unstructured environments, expanding the scope of human work. Humans interact with robots through visual, tactile, and other feedback [1–4]. The robot can be operated remotely to complete a dangerous task; this operation can be challeng- ing for humans. At present, research in the field of robotics primarily focuses on how robots perform human control instructions, how they perceive environmental information, and how autonomous operation can be achieved [5, 6]. However, this research neglects the robot’s assessment of the human’s psychological activity and the emotions of humans interacting with the robot. Therefore, it is of great significance to accurately measure the mental workload of the operator during their interaction with the robot [7, 8]. Mental workload can be measured continuously and objectively using physiological signals. In particular, heart rate variability (HRV) signals have been widely studied because they are easy to collect. In [9], the relationships between mental workload and time-domain, frequency- domain, and Poincare plot features of 5 min signals were analyzed. In [10], 5 min HRV signal segments were used to detect the mental workload of a worker. Several linear fea- tures (time and frequency domains) were utilized. Then, the combination of principal component analysis and sup- port vector machine (SVM) achieved 84.4% accuracy. In fact, the physiological system of the human body can be Hindawi Wireless Communications and Mobile Computing Volume 2021, Article ID 8371637, 12 pages https://doi.org/10.1155/2021/8371637
Transcript of Comparison Analysis of Different Time-Scale Heart Rate ...

Research ArticleComparison Analysis of Different Time-Scale Heart RateVariability Signals for Mental Workload Assessment in Human-Robot Interaction
Shiliang Shao ,1,2 Ting Wang ,1,2 Yawei Li,1,2,3 Chunhe Song ,1,2 Yihan Jiang,1,2,4
and Chen Yao1,2
1State Key Laboratory of Robotics, Shenyang Institute of Automation, Chinese Academy of Sciences, Shenyang 110016, China2Institutes for Robotics and Intelligent Manufacturing, Chinese Academy of Sciences, Shenyang 110169, China3University of Chinese Academy of Sciences, Beijing 100049, China4Shenyang Ligong University, School of Automation and Electrical Engineering, Shenyang 110159, China
Correspondence should be addressed to Shiliang Shao; [email protected] and Ting Wang; [email protected]
Received 21 June 2021; Revised 19 August 2021; Accepted 31 August 2021; Published 6 October 2021
Academic Editor: Fa Zhu
Copyright © 2021 Shiliang Shao et al. This is an open access article distributed under the Creative Commons Attribution License,which permits unrestricted use, distribution, and reproduction in any medium, provided the original work is properly cited.
Excessive mental workload affects human health and may lead to accidents. This study is motivated by the need to assess mentalworkload in the process of human-robot interaction, in particular, when the robot performs a dangerous task. In this study, theuse of heart rate variability (HRV) signals with different time scales in mental workload assessment was analyzed. A humanoiddual-arm robot that can perform dangerous work was used as a human-robot interaction object. Electrocardiogram (ECG)signals of six subjects were collected in two states: during the task and in a relaxed state. Multiple time-scale (1, 3, and 5min)HRV signals were extracted from ECG signals. Then, we extracted the same linear and nonlinear features from the HRVsignals at different time scales. The performance of machine learning algorithms using the different time-scale HRV signalsobtained during the human-robot interaction was evaluated. The results show that for the per-subject case with a 3min HRVsignal length, the K-nearest neighbor classifier achieved the best mental workload classification performance. For the cross-subject case with a 5min time-scale signal length, the gentle boost classifier achieved the best mental workload classificationaccuracy. This study provides a novel research idea for using HRV signals to measure mental workload during human-robotinteraction.
1. Introduction
Nowadays, robots, instead of humans, work in unstructuredenvironments, expanding the scope of human work.Humans interact with robots through visual, tactile, andother feedback [1–4]. The robot can be operated remotelyto complete a dangerous task; this operation can be challeng-ing for humans. At present, research in the field of roboticsprimarily focuses on how robots perform human controlinstructions, how they perceive environmental information,and how autonomous operation can be achieved [5, 6].However, this research neglects the robot’s assessment ofthe human’s psychological activity and the emotions ofhumans interacting with the robot. Therefore, it is of great
significance to accurately measure the mental workload ofthe operator during their interaction with the robot [7, 8].
Mental workload can be measured continuously andobjectively using physiological signals. In particular, heartrate variability (HRV) signals have been widely studiedbecause they are easy to collect. In [9], the relationshipsbetween mental workload and time-domain, frequency-domain, and Poincare plot features of 5min signals wereanalyzed. In [10], 5min HRV signal segments were used todetect the mental workload of a worker. Several linear fea-tures (time and frequency domains) were utilized. Then,the combination of principal component analysis and sup-port vector machine (SVM) achieved 84.4% accuracy. Infact, the physiological system of the human body can be
HindawiWireless Communications and Mobile ComputingVolume 2021, Article ID 8371637, 12 pageshttps://doi.org/10.1155/2021/8371637

regarded as a nonlinear system. However, the nonlinearnature of HRV signals cannot be reflected by linear analysismethods [11, 12]. In [13], the mental workload of perform-ing MATA-II tasks was measured using 5min scale HRVsignals. This study extracted the multiscale entropy featuresof the HRV. Using those, it obtained a higher accuracy formental workload recognition than using traditional time-and frequency-domain features. In [14], 5min length HRVsignal segments were utilized to evaluate the mental work-load of hospital staff. A variety of conventional and multi-scale HRV features were extracted, and SVM was used asthe classifier. The results showed that the multiscale featuresobtain a better mental workload recognition effect. In [15],the respiratory and HRV signals were extracted using5min scale electrocardiogram (ECG) signals. This studyintroduced a novel method that fused respiratory and HRVsignals to assess subtle variations in sympathovagal balanceusing ECG recordings during the MATA-II mission. Stan-dard short-term HRV analysis is usually performed on5min recordings [16], and shorter recordings of HRV sig-nals are being researched, aiming at a faster detection ofmental workload. In [17], human HRV signals were col-lected during human-robot interaction through differenttypes of wearable devices. Using signals of 3min length,the linear features of HRV signals collected by differentwearable devices were extracted, compared, and analyzedunder different mental workload levels. In [18], 3min HRVsignals were used, and linear and nonlinear features wereutilized. Several machine learning algorithms have been uti-lized for assessing the mental workload of humans whileoperating a dual-arm robot. In [19], 2.5min HRV signalswere detected by a consumer smart watch. Subsequently,the mental workload of human interaction with multiplerobots was studied. However, analysis of mental workloadrecognition with HRV signals at different time scales is notsufficiently researched. In [20], a nonparametric statisticaltest method was utilized to analyze the significant differencesbetween rest and stress phases with time scales of 30 s and 1,2, 3, and 5min. However, HRV signals were obtained fromhealthy subjects during an examination and in a resting con-dition, not during human-robot interaction.
Humans use visual, haptic, and other feedback informa-tion to remotely perceive the environment information dur-ing human-robot interaction, and the robot is remotelyoperated to complete the task. The entire human-robotinteraction process requires the joint perception anddecision-making of human hands, eyes, ears, brain, andother limbs and organs, which may be very challenging forthe operator. At present, there is a lack of mental workloadmeasurement analysis during human-robot interactionsusing HRV with different time scales. Therefore, in thisstudy, the differences among HRV signals of multiple timescales in measuring mental workload were analyzed; six tra-ditional machine learning methods were used to evaluate theperformances of HRV signals with different time scales. Tra-ditional machine learning methods were used because theyare more suitable for small sample sizes. Although deeplearning methods have been widely studied, many trainingsamples are required.
The contribution of this study can be summarized asfollows:
(i) During human-robot interaction, HRV signals werecollected based on a single physiological signal. Inaddition, linear and nonlinear features of differenttime-scale HRV signals were extracted, and statisti-cal differences between the mental workloads in thetwo states were analyzed
(ii) A variety of representative machine learning algo-rithms were applied. Differences in the perfor-mances of the machine learning algorithms withstatistically different linear and nonlinear featuresextracted from HRV signals of different time scalesin evaluating mental workload were analyzed
(iii) Finally, the different performances of the algorithmswith HRV signals of various time scales in evaluat-ing mental workload are discussed
The remainder of this paper is organized as follows. Sec-tion 2 introduces the data collection and preprocessing algo-rithms. The mental workload assessment results ofalgorithms using different time scales of HRV signals and adiscussion of the results are presented in Section 3. The con-cluding remarks are presented in Section 4.
2. Data and Method
The research block diagram is shown in Figure 1. It can beseen that the ECG signals were obtained from volunteerswhile they operated the dual-arm robot and in the rest state.HRV signals were then extracted from the ECG signals.Using a sliding window of different time scales (1, 3, and5min), the HRV signals were divided to obtain a collectionof sample data of different time scales. Then, linear and non-linear features of different time scales were extracted. Inaddition, an SVM, K-nearest neighbor (KNN) classifier, gen-tle boost (GB), linear discriminant analysis (LDA), naiveBayes (NB), and decision tree (DT) were utilized to identifythe task-performing and rest states. The performance differ-ences of the classifiers in the mental workload evaluationwith HRV signals at different time scales were comparedand analyzed.
2.1. Data. In this subsection, the subjects and data acquisi-tion processes are described. Then, a preprocessing algo-rithm is introduced to obtain the HRV signals from thecollected ECG signals. In addition, multiple time-scaleHRV signal segments are obtained using sliding windowsof different time scales.
2.1.1. Participants. The ECG signals used for mental work-load assessments were obtained from six male participants.A description of the six subjects is provided in Table 1. Theywere recruited from the Shenyang Institute of Automation,Chinese Academy of Sciences. Their average age was 25.16(±2.93). They had normal or corrected vision and were allhealthy, with no nervous system diseases. Before startingthe experimental data collection, all participants were
2 Wireless Communications and Mobile Computing

informed of the entire data collection process andprecautions.
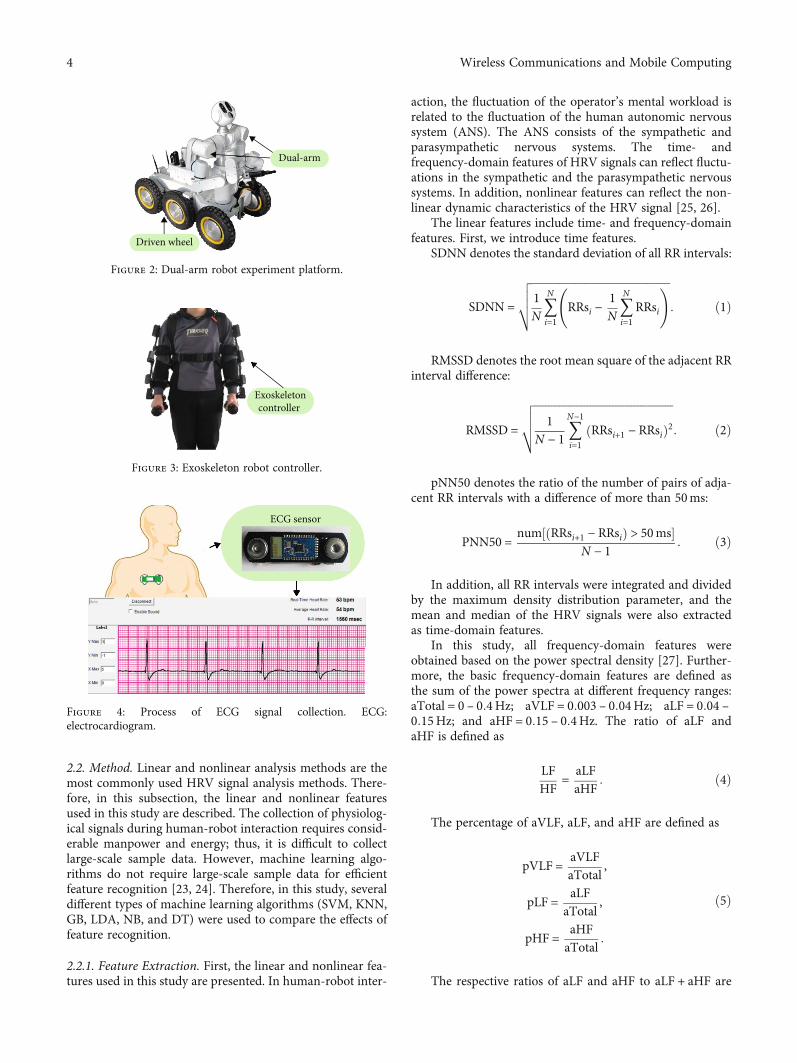
2.1.2. Data Acquisition. In this study, the operating objectwas a dual-arm robot shown in Figure 2. It can be seen thatthe robot consists of six wheels and two arms. Moreover,each wheel is independent, and each arm has seven degreesof freedom to access all positions in space. In addition, thetop of the robot is equipped with a binocular camera forenvironmental observations. The robot controller is an exo-skeleton device that can be worn by an operator (Figure 3).The exoskeleton controller also has two arms, and eacharm has seven degrees of freedom, similar to the dual-armrobot. The ECG signal collection process is shown inFigure 4. A portable sensor was placed on the chest of theoperator for the acquisition of ECG signals. The capturedECG signals were sent to a computer via Bluetooth for pro-cessing. ECG signals were collected in two states of the oper-ator: during the operation of the dual-arm robot and duringrest.
2.1.3. Signal Preprocessing. The HRV signals refer to a timeseries consisting of intervals between each pair of heartbeats.
Therefore, to obtain the HRV signals, it is necessary to detectthe peak and trough values of the ECG signals. Therefore,the Q, R, and S waves of the ECG signal were detected usinga QRS wave group detection method [21]. However, theremay be an abnormal point in the output RR intervalsequence. Therefore, a classical median-filtering algorithmwas applied to the output RR interval sequence [22]. TheRR interval sequence was regarded as an HRV signal. Asshown in Figures 5–7, sliding windows at different timescales (1, 3, and 5min) were used with an overlap of30 s. HRV signals were then divided into six groups: M-1, R-1, M-3, R-3, M-5, and R-5 groups. The M group sig-nals represent the operator in the task-performing state,and the R group signals represent the operator in the reststate.
The proposed mental workload assessment preprocess-ing algorithm is described in Algorithm 1, where xiðtÞ isthe ECG data recorded from the ith participant, and I isthe number of participants. The purpose of Steps 1 to 6 isto obtain the HRV signals yiðtÞ from xiðtÞ signals. TheHRV signals yiðtÞ are segmented into different time-scale(1, 3, and 5min) segments y1i ðtÞ, y3i ðtÞ, and y5i ðtÞ in Steps 7to 10.
(a) Multiple time scale HRV
Cross-subject
Nonlinear features
Frequency domain features
Time domain features
(b) Features extraction
(c) Mental workload assessment(d) Performance validation
Per-subject
Crossvalidation
ECG signal
Robot
LDA
, NB, D
T
SVM
, KNN
, GB
×100%TP+TN
Multipletimes scales
PosNeg
Feedback of environmental
and state information
Human
EGG singnal
Control com
mand
800
600
400
200
0
0.55
0.5
0.45
0.4
0.35
00 50 100 150 200 250 300 350 400
0 1000 2000 3000 4000 5000 6000 7000HRV signal
8000 9000
TP+FP+TN+FNAcc =
ECG signal
Human
Controlcom
mand
Figure 1: Framework of multiple time-scale HRV analysis for mental workload assessment. HRV: heart rate variability; ECG:electrocardiogram; SVM: support vector machine; KNN: K-nearest neighbors; GB: gentle boost; LDA: linear discriminant analysis; NB:naive Bayes; DT: decision tree; TP: true positive; TN: true negative; FP: false positive; FN: false negative.
Table 1: Participant characteristics.
Subject 1 Subject 2 Subject 3 Subject 4 Subject 5 Subject 6
Height (cm) 180 175 173 180 175 178
Weight (kg) 67.5 78.5 58 55 75 72.5
Age (years) 24 24 31 23 24 25
Body mass index (kg/m2) 20.8 25.6 19.4 17.0 24.5 22.9
3Wireless Communications and Mobile Computing
2.2. Method. Linear and nonlinear analysis methods are themost commonly used HRV signal analysis methods. There-fore, in this subsection, the linear and nonlinear featuresused in this study are described. The collection of physiolog-ical signals during human-robot interaction requires consid-erable manpower and energy; thus, it is difficult to collectlarge-scale sample data. However, machine learning algo-rithms do not require large-scale sample data for efficientfeature recognition [23, 24]. Therefore, in this study, severaldifferent types of machine learning algorithms (SVM, KNN,GB, LDA, NB, and DT) were used to compare the effects offeature recognition.
2.2.1. Feature Extraction. First, the linear and nonlinear fea-tures used in this study are presented. In human-robot inter-
action, the fluctuation of the operator’s mental workload isrelated to the fluctuation of the human autonomic nervoussystem (ANS). The ANS consists of the sympathetic andparasympathetic nervous systems. The time- andfrequency-domain features of HRV signals can reflect fluctu-ations in the sympathetic and the parasympathetic nervoussystems. In addition, nonlinear features can reflect the non-linear dynamic characteristics of the HRV signal [25, 26].
The linear features include time- and frequency-domainfeatures. First, we introduce time features.
SDNN denotes the standard deviation of all RR intervals:
SDNN =
ffiffiffiffiffiffiffiffiffiffiffiffiffiffiffiffiffiffiffiffiffiffiffiffiffiffiffiffiffiffiffiffiffiffiffiffiffiffiffiffiffiffiffiffiffiffiffiffiffiffi
1N〠N
i=1RRsi −
1N〠N
i=1RRsi
!
v
u
u
t : ð1Þ
RMSSD denotes the root mean square of the adjacent RRinterval difference:
RMSSD =
ffiffiffiffiffiffiffiffiffiffiffiffiffiffiffiffiffiffiffiffiffiffiffiffiffiffiffiffiffiffiffiffiffiffiffiffiffiffiffiffiffiffiffiffiffiffiffiffiffiffi
1N − 1
〠N−1
i=1RRsi+1 − RRsið Þ2
v
u
u
t : ð2Þ
pNN50 denotes the ratio of the number of pairs of adja-cent RR intervals with a difference of more than 50ms:
PNN50 =num RRsi+1 − RRsið Þ > 50ms½ �
N − 1: ð3Þ
In addition, all RR intervals were integrated and dividedby the maximum density distribution parameter, and themean and median of the HRV signals were also extractedas time-domain features.
In this study, all frequency-domain features wereobtained based on the power spectral density [27]. Further-more, the basic frequency-domain features are defined asthe sum of the power spectra at different frequency ranges:aTotal = 0 – 0:4Hz; aVLF = 0:003 – 0:04Hz; aLF = 0:04 –0:15Hz; and aHF = 0:15 – 0:4Hz. The ratio of aLF andaHF is defined as
LFHF
=aLFaHF
: ð4Þ
The percentage of aVLF, aLF, and aHF are defined as
pVLF =aVLFaTotal
,
pLF =aLF
aTotal,
pHF =aHFaTotal
:
ð5Þ
The respective ratios of aLF and aHF to aLF + aHF are
Driven wheel
Dual-arm
Figure 2: Dual-arm robot experiment platform.
Exoskeletoncontroller
Figure 3: Exoskeleton robot controller.
ECG sensor
Figure 4: Process of ECG signal collection. ECG:electrocardiogram.
4 Wireless Communications and Mobile Computing

defined as
nLF =aLF
aLF + aHF,
nHF =aHF
aLF + aHF:
ð6Þ
Finally, two typical nonlinear analysis methods appliedin this study are presented. These are sample entropy (SaEn)and detrended fluctuation analysis (DFA). On the one hand,SaEn is a method for investigating the dynamics of HRV sig-nals. It has the advantages of strong antinoise and antijam-ming abilities. In addition, it can be used to analyzeshorter HRV signals. In the case of large differences in theparameter value range, good consistency is still achieved.On the other hand, DFA is suitable for the analysis of non-stationary time series, and HRV signals have this character-
istic. In addition, the DFA method can filter out the trendcomponents in the HRV signal. Therefore, it can effectivelyavoid the disturbance of false correlations owing to noiseand signal instability.
2.2.2. Mental Workload Recognition. In this subsection, theabstracted feature vector of HRV signals at different timescales is used to evaluate the mental workload. The differenttime-scale HRV features were analyzed using the t-test toobtain the statistical significance of the difference betweentask-performing and relaxed states; p < 0:05 was consideredstatistically significant [28]. Then, linear and nonlinear fea-tures with statistical differences were used to construct fea-ture vectors as inputs to machine learning algorithms. Sixdifferent machine learning methods, SVM, KNN, LDA,GB, NB, and DT, were used in this study to exclude theeffects of performance differences in machine learningalgorithms.
After the initial HRV signal preprocessing, 1, 3, and5min time-scale HRV signals for mental workload can beassessed using Algorithm 2. The linear and nonlinear fea-tures of the ith subject were extracted in Steps 2 to 5. ~Fsi isdefined as the feature vector in the human task-performingstate, and F̂si is defined as the feature vector in the humanrelaxed state. Steps 6 to 11 define the process of per-subjectmental workload assessment. F̂si Train and F̂si Test are the train-ing and testing sets of the ith subject, respectively. Steps 12to 18 define the process of cross-subject mental workloadassessment. The extracted HRV features ~Fsi and F̂si of all sub-jects in task-performing and relaxation states are merged
1 min 1-min
Samples (n)
HRV signal
1-min0.55
0.5
0.45
0.4
0.350 50 100 150 200 250 300 350 400
Am
plitu
de (m
v)
Figure 5: Heart rate variability segment by 1min time scale.
3-min 3-min3-min
Samples (n)0 50 100 150 200 250 300 350 400
0.55
0.5
0.45
0.4
0.35
Am
plitu
de (m
v)
Figure 6: Heart rate variability segment by 3min time scale.
5-min 5-minHRV signal
5-min
Samples (n)
0.55
0.55
0.45
0.4
0 50 100 150 200 250 300 350 400
Am
plitu
de (m
v)
0.35
Figure 7: Heart rate variability segment by 5min time scale.
5Wireless Communications and Mobile Computing

into matrices ~Fs and F∧s in Steps 13 and 14, respectively.Then, in Steps 15 to 17, the merged matrices ~Fs and F∧s
are prepared for model construction and mental workloadassessment.
3. Experimental Results
In this section, the mental workload recognition perfor-mance of classifiers with HRV signals of different time scalesis presented. The statistical differences of the linear and non-linear features extracted in this study among different men-tal workload levels were analyzed via a t-test, and the featurevectors were composed of per-subject and cross-subjectmental workload assessments.
To evaluate the performance of mental workload classi-fication with different time scales, accuracy was used, whichis defined as follows:
Accuracy : Acc =TP + TN
TP + FP + TN + FN× 100%, ð7Þ
where TP is true positive, FP is false positive, FN is false neg-ative, and TN is true negative.
3.1. Per-Subject Mental Workload Evaluation. The results ofper-subject mental workload evaluation at different timescales (1, 3, and 5min) are presented. The samples of eachsubject were randomly divided into two sets. One was usedfor training the machine learning model, and the other was
Input:ECG signals xiðtÞ for each i subject.Output:Multiple time-scale HRV signals for all subjects.1: For each i such that 1 ≤ i ≤ I do2: Q wave, R wave, and S wave of ECG signals xiðtÞ are detected.3: RR internal sequence is obtained.4: Abnormal points in the output RR internal sequence are removed by median filtering.5: HRV signals yiðtÞ are obtained.6: End for7: For each i such that 1 ≤ i ≤ I do8: Segment the yiðtÞ signals into 1min, 3min, and 5min time-scale segments defined as9: y1i ðtÞ, y3i ðtÞ, and y5i ðtÞ, respectively.10: End for
Algorithm 1: Mental workload assessment preparation.
Input:Multiple time-scale HRV segments for all subjects.Output:Per-subject and cross-subject probability of mental workload.1: For each time scale s, s = 1, 3, 5.2: For each i such that 1 ≤ i ≤ I do3: Extract linear and nonlinear features ~Fsi for each ysiðtÞsignal at task-performing state.4: Extract linear and nonlinear features F̂si for each ysiðtÞsignal at relaxation state.5: End for6: If per-subject mental workload assessment7: For each i such that 1 < i < I do8: Train classifiers (SVM, KNN, LDA, GB, NB, and DT) based on the training set F̂si Train randomly selected from
F̂si .9: Obtain the probability of mental workload based on the testing set F̂si Test, which is defined as F̂si‐F̂si Train.10: End for11: End if12: If cross-subject mental workload assessment13: Merge matrices ~Fs1, ~F
si ,…, ~FsI into one matrix ~Fs.
14: Merge matrices F̂s1, F̂si ,…, F̂sI into one matrix F∧s.15: Train machine learning method (SVM, KNN, LDA, GB, NB, and DT) based on the training set F̂sTrain and
~FsTrain randomly selected from F∧s and ~Fs, respectively.16: Obtain probability of mental workload based on the testing set F̂sTest and ~FsTest, which are defined as F∧s‐F̂sTrain and
~Fs‐~FsTrain, respectively.17: End if18: End for
Algorithm 2: Mental workload assessment after preprocessing.
6 Wireless Communications and Mobile Computing

used for testing the model. In addition, to increase the reli-ability of the results, the average of the results repeated 500times was regarded as the final classification result.
3.1.1. Results of Statistically Significant Features of 1, 3, and5min Length. Figure 8 shows the statistics of the significantlydifferent (p < 0:001, p < 0:01, and p < 0:05) features at differ-ent time scales of each subject. It can be seen that Subject 1has more significantly different (p < 0:001) features at the3min time scale, followed by the 1min and 5min timescales. Subject 2 showed more significantly different featuresat the 3min time scale and at the 1min time scale; the sumof the most significantly different (p < 0:001) features andthe significantly different (p < 0:01 and p < 0:05) featureswas the largest. Subject 3 and Subject 4 have the most signif-icantly different (p < 0:001) features at the 3min time scale.Subject 5 and Subject 6 have the most significantly different(p < 0:001) features at the 5min time scale.
3.1.2. Classification Accuracy of Different Classifiers withDifferent Time Scales. Figure 9 shows the classification accu-racy of the mental workload using different classifiers withdifferent time scales. Figure 9(a) shows the classificationaccuracy using SVM. It can be seen that the time scale withwhich the SVM achieved the highest average recognitionaccuracy was 3min. In addition, the average classificationaccuracies of Subject 1 to Subject 6 with the 1, 3, and5min time scales were 95.30%, 97.54%, and 95.11%, respec-tively. Figure 9(b) shows the classification accuracy usingKNN. It can be seen that the time scale with which theKNN obtained the highest average recognition accuracywas 3min. In addition, the average classification accuraciesof Subject 1 to Subject 6 with the 1, 3, and 5min time scaleswere 96.09%, 98.77%, and 96.21%, respectively. Figure 9(c)shows the classification accuracy using GB; it achieved thehighest average recognition accuracy with the 3min time
scale. In addition, the average classification accuracies ofSubject 1 to Subject 6 with the 1, 3, and 5min time scaleswere 93.17%, 95.90%, and 90.61%, respectively.
Figure 9(d) shows the classification accuracy using LDA; itdid not achieve good classification performance with any of thethree types of time scales. The average classification accuraciesof Subject 1 to Subject 6 with the 1, 3, and 5min time scales were52.02%, 52.27%, and 52.28%, respectively. Figure 9(e) shows theclassification accuracy usingNB. It can be seen thatNB achievedthe highest average recognition accuracy with the time scale of3min. The average classification accuracies of Subject 1 to Sub-ject 6 with the 1, 3, and 5min time scales were 80.52%, 84.99%,and80.07%, respectively. Finally, Figure 9(f) shows the classifica-tion accuracy using DT. The average classification accuracies ofSubject 1 to Subject 6 with the 1, 3, and 5min time scales were80.52%, 84.99%, and 80.07%, respectively.
3.2. Cross-Subject Mental Workload Evaluation. The resultsof cross-subject mental workload evaluation at different timescales (1, 3, and 5min) are presented in this subsection. Thesample data of five of the six subjects were selected to trainthe machine learning model. At the same time, the sampledata of the remaining subject were selected to test themachine learning model.
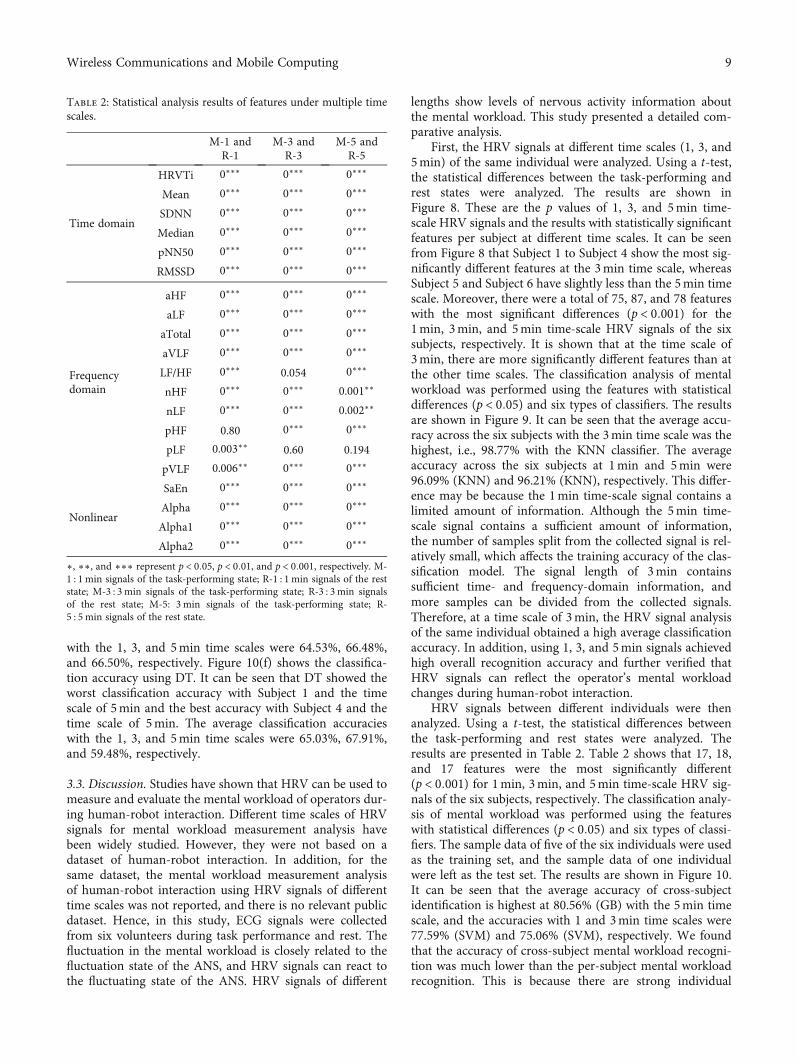
3.2.1. Statistically Significant Analysis of Features. Table 2shows the statistical differences between the two groups atthe time scales of 1, 3, and 5min. From Table 2, we cansee that there were 17 features in the most significantly dif-ferent category (p < 0:001) and 2 features with significantdifferences (p < 0:01) between groups M-1 and R-1. Therewere eighteen features in the most significantly different cat-egory (p < 0:001) and two features of the significantly differ-ent category (p < 0:01) between groups M-3 and R-3. Therewere 17 features in the most significantly different category(p < 0:001) between groups M-5 and R-5.
20
18
16
14
12
10
Num
ber o
f sta
tistic
diff
eren
ce fe
atur
es
8
6
4
2
Subject1 Subject2 Subject3
Numbers of features (p<0.001)Numbers of features (p<0.01)Numbers of features (p<0.05)
Subject4 Subject5 Subject61m
in3m
in5m
in1m
in3m
in5m
in1m
in3m
in5m
in1m
in3m
in5m
in1m
in3m
in5m
in1m
in3m
in5m
in
Figure 8: Results with statistically significant features of per-subject analysis at different time scales.
7Wireless Communications and Mobile Computing

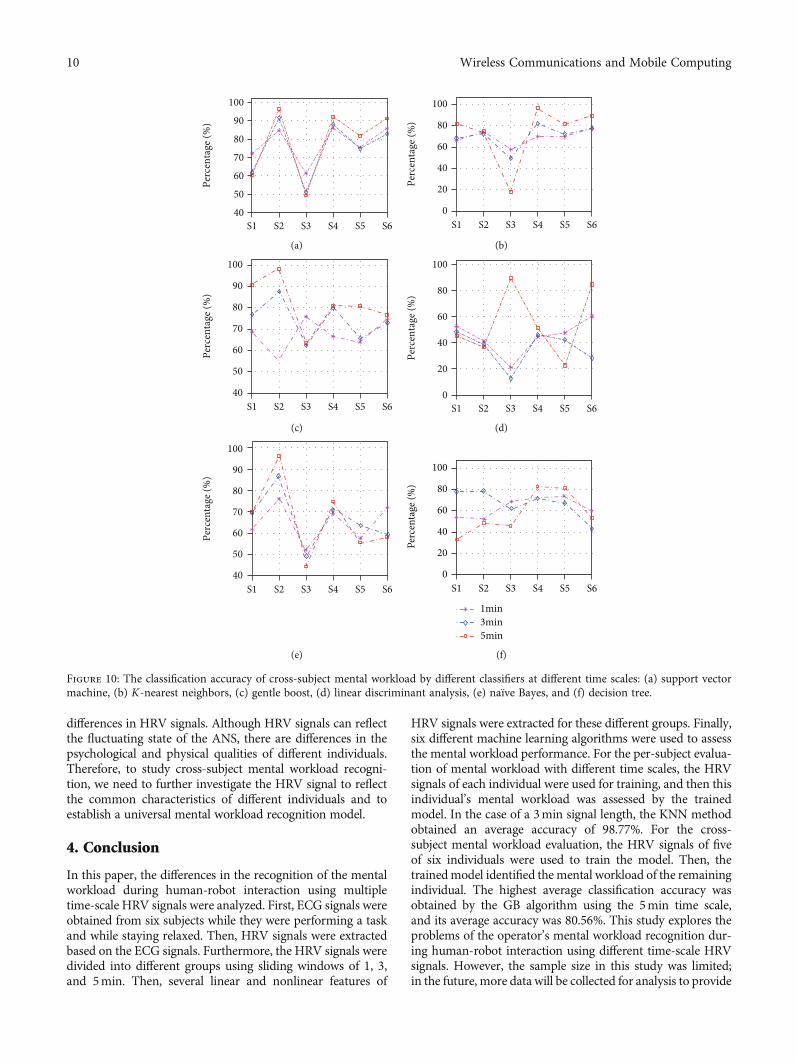
3.2.2. Classification Accuracy of Different Classifiers withDifferent Time Scales. Figure 10 shows the classificationaccuracy of the mental workload using different classifiersat different time scales. Figure 10(a) shows the classificationaccuracy using SVM. It can be seen that when Subject 3 wasused as the test subject, the classifier achieved the worst clas-sification accuracy. The average classification accuracies ofthe classifier across all subjects with the 1, 3, and 5min timescales were 77.59%, 75.06%, and 78.51%, respectively.Figure 10(b) shows the classification accuracy using KNN.Again, when Subject 3 was the test subject, the worst classi-fication accuracy was achieved. The average classificationaccuracies of the classifier across all subjects with the 1, 3,and 5min time scales were 69.24%, 70.40%, and 73.53%,respectively. Figure 10(c) shows the classification accuracyusing GB. It can be seen that GB showed the worst classifica-
tion accuracy with the time scale of 1min and the best accu-racy with the time scale of 5min, both when Subject 2 wasthe test subject. The average classification accuracies of Sub-ject 1 to Subject 6 with the 1, 3, and 5min time scales were63.53%, 71.55%, and 80.56%, respectively. Figure 10(d)shows the classification accuracy using LDA. It can be seenthat the classifier showed the worst classification accuracywith the time scale of 3min and the best accuracy with thetime scale of 5min, both when the data of Subject 3 wereused as the test set. The average classification accuracies withthe 1, 3, and 5min time scales were 44.44%, 35.92%, and53.92%, respectively. Figure 10(e) shows the classificationaccuracy using NB. It achieved the worst classification accu-racy with Subject 3 as the test subject and the time scale of5min. It obtained the best accuracy with Subject 2 and thetime scale of 5min. The average classification accuracies
1 min3 min5 min
S1 S2 S3 S4 S5 S6
100
98
96
94
92
90Pe
rcen
tage
(%)
(a)
1 min3 min5 min
S1 S2 S3 S4 S5 S6
100
98
96
94
92
90
Perc
enta
ge (%
)
(b)
1 min3 min5 min
S1 S2 S3 S4 S5 S6
100
95
90
85
80
Perc
enta
ge (%
)
(c)
1 min3 min5 min
S1 S2 S3 S4 S5 S6
70
65
60
55
50
45
40Pe
rcen
tage
(%)
(d)
1 min3 min5 min
S1 S2 S3 S4 S5 S6
100
90
80
70
60
50
Perc
enta
ge (%
)
(e)
S1 S2 S3 S4 S5 S61 min3 min5 min
100
90
80
70
60
50
Perc
enta
ge (%
)
(f)
Figure 9: Classification accuracies of per-subject mental workload by different classifiers at different time scales: (a) support vector machine,(b) K-nearest neighbors, (c) gentle boost, (d) linear discriminant analysis, (e) naïve Bayes, and (f) decision tree.
8 Wireless Communications and Mobile Computing
with the 1, 3, and 5min time scales were 64.53%, 66.48%,and 66.50%, respectively. Figure 10(f) shows the classifica-tion accuracy using DT. It can be seen that DT showed theworst classification accuracy with Subject 1 and the timescale of 5min and the best accuracy with Subject 4 and thetime scale of 5min. The average classification accuracieswith the 1, 3, and 5min time scales were 65.03%, 67.91%,and 59.48%, respectively.
3.3. Discussion. Studies have shown that HRV can be used tomeasure and evaluate the mental workload of operators dur-ing human-robot interaction. Different time scales of HRVsignals for mental workload measurement analysis havebeen widely studied. However, they were not based on adataset of human-robot interaction. In addition, for thesame dataset, the mental workload measurement analysisof human-robot interaction using HRV signals of differenttime scales was not reported, and there is no relevant publicdataset. Hence, in this study, ECG signals were collectedfrom six volunteers during task performance and rest. Thefluctuation in the mental workload is closely related to thefluctuation state of the ANS, and HRV signals can react tothe fluctuating state of the ANS. HRV signals of different
lengths show levels of nervous activity information aboutthe mental workload. This study presented a detailed com-parative analysis.
First, the HRV signals at different time scales (1, 3, and5min) of the same individual were analyzed. Using a t-test,the statistical differences between the task-performing andrest states were analyzed. The results are shown inFigure 8. These are the p values of 1, 3, and 5min time-scale HRV signals and the results with statistically significantfeatures per subject at different time scales. It can be seenfrom Figure 8 that Subject 1 to Subject 4 show the most sig-nificantly different features at the 3min time scale, whereasSubject 5 and Subject 6 have slightly less than the 5min timescale. Moreover, there were a total of 75, 87, and 78 featureswith the most significant differences (p < 0:001) for the1min, 3min, and 5min time-scale HRV signals of the sixsubjects, respectively. It is shown that at the time scale of3min, there are more significantly different features than atthe other time scales. The classification analysis of mentalworkload was performed using the features with statisticaldifferences (p < 0:05) and six types of classifiers. The resultsare shown in Figure 9. It can be seen that the average accu-racy across the six subjects with the 3min time scale was thehighest, i.e., 98.77% with the KNN classifier. The averageaccuracy across the six subjects at 1min and 5min were96.09% (KNN) and 96.21% (KNN), respectively. This differ-ence may be because the 1min time-scale signal contains alimited amount of information. Although the 5min time-scale signal contains a sufficient amount of information,the number of samples split from the collected signal is rel-atively small, which affects the training accuracy of the clas-sification model. The signal length of 3min containssufficient time- and frequency-domain information, andmore samples can be divided from the collected signals.Therefore, at a time scale of 3min, the HRV signal analysisof the same individual obtained a high average classificationaccuracy. In addition, using 1, 3, and 5min signals achievedhigh overall recognition accuracy and further verified thatHRV signals can reflect the operator’s mental workloadchanges during human-robot interaction.
HRV signals between different individuals were thenanalyzed. Using a t-test, the statistical differences betweenthe task-performing and rest states were analyzed. Theresults are presented in Table 2. Table 2 shows that 17, 18,and 17 features were the most significantly different(p < 0:001) for 1min, 3min, and 5min time-scale HRV sig-nals of the six subjects, respectively. The classification analy-sis of mental workload was performed using the featureswith statistical differences (p < 0:05) and six types of classi-fiers. The sample data of five of the six individuals were usedas the training set, and the sample data of one individualwere left as the test set. The results are shown in Figure 10.It can be seen that the average accuracy of cross-subjectidentification is highest at 80.56% (GB) with the 5min timescale, and the accuracies with 1 and 3min time scales were77.59% (SVM) and 75.06% (SVM), respectively. We foundthat the accuracy of cross-subject mental workload recogni-tion was much lower than the per-subject mental workloadrecognition. This is because there are strong individual
Table 2: Statistical analysis results of features under multiple timescales.
M-1 andR-1
M-3 andR-3
M-5 andR-5
Time domain
HRVTi 0∗∗∗ 0∗∗∗ 0∗∗∗
Mean 0∗∗∗ 0∗∗∗ 0∗∗∗
SDNN 0∗∗∗ 0∗∗∗ 0∗∗∗
Median 0∗∗∗ 0∗∗∗ 0∗∗∗
pNN50 0∗∗∗ 0∗∗∗ 0∗∗∗
RMSSD 0∗∗∗ 0∗∗∗ 0∗∗∗
Frequencydomain
aHF 0∗∗∗ 0∗∗∗ 0∗∗∗
aLF 0∗∗∗ 0∗∗∗ 0∗∗∗
aTotal 0∗∗∗ 0∗∗∗ 0∗∗∗
aVLF 0∗∗∗ 0∗∗∗ 0∗∗∗
LF/HF 0∗∗∗ 0.054 0∗∗∗
nHF 0∗∗∗ 0∗∗∗ 0.001∗∗
nLF 0∗∗∗ 0∗∗∗ 0.002∗∗
pHF 0.80 0∗∗∗ 0∗∗∗
pLF 0.003∗∗ 0.60 0.194
pVLF 0.006∗∗ 0∗∗∗ 0∗∗∗
Nonlinear
SaEn 0∗∗∗ 0∗∗∗ 0∗∗∗
Alpha 0∗∗∗ 0∗∗∗ 0∗∗∗
Alpha1 0∗∗∗ 0∗∗∗ 0∗∗∗
Alpha2 0∗∗∗ 0∗∗∗ 0∗∗∗
∗, ∗∗, and ∗∗∗ represent p < 0:05, p < 0:01, and p < 0:001, respectively. M-1 : 1 min signals of the task-performing state; R-1 : 1 min signals of the reststate; M-3 : 3 min signals of the task-performing state; R-3 : 3min signalsof the rest state; M-5: 3 min signals of the task-performing state; R-5 : 5 min signals of the rest state.
9Wireless Communications and Mobile Computing
differences in HRV signals. Although HRV signals can reflectthe fluctuating state of the ANS, there are differences in thepsychological and physical qualities of different individuals.Therefore, to study cross-subject mental workload recogni-tion, we need to further investigate the HRV signal to reflectthe common characteristics of different individuals and toestablish a universal mental workload recognition model.
4. Conclusion
In this paper, the differences in the recognition of the mentalworkload during human-robot interaction using multipletime-scale HRV signals were analyzed. First, ECG signals wereobtained from six subjects while they were performing a taskand while staying relaxed. Then, HRV signals were extractedbased on the ECG signals. Furthermore, the HRV signals weredivided into different groups using sliding windows of 1, 3,and 5min. Then, several linear and nonlinear features of
HRV signals were extracted for these different groups. Finally,six different machine learning algorithms were used to assessthe mental workload performance. For the per-subject evalua-tion of mental workload with different time scales, the HRVsignals of each individual were used for training, and then thisindividual’s mental workload was assessed by the trainedmodel. In the case of a 3min signal length, the KNN methodobtained an average accuracy of 98.77%. For the cross-subject mental workload evaluation, the HRV signals of fiveof six individuals were used to train the model. Then, thetrainedmodel identified themental workload of the remainingindividual. The highest average classification accuracy wasobtained by the GB algorithm using the 5min time scale,and its average accuracy was 80.56%. This study explores theproblems of the operator’s mental workload recognition dur-ing human-robot interaction using different time-scale HRVsignals. However, the sample size in this study was limited;in the future, more data will be collected for analysis to provide
100
90
80
70
60
Perc
enta
ge (%
)50
40S1 S2 S3 S4 S5 S6
(a)
100
80
60
40
Perc
enta
ge (%
)
20
0S1 S2 S3 S4 S5 S6
(b)
90
100
80
70
60Perc
enta
ge (%
)
50
40S1 S2 S3 S4 S5 S6
(c)
100
80
40
60
Perc
enta
ge (%
)
20
0S1 S2 S3 S4 S5 S6
(d)
90
100
80
70
60Perc
enta
ge (%
)
50
40S1 S2 S3 S4 S5 S6
(e)
100
80
60
40
Perc
enta
ge (%
)
20
0S1 S2 S3 S4 S5 S6
1min3min5min
(f)
Figure 10: The classification accuracy of cross-subject mental workload by different classifiers at different time scales: (a) support vectormachine, (b) K-nearest neighbors, (c) gentle boost, (d) linear discriminant analysis, (e) naïve Bayes, and (f) decision tree.
10 Wireless Communications and Mobile Computing

generalizable experimental results. In addition, online identifi-cation of human-robot interaction mental workload will bestudied. Furthermore, different machine learning algorithmswill be combined to choose the best recognition result ofmental workload by voting.
Data Availability
Because the physiological signal of the human body involvespersonal privacy, so the experimental data will not be madepublic temporarily.
Conflicts of Interest
The authors declare that there is no conflict of interestregarding the publication of this paper.
Acknowledgments
This research was funded by the National Natural ScienceFoundation of China (Grant number U20A20201), the Liao-ning Province Doctoral Scientific Research Foundation(Grant number 2020-BS-025), the Liaoning RevitalizationTalents Program (Grant number XLYC1807018), and theNational Key Research and Development Program of China(Grant number 2016YFE0206200).
References
[1] A. Costes, F. Danieau, F. Argelaguet, P. Guillotel, andA. Lecuyer, “Towards haptic images: a survey ontouchscreen-based surface haptics,” IEEE Transactions onHaptics, vol. 13, no. 3, pp. 530–541, 2020.
[2] S. Shao, T.Wang, Y. Su, C. Yao, C. Song, and Z. Ju, “Multi-IMFsample entropy features with machine learning for surface tex-ture recognition based on robot tactile perception,” Interna-tional Journal of Humanoid Robotics, vol. 18, no. 2,p. 2150005, 2021.
[3] W. Zheng, H. Liu, and F. Sun, “Lifelong visual-tactile cross-modal learning for robotic material perception,” IEEE Trans-actions on Neural Networks and Learning Systems, vol. 32,no. 3, pp. 1192–1203, 2021.
[4] P. Falco, S. Lu, C. Natale, S. Pirozzi, and D. Lee, “A transferlearning approach to cross-modal object recognition: fromvisual observation to robotic haptic exploration,” IEEE Trans-actions on Robotics, vol. 35, no. 4, pp. 987–998, 2019.
[5] Jongdae Jung, Seung-Mok Lee, and Hyun Myung, “Indoormobile robot localization and mapping based on ambientmagnetic fields and aiding radio sources,” IEEE Transactionson Instrumentation and Measurement, vol. 64, no. 7,pp. 1922–1934, 2015.
[6] W. Yuan, Z. Li, and C.-Y. Su, “Multisensor-based navigationand control of a mobile service robot,” IEEE Transactions onSystems, Man, and Cybernetics: Systems, vol. 51, no. 4,pp. 2624–2634, 2021.
[7] E. Debie, R. Fernandez Rojas, J. Fidock et al., “Multimodalfusion for objective assessment of cognitive workload: areview,” IEEE Transactions on Cybernetics, vol. 51, no. 3,pp. 1542–1555, 2021.
[8] Z. Pei, H. Wang, A. Bezerianos, and J. Li, “EEG-based multi-class workload identification using feature fusion and selec-
tion,” IEEE Transactions on Instrumentation andMeasurement, vol. 70, article 4001108, 2021.
[9] S. Delliaux, A. Delaforge, J.-C. Deharo, and G. Chaumet,“Mental workload alters heart rate variability, lowering non-linear dynamics,” Frontiers in physiology, vol. 10, article 565,2019.
[10] K. Tsunoda, A. Chiba, K. Yoshida, T. Watanabe, andO. Mizuno, “Predicting changes in cognitive performanceusing heart rate variability,” IEICE Transactions on Informa-tion and Systems, vol. E100.D, no. 10, pp. 2411–2419, 2017.
[11] S. Shao, T. Wang, C. Song, X. Chen, E. Cui, and H. Zhao,“Obstructive sleep apnea recognition based on multi-bandsspectral entropy analysis of short-time heart rate variability,”Entropy, vol. 21, no. 8, p. 812, 2019.
[12] S.-L. Shao, T.Wang, C.-H. Song, E. N. Cui, H. Zhao, and C. Yao,“A novel method of heart rate variability measurement,” ActaPhysica Sinica, vol. 68, no. 17, article 178701, 2019.
[13] A. Tiwari, I. Albuquerque, M. Parent et al., “Multi-scale heartbeat entropy measures for mental workload assessment ofambulant users,” Entropy, vol. 21, no. 8, p. 783, 2019.
[14] A. Tiwari, S. Narayanan, and T. H. Falk, “Stress and anxietymeasurement “In-the-Wild” using quality-aware multi-scaleHRV features,” in Proceedings of the Annual InternationalConference of the IEEE Engineering in Medicine and BiologySociety, pp. 7056–7059, Montreal, Canada, 2019.
[15] P. Gilfriche, L. M. Arsac, Y. Daviaux et al., “Highly sensitiveindex of cardiac autonomic control based on time-varying res-piration derived from ECG,” American Journal of Physiology-Regulatory, Integrative and Comparative Physiology, vol. 315,no. 3, pp. R469–R478, 2018.
[16] M. Malik, J. T. Bigger, A. J. Camm et al., “Heart rate variability:Standards of measurement, physiological interpretation, andclinical use,” European Heart Journal, vol. 17, no. 3, pp. 354–381, 1996.
[17] V. Villani, M. Righi, L. Sabattini, and C. Secchi, “Wearabledevices for the assessment of cognitive effort for human–robotinteraction,” IEEE Sensors Journal, vol. 20, no. 21, pp. 13047–13056, 2020.
[18] S. Shao, T. Wang, Y. Wang, Y. Su, C. Song, and C. Yao,“Research of HRV as a measure of mental workload in humanand dual-arm robot interaction,” Electronics, vol. 9, no. 12,article 2174, 2020.
[19] V. Villani, B. Capelli, C. Secchi, C. Fantuzzi, and L. Sabattini,“Humans interacting with multi-robot systems: a naturalaffect-based approach,” Autonomous Robots, vol. 44,pp. 601–616, 2020.
[20] R. Castaldo, L. Montesinos, P. Melillo, C. James, andL. Pecchia, “Ultra-short term HRV features as surrogates ofshort term HRV: a case study on mental stress detection in reallife,” BMC Medical Informatics and Decision Making, vol. 19,no. 1, article 12, 2019.
[21] J. Pan and W. J. Tompkins, “A real-time QRS detection algo-rithm,” IEEE Transactions on Biomedical Engineering, vol. -BME-32, no. 3, pp. 230–236, 1985.
[22] L. Chen, X. Zhang, and C. Song, “An automatic screeningapproach for obstructive sleep apnea diagnosis based onsingle-lead electrocardiogram,” IEEE Transactions on Auto-mation Science and Engineering, vol. 12, no. 1, pp. 106–115,2015.
[23] F. Zhu, J. Yang, S. Xu, C. Gao, N. Ye, and T. Yin, “Incorporat-ing neighbors’ distribution knowledge into support vector
11Wireless Communications and Mobile Computing

machines,” Soft Computing, vol. 21, no. 21, pp. 6407–6420,2017.
[24] F. Zhu, Y. Ning, X. C. Chen, Y. Zhao, and Y. Gang, “Onremoving potential redundant constraints for SVOR learning,”Applied Soft Computing, vol. 102, no. 4, article 106941, 2021.
[25] Y. Li, W. Pan, K. Li, Q. Jiang, and G. Liu, “Sliding trend fuzzyapproximate entropy as a novel descriptor of heart rate vari-ability in obstructive sleep apnea,” IEEE Journal of Biomedicaland Health Informatics, vol. 23, no. 1, pp. 175–183, 2019.
[26] K. Machetanz, L. Berelidze, R. Guggenberger, andA. Gharabaghi, “Brain-heart interaction during transcutane-ous auricular vagus nerve stimulation,” Frontiers in Neurosci-ence, vol. 15, article 632697, 2021.
[27] G. D. Clifford and L. Tarassenko, “Quantifying errors in spec-tral estimates of HRV due to beat replacement and resam-pling,” IEEE Transactions on Biomedical Engineering, vol. 52,no. 4, pp. 630–638, 2005.
[28] W. Zheng, S. Chen, Z. Fu, F. Zhu, H. Yan, and J. Yang, “Featureselection boosted by unselected features,” IEEE Transactionson Neural Networks and Learning Systems, pp. 1–13, 2021.
12 Wireless Communications and Mobile Computing