Comparing Different Configurations for Rotary Transformer ...
1
Comparing Water Performance by Two Different Surface Irrigation Methods
Francisco Mojarro Dávila1, Carlos Francisco Bautista Capetillo1, José Gumaro Ortiz Valdez1 and Ernesto Vázquez Fernández2
1Universidad Autónoma de Zacatecas 2Universidad Nacional Autónoma de México
México
1. Introduction
The crop optimal growth demands adequate water supply. When rainfall is not sufficient in
a region to satisfy crop water requirements it has to be complemented with irrigation water
in order to replace evapotranspiration losses occurred in a specific period so that quality and
yield are not affected (Brouwer et al., 1988; Ojeda et al., 2007). A field receives irrigation
water using pressurized systems or by water flows from its available energy, basically. This
last case is called surface irrigation and includes a large variety of irrigation systems sharing
a common characteristic: water is applied on the soil surface and is distributed along the
field by gravity. This fact marks the importance to analyze infiltration process and water
retention capacity of soils as the most important physical properties involved in water
dynamics around roots zone (Playán, 2008; Walker & Skogerboe, 1987).
Surface irrigation continues being the most used irrigation system in the world even thought
its efficiency range between 30% and 50% (Rosano-Méndez et al., 2001; Sió et al., 2002);
nevertheless Hsiao et al. (2007) discussed some works (Erie & Dedrick, 1979; Howell 2003)
which conclude that application efficiency can be higher than 80% if surface irrigation is
practiced well under the right conditions. The low irrigation efficiency combined with the
decreasing in water availability for irrigation due to severe and extended droughts as well as
the great competition that has been occurring among all users (such as residential users,
industries, and farmers) that started twenty-five years ago, it raises the opportunity so that
surface irrigation agriculture makes a more rational water use because it shows two important
advantages regarding to pressurized irrigation: 1) field does not requires equipment, and 2)
pumping is not necessary at field level; so equipment and pumping energy costs are lower.
Nevertheless to provide volumes to be used by crops with minor water losses can bring
environmental implications (less runoff, less volume for aquifer recharge; for example).
During water movement into soil profile hydrological processes of different nature appear;
for this reason surface irrigation is divided in phases to separate them. In each one there are
peculiarities that allow obtaining some characteristic times (Walker, 1989; Khatri, 2007): a)
Starting time, water begins to flows in the field –border, basin or furrow. b) Time of advance,
water completely covers the basin or border, or water reaches the downstream end of a
furrow. c) Time of cut off, water stops flowing into the irrigated field. d) Time of depletion,
www.intechopen.com

Irrigation – Water Management, Pollution and Alternative Strategies
2
when a part of the basin, border or furrow becomes uncovered by water once the water has
fully infiltrated or has moved to lower areas of the field. e) Time of recession, water can no
longer be seen over the field. The difference between time of advance and time of recession
is known as opportunity time. During this period occurs the infiltration process. Surface
irrigation phases (Figure 1) are defined as: a) advance phase, water flows in non-uniform and
spatially varied regime, the discharge decrease downstream for the infiltration process in
porous media consequently. In this phase water is covering border, basin or furrow. b)
Filling up phase, once water reaches the end of the field, the discharge remains during
sufficient time to apply the water table required by crop. In this phase the water is filling up
the soil pores. c) Depletion phase, water is cut off causing a gradual diminution in water
depth; this phase ends when the water has been totally infiltrated in a portion of the field. d)
Recession phase, water uncovers the field surface completely as a wave moving at the same
direction of flow.
Advance Filling Depletion Recession
Startingtime
Time ofadvance
Time ofcut off
Time ofdepletion
Time ofrecession
Fig. 1. Irrigation times and phases (adapted from Playán, 2008)
Border, basin and furrows are the most common methods in surface irrigation. Four
different variants to transport water into the fields using furrows are being developed: a)
continuous-flow irrigation (CFI), b) intermittent (pulses) irrigation (II), c) cut-back irrigation
(CBI), and d) increased-discharge irrigation (IDI) (Vázquez, 2001). In Mexico 5.4 million
hectares are irrigated by some surface irrigation method. Farmers that apply water in
furrows as transportation media are using CFI principally so water discharge never is
cutting along all longitude of furrow although it arrives at the end of it. Its mean efficiency
is around 59% (Alexander-Frezieres, 2001); even though it is low some improvements on the
irrigation settings are already taken place; efficiency in farming fields continues been low.
Montiel-Gutiérrez (2003) conducted field measurements in an irrigation zone; whose results
showed an application mean efficiency of 57% and 39%. For that reason, it is necessary to
prove alternative methods to that of continuous flow irrigation. According to Vazquez et al.
(2003) an option is IDI. This option required a previous improvement in techniques of field
irrigation, by means of installation of gated pipe, which already were used in several
regions of the country. The IDI consists in applying water initially as the total volume
flowing through the gated pipes to all furrows in a battery; then, once the water front
approaches one quarter of the furrow length, half of the gates are closed, this causes the
duplication of the inflow in the furrows with the gates open. Once irrigation is completed in
the first half of the battery, the total flow of piping is applied to the other half of the battery
which is temporarily interrupted; the previously opened gates are to be closed and opened
the ones that were closed, to achieve an increment in flow. The irrigation of that furrows
(second half) has a discontinuous irrigation, with the double volume compared to that the
initial flow (Ortiz, 2005). On summary, this technique is the opposite to that of “cut-back”
proposed by Humphreys (1978).
www.intechopen.com

Comparing Water Performance by Two Different Surface Irrigation Methods
3
The purposes of this work was to comparing water performance by CFI and IDI methods in
blocked-end furrows for maize crop in two seasons (2004-2005) during spring-summer as
well as analyze furrow irrigation variables (inflow discharge, water table, and time of
irrigation cutoff) and their relation to performance irrigation indicators of water use:
efficiency, irrigation efficiency, water productivity, and crop production. Herein, a computer
program was used to simulate the furrow irrigation process (Vázquez, 2001).
2. Study zone description
2.1 General characteristics of the study area
The experimental plot was located at the experimental station of the National Research
Institute for Forestry, Agriculture and Livestock (INIFAP), situated to the northwest of the
city of Zacatecas, Mexico with geographic coordinates: North Latitude 22° 54' 22.3" and
Longitude West 102° 39' 50.3" and an average elevation above sea level to 2200 m (Figure 2).
Fig. 2. Location study area at INIFAP experimental station
The climate is characterized as semi-arid, where average annual evaporation exceeds in 2,000
mm to average annual precipitation, with summer rains and very scarcity in the rest of the
year, average annual precipitation is 419.8 mm, average annual reference evapotranspiration
(ETo) is around 1,490 mm and average temperature range between 12 to 18 °C. Within the
experimental station there is an automated weather station from which data was collected for
this study. Monthly rainfall, temperature and reference evapotranspiration recorded for corn
grow cycle in the two years of study is presented in Figure 3.
www.intechopen.com

Irrigation – Water Management, Pollution and Alternative Strategies
4
10.00
12.00
14.00
16.00
18.00
20.00
0
20
40
60
80
100
120
140
160
180
200
May June July August September
Month
Ra
infa
ll/
ET
o(m
m)
Tem
per
atu
re
(°C
)
J2004
Rainfall
Temperature
ETo
2005
Rainfall
Temperature
ETo
Fig. 3. Monthly rainfall, ETo and temperature recorded at the INIFAP experimental station
2.2 Soil physics characterization
From the experimental plot soil samples were taken at six random points to the depth of 0-60 cm and in the laboratory the following soil characteristics were identified (Table 1). The inflow and outflow method (USDA, 1956) were used to determine soil basic infiltration rate. Three 90 degree triangle flumes were previously calibrated in the laboratory. The flumes were installed on a furrow at distances of 50, 100 and 150 from inlet point and water levels were recorded every 5 minutes. The inflow into the furrow (0.75 m spacing) was delivered from the field by using a gated pipe and the inflow was maintained constant during all time. The soil basic infiltration rate was 1.1 cm h-1.
2.3 Maize crop
In the two years of study the hybrid H-311 was selected which is a hybrid semi-late with white grain. Its height is 2.70 m, the stems are strong and time to maturity is 150 days. Economic yield is from 6,500 to 8,500 kg of dry grain per hectare (Luna & Gutierrez, 1997). Planting took place on April 10 of 2004 and in 2005 on 15 April, with a density of 65,000 plants per hectare and the fertilization was N=200 kg ha-1, P=80 kg ha-1, and K=00 kg ha-1 in both years. To estimate crop evapotranspiration, historical average weather data of temperature and precipitation from the INIFAP weather station were used. These values were used to run PIREZ software (Integrated Irrigation Project for the State of Zacatecas) (Mojarro et al., 2004); resulting a crop evapotranspiration around 50.8 cm for corn season (sowing to harvest).
www.intechopen.com

Comparing Water Performance by Two Different Surface Irrigation Methods
5
Sample 1 2 3 4 5 6
Texture
Silty loam
Silty loam
Silt
Silty loam
Silty loam
Silty Loam
Sand (%) 30.44 36.24 36.24 37.88 41.88 43.88
Silt (%) 34.00 32.00 38.00 32.00 30.00 28.00
Clay (%) 35.00 31.76 25.76 30.12 28.12 38.12
Hydrodynamic constants:
Field Capacity 23.9% Permanent Wilting Point 12.8% Bulk Density 1.27 g/cm3
Table 1. Texture and hydrodynamic constants of soil samples of experimental field
3. Methodology
3.1 Experimental plot Topographic survey of the experimental plot was performed with a total station Sokkia brand SET Model 610. On the plot a grid of 10 x 10 m was formed to get the lay of the land and after that land plane was carried out by an electronic equipment of leveling laserplane. The dimensions of the experimental plot were 20 m wide by 198 m long, with a land surface slope of 0.25%. In this plot the experimental work was performed for evaluation of irrigation method with increased-discharge (IDI) in comparison with the traditional irrigation method in which the inflow was constant (CFI). There were 12 blocked-end furrows where the IDI was established and 12 blocked-end furrows where the CFI was established.
3.2 Field experiment management A gated pipe of 6 inches in diameter was used for water application. This irrigation system is very common among irrigation farmers in the study area, Figure 4 shows the characteristics of the experimental plot and for the irrigation management was as follows:
Water flowdirection
Contour lines
Fig. 4. Topographical diagram for experimental plot
www.intechopen.com

Irrigation – Water Management, Pollution and Alternative Strategies
6
1) there was an auxiliary plot with 12 furrows where the inflow for each furrow was
calibrated and fixed; 2) once this happened, the gates in the section 1 (Figure 4) were opened
until irrigation time was achieved; 3) 12 gates of section 2 and section 2A were opened; 4)
when the water front reached 50 m, six gates were closed (Section 2A) and then for the
other six gates, the inflow per furrow was increased two fold, until the irrigation time was
achieved; 5) once this happened, the gates in section 2A were opened until the irrigation
time was completed. The consumption time in the operation of 12 furrows for IDI was less
than three minutes for each irrigation event.
3.3 Simulation models Mathematical simulation models are a useful tool in the design and / or correction of
inflow, the slope and the roughness of surface irrigation. However these models require
knowledge of the function of the soil infiltration, but its determination in the field is not easy
due to the spatial variability of soils (Rendón, et al. 1995). Moreover the advance of water
on the furrow surface is dominated by the forces of gravity and is expressed by Saint-
Venant equations, which represent the total hydrodynamic phenomenon (Vázquez, 1996).
The simulation model in blocked-end furrow proposed by Vazquez (RICIG) (2001) has the
attributes to simulate CFI (traditional) and IDI. The RICIG uses the Green and Ampt
equation considering the initial soil moisture and uses the wetted perimeter to calculate the
infiltration; in addition to considering the water flow on a furrow surface is transitional and
gradually varied because the water infiltrates into the soil as it moves toward the end of the
furrow. RICIG model includes equations that play this type of flow which are the continuity
and momentum, both known as the Saint-Venant equations. Vázquez (1996) comments that
these equations have as unknowns the inflow and the depth of water in different sections,
and it is assumed that the channel or furrow has a prismatic form which does not change all
along the furrow, and the soil is homogeneous this means that the hydraulic conductivity is
constant along the furrow.
3.4 Variables measured in the field 3.4.1 Soil moisture content
One of the most important effects on the irrigated agriculture is to fully satisfy the soil
moisture in the root zone of the crop. The soil water content should be measured
periodically to determine when to apply the next irrigation and how much water should be
applied. With these purposes in 2004 and 2005, soil moisture content was measured once a
week and before and after the irrigation event, to the depths of 0-15, 15-30 and 30-45 cm. The
gravimetric method was used; samples were taken with the Vehimeyer auger recommended
by the EPA (2000). To calculate the soil moisture content was used the equation 1 and
equation 2 was used to calculate water table.
W -Wws dsW % = 100i Wds
(1)
Where: Wi is the moisture content (%);Wws is the weight of wet soil (g); and Wds is the
weight of dry soil (g).
Water table applied for each irrigation was estimated according to equation (2)
www.intechopen.com

Comparing Water Performance by Two Different Surface Irrigation Methods
7
γiZ =P WC -WC /100m r fc iγ (2)
Where: Zm is the water table to implement (cm); Pr is the root depth (cm); γi is the
volumetric weight of the soil (kg m-3); γ is the specific weight of water (1000 kg m-3); WCfc
is moisture content at Field Capacity (%) of dry weight; WCi is the residual moisture content
before irrigation (%) of dry weight.
3.4.2 Cross-sectional surface flow area
One of the input variables in the RICIG model is the cross-sectional geometry of furrows, this
was done only in the year 2004 with a profilometer (Picture 1) designed by Ortiz (2005). A total
of 120 cross-sectional geometry of furrow were made during the course of the experiment
mainly before sowing irrigation, after agricultural practices and after each event of irrigation.
Picture 1. Furrow profilometer for determining cross-sectional area
3.4.3 Advance of water over furrow surface
In 2004, the advance of the water was determined at each irrigation event. Along the
furrows 10 marking points were placed (20 m apart) to measure the time it takes water flow
to reach those points (Picture 2).
3.5 Application efficiency and irrigation water use efficiency and productivity
The irrigation efficiency is clearly influenced by two factors: 1) the amount of water used by
the crop for water applied in irrigation, and 2) distributions in the field of applied water.
www.intechopen.com

Irrigation – Water Management, Pollution and Alternative Strategies
8
These factors affect the cost efficiency of irrigation, irrigation design, and most important, in
some cases, productivity of crops. Efficiency in water use has been the most widely used
parameter to describe the efficiency of irrigation in terms of crop yield (Howell, 2002). For
the years 2004 and 2005 the following indicators of irrigation efficiency and water
productivity were used. Application efficiency (Ea) was evaluated considering the
methodology proposed by Rendón et al. (2007). Ea is defined as the amount of water that is
available to crops in relation to that applied to the plot and was calculated as:
ia
a
VE =
V (3)
Where Va is the total volume applied to the plot (m3); Vi is the irrigated volume usable by
the crops (m3). The applied volume (Va) is defined as:
a e rV =Q t (4)
Qe is the inflow applied to the plot (m3 s-1) and tr is the time of irrigation (s). The volume is
still available (Ve) to plants can be defined as:
e a rV =V -V (5)
Vr is the infiltrated volume beyond the root zone (m3). To estimate Vr it is necessary to determine the soil moisture in the soil profile along the furrow before and after each irrigation event.
Picture 2. View of the points where the time water flow was recorded
www.intechopen.com

Comparing Water Performance by Two Different Surface Irrigation Methods
9
The distribution uniformity is defined as a measure of the uniformity with which irrigation
water is distributed to different areas in a field. The distribution uniformity of the infiltrate
depth was estimated by the distribution coefficient of Burt et al. (1997) using equation.
minZDU=
Z (6)
Where Zmin is the minimum infiltration depth in a quarter of the total length of the furrow
(cm) and Z is the average of the infiltrated depth (cm). Water use efficiency (WUE) is the
ratio between economic yield (Ye) and crop evapotranspiration (ETC) (Howell, 2002) for the
study region ETC = 50.8 cm, as fallows.
e
c
YWUE=
ET (7)
The irrigation water use efficiency (IWUE) is the ratio of the difference of Ye and crop
economic yield under rain-fed conditions (Yt) (no irrigation is applied and Yt= 550 kg ha-1)
and the applied water table (Zm) (Howell, 2002) using the next equation.
e t
m
Y -YIWUE=
Z (8)
Water productivity (WP) is the quotient obtained by dividing economic yield of the crop
(Ye) and the volume applied (Va), as fallows.
e
a
YWP=
V (9)
4. Results
In order to define the inflow discharge (Q) to be applied in the design of CFI and IDI
irrigation methods, nine irrigation tests were conducted in which discharge varied from 0.9
to 2.2 l s-1. Figure 5 shows water advance curves and as expected they are different for each
Q used (similar results were found in several works, for example Bassett et al. 1983). In
addition they show that the lower Q has a lower water speed therefore water had more
opportunity time to infiltrate, and this creates a larger water table at the beginning of the
furrow and a poor distribution of soil moisture along the furrow (data not presented).
Also another test was conducted with data from Table 1, Q=2.2 l s-1, and using the CFI
proceeded to the simulation with the RICIG model and realization under the field condition
of the irrigation in blocked-end furrow. Figure 6 illustrates that the water advance curves
obtained with the simulator and with the observed data from the field are very similar. So it
follows that the mathematical model (RICIG) represents the physical phenomenon of
surface irrigation in blocked-end furrows.
4.1 Applied irrigations
The data obtained from tests carried out, furrow geometry, and data from Table 2 pre-sowing irrigation was simulated and applied in the field.
www.intechopen.com

Irrigation – Water Management, Pollution and Alternative Strategies
10
0
50
100
150
200
250
0 20 40 60 80 100 120 140 160 180 200
1 2.23
2 2.02
3 2.04
4 1.42
5 1.38
6 1.54
7 0.95
8 0.90
9 0.91
Distance (m)
Tim
e (m
in)
Furrownumber
Q (l s-1)
Fig. 5. Family water advance curves
0
10
20
30
40
50
60
70
0 20 40 60 80 100 120 140 160 180 200
Simulated
Observed
Distance (m)
Tim
e (m
in)
Fig. 6. Water advance curves. Pre-sowing irrigation for CFI (2004)
www.intechopen.com

Comparing Water Performance by Two Different Surface Irrigation Methods
11
Variable CFI IDI
Q (l s-1) 2.4 2.4
tr (min) 65 31
Zm (cm) 6.0 6.0
Table 2. Data required for simulating and applying the pre-sowing irrigation (2004)
Figures 7 and 8 present simulated and observed water advance curves for continuous-flow irrigation and increased-discharge irrigation respectively. In those figures it shows that in the case of CFI curves exhibit a rising exponential of the traditional way but instead the points for the IDI approximately fit a straight line, which explains a considerable reduction
0
10
20
30
40
50
60
0 20 40 60 80 100 120 140 160 180 200
Observed
Simulated
Distance (m)
Tim
e (m
in)
CFI
Fig. 7. Water advance curves for CFI. Observed values were monitored in 2004
0
10
20
30
40
50
60
0 20 40 60 80 100 120 140 160 180 200
Observed
Simulated
Distance (m)
Tim
e (m
in)
IDI
Fig. 8. Water advance curves for IDI. Observed values were monitored in 2004
www.intechopen.com

Irrigation – Water Management, Pollution and Alternative Strategies
12
in time of the advance phase. Figure 9 shows the inflow hydrograph for the first 6 furrows
irrigated with increased inflow and without interrupting water supply in the furrow (see
Figure 4, section 2). Figure 10 shows the inflow hydrograph for the other six furrows
irrigated in which the inflow was interrupted (Figure 4, section 2A) when the advancing
front of the water reaches a quarter of the length of the furrow with a break time (tint) at 7.3
min, subsequently returned to this part when the time of irrigation (tr= 28.4 min) was
completed in the first 6 furrows.
0
2.42
4.84
0 7.3 14.6 21.9 29.2 36.5 43.8 51.1
Time (min)
Infl
ow
(l
s-1)
Fig. 9. Inflow hydrograph for IDI. First 6 irrigated furrows in the furrows battery
0
2.42
4.84
0 7.3 14.6 21.9 29.2
Time (min)
Infl
ow
(l s
-1)
Fig. 10. Inflow hydrograph for IDI. Second 6 irrigated furrows in the furrows battery
According to the hydrographs (Figures 9 & 10) and the information on Table 3, it shows that
for the IDI the irrigation time was 49.2 min and for CFI it was 68.9 min. Table 3 presents the
results of simulations and field observations for CFI and IDI. According to this information,
the irrigation time was about 20 min higher in CFI than in the IDI. The distribution
uniformity (DU) was 24% higher in the IDI than the CFI. The application efficiency (Ea) was
higher 16.6% in the IDI. The applied volume (Va) was higher in CFI than in the IDI.
www.intechopen.com

Comparing Water Performance by Two Different Surface Irrigation Methods
13
Irrigation Method
Q (l s-1)
tr
(min) Zm
(cm) Va
(m3) DU (%)
Ea
(%)
CFI (simulated) 2.4 72.0 6.1 8.95 66.6
CFI (observed) 2.4 68.9 6.8 10.1 69.0
IDI (simulated) 2.4 34.0 6.1 7.15 83.2
IDI (observed) 2.4 49.2 4.1 6.15 90.3
Table 3. Simulated and observed data in the second irrigation (2004)
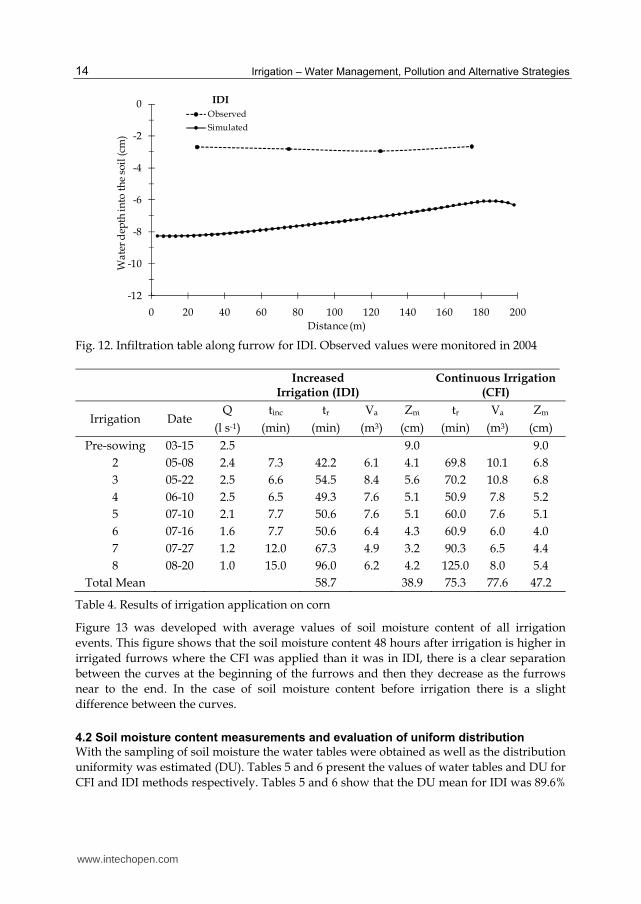
The profiles of simulated and observed water infiltration table found for the pre-sowing irrigation are presented in figures 11 and 12. There are some differences between observed and simulated values for both methods; these differences can be explained in part because the observed field values were performed 48 hours after irrigation, however minor differences are observed in IDI. If the observed values for both methods are compared, it is showed that the water infiltration table in CFI is greater at the beginning of furrows than in the IDI and it basically is due to the lower speed of water in the furrows with CFI method, and the uniformity of distribution in IDI is better than the CFI, which allows a better crop water use. Table 4 displays that the mean of irrigation time (tr) for CFI is 75.3 minutes while for the IDI is only 58.7 min., which represents a time saving of 16.6 minutes per irrigation applied. The total applied water tables (Zm) are 47.2 and 38.9 cm. respectively, thus saving water in the IDI is 830 m3 per hectare. The efficiency of water used is tied to the ability to achieve and understand the integrated system water-soil-plant-atmosphere, which is the basis for making decisions on when and how much water to be applied. In the experimental plot during the course of the experiment the soil moisture content was measured once a week and before irrigation, and 48 hours thereafter.
-12
-10
-8
-6
-4
-2
0
0 20 40 60 80 100 120 140 160 180 200
Observed
Simulated
Distance (m)
Wa
ter
dep
th in
to t
he
soil
(cm
)
CFI
Fig. 11. Infiltration table along furrow for CFI. Observed values were monitored in 2004
www.intechopen.com
Irrigation – Water Management, Pollution and Alternative Strategies
14
-12
-10
-8
-6
-4
-2
0
0 20 40 60 80 100 120 140 160 180 200
Observed
Simulated
Distance (m)
Wa
ter
dep
th in
to t
he
soil
(cm
)
IDI
Fig. 12. Infiltration table along furrow for IDI. Observed values were monitored in 2004
Increased
Irrigation (IDI) Continuous Irrigation
(CFI)
Irrigation Date Q tinc tr Va Zm tr Va Zm
(l s-1) (min) (min) (m3) (cm) (min) (m3) (cm)
Pre-sowing 03-15 2.5 9.0 9.0
2 05-08 2.4 7.3 42.2 6.1 4.1 69.8 10.1 6.8
3 05-22 2.5 6.6 54.5 8.4 5.6 70.2 10.8 6.8
4 06-10 2.5 6.5 49.3 7.6 5.1 50.9 7.8 5.2
5 07-10 2.1 7.7 50.6 7.6 5.1 60.0 7.6 5.1
6 07-16 1.6 7.7 50.6 6.4 4.3 60.9 6.0 4.0
7 07-27 1.2 12.0 67.3 4.9 3.2 90.3 6.5 4.4
8 08-20 1.0 15.0 96.0 6.2 4.2 125.0 8.0 5.4
Total Mean 58.7 38.9 75.3 77.6 47.2
Table 4. Results of irrigation application on corn
Figure 13 was developed with average values of soil moisture content of all irrigation
events. This figure shows that the soil moisture content 48 hours after irrigation is higher in
irrigated furrows where the CFI was applied than it was in IDI, there is a clear separation
between the curves at the beginning of the furrows and then they decrease as the furrows
near to the end. In the case of soil moisture content before irrigation there is a slight
difference between the curves.
4.2 Soil moisture content measurements and evaluation of uniform distribution
With the sampling of soil moisture the water tables were obtained as well as the distribution
uniformity was estimated (DU). Tables 5 and 6 present the values of water tables and DU for
CFI and IDI methods respectively. Tables 5 and 6 show that the DU mean for IDI was 89.6%
www.intechopen.com

Comparing Water Performance by Two Different Surface Irrigation Methods
15
and 75.6% for CFI this means that the uniformity of distribution of Zm were higher in IDI
14% more than in the CFI. Therefore there is an evidence to encourage the IDI irrigation
method. The application efficiency was estimated for CFI and IDI; the values were 66.6%
and 83.2% respectively. According to these and previous results, there is strong evidence
that IDI irrigation method is more efficient than the CFI irrigation method (Tables 3, 5 and 6
and Figures 11, 12, and 13).
13
14
15
16
17
18
19
20
21
22
25 75 125 175
Soil moisture content before irrigation IDI 2004
Soil moisture content after irrigation IDI 2004
Soil moisture content before irrigation CFI 2004
Soil moisturecontent after irrigation CFI 2004
Soil moisture content before irrigation IDI 2005
Soil moisture content after irrigation IDI 2005
Distance (m)
So
il m
ois
ture
co
nte
nt
(%)
Fig. 13. Average soil moisture content before and after irrigation events (2004 & 2005)
Irrigation number
Distance (m) 25 75 125 175
Water table (cm) Mean Minimum
DU (%)
1 6.5 4.4 3.8 3.5 4.6 3.5 77.3
2 6.0 4.9 4.2 3.4 4.6 3.4 73.8
3 6.2 5.6 3.5 3.5 4.7 3.5 74.8
4 5.1 2.8 2.7 2.7 3.5 2.7 77.5
5 3.9 3.2 2.9 2.9 3.3 2.9 86.8
6 4.2 3.8 4.0 4.0 3.6 2.3 63.6
DU (mean) 75.6
Table 5. Water table at different distances of the furrows and DU for CFI method
www.intechopen.com

Irrigation – Water Management, Pollution and Alternative Strategies
16
Irrigation number
Distance (m)25 75 125 175
Water table (cm) Mean Minimum
DU (%)
1 3.4 3.0 3.0 2.9 3.0 2.9 94.4
2 4.1 4.0 3.4 4.1 3.9 3.4 87.2
3 4.4 3.6 3.3 3.1 3.6 3.1 85.4
4 3.7 3.2 2.8 2.9 3.2 2.8 90.0
5 2.9 3.1 3.1 2.7 3.0 2.7 92.4
6 3.7 3.2 3.1 2.8 3.2 2.8 88.4
DU (mean) 89.6
Table 6. Water table at different distances of the furrows and DU for IDI method
4.3 Water productivity, irrigation efficiency, and water use
The harvest took place on November 11 in 2004 and 2005 on November 5. Thirty two points were set sampling for IDI and others for CFI, where the harvested area per sampling point was 5.2 m2. Table 7 shows the found economic yields (Yt) for different irrigation methods and years. To determine the average water productivity performance the economic yield was divided between the volume of water applied and for the CFI water productivity was 1.83 kg m-3 (2004), while for the IDI in the year 2004 was 2.34 kg m-3 and in the year 2005 of 1.93 kg m-3 (Table 7), these differences between years are explained by the environmental conditions that were observed, recorded rainfall during the growing season was higher in 2004 with more 325 mm than 2005 and on the other side, the pan evaporation observed during 2005 was 315.05 mm more than in 2004 for the same period. Grain yield of maize was acceptable because it exceeded the state average (4.04 T ha-1). From the above evidences, water productivity with the IDI (2004 and 2005) is 1.28 and 0.13 times the CFI (2004) and 2.54 and 2.1 higher than that reported by Chavez (2003). In relation to the WUE, and IWUE, those values were higher in IDI than in the CFI (Table 7). In addition to, it is clear that the IWUE, in general varies from year to year and with the use of better technology, such as in the work of Chavez (2003) where the design of irrigation was not carried out.
IDI
(2004)CFI
(2004)IDI
(2005)CFI
(Chávez, 2003)
Crop Corn Corn Corn Corn
Land leveling Yes Yes Yes Yes
Irrigation design Yes Yes Yes No
Dose of Fertilizer 200-80-00 200-80-00 200-80-00 235-60-00
Irrigation events 8 8 11 8
Va (m3 ha-1) 3,892.5 4,720.0 5,980.0 6,511.0
Yt (kg ha-1) 9,119.0 8,641.0 11,585.0 6,000.0
WP (kg m-3) 2.34 1.83 1.93 0.92
WUE 179.5 170.0 228.0 128.1
IWUE 2.20 1.71 1.84 0.83
Table 7. Indicators of irrigation water efficiency
www.intechopen.com

Comparing Water Performance by Two Different Surface Irrigation Methods
17
5. Conclusions
In the IDI method the phase of water advance is reduced due to the inflow discharge was
increased and therefore the uniformity of distribution of the furrows was increased, being
reflected in the reduced irrigation time, and water table and increased crop production due
to better distribution uniformity of the water table. The WP average in the IDI (2004 and
2005) is 2.13 kg m-3, while the CFI is 1.83 kg m-3, which represents 25% more productivity.
The efficiency of water distribution in the root zone of the crop during the growing season
for two years of study in the IDI was higher by 15.6% than in CFI which means that the crop
had better conditions of soil moisture for a higher value of WP. The use of irrigation method
IDI compared with CFI offers clear advantages for maize production, since WUE by the crop
is improved by an average of 27%, the IWUE is increased by 16%, and the irrigation time is
reduced by 23 min per irrigation. Therefore there is an evidence to encourage the IDI
irrigation method. Water use efficiency, irrigation water use efficiency, and distribution
uniformity are the performance irrigation parameters that seem to be correlated with furrow
irrigation variables (water table, inflow discharge, volume applied and time of irrigation) it
was observed by Holzapfel et al., (2010). They are also the parameters that thus could have
a relationship between crop productivity and production and the irrigation variables.
Therefore, IDI irrigation method is recommended to be used for establish good irrigation
practices. The future research should be aimed at determining the optimal inflow discharge
on the IDI, for different characteristics of blocked-end furrow such as length, slope and
roughness.
6. Notation
The following symbols are using in this chapter
CBI = cut-back irrigation
CFI = continuous-flow irrigation
DU = distribution uniformity
Ea = application efficiency
ETc = crop evapotranspiration
ETo = reference evapotranspiration
IDI = increased-discharge irrigation
II = Intermittent irrigation
IWUE = irrigation water use efficiency
Pr = root depth
Q = inflow discharge
tinc = interrupted time
tr = irrigation time
Va = applied volume
Ve = volume still available
Vi = volume usable by the crops
Vr = infiltrated volume
WCfc = field capacity
Wds = weight of soil dry
Wi = soil moisture content
www.intechopen.com

Irrigation – Water Management, Pollution and Alternative Strategies
18
WP = water productivity
WUE = water use efficiency Wws = weight of soil wet Ye = economic yield Yt = economic yield under rain-fed conditions Z = average of the infiltrated depth Zm = water table Zmin = minimum infiltration depth in a quarter of the total length of the furrow γ = specific weight of water γi volumetric weight of the soil
7. Acknowledgement
The authors are in complete gratitude to Jose Gumaro Ortiz Valdez for using the results of his master's thesis for the enforcement of this chapter.
8. References
Alexander-Frezieres, J. (2001). Conservación de la Infraestructura Hidroagrícola en las
Unidades de Riego en México, XI Congreso Nacional de Irrigación, Guanajuato,
México
Bassett, L. D.; Frangmeier, D. D.; & Strelkoff, T. (1983). Hydraulics of Surface Irrigation,
pp 449-498. In: Design and Operation of Farm Irrigation Systems, Edited by Jensen,
ASAE
Brouwer, C.; Prins, K.; Kay, M. & Heibloem, M. (1988). Irrigation Water Management:
Irrigation Methods, Training Manual No. 5, Food and Agriculture Organization of
the United Nations, Available from www.fao.org/docrep/S8684E/S8684E00.htm
(June 2011)
Burt, C.; Clemens, A. J.; Strelkoff, T. S.; Solomon, K. H.; Bliesner, R. D.; Hardy, L.A.; Howell,
T.A. & Eseinhauer, D. E. (1997). Irrigation Performance Measures: Efficiency and
Uniformity, Journal of Irrigation and Drainage Engineering, Vol. 123 (6), pp. 423-
442 ASCE
EPA (2000). Environmental Response Team, In: Standard Operating Procedures, Soil
Samples, Available from http://yosemite.epa.gov/sab/sabproduct.nsf/
Holzapfel, E. A.; Leiva, C.; Mariño, M. A.; Paredes, J.; Arumí, J. L. & Billib, M. (2010). Furrow
Irrigation Management and Design Criteria Using Efficiency Parameters and
Simulation Models, Chilean Journal of Agricultural Research, Vol. 70, Num. 2, pp. 287-
296
Howell, A. T. (2002). Irrigation Efficiency, pp. 736-741, Marcel Dekker Inc. 270, Madison
Avenue. New York, USA
Hsiao, T. C.; Steduto, P. & Fereres, E. (2007). A systematic and quantitative approach to
improve water use efficiency in agriculture, Irrigation Science, Vol. 25, pp. 209-231,
DOI 10.1007/s00271-007-0063-2
Humpherys, A. S. (1978). Improving Farm Irrigation Systems by Automation. Proceedings of
International Commitment on Irrigation and Drainage, 10th Cong., pp. 3590-3598,
Athens, Greece
www.intechopen.com

Comparing Water Performance by Two Different Surface Irrigation Methods
19
Khatri, K. L. (2007). Toward Real-Time Control of Surface Irrigation, Doctoral Dissertation,
University of Southern Queensland, Toowoomba, Queensland, Australia
Luna, F. M. & Gutiérrez, S. R. (1997). Informe Técnico, INIFAP, Zacatecas.
Mojarro, D. F.; González, T. J.; Gutiérrez, N. J. A.; Toledo, B. A. & Araiza, E. J. A. (2004).
Software PIREZ (Proyecto Integral de Riego para el Estado de Zacatecas), Universidad
Autónoma de Zacatecas, Mexico
Montiel-Gutiérrez, M. A. (2003). Estudio sobre la Eficiencia de Aplicación en el Distrito de
Riego 038 “Río Mayo”, Sonora, XII Congreso Nacional de Irrigación, pp. 27-38,
Zacatecas, Mexico
Ojeda, B. W.; Hernández, B. L. & Sánchez, C. I. (2007). Requerimientos de Riego de los
Cultivos, In: Manual para Diseño de Zonas de Riego Pequeñas, pp. 1-15, ISBN 978-968-
9513-04-9, Comisión Nacional del Agua & Instituto Mexicano de Tecnología del
Agua, México
Ortiz, V. J. G. (2005). Evaluación en Campo del Método de Riego con Incremento de Gasto, Master
Degree Dissertation, Universidad Autónoma de Zacateca, Mexico
Playán, E. (2008). Design, Operation, Maintenance and Performance Evaluation of Surface
Irrigation Methods, Land and Water Resources Management: Irrigated Agriculture,
Istituto Agronomico Mediterraneo-CIHEAM, Italy
Rendón, P. L.; Fuentes, R. C. & Magaña, S. G. (1995). Diseño Simplificado del Riego por
Gravedad, VI Congreso Nacional de Irrigación, pp. 385-391, Chapingo, México
Rendón, P. L.; Fuentes, R. C. & Magaña, S. G. (2007). Diseño del Riego por Gravedad, In:
Manual para Diseño de Zonas de Riego Pequeñas, p. 75-86, ISBN 978-968-9513-04-9,
Comisión Nacional del Agua & Instituto Mexicano de Tecnología del Agua,
México
Rosano-Méndez, L.; Rendón, P. L.; Pacheco, H. P.; Etchevers, B. J. D.; Chávez, M. J. &
Vaquera, H. H. (2001). Calibración de un Modelo Hidrológico Aplicado en el Riego
Tecnificado por Gravedad, Agrociencia Vol. 35, pp. 577-588, ISSN 1405-3195
Sió, J.; Gázquez, A.; Perpinyà, M.; Peña J. C. & Virgili J.M. (2002). El uso eficiente del agua en
el campo en Catalunya. El PACREG, un software para mejorar la gestión del agua
del riego, El Agua y el Clima, Eds. J.A. Guijarro, M. Grimalt, M. Laita y S. Alonso,
III Congreso de la Asociación Española de Climatología, Serie A, Num. 3, pp. 567-576.
Palma de Mallorca, Spain
USDA (1956). Methods for Evaluating Irrigation Systems. Agriculture Handbook No.82, Soil
Conservation Service, USA
Vázquez, F. E. (2001). Diseño del Riego con Incremento de Gasto en Surcos Cerrados,
Ingeniería del Agua, Vol. 8, No. 3, pp. 339- 349, ISSN 1134-2196
Vázquez, F. E.; López, T. P.; Morales, S. E. & Chagoya, A. B. (2003). Primera Evaluación en
Campo del Riego con Incremento de Gasto, XII Congreso Nacional de Irrigación, pp.
39-48, Zacatecas, México
Vázquez, F.E. (1996). Formulación de un Criterio para Incrementar la Eficiencia de Riego por
Surcos, Incluyendo el Método de Corte Posterior, Doctoral Dissertation, DEPFI,
UNAM.
Walker, W. R. & Skogerboe, G. V. (1987). Surface Irrigation Theory and Practice, Prentice-Hall,
ISBN 0-13-877929-5, Englewood Cliffs, NJ, USA
www.intechopen.com

Irrigation – Water Management, Pollution and Alternative Strategies
20
Walker, W. R. (1989). Guidelines for Designing and Evaluating Surface Irrigation Systems, ISBN
92-5-102879-6 Irrigation and Drainage Paper 45, Food and Agriculture Organization
of the United Nations, www.fao.org/docrep/T0231E/t0231e00.htm#Contents
(June 2011)
www.intechopen.com

Irrigation - Water Management, Pollution and Alternative StrategiesEdited by Dr Iker Garcia-Garizabal
ISBN 978-953-51-0421-6Hard cover, 234 pagesPublisher InTechPublished online 28, March, 2012Published in print edition March, 2012
InTech EuropeUniversity Campus STeP Ri Slavka Krautzeka 83/A 51000 Rijeka, Croatia Phone: +385 (51) 770 447 Fax: +385 (51) 686 166www.intechopen.com
InTech ChinaUnit 405, Office Block, Hotel Equatorial Shanghai No.65, Yan An Road (West), Shanghai, 200040, China
Phone: +86-21-62489820 Fax: +86-21-62489821
Irrigated agriculture is the most significant user of fresh water in the world and, due to the large area occupied,is one of the major pollution sources for the water resources. This book comprises 12 chapters that coverdifferent issues and problematics of irrigated agriculture: from water use in different irrigated systems topollution generated by irrigated agriculture. Moreover, the book also includes chapters that deal with newpossibilities of improving irrigation techniques through the reuse of drainage water and wastewater, helping toreduce freshwater extractions. A wide range of issues is herein presented, related to the evaluation of irrigatedagriculture impacts and management practices to reduce these impacts on the environment.
How to referenceIn order to correctly reference this scholarly work, feel free to copy and paste the following:
Francisco Mojarro Dávila, Carlos Francisco Bautista Capetillo, José Gumaro Ortiz Valdez and ErnestoVázquez Fernández (2012). Comparing Water Performance by Two Different Surface Irrigation Methods,Irrigation - Water Management, Pollution and Alternative Strategies, Dr Iker Garcia-Garizabal (Ed.), ISBN: 978-953-51-0421-6, InTech, Available from: http://www.intechopen.com/books/irrigation-water-management-pollution-and-alternative-strategies/comparing-water-performance-by-two-different-surface-irrigation-methods

© 2012 The Author(s). Licensee IntechOpen. This is an open access articledistributed under the terms of the Creative Commons Attribution 3.0License, which permits unrestricted use, distribution, and reproduction inany medium, provided the original work is properly cited.