Comparing the use of Social Networking and Traditional...
6
Comparing the use of Social Networking and Traditional Media Channels for Promoting Citizen Science Christine Robson 1,2,3 [email protected] Marti A. Hearst 1 [email protected] Chris Kau 3 [email protected] Jeff Pierce 3,4 [email protected] 1 University of California, Berkeley Berkeley, CA 94720 USA 2 Google Research 1600 Amphitheater Pkwy Mountain View CA 94043 3 IBM Research - Almaden 650 Harry Road, San Jose, CA 95124 USA 4 Samsung UX Innovations 3000 Orchard Parkway, San Jose, CA 95134 USA ABSTRACT This paper examines how social networks can be used to recruit and promote a crowdsourced citizen science project and compares this recruiting method to the use of tradition- al media channels including press releases, news stories, and participation campaigns. The target studied is Creek Watch, a citizen science project that allows anyone with an iPhone to submit photos and observations of their local wa- terways to authorities who use the data for water manage- ment, environmental programs, and cleanup events. The results compare promotional campaigns using a traditional press release with news pickups, a participation campaign through local organizations, and a social networking cam- paign through Facebook and Twitter. Results also include the trial of a feature that allows users to post automatically to Facebook or Twitter. Social networking is found to be a worthwhile avenue for increasing awareness of the project, increasing the conversion rate from browsers to partici- pants, but that targeting existing communities with a partic- ipation campaign was a more successful means for increas- ing the amount of data collected by volunteers. Author Keywords Citizen Science, Crowdsourcing, Social Networking ACM Classification Keywords H.5.3 Group and Organization Interfaces. General Terms Human Factors; Design; Measurement INTRODUCTION Social networking presents opportunities for collaborative responses to community concerns. Advertisers exploit the networking power of Facebook to raise awareness about products, issues, and opportunities. Facebook Pages 1 are an increasingly popular way to voice support for issues or problems of concern. In parallel with the growth of social networking opportunities, a new data collection movement has emerged. Participatory sensing is used by activists to support data collection where participants use mobile de- vices and web services to collect actionable data on prob- lems of concern to their communities (e.g. air pollution and trash data) [13]. The growth of mobile data collection is partly due to the increasing instrumentation of mobile phones, providing the means to easily collect data, and the opportunity to integrate data collection into daily activities. With such a multitude of technologies to empower users, project managers are often ill equipped to choose the best technology or deployment plan. This is particularly the case for citizen science projects, in which volunteers collaborate to collect data or perform analysis on a project with scien- tific goals. Examples of citizen science range from volun- teers in the field recording observations about wildlife and the environment, to those who donate their time or compu- ting cycles for protein folding algorithms or processing signals from space. Citizen science projects typically oper- ate on limited resources with a small budget and time con- strained staff members frequently doubling as both admin- istrators and as scientists who conduct experiment design and data analysis. Often, a decision to try a new method of recruiting or educating users comes at the expense of time to analyze data or take action on findings. Knowing what avenues to invest time and effort on are critical for the suc- cess of a project [3]. Recently, there has been a trend in citizen science projects towards the use of social networking tools to promote pro- jects and encourage community, but it is unclear how suc- cessful such tools are for citizen science projects. While several prominent projects have established presences on Facebook and Twitter (e.g., Cornell’s eBird 2 , and Berke- ley’s SETI@Home 3 ), the success of social networking as a means for raising project awareness, recruiting participants, and encouraging participation has not been well- explored [3]. In this paper, we report our experiences using social net- working tools to promote and recruit users for a citizen sci- ence project, Creek Watch. Creek Watch was developed in 2 http://www.ebird.org 3 http://setiathome.berkeley.edu Permission to make digital or hard copies of all or part of this work for personal or classroom use is granted without fee provided that copies are not made or distributed for profit or commercial advantage and that copies bear this notice and the full citation on the first page. To copy otherwise, or republish, to post on servers or to redistribute to lists, requires prior specific permission and/or a fee. CSCW ’13, February 23–27, 2013, San Antonio, Texas, USA. Copyright 2013 ACM 978-1-4503-1331-5/13/02...$15.00
Transcript of Comparing the use of Social Networking and Traditional...
Comparing the use of Social Networking and Traditional Media Channels for Promoting Citizen Science
Christine Robson1,2,3 [email protected]
Marti A. Hearst1 [email protected]
Chris Kau3 [email protected]
Jeff Pierce3,4 [email protected]
1University of California,
Berkeley Berkeley, CA 94720 USA
2Google Research 1600 Amphitheater Pkwy Mountain View CA 94043
3IBM Research - Almaden 650 Harry Road,
San Jose, CA 95124 USA
4Samsung UX Innovations 3000 Orchard Parkway,
San Jose, CA 95134 USA
ABSTRACT This paper examines how social networks can be used to recruit and promote a crowdsourced citizen science project and compares this recruiting method to the use of tradition-al media channels including press releases, news stories, and participation campaigns. The target studied is Creek Watch, a citizen science project that allows anyone with an iPhone to submit photos and observations of their local wa-terways to authorities who use the data for water manage-ment, environmental programs, and cleanup events. The results compare promotional campaigns using a traditional press release with news pickups, a participation campaign through local organizations, and a social networking cam-paign through Facebook and Twitter. Results also include the trial of a feature that allows users to post automatically to Facebook or Twitter. Social networking is found to be a worthwhile avenue for increasing awareness of the project, increasing the conversion rate from browsers to partici-pants, but that targeting existing communities with a partic-ipation campaign was a more successful means for increas-ing the amount of data collected by volunteers.
Author Keywords Citizen Science, Crowdsourcing, Social Networking
ACM Classification Keywords H.5.3 Group and Organization Interfaces.
General Terms Human Factors; Design; Measurement
INTRODUCTION Social networking presents opportunities for collaborative responses to community concerns. Advertisers exploit the networking power of Facebook to raise awareness about products, issues, and opportunities. Facebook Pages1 are an increasingly popular way to voice support for issues or problems of concern. In parallel with the growth of social networking opportunities, a new data collection movement has emerged. Participatory sensing is used by activists to
1 http://www.facebook.com/pages
support data collection where participants use mobile de-vices and web services to collect actionable data on prob-lems of concern to their communities (e.g. air pollution and trash data) [13]. The growth of mobile data collection is partly due to the increasing instrumentation of mobile phones, providing the means to easily collect data, and the opportunity to integrate data collection into daily activities. With such a multitude of technologies to empower users, project managers are often ill equipped to choose the best technology or deployment plan. This is particularly the case for citizen science projects, in which volunteers collaborate to collect data or perform analysis on a project with scien-tific goals. Examples of citizen science range from volun-teers in the field recording observations about wildlife and the environment, to those who donate their time or compu-ting cycles for protein folding algorithms or processing signals from space. Citizen science projects typically oper-ate on limited resources with a small budget and time con-strained staff members frequently doubling as both admin-istrators and as scientists who conduct experiment design and data analysis. Often, a decision to try a new method of recruiting or educating users comes at the expense of time to analyze data or take action on findings. Knowing what avenues to invest time and effort on are critical for the suc-cess of a project [3]. Recently, there has been a trend in citizen science projects towards the use of social networking tools to promote pro-jects and encourage community, but it is unclear how suc-cessful such tools are for citizen science projects. While several prominent projects have established presences on Facebook and Twitter (e.g., Cornell’s eBird2, and Berke-ley’s SETI@Home3), the success of social networking as a means for raising project awareness, recruiting participants, and encouraging participation has not been well-explored [3].
In this paper, we report our experiences using social net-working tools to promote and recruit users for a citizen sci-ence project, Creek Watch. Creek Watch was developed in
2http://www.ebird.org 3http://setiathome.berkeley.edu
Permission to make digital or hard copies of all or part of this work for personal or classroom use is granted without fee provided that copies are not made or distributed for profit or commercial advantage and that copies bear this notice and the full citation on the first page. To copy otherwise, or republish, to post on servers or to redistribute to lists, requires prior specific permission and/or a fee. CSCW ’13, February 23–27, 2013, San Antonio, Texas, USA. Copyright 2013 ACM 978-1-4503-1331-5/13/02...$15.00
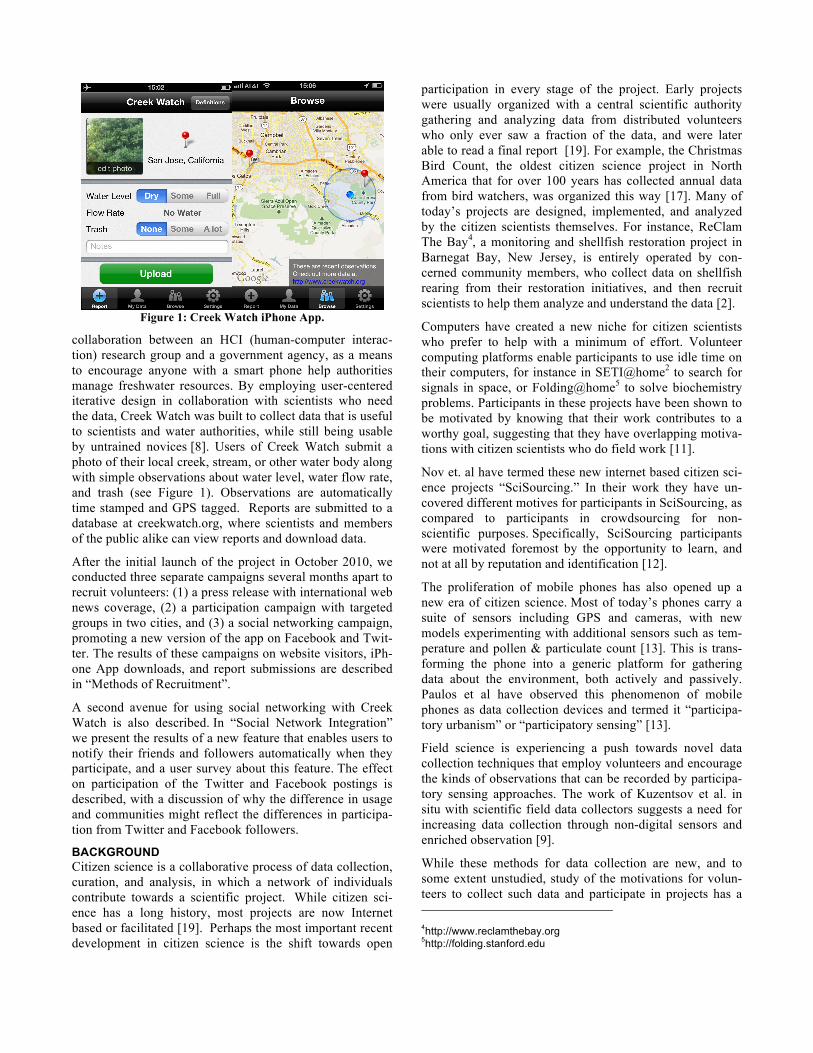
Figure 1: Creek Watch iPhone App.
collaboration between an HCI (human-computer interac-tion) research group and a government agency, as a means to encourage anyone with a smart phone help authorities manage freshwater resources. By employing user-centered iterative design in collaboration with scientists who need the data, Creek Watch was built to collect data that is useful to scientists and water authorities, while still being usable by untrained novices [8]. Users of Creek Watch submit a photo of their local creek, stream, or other water body along with simple observations about water level, water flow rate, and trash (see Figure 1). Observations are automatically time stamped and GPS tagged. Reports are submitted to a database at creekwatch.org, where scientists and members of the public alike can view reports and download data. After the initial launch of the project in October 2010, we conducted three separate campaigns several months apart to recruit volunteers: (1) a press release with international web news coverage, (2) a participation campaign with targeted groups in two cities, and (3) a social networking campaign, promoting a new version of the app on Facebook and Twit-ter. The results of these campaigns on website visitors, iPh-one App downloads, and report submissions are described in “Methods of Recruitment”. A second avenue for using social networking with Creek Watch is also described. In “Social Network Integration” we present the results of a new feature that enables users to notify their friends and followers automatically when they participate, and a user survey about this feature. The effect on participation of the Twitter and Facebook postings is described, with a discussion of why the difference in usage and communities might reflect the differences in participa-tion from Twitter and Facebook followers.
BACKGROUND Citizen science is a collaborative process of data collection, curation, and analysis, in which a network of individuals contribute towards a scientific project. While citizen sci-ence has a long history, most projects are now Internet based or facilitated [19]. Perhaps the most important recent development in citizen science is the shift towards open
participation in every stage of the project. Early projects were usually organized with a central scientific authority gathering and analyzing data from distributed volunteers who only ever saw a fraction of the data, and were later able to read a final report [19]. For example, the Christmas Bird Count, the oldest citizen science project in North America that for over 100 years has collected annual data from bird watchers, was organized this way [17]. Many of today’s projects are designed, implemented, and analyzed by the citizen scientists themselves. For instance, ReClam The Bay4, a monitoring and shellfish restoration project in Barnegat Bay, New Jersey, is entirely operated by con-cerned community members, who collect data on shellfish rearing from their restoration initiatives, and then recruit scientists to help them analyze and understand the data [2].
Computers have created a new niche for citizen scientists who prefer to help with a minimum of effort. Volunteer computing platforms enable participants to use idle time on their computers, for instance in SETI@home2 to search for signals in space, or Folding@home5 to solve biochemistry problems. Participants in these projects have been shown to be motivated by knowing that their work contributes to a worthy goal, suggesting that they have overlapping motiva-tions with citizen scientists who do field work [11].
Nov et. al have termed these new internet based citizen sci-ence projects “SciSourcing.” In their work they have un-covered different motives for participants in SciSourcing, as compared to participants in crowdsourcing for non-scientific purposes. Specifically, SciSourcing participants were motivated foremost by the opportunity to learn, and not at all by reputation and identification [12].
The proliferation of mobile phones has also opened up a new era of citizen science. Most of today’s phones carry a suite of sensors including GPS and cameras, with new models experimenting with additional sensors such as tem-perature and pollen & particulate count [13]. This is trans-forming the phone into a generic platform for gathering data about the environment, both actively and passively. Paulos et al have observed this phenomenon of mobile phones as data collection devices and termed it “participa-tory urbanism” or “participatory sensing” [13].
Field science is experiencing a push towards novel data collection techniques that employ volunteers and encourage the kinds of observations that can be recorded by participa-tory sensing approaches. The work of Kuzentsov et al. in situ with scientific field data collectors suggests a need for increasing data collection through non-digital sensors and enriched observation [9].
While these methods for data collection are new, and to some extent unstudied, study of the motivations for volun-teers to collect such data and participate in projects has a 4http://www.reclamthebay.org 5http://folding.stanford.edu
long history. Community building is a key motivator for participation in citizen science [15], as contrasted with oth-er volunteer activities for which acknowledgement and re-wards are more common motivators (e.g. open source soft-ware development [5]). Indeed, the clearest difference be-tween the motives of citizen scientists and those of profes-sional scientists is just this: citizen scientists are much more motivated by collectivism [15]. This is consistent with es-tablished patterns of volunteerism. In Wilson and Musick's work on understanding volunteering, which involved a comprehensive survey of 3,617 individuals, they found that people are more likely to volunteer if they are more social (i.e., report more frequent conversations and meetings in their daily lives) [20]. Younger volunteers are also signifi-cantly more likely than older volunteers to be motivated by social or collaborative activities, such as meetings or other opportunities to interact with others [16]. These findings suggest that targeting younger, more social individuals may increase participation in citizen science projects. One of the best places to reach younger, more social individuals is on social networking sites such as Facebook [4].
METHODS OF RECRUITMENT The question of how to best to recruit users to a citizen sci-ence project remains open. In an NSF sponsored workshop bringing together citizen science practitioners and Comput-er Science researchers [3], we explored several recruitment strategies used by practitioners. It became clear that there was no consensus or understanding of which recruitment methods work best, nor how to evaluate such methods. For some projects, data collection is the priority, and all efforts are focused on increasing the number of data reports so that more data is available for scientific research (e.g. eBird
[18]). Other projects are more focused on awareness and education, focusing on engaging a large number of people about an issue (e.g. the World Water Monitoring Chal-lenge6) [3].
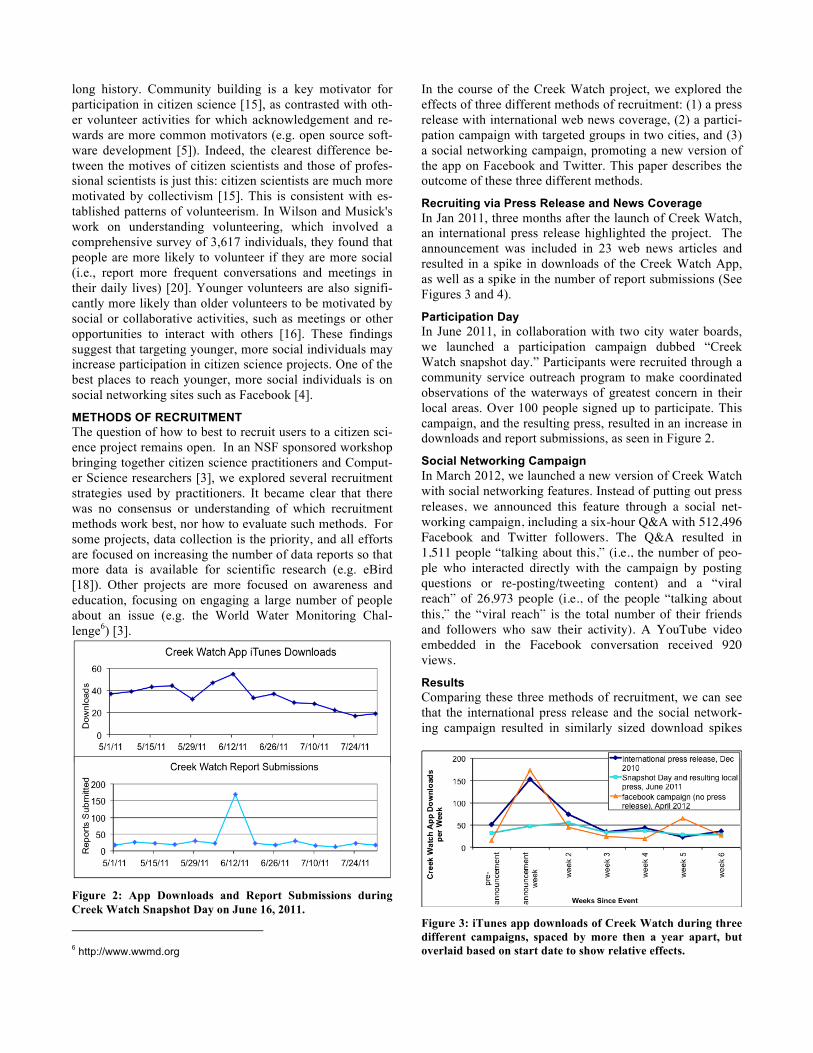
Figure 2: App Downloads and Report Submissions during Creek Watch Snapshot Day on June 16, 2011.
6 http://www.wwmd.org
In the course of the Creek Watch project, we explored the effects of three different methods of recruitment: (1) a press release with international web news coverage, (2) a partici-pation campaign with targeted groups in two cities, and (3) a social networking campaign, promoting a new version of the app on Facebook and Twitter. This paper describes the outcome of these three different methods.
Recruiting via Press Release and News Coverage In Jan 2011, three months after the launch of Creek Watch, an international press release highlighted the project. The announcement was included in 23 web news articles and resulted in a spike in downloads of the Creek Watch App, as well as a spike in the number of report submissions (See Figures 3 and 4).
Participation Day In June 2011, in collaboration with two city water boards, we launched a participation campaign dubbed “Creek Watch snapshot day.” Participants were recruited through a community service outreach program to make coordinated observations of the waterways of greatest concern in their local areas. Over 100 people signed up to participate. This campaign, and the resulting press, resulted in an increase in downloads and report submissions, as seen in Figure 2.
Social Networking Campaign In March 2012, we launched a new version of Creek Watch with social networking features. Instead of putting out press releases, we announced this feature through a social net-working campaign, including a six-hour Q&A with 512,496 Facebook and Twitter followers. The Q&A resulted in 1,511 people “talking about this,” (i.e., the number of peo-ple who interacted directly with the campaign by posting questions or re-posting/tweeting content) and a “viral reach” of 26,973 people (i.e., of the people “talking about this,” the “viral reach” is the total number of their friends and followers who saw their activity). A YouTube video embedded in the Facebook conversation received 920 views.
Results Comparing these three methods of recruitment, we can see that the international press release and the social network-ing campaign resulted in similarly sized download spikes
Figure 3: iTunes app downloads of Creek Watch during three different campaigns, spaced by more then a year apart, but overlaid based on start date to show relative effects.
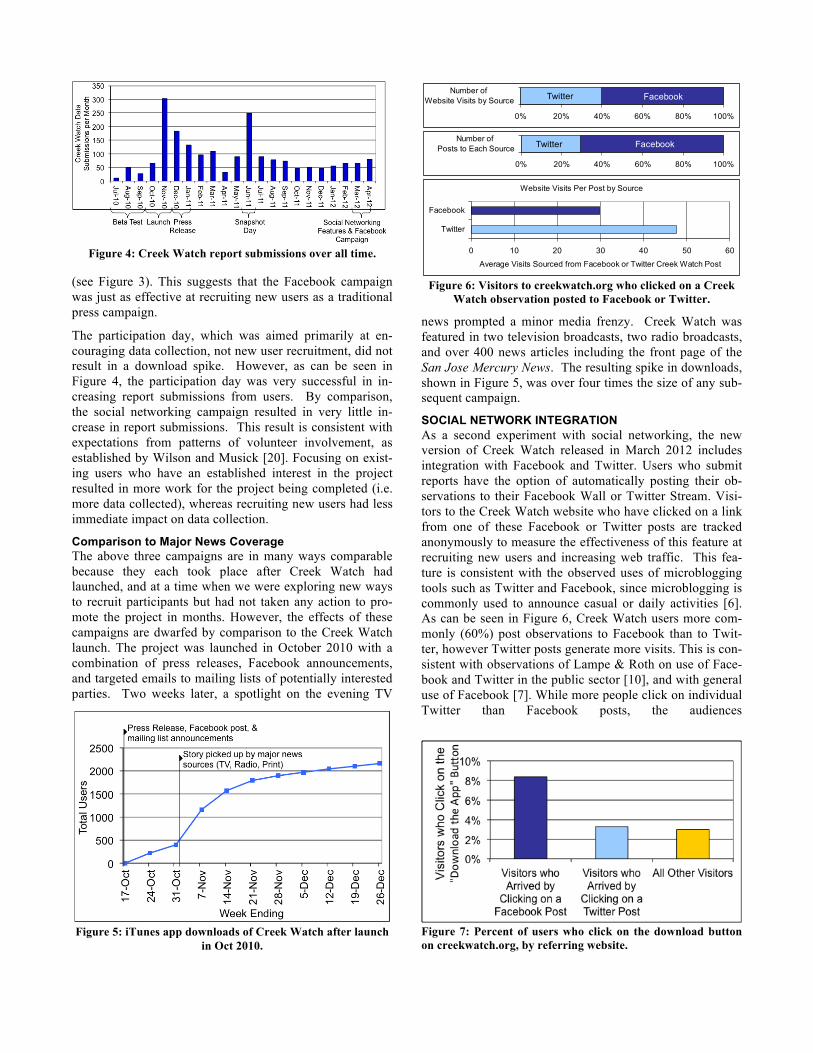
Figure 4: Creek Watch report submissions over all time.
(see Figure 3). This suggests that the Facebook campaign was just as effective at recruiting new users as a traditional press campaign.
The participation day, which was aimed primarily at en-couraging data collection, not new user recruitment, did not result in a download spike. However, as can be seen in Figure 4, the participation day was very successful in in-creasing report submissions from users. By comparison, the social networking campaign resulted in very little in-crease in report submissions. This result is consistent with expectations from patterns of volunteer involvement, as established by Wilson and Musick [20]. Focusing on exist-ing users who have an established interest in the project resulted in more work for the project being completed (i.e. more data collected), whereas recruiting new users had less immediate impact on data collection.
Comparison to Major News Coverage The above three campaigns are in many ways comparable because they each took place after Creek Watch had launched, and at a time when we were exploring new ways to recruit participants but had not taken any action to pro-mote the project in months. However, the effects of these campaigns are dwarfed by comparison to the Creek Watch launch. The project was launched in October 2010 with a combination of press releases, Facebook announcements, and targeted emails to mailing lists of potentially interested parties. Two weeks later, a spotlight on the evening TV
Figure 5: iTunes app downloads of Creek Watch after launch
in Oct 2010.
Figure 6: Visitors to creekwatch.org who clicked on a Creek Watch observation posted to Facebook or Twitter.
news prompted a minor media frenzy. Creek Watch was featured in two television broadcasts, two radio broadcasts, and over 400 news articles including the front page of the San Jose Mercury News. The resulting spike in downloads, shown in Figure 5, was over four times the size of any sub-sequent campaign.
SOCIAL NETWORK INTEGRATION As a second experiment with social networking, the new version of Creek Watch released in March 2012 includes integration with Facebook and Twitter. Users who submit reports have the option of automatically posting their ob-servations to their Facebook Wall or Twitter Stream. Visi-tors to the Creek Watch website who have clicked on a link from one of these Facebook or Twitter posts are tracked anonymously to measure the effectiveness of this feature at recruiting new users and increasing web traffic. This fea-ture is consistent with the observed uses of microblogging tools such as Twitter and Facebook, since microblogging is commonly used to announce casual or daily activities [6]. As can be seen in Figure 6, Creek Watch users more com-monly (60%) post observations to Facebook than to Twit-ter, however Twitter posts generate more visits. This is con-sistent with observations of Lampe & Roth on use of Face-book and Twitter in the public sector [10], and with general use of Facebook [7]. While more people click on individual Twitter than Facebook posts, the audiences
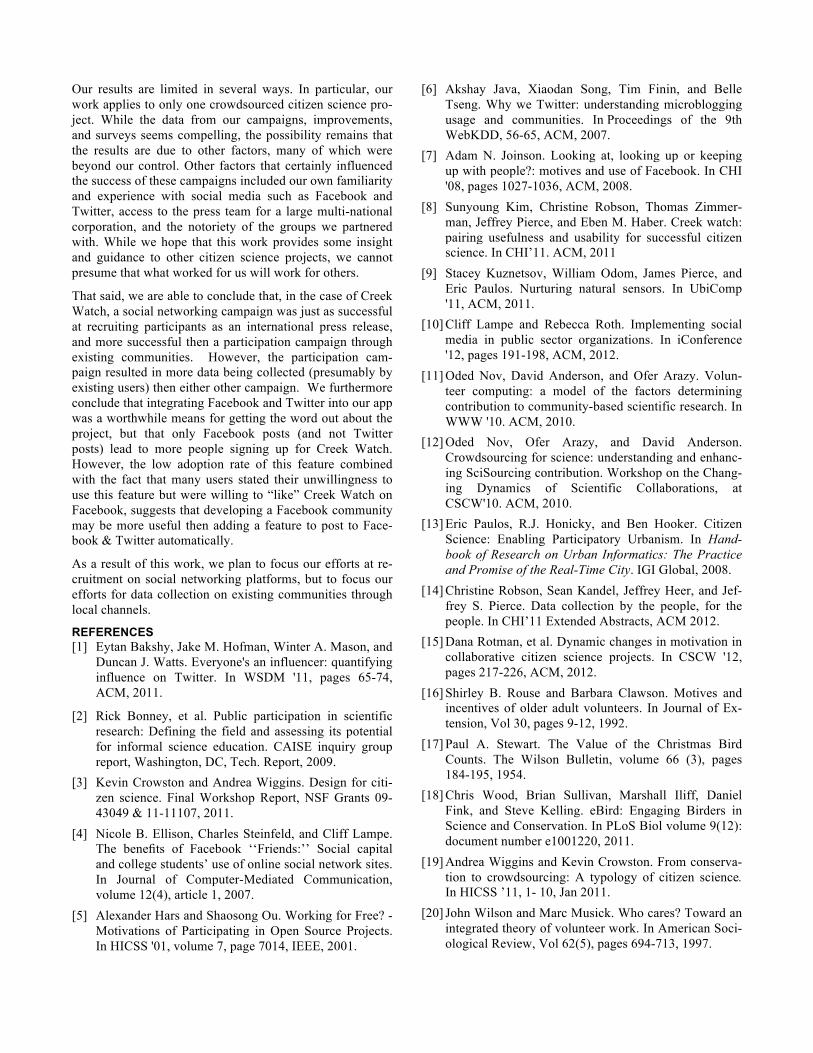
Figure 7: Percent of users who click on the download button on creekwatch.org, by referring website.
0% 20% 40% 60% 80% 100%
Number of Posts to Each Source Twitter Facebook
Website Visits Per Post by Source
0 10 20 30 40 50 60
Average Visits Sourced from Facebook or Twitter Creek Watch Post
0% 20% 40% 60% 80% 100%
Number of Website Visits by Source FacebookTwitter
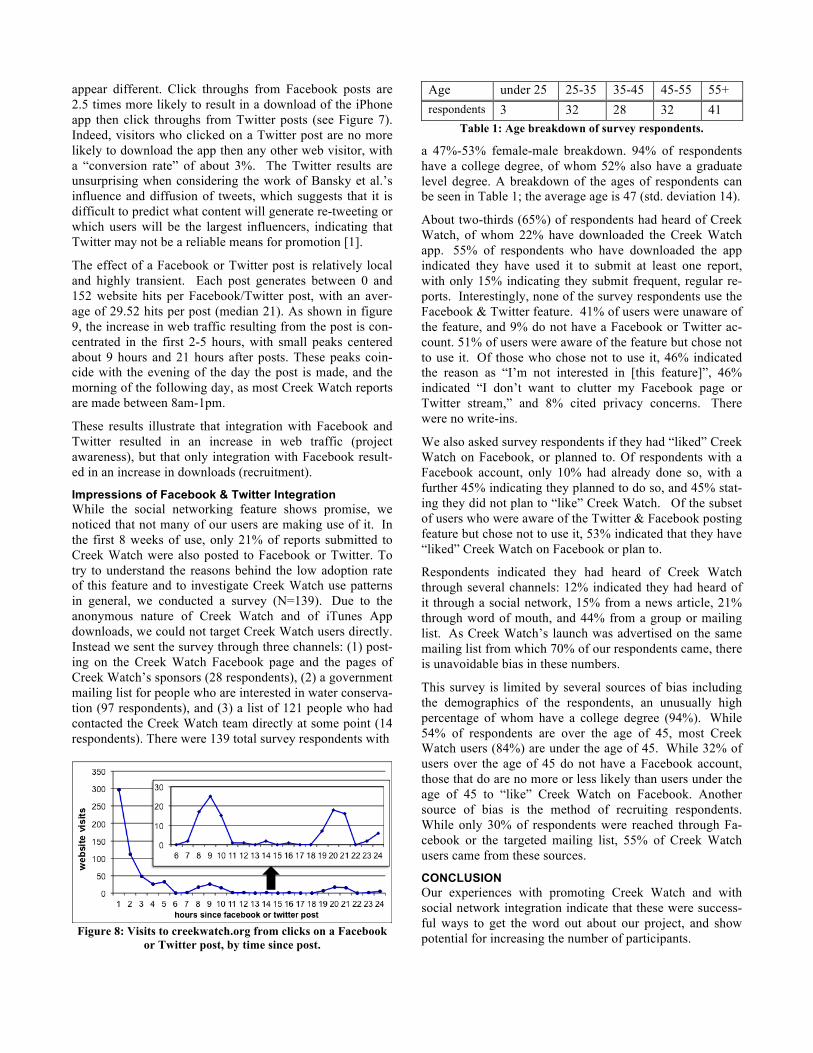
appear different. Click throughs from Facebook posts are 2.5 times more likely to result in a download of the iPhone app then click throughs from Twitter posts (see Figure 7). Indeed, visitors who clicked on a Twitter post are no more likely to download the app then any other web visitor, with a “conversion rate” of about 3%. The Twitter results are unsurprising when considering the work of Bansky et al.’s influence and diffusion of tweets, which suggests that it is difficult to predict what content will generate re-tweeting or which users will be the largest influencers, indicating that Twitter may not be a reliable means for promotion [1].
The effect of a Facebook or Twitter post is relatively local and highly transient. Each post generates between 0 and 152 website hits per Facebook/Twitter post, with an aver-age of 29.52 hits per post (median 21). As shown in figure 9, the increase in web traffic resulting from the post is con-centrated in the first 2-5 hours, with small peaks centered about 9 hours and 21 hours after posts. These peaks coin-cide with the evening of the day the post is made, and the morning of the following day, as most Creek Watch reports are made between 8am-1pm.
These results illustrate that integration with Facebook and Twitter resulted in an increase in web traffic (project awareness), but that only integration with Facebook result-ed in an increase in downloads (recruitment).
Impressions of Facebook & Twitter Integration While the social networking feature shows promise, we noticed that not many of our users are making use of it. In the first 8 weeks of use, only 21% of reports submitted to Creek Watch were also posted to Facebook or Twitter. To try to understand the reasons behind the low adoption rate of this feature and to investigate Creek Watch use patterns in general, we conducted a survey (N=139). Due to the anonymous nature of Creek Watch and of iTunes App downloads, we could not target Creek Watch users directly. Instead we sent the survey through three channels: (1) post-ing on the Creek Watch Facebook page and the pages of Creek Watch’s sponsors (28 respondents), (2) a government mailing list for people who are interested in water conserva-tion (97 respondents), and (3) a list of 121 people who had contacted the Creek Watch team directly at some point (14 respondents). There were 139 total survey respondents with
Figure 8: Visits to creekwatch.org from clicks on a Facebook or Twitter post, by time since post.
Age under 25 25-35 35-45 45-55 55+ respondents 3 32 28 32 41
Table 1: Age breakdown of survey respondents.
a 47%-53% female-male breakdown. 94% of respondents have a college degree, of whom 52% also have a graduate level degree. A breakdown of the ages of respondents can be seen in Table 1; the average age is 47 (std. deviation 14).
About two-thirds (65%) of respondents had heard of Creek Watch, of whom 22% have downloaded the Creek Watch app. 55% of respondents who have downloaded the app indicated they have used it to submit at least one report, with only 15% indicating they submit frequent, regular re-ports. Interestingly, none of the survey respondents use the Facebook & Twitter feature. 41% of users were unaware of the feature, and 9% do not have a Facebook or Twitter ac-count. 51% of users were aware of the feature but chose not to use it. Of those who chose not to use it, 46% indicated the reason as “I’m not interested in [this feature]”, 46% indicated “I don’t want to clutter my Facebook page or Twitter stream,” and 8% cited privacy concerns. There were no write-ins.
We also asked survey respondents if they had “liked” Creek Watch on Facebook, or planned to. Of respondents with a Facebook account, only 10% had already done so, with a further 45% indicating they planned to do so, and 45% stat-ing they did not plan to “like” Creek Watch. Of the subset of users who were aware of the Twitter & Facebook posting feature but chose not to use it, 53% indicated that they have “liked” Creek Watch on Facebook or plan to.
Respondents indicated they had heard of Creek Watch through several channels: 12% indicated they had heard of it through a social network, 15% from a news article, 21% through word of mouth, and 44% from a group or mailing list. As Creek Watch’s launch was advertised on the same mailing list from which 70% of our respondents came, there is unavoidable bias in these numbers.
This survey is limited by several sources of bias including the demographics of the respondents, an unusually high percentage of whom have a college degree (94%). While 54% of respondents are over the age of 45, most Creek Watch users (84%) are under the age of 45. While 32% of users over the age of 45 do not have a Facebook account, those that do are no more or less likely than users under the age of 45 to “like” Creek Watch on Facebook. Another source of bias is the method of recruiting respondents. While only 30% of respondents were reached through Fa-cebook or the targeted mailing list, 55% of Creek Watch users came from these sources.
CONCLUSION Our experiences with promoting Creek Watch and with social network integration indicate that these were success-ful ways to get the word out about our project, and show potential for increasing the number of participants.
Our results are limited in several ways. In particular, our work applies to only one crowdsourced citizen science pro-ject. While the data from our campaigns, improvements, and surveys seems compelling, the possibility remains that the results are due to other factors, many of which were beyond our control. Other factors that certainly influenced the success of these campaigns included our own familiarity and experience with social media such as Facebook and Twitter, access to the press team for a large multi-national corporation, and the notoriety of the groups we partnered with. While we hope that this work provides some insight and guidance to other citizen science projects, we cannot presume that what worked for us will work for others.
That said, we are able to conclude that, in the case of Creek Watch, a social networking campaign was just as successful at recruiting participants as an international press release, and more successful then a participation campaign through existing communities. However, the participation cam-paign resulted in more data being collected (presumably by existing users) then either other campaign. We furthermore conclude that integrating Facebook and Twitter into our app was a worthwhile means for getting the word out about the project, but that only Facebook posts (and not Twitter posts) lead to more people signing up for Creek Watch. However, the low adoption rate of this feature combined with the fact that many users stated their unwillingness to use this feature but were willing to “like” Creek Watch on Facebook, suggests that developing a Facebook community may be more useful then adding a feature to post to Face-book & Twitter automatically.
As a result of this work, we plan to focus our efforts at re-cruitment on social networking platforms, but to focus our efforts for data collection on existing communities through local channels.
REFERENCES [1] Eytan Bakshy, Jake M. Hofman, Winter A. Mason, and
Duncan J. Watts. Everyone's an influencer: quantifying influence on Twitter. In WSDM '11, pages 65-74, ACM, 2011.
[2] Rick Bonney, et al. Public participation in scientific research: Defining the field and assessing its potential for informal science education. CAISE inquiry group report, Washington, DC, Tech. Report, 2009.
[3] Kevin Crowston and Andrea Wiggins. Design for citi-zen science. Final Workshop Report, NSF Grants 09-43049 & 11-11107, 2011.
[4] Nicole B. Ellison, Charles Steinfeld, and Cliff Lampe. The benefits of Facebook ‘‘Friends:’’ Social capital and college students’ use of online social network sites. In Journal of Computer-Mediated Communication, volume 12(4), article 1, 2007.
[5] Alexander Hars and Shaosong Ou. Working for Free? - Motivations of Participating in Open Source Projects. In HICSS '01, volume 7, page 7014, IEEE, 2001.
[6] Akshay Java, Xiaodan Song, Tim Finin, and Belle Tseng. Why we Twitter: understanding microblogging usage and communities. In Proceedings of the 9th WebKDD, 56-65, ACM, 2007.
[7] Adam N. Joinson. Looking at, looking up or keeping up with people?: motives and use of Facebook. In CHI '08, pages 1027-1036, ACM, 2008.
[8] Sunyoung Kim, Christine Robson, Thomas Zimmer-man, Jeffrey Pierce, and Eben M. Haber. Creek watch: pairing usefulness and usability for successful citizen science. In CHI’11. ACM, 2011
[9] Stacey Kuznetsov, William Odom, James Pierce, and Eric Paulos. Nurturing natural sensors. In UbiComp '11, ACM, 2011.
[10] Cliff Lampe and Rebecca Roth. Implementing social media in public sector organizations. In iConference '12, pages 191-198, ACM, 2012.
[11] Oded Nov, David Anderson, and Ofer Arazy. Volun-teer computing: a model of the factors determining contribution to community-based scientific research. In WWW '10. ACM, 2010.
[12] Oded Nov, Ofer Arazy, and David Anderson. Crowdsourcing for science: understanding and enhanc-ing SciSourcing contribution. Workshop on the Chang-ing Dynamics of Scientific Collaborations, at CSCW'10. ACM, 2010.
[13] Eric Paulos, R.J. Honicky, and Ben Hooker. Citizen Science: Enabling Participatory Urbanism. In Hand-book of Research on Urban Informatics: The Practice and Promise of the Real-Time City. IGI Global, 2008.
[14] Christine Robson, Sean Kandel, Jeffrey Heer, and Jef-frey S. Pierce. Data collection by the people, for the people. In CHI’11 Extended Abstracts, ACM 2012.
[15] Dana Rotman, et al. Dynamic changes in motivation in collaborative citizen science projects. In CSCW '12, pages 217-226, ACM, 2012.
[16] Shirley B. Rouse and Barbara Clawson. Motives and incentives of older adult volunteers. In Journal of Ex-tension, Vol 30, pages 9-12, 1992.
[17] Paul A. Stewart. The Value of the Christmas Bird Counts. The Wilson Bulletin, volume 66 (3), pages 184-195, 1954.
[18] Chris Wood, Brian Sullivan, Marshall Iliff, Daniel Fink, and Steve Kelling. eBird: Engaging Birders in Science and Conservation. In PLoS Biol volume 9(12): document number e1001220, 2011.
[19] Andrea Wiggins and Kevin Crowston. From conserva-tion to crowdsourcing: A typology of citizen science. In HICSS ’11, 1- 10, Jan 2011.
[20] John Wilson and Marc Musick. Who cares? Toward an integrated theory of volunteer work. In American Soci-ological Review, Vol 62(5), pages 694-713, 1997.