Comparing the remuneration at international organisations ...
62
Comparing the remuneration at international organisations with that at national governments
Transcript of Comparing the remuneration at international organisations ...

Comparing the remuneration at international
organisations with that at national governments


Roetersstraat 29 - 1018 WB Amsterdam - T (+31) 20 525 1630 - F (+31) 020 525 1686 - www.seo.nl - [email protected]
ABN-AMRO IBAN: NL14ABNA0411744356 BIC: ABNANL2A - ING: IBAN: NL96INGB0004641100 BIC: INGBNL2A KvK Amsterdam 41197444 - BTW NL 003023965 B
Amsterdam, 20 October 2017
Commissioned by the Ministry of the Interior and Kingdom Relations of the Netherlands
Comparing the remuneration at international organisations with that at national governments
Siemen van der Werff Valentijn van Spijker
“The science of knowing” SEO Amsterdam Economics carries out independent applied economic research on behalf of national and international clients – both public institutions and private sector clients. Our research aims to make a major contribution to the decision-making processes of our clients. Originally founded by, and still affiliated with, the University of Amsterdam, SEO Amsterdam Economics is now an independent research group but retains a strong academic component. Operating on a non-profit basis, SEO continually invests in the intellectual capital of its staff by granting them time to pursue continuing education, publish in academic journals, and participate in academic networks and conferences. As a result, our staff is fully up to date on the latest economic theories and econometric techniques.
SEO report No. 2016-57 ISBN 978-90-6733-859-2
Copyright © 2017 SEO Amsterdam. All rights reserved. Data from this report may be used in articles, studies and syllabi, provided that the source is clearly and accurately mentioned. Data in this report may not be used for commercial purposes.

-5%
18%
-13%
38% 40%
52%
38%44%
0%
50%
100%
150%
1655
1820
1595
1767 17511679
1759 1767
A N I N T E R N A T I O N A L C O M P A R I S O N O F
CIVIL SERVANT REMUNERATION
Contractual work hoursTotal leave days
31 39 33 40 42 40 41 40
FTE work week (hours)
36 41 35 40 40 38 40 40
Total work hours (average year)
NL DE FR OECD CoE NATO EC UN
NL DE FR OECD CoE NATO EC UN
NL DE FR OECD CoE NATO EC UN
Net hourly income after taxes and benefitsCompared to the average at the three national governments (100%)
NL DE FR OECD CoE NATO EC UN
Annual tax contribution and benefits receivedAs percentage of annual gross wage
NL DE FR* OECD27%
1%20%
3%19%
0%0%
10%
-26% -17% -19% 10%CoE NATO EC UN
0%10%
4%10%
19%19%
24%4%
9% 6% -0% -21%
Tax contribution Benefits and allowances Net effect%
For comparable positions employees of international organisations receive on average higher remuneration than those working for national governments during their years of employment.
Net hourly income consist of annual net wage (gross wage after tax contribution and benefits) divided by the total amount of contractual work hours.
However, for a full remuneration comparison the total lifetime remuneration should be compared, that is, including any income the employees or their families receive after retirement. For this full comparison and methodology, please read the full report.
AssumptionsReference persons’ household situation
Func
tion
Age
Secretary
Supporting policy officer
Policy maker
Head of unit
30 40 58
Notes:
• All spouses of reference persons do not have an income.• All amounts have been corrected for costs of living in each city of
employment (Paris for France, CoE and the OECD, Berlin for Germany, the Hague for the Netherlands, Brussels for the EC and NATO and New York for the UN).
• The figures shown in these charts are based on averages of each reference person at each organisation in 2016.
• The figures shown in these charts exclude income such as prognosis and pension.
• The top right chart displays the average net hourly income of all 11 reference persons indexed to the average at the three national governments, across all organisations. It is calculated dividing each reference person’s net hourly remuneration in Belgian euros by the average of the same reference persons working for the Dutch, German and French governments.
• For more information please read the full report.
* For reference persons working for the French government some ofthe allowances are included in the gross wage.
Reference person Other members of household

COMPARING THE REMUNERATION AT INTERNATIONAL ORGANISATIONS WITH THAT AT NATIONAL GOVERNMENTS i
SEO AMSTERDAM ECONOMICS
Acknowledgement
This report has been composed with the help of numerous people working at the organisations covered in the analysis. We would like to thank them for their time and effort scrutinizing both the report and the analysis. Their feedback has proven invaluable for the quality of the report, helping us to correct factual errors in assumptions made on staff regulations, clarifying the text where needed, as well as providing us with the necessary context in many situations. We have not always been able to address all comments for a variety of reasons. Furthermore, any errors that may still be present in the report or the analysis are not the responsibility of the people who participated in the feedback processes. This responsibility lies fully with the authors.

ii
SEO AMSTERDAM ECONOMICS
Process and disclaimer
This report was commissioned to SEO Amsterdam Economics by the Ministry of the Interior and Kingdom Relations of the Netherlands in early 2016. It has been the intention of those involved to have the report as well as the analysis scrutinized where possible by the covered organisations, their role being to provide input for the analysis and comments on preliminary versions. Indeed, this happened several times in the form of feedback rounds, and took place on the following dates: On the 4th and 5th of May 2016 contact persons at the covered organisations were asked to provide feedback on some of the assumptions made in the report and analysis regarding the reference persons and their respective salary scale within each organisations. On the 16th of September 2016 the contact persons received the first full version of the report. They were requested to provide feedback on the report, the analysis and the assumptions behind the analysis. On the 2nd of December 2016 the contact persons some of the organisations received the full report They were requested to provide feedback on the report, the analysis and the assumptions behind the analysis. On the 24th of February 2017 the contact persons were contacted by the authors in order to plan conference calls over video or the phone. In most cases these calls took place in the second and third weeks of March. Some were not possible due to conflicting time schedules. On the 7th of April 2017 the corrected version was sent to the contact persons with preliminary results. They were again requested to provide feedback on the report, the analysis and the assumptions behind the analysis. Finally, in the period between August and October 2017 some figures were changed as a result of final feedback of some of the organisations covered. The organisations covered in this report were not asked to validate the assumptions, input, analysis and results in this report. The results shown in this report intend to show the differences – if any – in employee remuneration across the different organisations. Neither the report, nor SEO Amsterdam Economics nor the authors pass any judgment as to whether the differences in remuneration are in any way justifiable. Comment from the OECD, Council of Europe and NATO: “The OECD, the Council of Europe and NATO do not endorse the assumptions taken in the study as they do not represent or match the reality of their Organisations or their employees. These Organisations consider that the study compares staff with different level of responsibility who are not doing the same kind of work”.

COMPARING THE REMUNERATION AT INTERNATIONAL ORGANISATIONS WITH THAT AT NATIONAL GOVERNMENTS i
SEO AMSTERDAM ECONOMICS
Summary
The remuneration of civil servants of the international organisations under review (OECD, NATO, CoE, EC and UN) is relatively high compared to that of civil servants working for the Dutch, German and French governments. This holds both in terms of annual net income as well as hourly net lifetime remuneration. Contractual working hours are higher at international organisations than in the Netherlands and France. This report compares the income of civil servants. The organisations included in the analysis are the Organisation for Economic Co-operation and Development (OECD), the European Commission (EC), the Council of Europe (CoE), the North Atlantic Treaty Organisation (NATO) and the United Nations (UN). The countries included in the analysis are the Netherlands, Germany and France. It is assumed that all employees work at the headquarters of their organisations. All results are corrected for differences in purchasing power between the places of residence of the employees. This report investigates the gross and net labour benefits, including retirement benefits and special allowances. Furthermore, it looks at the differences in social benefits, including health insurance. For this comparison, the report uses reference persons. It concerns 11 different reference persons in total, who differ by age and job level. The reference persons are 30, 40 and 58 years old, and they are all assumed to have been working at their current organisation since the age of 30. This implies that the 30-year-old reference persons are newly hired employees and the others are not. The job levels or positions are secretary officer (with an education at higher vocational level), supporting policy officer (with an education at bachelor level), policy maker (with an education at master level) and head of unit. A reference person is created for each combination of age and job level, the only exception being a head of unit aged 30, since that combination is not realistic within the selected organisations. Also, several organisations note that they no longer hire secretaries with an education below bachelor level. Furthermore, assumptions are made about the family situation based on the reference person’s age. All employees are assumed to be bilingual, but are not assumed to be expats. While it is likely that there are differences between the employees of the countries and organizations that are not captured in the reference persons, these are assumed to be equal with respect to all characteristics that are not determined. This includes soft skills like multicultural awareness and interpersonal skills. However, the use of reference persons enables a precise comparison. It makes differences in wages and net income of employees between organisations and countries visible and provides input for the policy discussion. The advantage of analysing reference persons is that it is possible to see the differences in outcomes between different types of employees. Furthermore, in several cases the employee benefits are more expansive for those who have been employed for a long time since they are often restricted for new employees. The reference persons’ age and related seniority differences, or differences in the level of seniority, make it possible to see the effects of these restrictions.

ii
SEO AMSTERDAM ECONOMICS
The OECD, CoE and NATO offer a gross salary to each reference person that is respectively 4 percent, 4 percent and 12 percent higher on average than what their counterparts at the national governments receive (see figure s. 1). The main reason behind the difference between NATO and the other CCR organisations is because salary scales differ depending on country of employment. At the EC, average gross salaries are 17 percent higher than for similar positions at the three national governments. Employees at the UN receive the highest annual gross wage, i.e. 48 percent higher than the average at the national governments, which is in line with its statutory principle that it should pay its professional staff an equal or better salary than the best paying member state (currently the US) and its general staff a salary that is equal to what other employers in the country of employment are paying. However, the UN has recently implemented new age scales where general service staff who are hired as of 2016 receive a lower wage than current general service staff as a result of an updated comparison of the wage levels of these staff members with similar workers at other employers in New York. A reform was pushed through at the EC, where new staff are placed in a lower salary scale than current staff. NATO is planning a similar salary reform. These reforms have decreased the wage differences between newly hired staff of the international organizations and the countries.
Figure S. 1 With the exception of the UN, average annual gross wages at the international organisations are lower than at the German government
0
0.5
1
1.5
2
2.5
0%
50%
100%
150%
200%
250%
Annual gross wage (excluding pension contribution)100% indicates the average gross wage across the three national governments for each reference person
ECNL DE FR OECD CoE NATO UN
Legend:Employer averageNational governments average
Reference person (1 to 11 from left to right)
Source: SEO analysis Note: For each reference person the annual gross wage is displayed relative to the average amount that
they would receive working at the national governments of the Netherlands, Germany and France. This value was calculated by dividing the amount that each reference person receives at each of the organisations (in euros and corrected for purchasing power parity) by the average amount that the same reference person receives at the three national governments.
For an overview of all of the amounts in absolute terms, see appendix A.
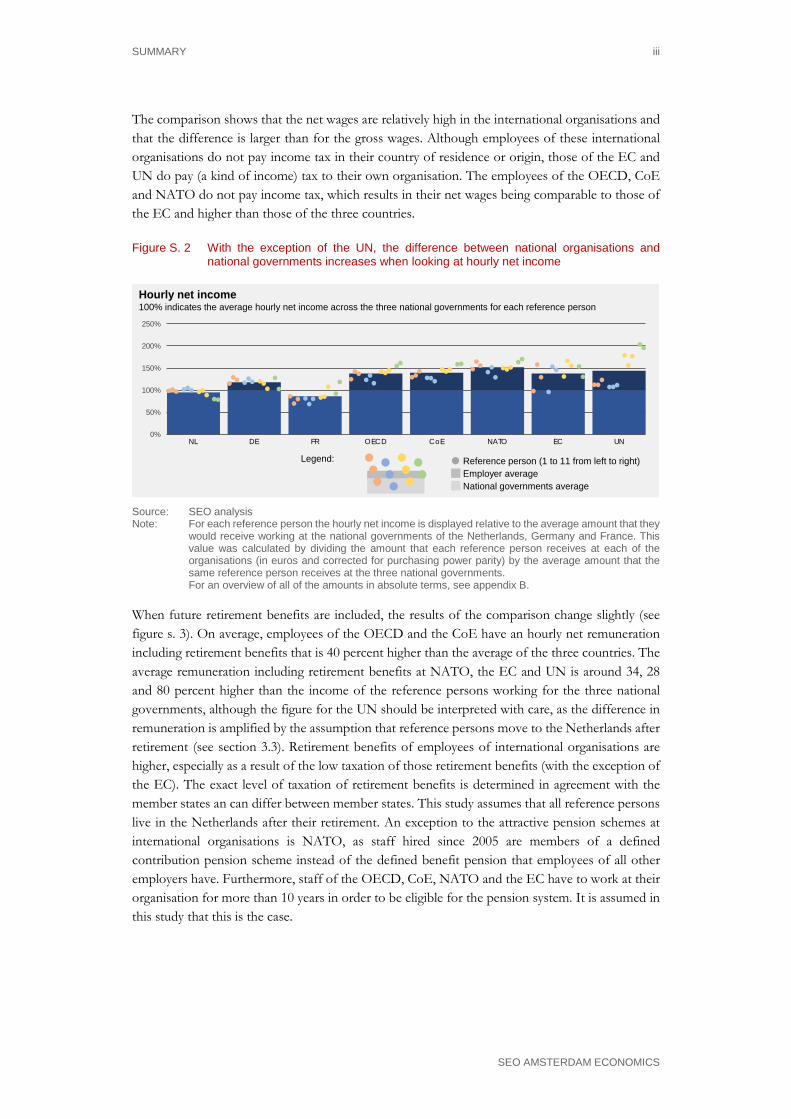
However, annual gross wages only tell part of the story. When looking at the hourly net income of employees (see figure s. 2), in most cases the remuneration gap between the international organisations and the national governments increases. This figure is derived from the gross salaries by correcting them for differences in working hours, subtracting taxes and further contributions, and adding allowances and benefits. The conclusion that remuneration is higher for employees of the international organisations is true for all levels of staff, from secretaries to heads of unit, and for all ages. On average, employees of the OECD and the CoE have an hourly net remuneration that is respectively 38 and 40 percent higher than the average of the three countries. The average remuneration at NATO, the EC and UN is respectively around 52, 38 and 44 percent higher than the income of the same reference persons working for the three national governments.
SUMMARY iii
SEO AMSTERDAM ECONOMICS
The comparison shows that the net wages are relatively high in the international organisations and that the difference is larger than for the gross wages. Although employees of these international organisations do not pay income tax in their country of residence or origin, those of the EC and UN do pay (a kind of income) tax to their own organisation. The employees of the OECD, CoE and NATO do not pay income tax, which results in their net wages being comparable to those of the EC and higher than those of the three countries.
Figure S. 2 With the exception of the UN, the difference between national organisations and national governments increases when looking at hourly net income
Legend:
0%
50%
100%
150%
200%
250%
NL NL NL NL NL NL NL NL NL NL NL NL NL NL DE DE DE DE DE DE DE DE DE DE DE DE DE DE FR FR FR FR FR FR FR FR FR FR FR FR FR FR OECD OECD OECD OECD OECD OECD OECD OECD OECD OECD OECD OECD OECD OECD CoE CoE CoE CoE CoE CoE CoE CoE CoE CoE CoE CoE CoE CoE NATO NATO NATO NATO NATO NATO NATO NATO NATO NATO NATO NATO NATO NATO EC EC EC EC EC EC EC EC EC EC EC EC EC EC UN UN UN UN UN UN UN UN UN UN UN UN UN UN
Hourly net income100% indicates the average hourly net income across the three national governments for each reference person
ECNL DE FR OECD CoE NATO UN
Employer averageNational governments average
Reference person (1 to 11 from left to right)
Source: SEO analysis Note: For each reference person the hourly net income is displayed relative to the average amount that they
would receive working at the national governments of the Netherlands, Germany and France. This value was calculated by dividing the amount that each reference person receives at each of the organisations (in euros and corrected for purchasing power parity) by the average amount that the same reference person receives at the three national governments.
For an overview of all of the amounts in absolute terms, see appendix B.
When future retirement benefits are included, the results of the comparison change slightly (see figure s. 3). On average, employees of the OECD and the CoE have an hourly net remuneration including retirement benefits that is 40 percent higher than the average of the three countries. The average remuneration including retirement benefits at NATO, the EC and UN is around 34, 28 and 80 percent higher than the income of the reference persons working for the three national governments, although the figure for the UN should be interpreted with care, as the difference in remuneration is amplified by the assumption that reference persons move to the Netherlands after retirement (see section 3.3). Retirement benefits of employees of international organisations are higher, especially as a result of the low taxation of those retirement benefits (with the exception of the EC). The exact level of taxation of retirement benefits is determined in agreement with the member states an can differ between member states. This study assumes that all reference persons live in the Netherlands after their retirement. An exception to the attractive pension schemes at international organisations is NATO, as staff hired since 2005 are members of a defined contribution pension scheme instead of the defined benefit pension that employees of all other employers have. Furthermore, staff of the OECD, CoE, NATO and the EC have to work at their organisation for more than 10 years in order to be eligible for the pension system. It is assumed in this study that this is the case.

iv
SEO AMSTERDAM ECONOMICS
Figure S. 3 On average, employees working at international organisations earn more than those working for national governments when looking at total lifetime remuneration
ECNL DE FR OECD CoE NATO UN
Legend:
0%
50%
100%
150%
200%
250%
300%
NL NL NL NL NL NL NL NL NL NL NL NL NL NL DE DE DE DE DE DE DE DE DE DE DE DE DE DE FR FR FR FR FR FR FR FR FR FR FR FR FR FR OECD OECD OECD OECD OECD OECD OECD OECD OECD OECD OECD OECD OECD OECD CoE CoE CoE CoE CoE CoE CoE CoE CoE CoE CoE CoE CoE CoE NATO NATO NATO NATO NATO NATO NATO NATO NATO NATO NATO NATO NATO NATO EC EC EC EC EC EC EC EC EC EC EC EC EC EC UN UN UN UN UN UN UN UN UN UN UN UN UN UN
Total hourly net remuneration including retirement benefits100% indicates the average net hourly lifetime income across the three national governments for each reference person
Employer averageNational governments average
Reference person (1 to 11 from left to right)
Source: SEO analysis Note: For each reference person the total hourly net remuneration including retirement benefits is displayed
relative to the average amount that they would receive working at the national governments of the Netherlands, Germany and France. This value was calculated by dividing the amount that each reference person receives at each of the organisations (in euros and corrected for purchasing power parity) by the average amount that the same reference person receives at the three national governments.
For an overview of all of the amounts in absolute terms, see appendix B.
Assuming the reference persons at national organisations are expatriated considerably changes the results, as they would qualify for an expatriation allowance in all cases except those working for the UN. In that case employees working for the international organisation would receive close to 60 percent more on average than they would receive if they would work for the national governments and not be expatriates, instead of 44 percent if expat allowances are not taken into account (see section 4.1). Except for employees hired since 2005 by NATO, all international organisations under consideration work with a defined benefit pension plan based on an employee’s final or end of career salary. This system leads to a relatively high pension income for these employees. The high costs of this system were the reason for the Netherlands, for instance, to switch to a pension plan based on the average salary instead of the final salary in 2004. The OECD has a standard retirement age of 63, whereas the other organisations and the Netherlands and Germany have retirement ages between 65 and 67 for staff who are currently hired. However, the UN, OECD, NATO and CoE still have a statutory retirement age of 60 for staff who have been hired before 1990 (UN), 2002 (OECD, NATO) or 2003 (CoE). It is assumed that all employees retire at the statutory retirement age. This means early retirement, although possible in many cases, is not considered in the analysis. Recent reforms that increased the retirement age in France, Germany and the Netherlands applied to all employees, including older cohorts. This is contrary to the reforms at the international organisations under consideration, where staff who were already employed at the time of the reform kept their lower retirement age and old pension system. Another difference that increases the purchasing power of employees of the OECD, NATO, CoE and the EC, is the system of health insurance for their staff. All four organisations provide a relatively cheap health insurance package with free coverage for the whole family (partner and children). That implies that employees of these international organisations pay a relatively low

SUMMARY v
SEO AMSTERDAM ECONOMICS
premium for the coverage that they get. Only France has health insurance that is comparably attractive for employees. The UN’s health insurance plan is not as attractive for its employees, as the contributions are relatively high while the coverage is average. The comparison of wages and labour benefits performed in this analysis is based on several assumptions, some with a minor impact on the results and some with a possible major impact. It is assumed that the number of working hours is equal to the contractual working hours and that all reference persons have the same skills level (including soft skills) and productivity across employers. This implicitly means that it is assumed that there is no self-selection of employees across employers. The relevant salary scales for the reference persons’ jobs are based on official documents with further input from HR experts of the different employers.

COMPARING THE REMUNERATION AT INTERNATIONAL ORGANISATIONS WITH THAT AT NATIONAL GOVERNMENTS
SEO AMSTERDAM ECONOMICS
Table of contents
Acknowledgement ............................................................................................................... i
Process and disclaimer ........................................................................................................ ii
Summary .............................................................................................................................. i
1 Introduction ............................................................................................................... 1
2 Methodology ............................................................................................................. 3 2.1 Reference persons ................................................................................................................. 3
2.2 Reference persons’ wage levels ........................................................................................... 5
2.3 From gross to net wages ...................................................................................................... 9
2.4 The calculation of future income ...................................................................................... 14
2.5 Output ................................................................................................................................... 17
3 Income differences .................................................................................................. 19 3.1 Base salary ............................................................................................................................. 19
3.2 Hourly wage ......................................................................................................................... 23
3.3 Remuneration including retirement benefits .................................................................. 25
4 Sensitivity analysis and other benefits .....................................................................29 4.1 Expatriation allowance ....................................................................................................... 29
4.2 Dependent spouse ............................................................................................................... 30
4.3 Healthcare coverage ............................................................................................................ 32
5 Conclusions .............................................................................................................35
Appendix A 2016 yearly wages ...........................................................................................37
Appendix B Remuneration including retirement benefits ................................................. 41


COMPARING THE REMUNERATION AT INTERNATIONAL ORGANISATIONS WITH THAT AT NATIONAL GOVERNMENTS 1
SEO AMSTERDAM ECONOMICS
1 Introduction
The goal of this analysis is to compare the remuneration of civil servants of several international organisations with those of national governments in select Westerns European countries. An analysis based on reference persons is used for this comparison. The Dutch government is interested in a comparison of the remuneration that civil servants employed at international organisations receive with that of civil servants working for the national governments of a number of Western European countries. SEO Amsterdam Economics has been asked to perform this comparison.
Selection of organisations and countries The organisations included in the analysis are the Organisation for Economic Co-operation and Development (OECD), the European Commission (EC), the Council of Europe (CoE), the North Atlantic Treaty Organisation (NATO) and the United Nations (UN). Of these organisations, the OECD, CoE and NATO are members of the Co-ordinated Organisations. This means that they are all advised on labour benefits by the Co-ordinating Committee on Remuneration (CCR). In practice, this means that the structure of their system of labour benefits is very similar. The UN is a special case since it abides by the Noblemaire Principle for its professional and higher staff, as derived from its statute. This principle states that the UN should be able to recruit staff from each Member State, including those with the highest remuneration. Therefore, the salaries of the staff are set in reference to the highest-paying national civil service, which is currently that of the US. As a result, these salaries should by definition be equal to or higher than those of civil servants working for national governments in the individual countries. For lower staff the UN abides by the Flemming principle, which states that the local compensation at the United Nations should be based on the best prevailing conditions found locally for similar work. NATO and the OECD have an internal principle that is similar to that of the UN. The countries included in the analysis are the Netherlands, Germany and France. The government of the Netherlands, as the commissioner of this study, is included in its role as an employer in order to enable a comprehensive comparison. Germany and France have been selected because they are often considered relatively influential (often founding) member states within the compared (European) international organisations. Furthermore, some of the organisations have their seat in France and/or have staff regulations that are based to some extent on the French system.
The benefits under analysis This report mainly investigates the gross and net labour benefits, including retirement benefits and family allowances. Furthermore, it looks at the differences in social benefits, including health insurance. The chosen methodology makes it possible to see the differences in benefits across different job levels and organisations. In several cases the benefits are more expansive for employees who have been employed for a longer time since they are often restricted for new employees. The effect of differences in age and related seniority are shown in the results.

2 CHAPTER 1
SEO AMSTERDAM ECONOMICS
The role of this report This report aims to give a complete overview of the results of the comparison and the underlying data and assumptions. As a result, parts of it are moderately technical. The report is accompanied by a factsheet that summarises the main results without elaborating on the underlying data and methods. Chapter 2 provides a description of the method used for the reference persons’ construction and analysis, the data and the results of the analysis. Chapter 3 presents the main results of the analysis with regard to the reference persons. Chapter 4 describes what would happen if certain assumptions would be changed and which differences in benefits were not quantified. The report ends with a conclusion.
COMPARING THE REMUNERATION AT INTERNATIONAL ORGANISATIONS WITH THAT AT NATIONAL GOVERNMENTS 3
SEO AMSTERDAM ECONOMICS
2 Methodology
This comparison uses reference persons who represent a realistic cross section of employees. These persons differ by job and age. The comparison does not only take the gross current wage into account, but also the net wage and net income. Furthermore, the value of the future pension is compared.
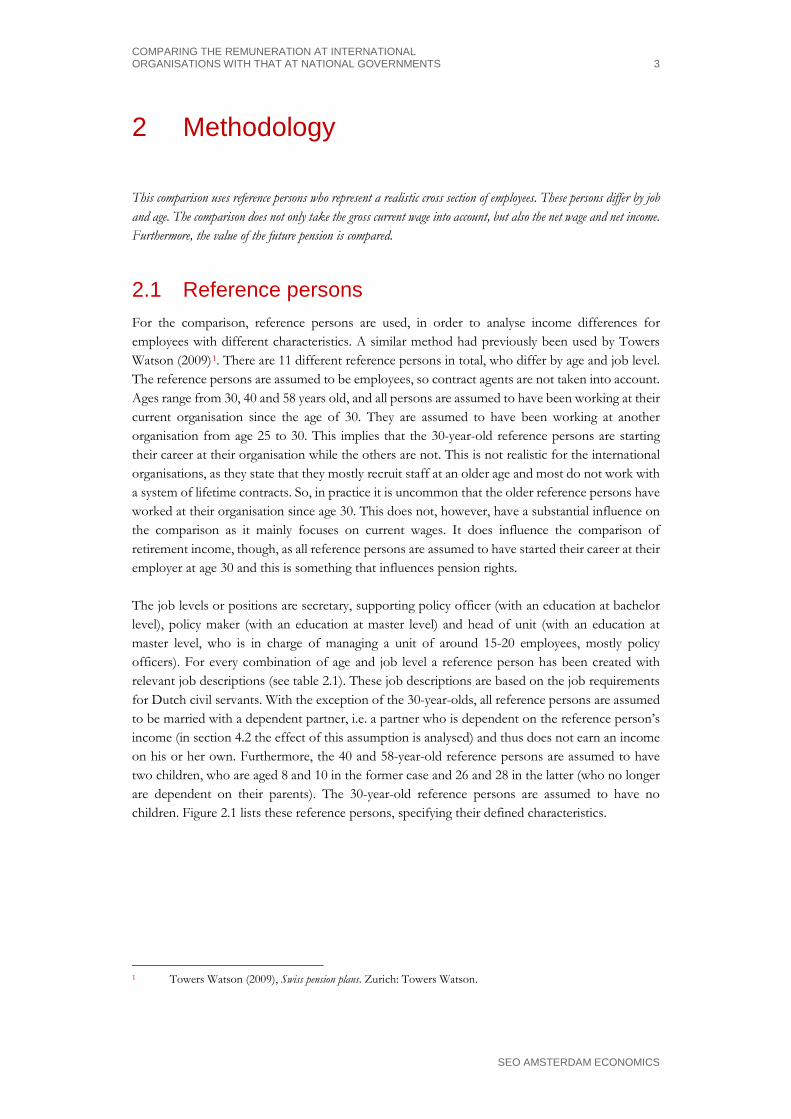
2.1 Reference persons For the comparison, reference persons are used, in order to analyse income differences for employees with different characteristics. A similar method had previously been used by Towers Watson (2009)1. There are 11 different reference persons in total, who differ by age and job level. The reference persons are assumed to be employees, so contract agents are not taken into account. Ages range from 30, 40 and 58 years old, and all persons are assumed to have been working at their current organisation since the age of 30. They are assumed to have been working at another organisation from age 25 to 30. This implies that the 30-year-old reference persons are starting their career at their organisation while the others are not. This is not realistic for the international organisations, as they state that they mostly recruit staff at an older age and most do not work with a system of lifetime contracts. So, in practice it is uncommon that the older reference persons have worked at their organisation since age 30. This does not, however, have a substantial influence on the comparison as it mainly focuses on current wages. It does influence the comparison of retirement income, though, as all reference persons are assumed to have started their career at their employer at age 30 and this is something that influences pension rights. The job levels or positions are secretary, supporting policy officer (with an education at bachelor level), policy maker (with an education at master level) and head of unit (with an education at master level, who is in charge of managing a unit of around 15-20 employees, mostly policy officers). For every combination of age and job level a reference person has been created with relevant job descriptions (see table 2.1). These job descriptions are based on the job requirements for Dutch civil servants. With the exception of the 30-year-olds, all reference persons are assumed to be married with a dependent partner, i.e. a partner who is dependent on the reference person’s income (in section 4.2 the effect of this assumption is analysed) and thus does not earn an income on his or her own. Furthermore, the 40 and 58-year-old reference persons are assumed to have two children, who are aged 8 and 10 in the former case and 26 and 28 in the latter (who no longer are dependent on their parents). The 30-year-old reference persons are assumed to have no children. Figure 2.1 lists these reference persons, specifying their defined characteristics.
1 Towers Watson (2009), Swiss pension plans. Zurich: Towers Watson.

4 CHAPTER 2
SEO AMSTERDAM ECONOMICS
Table 2.1 Detailed job descriptions of reference persons
Number of reference person
Education level
Education direction Job title Required
experience Language skills
Management experience Further details
1 Secondary vocational education
Secretarial Secretary A few years Native + English (basic)
Native + English (advanced)
Regular secretary
2 Secondary vocational education
Secretarial Secretary 10 years Native + English (advanced)
Little (of other secretaries)
Secretary of higher staff
3 Secondary vocational education
Secretarial Secretary 10 years + Native + English (advanced)
Little (of other secretaries)
Secretary of high staff
4 Bachelor Relevant for specific task
Supporting policy officer (advisory)
A few years Native + English (advanced)
None Supporting advisory process
5 Bachelor Relevant for specific task
Supporting policy officer (advisory)
10 years Native + English (advanced)
None
Preparation and supporting of advisory process
6 Bachelor Relevant for specific task
Supporting policy officer (advisory)
10 years + Native + English (advanced)
None Coordination of advisory processes
7 Master Relevant for specific field Policy advisor None
Native + English (advanced)
None Works on non-complex policy topics
8 Master Relevant for specific field Policy advisor
Experience in different relevant roles/departments
Native + English (advanced)
None Works on complex policy topics
9 Master Relevant for specific field Policy advisor
Experience in different relevant roles/departments including coordination role
Native + English (advanced)
Little (coordination of team)
Works on complex policy topics and coordinates team
10 Master Relevant for specific field
Head of unit (middle manager)
Experience in different roles and departments, including international experience
Native + English (advanced)
Yes + with additional leadership training
Responsible for influencing strategic policy with team
11 Master Relevant for specific field
Head of unit (top manager)
Experience in different roles and departments, including international experience
Native + English (advanced)
Yes + with additional leadership training
Responsible for strategic policy making and reaching strategic goals with team
Source: SEO Amsterdam Economics Note: These job descriptions have been defined in an attempt to make the functions across all organisations
as comparable as possible. Ideally, the higher the level of detail the or the more specific the description the more accurately each reference person can be placed within each organisation. However, because of the heterogeneity of the organisations, the more difficult it becomes to create a reference person that is suitable for all organisations.
While each reference persons’ attributes have been defined with care, full comparability across organisations is by definition not achieved. As an example, many of the international organisations point out that they recruit employees with a bachelor’s degree for secretarial positions and a master’s degree for supporting policy officers.
An exact comparison between jobs (especially in the international field) is difficult. Nevertheless, on the basis of the job descriptions, staff regulations and the feedback from the national services and the international organisations, this report attempts to come as close as possible to making a

METHODOLOGY 5
SEO AMSTERDAM ECONOMICS
realistic comparison between the different job levels. At NATO, the OECD and CoE the secretary jobs have been phased out in practice, as these organizations only employ supporting staff at the bachelor level (who are supporting policy officers in this comparison).
Figure 2.1 Overview of personal characteristics of the reference persons
Secretary
Supporting policy officer
Policy maker
Head of unit
30 years old
Spouse:No
Children:No
Spouse:No
Children:No
Spouse:No
Children:No
40 years old
Spouse:Yes
Children:Aged 8 and 10
Spouse:Yes
Children:Aged 8 and 10
Spouse:Yes
Children:Aged 8 and 10
Spouse:Yes
Children:Aged 8 and 10
Spouse:Yes
Children:Aged 26 and 28
Spouse:Yes
Children:Aged 26 and 28
Spouse:Yes
Children:Aged 26 and 28
Spouse:Yes
Children:Aged 26 and 28
7
4
1
10
8
5
2
11
9
6
3
58 years old
Source: SEO Amsterdam Economics
The underlying assumption for these reference persons is that their similarities are not limited to the observable qualities. They are also assumed to be equal with regard to other characteristics, including skills, productivity and motivation. However, it needs to be pointed out that in reality there could be a selection bias that cannot be isolated since many of its characteristics are unobserved. For example, the OECD, NATO and CoE point out that their employees have a higher level of soft skills like multicultural awareness and interpersonal skills.
2.2 Reference persons’ wage levels For the purpose of this study, the relevant salaries for all reference persons had to be determined. The relevant salary scales have been based primarily on official documents such as staff regulations (see table 2.2) that define salary scales for the job levels, and in some cases on specific input of the HR experts within each analysed organisation. The results have been verified by employees of each of the relevant organisations. Table 2.2 lists the salary scales for each reference person and organisation, with the exception of those working for the French government. For them, indices majorés are displayed (indexed points on which their salary is based) because their salary structures are slightly different. For the calculation of retirement benefits it is assumed that all reference persons stay in their current job (and salary scale) throughout their entire career, ascending the steps within their salary scale until they reach the maximum. So, all reference persons stay in their current position until their retirement.

6 CHAPTER 2
SEO AMSTERDAM ECONOMICS
Table 2.2 Current salary grades for all reference persons
Position: Secretary Supporting policy officer Policy maker Head of unit
Reference person: 1 2 3 4 5 6 7 8 9 10 11
(Scale).(step) as defined in each organisation’s own salary tables.
Netherlands 6.0 7.7 8.8 9.0 10.8 11.8 11.0 12.8 13.8 14.2 15.8
Germany A9.2 A10.4 A10.9 A11.3 A12.5 A12.10 A13.3 A14.5 A15.9 B2 B3
France* 321 330 400 332 367 477 365 483 798 658 1164
UN GS 3.I GS 4.VII GS 4.XI GS 4.I GS 5.VIII GS 5.XI P2.I P3.III P4.VII D1.I D2.IV
NATO*** B2.1 B3.6 B3.12 B3.1 B3.10 B4.7 A1.1 A2.1 A3.4 A4.1 A5.7
EC** SC1.1 SC3.1 SC6.1 AD1.1 AD4.1 AD8.1 AD5.1 AD8.1 AD12.1 AD10.1 AD13.1
OECD*** B2.1 B3.5 B3.15 B3.1 B3.12 B4.7 A1.1 A2.1 A3.4 A4.1 A5.7
CoE*** B2.1 B3.2 B3.11 B3.1 B3.7 B4.7 A1.1 A2.1 A3.3 A4.1 A5.5
Source: SEO analysis Note: While a significant part of the workforce for many of the organisations is composed of contract agents
(for example: the EC employs approximately 7.000 contract agents and 22.000 officials), their salaries are not taken into account in this study. Under supervision of officials these contract agents perform tasks similar to those carried out by regular staff, while being paid on a different scale - often lower.
*: Salaries in France are defined by indice majorés rather than salary scales. **: In the EC documents scales are referred to as steps and steps as scales ***: The organisations that adhere to the CCR have differences in the advancement periods across
some steps and scales. As a result of this, differences in step between similar reference persons across organisations can arise.
The older reference persons are assumed to have been working at their current organisation since age 30. To determine their current salary step level, it is assumed that they have been working in a job with a salary scale that is one level lower until their current age and have then successfully applied for their current job. This assumption leads to a higher salary step within their grade for older employees. If the salary at the lowest step of their new job level is lower than the salary that they would earn if they would have stayed in their previous position (because of the step they were in) it is assumed that the older reference persons’ salary level corresponds to the first step within the salary scale of their new job that offers a higher salary. In the case of France, due to the complexity of the French bonus system, for all reference persons working for the French government a bonus based on empirical averages for each category on top of their gross salaries has been assumed. Table 2.3 shows the value of said bonuses for each reference person. In the analysis the average between the minimum and maximum value for each reference person is used.

METHODOLOGY 7
SEO AMSTERDAM ECONOMICS
Table 2.3 Bonuses received per reference person function profile by French civil servants
Reference person Bonus (as percentage of gross salary)
Minimum Maximum Average
1 29.1 44.6 36.85
2 32.9 47.2 40.05
3 36.7 53.6 45.15
4 37.7 53.6 45.65
5 40.1 55.8 47.95
6 49.2 70.9 60.05
7 52.2 73.7 62.95
8 80.9 104.7 92.80
9 79.5 107.7 93.60
10 92.3 117.1 104.70
11 97.0 121.4 109.20
Source: Direction générale de l'administration et de la fonction publique (DGAFP) - Département des études, des statistiques et des systèmes d’information.
In addition to the scales presented in table 2.2, officials working for the French and German governments are entitled to premiums on top of their basic gross salary depending on their family situation. In France, employees with children receive a monthly supplement for each child that consists of a fixed part and in some cases a variable part, both dependent on the number of children, up to a maximum of € 1330. In Germany a variable supplement is given that depends both on whether or not the employee has a spouse and on the number of children. All job descriptions and corresponding salary levels have been commented on by HR experts working for each relevant country and organisation. However, the exact comparison is made on authority of the researchers. The sources used for the general staff regulations are presented in table 2.4. Furthermore, for all organisations the salary scales that are used are the scales that were effective in April 2016.

8 CHAPTER 2
SEO AMSTERDAM ECONOMICS
Table 2.4 The following sources have been used as a basis for this comparison
Country/Organisation Source
Netherlands Algemeen Rijksambtenarenreglement & Bezoldigingsbesluit Burgerlijke Rijksambtenaren 1984 (September 2015)
France Statut général des fonctionnaires (April 2016) Germany Bundesbeamtengesetz & Bundesbesoldungsgesetz (May 2016)
OECD Staff regulations, rules and instructions applicable to officials of the organisation (April 2016)
NATO Civilian Personnel Regulations (October 2014) including later amendments CoE Resolutions on the Council of Europe Staff Regulations (May 2016) EC Staff Regulations of Officials of the European Countries (January 2014))
UN Staff Rules and Staff Regulations of the United Nations (January 2014) and http://www.un.org/Depts/OHRM/salaries_allowances/salary.htm
As previously mentioned, it is assumed that every reference person has been working at the current organisation since age 30. In some cases there have been reforms reducing the basic wage levels, but these only apply to new members of staff and hence have had no effect for employees working at the organisation before the reforms. In these cases, salaries are lower for the 30-year-old reference persons than for their older counterparts when they were the same age, since the latter were hired before the reforms were implemented. This is the case for general service staff of the UN who work in New York, where staff hired as of 2016 get a lower wage in the same salary scale, and for the EC, where new salary scales have been introduced for newly hired staff. Following common scientific practice in the analysis of wage comparisons, this study analyses hourly wage levels (see for example Oaxaca, 1973).2 Therefore, the number of working hours needs to be determined for this calculation. It is assumed that the actual number of working hours is equal to the official number of working hours. Furthermore, every employee is assumed to use all leave days available. Therefore, if staff of certain countries or organisations structurally work more hours than they are paid for, this is not taken into account in this analysis.
Country and city of residence while employed This analysis only covers workers employed at the headquarters of each organisation, or in the city where the central government is located. This means: New York in the United States for the UN, Brussels in Belgium for the European Commission and NATO, and Paris and Strasbourg in France for the OECD and the Council of Europe, respectively. For the national governments the cities of residence are Berlin, Paris and The Hague for Germany, France and the Netherlands, respectively. So, diplomatic staff of these national governments working in other countries are not part of the comparison3. In other words, while the UN has branches in many different countries, only the income of employees based at the headquarters in New York is analysed. Also, for NATO only the income of employees at its international headquarters is included in the study. Other organisations have different branch locations as well, but also in these cases only the income of employees working at the headquarters is analysed. These international organisations with multiple 2 See Oaxaca, R. (1973). Male-Female Wage Differentials in Urban Labor Markets. International Economic
Review, 14(3), 693-709. 3 For this research the staff of the international organisations (IO’s) are not considered diplomats because
the staff of international organisations do not consistently have to move every 2, 3 or 4 years throughout their entire career. Apart from this difference the diplomatic “extras” are not included in the base salary or tax benefits, but can be identified in the form of installations allowances, moving costs, education allowances, etc. These allowances are not part of this comparison.

METHODOLOGY 9
SEO AMSTERDAM ECONOMICS
working locations have different levels of salary scales depending on the location of the office or staff. For example, the organisations that are part of the CCR work with salaries on city level, where corrections are made periodically for inflation and purchasing power differences (including housing costs) between cities where they have an office. Within France, salary scales are adjusted to employment location in order to correct for differences in the cost of living. For civil servants working in Paris, this results in a 3 percent increase of the gross salary compared to the base salary levels.
Geographic index Wages are corrected by using a geographic index that takes into account the differences in the cost of living between different countries. As previously mentioned, most international organisations make corrections to income based on cost of living figures. There are many ways of comparing the cost of living across countries and they can produce varying results. This study corrects for these differences using a geographic index based on the latest purchasing power parity (PPP) data by country from the CCR and the UN, which relates to the year 2016, converting all currencies (euros within Europe and dollars for the U.S.) to euros. Table 2.5 shows the amount of local currency needed in each country to match the purchasing power of € 1.00 in Belgium, which is used as a base.
Table 2.5 Amount of local currency within each country with equal purchasing power as € 1 in Brussels, Belgium
Country Conversion index to Belgian euros (2016) Netherlands (The Hague) € 1.0751
Germany (Berlin) € 0.9577
France (Paris) € 1.133
Belgium (Brussels) € 1.00
United States (New York) $ 1.3282 (€ 1.2511)
Source: CCR, Purchasing power parities July 2016 from “Annual adjustment of remuneration of staff of the co-ordinated organisations at 1 January 2017” for the Netherlands, France, Germany and Belgium.
For exchange rate Euro/Dollar and PPP figures on the US the exchange rate and post adjustment indices of the UN for 2016 where used. PPP’s include housing costs.
Although the CoE is headquartered in Strasbourg, the PPP adjustment of Paris is used.
2.3 From gross to net wages To get from gross to net wages, taxes and social security contributions are deducted from the base salaries and family allowances are added to the result. The levels of these allowances used in this study are those of 2016. For the UN this is a reverse calculation in practice, but that does not influence the results of this analysis.
2.3.1 Non-taxable allowances
Most countries and institutions have a system of allowances, where specific groups of employees receive an allowance. These can be employees with a family or expatriate employees. Family allowances can be for children, but can also be awarded to staff with spouses who do not earn a substantial income themselves. This applies in particular to expats, for whom these allowances can

10 CHAPTER 2
SEO AMSTERDAM ECONOMICS
be higher. This analysis covers family allowances, but does not cover expat allowances and incidental allowances for travelling or relocation.
The Netherlands Civil servants working for the Dutch government do not receive any allowances from their employer that are relevant for this comparison. Instead, some of the benefits that employees of other organisations receive, such as those offered to parents, are provided for in the tax system rather than through allowances provided by the employer and thus included in the analysis (see section 2.3.2). Diplomatic staff also qualify for expat allowances, but these are not considered in this study.
Germany and France Germany and France have allowances for civil servants with children and also a family allowance. In Germany, civil servants with a spouse receive allowances for being married. Additionally, income taxes can be distributed to some degree over all household members in France, or both spouses in Germany, which results in benefits for parents or couples in the form of tax reductions (see section 2.3.2). Diplomatic staff also qualify for expat allowances, but these are not considered in this study. Employees of the German governments with dependent children receive a non-taxable allowance for each child in their care. In 2016 this allowance was € 190 per month for the first two children, € 196 for the third and € 221 for each additional child.
OECD, NATO, CoE The OECD, NATO and the CoE offer allowances to civil servants with children (both a regular allowance and an allowance for children following education) and also a family allowance that is paid when the spouse does not earn a substantial wage.
EC The EC has allowances for civil servants with children (both a regular allowance and an allowance for children following education, the latter being irrelevant for the reference persons used in this analysis) and also a family allowance.
UN The UN has allowances for civil servants with dependent children or a dependent spouse. These are paid in the form of a higher wage for civil servants who qualify for these allowances. Furthermore, the UN works with a system of post adjustment for professional and higher staff. This adjustment is designed to compensate for the differences in living costs, thus providing staff with the same purchasing power at all duty stations. No income tax is levied on this adjustment.
Expat allowances Except for the UN, the international organisations offer expatriation allowances to employees who do not originate from the country of employment or who are not residents thereof when employment is started. These allowances are not part of the main comparison. However, this additional payment can be quite significant and has a permanent character in some cases. In this study it is assumed that the reference persons do not necessarily originate from the country of employment, but could have been working there before and do not qualify for applicable

METHODOLOGY 11
SEO AMSTERDAM ECONOMICS
expatriation allowances. This assumption is made to not skew the comparison regarding expat allowances. However, in section 4.1, as part of a sensitivity analysis, the total remuneration including retirement benefits is compared across organisations assuming the employees are expats and therefore receive such an allowance if they qualify. These allowances include the additional home leave days that expatriated employees of the OECD, NATO and CoE receive, which are used for the calculation of their hourly income. They do not include the coverage of home leave expenses of several international organisations. The coverage of schooling costs of expatriated children is not included in said sensitivity analysis. These schooling costs as well as the possible coverage of these costs can be very substantial, especially if expatriated children do not attend public schools (by choice or because they are not allowed to). Expat allowances for diplomatic staff of the countries can be substantial, but are not included in the comparison.
OECD, NATO, CoE The OECD, NATO and CoE have expat allowances of 10 to 20 percent of the regular wage, depending on recruitment date and marital status. However, reforms have been made that mean that these allowances have a temporary nature for new employees (staff hired after 1995). For newly hired staff, these allowances are only paid during the first five years of their expatriation. When a staff member has a child that goes to school and is expatriated, a supplemental expat allowance applies. If an employee also receives an allowance from his or her country of residence, these organisations do not pay an allowance (or they pay a lower allowance).
EC The EC provides expats and their families with an allowance of 16 percent of the regular gross wage plus family allowances (child and dependent spouse benefits).
UN The UN has a hardship allowance for expatriated staff, with the amount depending on the duty station’s location. In the case of New York this allowance is zero, so it is not relevant for this analysis.
2.3.2 Taxes and social premiums
The countries of residence all have different tax systems, which results in different disposable incomes for the reference persons. Furthermore, employees of most of the international organisations are exempt from paying taxes during their working period. This section provides an overview of which and how much taxes the reference persons have to pay. It also describes specific attributes of each tax system that are accounted for in the analysis but which have an effect on their disposable income. Social security contributions for unemployment or disability insurance are included in these taxes. Staff of the international organisations do not have unemployment insurance and also do not pay a contribution or tax covering unemployment, unlike civil servants of the countries. Premiums for healthcare systems including sickness insurance are not included. Those systems are discussed in chapter 4. That implies that this study defines net salaries excluding healthcare premiums. This is common practice in the Netherlands, but in other countries or at international organisations other definitions of net salaries are used.

12 CHAPTER 2
SEO AMSTERDAM ECONOMICS
The Netherlands Like all countries in this comparison the Netherlands applies a progressive income tax system, which is composed of 4 different tax rates. They vary from 36.55 percent to 52 percent. These tax rates are marginally applied to the taxable income, which is calculated by subtracting income dependent tax credits (both a general tax credit and a specific one for working residents) from the total gross income. Tax payers in the Netherlands can receive a tax discount, which decreases as their income increases. The tax rates include social security contributions. If a person has a dependent spouse, that spouse will receive a higher general tax credit. In the Netherlands, apart from paying income tax, inhabitants may be eligible for a number of government benefits. For the reference persons, only children’s benefits are relevant, since all employees’ salaries are above the stated maximum and therefore they do not qualify for other benefits. There are regular children’s benefits that every resident receives and an income dependent tax deduction for parents with children, which increases with income until a certain maximum is reached.
Germany In Germany, taxable income is calculated by subtracting social security contribution form gross wages. These social security contributions provide employees with pension insurance, unemployment insurance, health insurance and care insurance. While mandatory for most workers in Germany, civil servants are exempt from paying some of these contributions while others are voluntary, as is the case with health insurance. Regarding the latter remark, since health coverage is not taken into account in the quantitative analysis, these costs are excluded from the calculation. Taxable income is taxed using a progressive tax system, with tax rates ranging from 0 to 45 percent. Tax payers with a spouse can decide if they want to be assessed separately or along with their spouse. It is assumed that the reference persons choose the latter option. Additionally, German civil servants pay a solidarity tax equivalent to 5.5 percent of the annual tax contribution, unless they have two or more children and earn less than a certain amount.
France In France, employees have to pay a social security contribution before paying income tax. In the case of the reference persons in this analysis the social security contribution is equal to 8 percent of the gross wage. Taxes are then calculated over the resulting income. The level of income tax depends on the total income and size of a family. Once the household income has been determined, the tax contribution is set using a progressive tax table, with marginal tax rates ranging between 0 and 45 percent. In this system, tax payers can decide to spread their income over their family members (with decreasing impact for each additional child) and hence be subjected to a lower marginal tax rate. Additionally, French civil servants pay a solidarity allowance of 1 percent.
OECD, NATO and CoE Employees of these organisations are exempt from paying income taxes in their country of residence. They also do not pay tax on their wage to their organisation. However, employees of these organisations do contribute to social security, on average 5.79 percent, 2.97 percent and 2.74 percent for NATO, OECD and CoE, respectively. Because the analysis excludes contributions to healthcare, the average contribution to healthcare is subtracted from the previous figures. This

METHODOLOGY 13
SEO AMSTERDAM ECONOMICS
results in an average social security contribution excluding healthcare of 3.5 percent for NATO, 0.45 percent for the OECD and 0.43 percent for CoE employees.4
EC At the EC, employees are exempt from paying taxes at their country of employment. However, they do pay income taxes to their employer, which go towards the EU budget. These tax contributions are determined based on a progressive tax scheme, ranging between 0 and 45 percent. On top of that a solidarity contribution has been implemented until 2023. It ranges between 6 and 7 percent, depending on the employee’s salary scale. Employees also pay an accident insurance contribution of 0.1 percent.
UN UN employees are exempt from paying income tax in their country of residence. They do pay an internal income tax to their organisation, called ‘staff assessment’. Staff assessment rates are derived from income tax rates applicable at the eight headquarter cities of the organizations in the common system (Geneva, London, Madrid, Montreal, New York, Paris, Rome and Vienna). The staff assessment rate increases with income bracket and differs depending on the family situation. The rate ranges from 11 to 30 percent for staff members in the professional and higher categories.
Specific taxes and charges While this study takes into account the different fiscal rules of each country and deducts each fiscal person’s income tax contribution from their gross income, there are other taxes and charges that this study does not account for. These include VAT and local taxes.
2.3.3 Pension contributions
The pension contributions included in the comparison are those that an employee has to pay based on his or her wage. Contributions that employers pay are not included in the comparison. Table 2.6 lists these contributions. In Germany civil servants do no pay a direct pension contribution, so all contributions are paid for by the employer.
Table 2.6 Pension contributions per organisation
Country/Organisation Pension contribution by employee (in 2016)
Netherlands 5.85% of gross wage Part of the income taxes levied over the first € 33,715 of taxable gross income are destined to the state pension, with a rate of 17.9% of the total 36.55%
France 9.94% of basic gross wage and 5% of gross bonus (up to a maximum of 20% of base salary)
Germany 0% OECD 9.5% of gross wage (hired until 2002)/9.3% of gross wage (hired from 2002) NATO 9.5% of basic wage (hired until 2005)/8% of basic wage (hired from 2005)
CoE 9.5% of gross wage (hired until 2003)/9.3% of gross wage (hired from 2003 to 2013) /9.4% of gross wage (hired from 2013)
EU 11.6% of gross wage UN 7.9% of gross wage
Source: SEO Amsterdam Economics
4 Figures provided by the organisations.
14 CHAPTER 2
SEO AMSTERDAM ECONOMICS
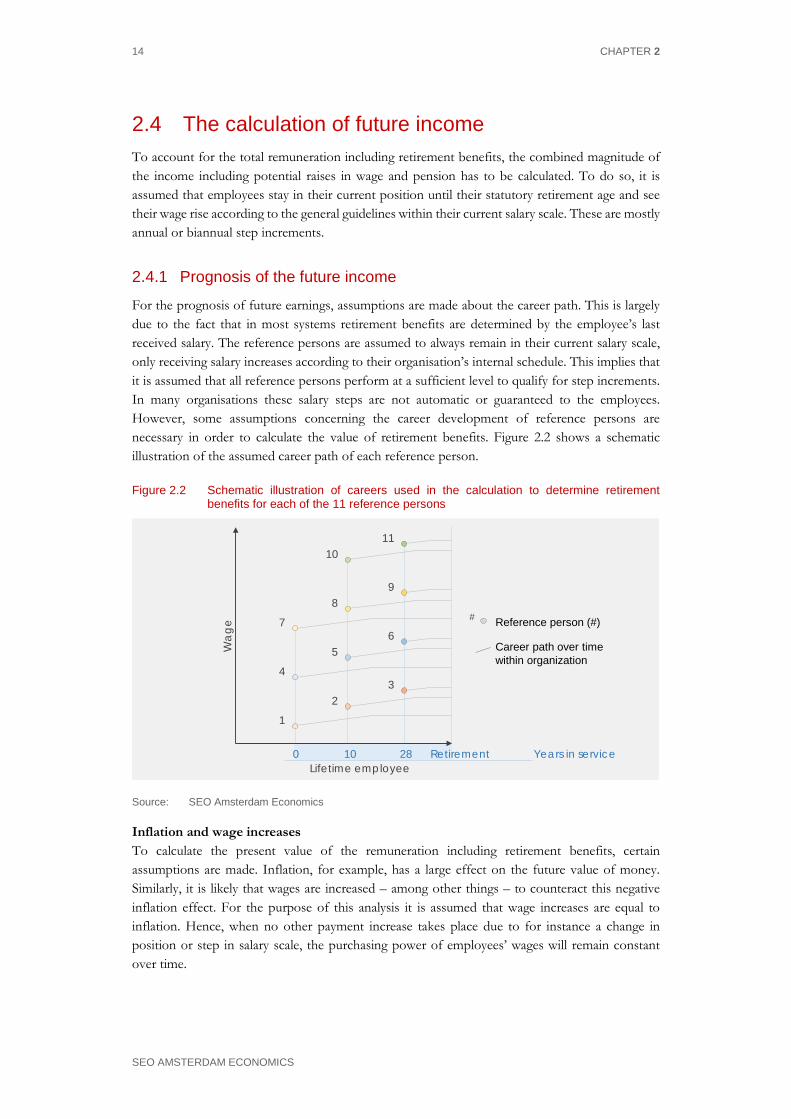
2.4 The calculation of future income To account for the total remuneration including retirement benefits, the combined magnitude of the income including potential raises in wage and pension has to be calculated. To do so, it is assumed that employees stay in their current position until their statutory retirement age and see their wage rise according to the general guidelines within their current salary scale. These are mostly annual or biannual step increments.
2.4.1 Prognosis of the future income
For the prognosis of future earnings, assumptions are made about the career path. This is largely due to the fact that in most systems retirement benefits are determined by the employee’s last received salary. The reference persons are assumed to always remain in their current salary scale, only receiving salary increases according to their organisation’s internal schedule. This implies that it is assumed that all reference persons perform at a sufficient level to qualify for step increments. In many organisations these salary steps are not automatic or guaranteed to the employees. However, some assumptions concerning the career development of reference persons are necessary in order to calculate the value of retirement benefits. Figure 2.2 shows a schematic illustration of the assumed career path of each reference person.
Figure 2.2 Schematic illustration of careers used in the calculation to determine retirement benefits for each of the 11 reference persons
0 10 28 Retirement
Wa
ge
Lifetime employee
Reference person (#)
Career path over timewithin organization
Years in service
1
4
7
2
5
8
3
6
9
1011
#
Source: SEO Amsterdam Economics
Inflation and wage increases To calculate the present value of the remuneration including retirement benefits, certain assumptions are made. Inflation, for example, has a large effect on the future value of money. Similarly, it is likely that wages are increased – among other things – to counteract this negative inflation effect. For the purpose of this analysis it is assumed that wage increases are equal to inflation. Hence, when no other payment increase takes place due to for instance a change in position or step in salary scale, the purchasing power of employees’ wages will remain constant over time.

METHODOLOGY 15
SEO AMSTERDAM ECONOMICS
Life table For the calculation of the future salary a so-called ‘life table’ is used. This table shows the probability of a reference person reaching a certain age. The analysis works with the life table used by ABP, the pension fund for all Dutch civil servants. The reason for using this table is that the statistics cover the whole population of civil servants in the Netherlands. So, the life table used only looks at public sector employees and not at the entire population. It is assumed that these values are the same for all of the employees no matter what their nationality or country of employment is. In other words, the average life expectancy of civil servants from developed countries is assumed to be equal. This implies that all reference persons are assumed to originate from a developed country with a similar life expectancy as the Netherlands. While this assumption might not be realistic, the effects on the remuneration including retirement benefits would be marginal and therefore negligible if there would be small variations in the life expectancy across employees.
2.4.2 The calculation of retirement benefits
This analysis also takes the expected values of retirement benefits into account. Therefore, the value of the pension rights is calculated based on the applicable pension rules and a life table. Obviously the value of the pension is uncertain, because every person’s life has a different length. In the most extreme case, some employees might not even reach their retirement age and therefore will not benefit from their pension at all. Even in these cases, though, the family of the deceased employee will often benefit in one form or another from the pension of their relative. This calculation includes the value of the partner pension that can be obtained when the employee dies.
Table 2.7 Overview of pension schemes
Type of pension Maximum amount of pension Statutory retirement age
Netherlands DB 70% of average wage + state pension (AOW) 67-71 (depending on age)
France DB 75% of final wage 67 (maximum) Germany DB 71.75% of final wage 65-67 OECD DB 70% of final wage 60 (until 2002)/63 (since 2002)
NATO DB (until 2005)/DC (since 2005)
70% of final wage (until 2005)/not fixed (since 2005) 60 (until 2005)/65 (since 2005)
CoE DB 70% of final wage 60 (until 2002)/63-65 (until 2013)/ 65 (since 2013)
EC DB 70% of final wage 60-62 (until 2004)/65 (until 2014)/66 (since 2014)
UN DB 70% of 3 highest wages in last 5 years
60 (until 1990)/62 (until 2014)/65 (since 2014)
Source: SEO analysis, Staff Regulations for each organisation.
To compare different types of systems, the values of retirements benefits are calculated. The comparison is thus not limited to pension contributions. That would only be correct for so-called ‘defined contribution’ (DC) pension schemes. This type of retirement scheme is currently only used by NATO. All other organisations and the countries use a defined benefit (DB) system, where employees receive a pension that is a certain proportion of their average or final wage. As previously mentioned, this implies that assumptions are made about the reference persons’ future wage. Table 2.7 presents a short overview of the pension systems.

16 CHAPTER 2
SEO AMSTERDAM ECONOMICS
All organisations have reformed their pension systems in the last 15 years. In most cases this has meant a reform of the statutory retirement age or of the pension contribution. In the case of the national governments this age has been increased for all residents, including the ones who were already working for the government at the time of the reform. However, the table shows that for the international organisations their current staff at the moment of the reform have been excluded. This means that in the analysis the 58-year-old reference persons at the international organisations have a retirement age of 60 as they are assumed to have been working at their organisation since 1983, while the retirement age is substantially higher for civil servants of the same age at the national governments. The younger staff of the international organisations also have a lower retirement age than those working for the national governments. The assumption that all reference persons started working at their employer at age 30 influences the calculation of the retirement benefits, as it results in the older reference persons falling in older pension regimes and accruing the maximum amount of pension rights (in most cases 70 percent of their final wage). Since the organisations state that almost all of their employees are recruited at a higher age, this means that the retirement benefits level of their actual staff is lower on average and that the average retirement age of actual staff with the same age as the reference persons can be higher (if they retire with a full pension) than the retirement age of the reference persons. The study thus also does not take the possibility of fractioned pensions of several employers into account, as the reference persons are assumed to work for the same organisation throughout their entire working life. It is assumed in the analysis that all reference persons work until the age that is necessary to receive maximum retirement rights. This means that the option of early retirement (with a lower than full pension), although possible in many cases, is not considered in the analysis. For example, in France, employees have the possibility of early retirement, which was gradually raised from 60 years old originally to 62 for those born after 1954. This means that all reference persons in this analysis would have the possibility to retire at age 62. However, the French pension scheme ensures that none of these reference persons would have built up their maximum pension rights of 75 percent of their last income by that time. For these cases, the French system guarantees a maximum pension for all employees who work until the age of 67 provided that they have served a certain minimum amount of time, which all of them have in this study.
Taxation of retirement benefits Employees working for international organisations often do not pay income tax in their country of employment, but they do pay tax on their pension once they retire. However, retired staff of NATO, the CoE and OECD receive an allowance worth 50 percent of the taxes levied on their retirement benefits. Pensioners of the EC and UN are fully compensated for their income tax on their pension after retirement if they live in the Netherlands after retirement, although EC employees still pay income tax to their organisation, just like they did when they were working there. For this analysis it is assumed that all expats will live in the Netherlands after their retirement. The reason for this assumption is that it makes the remuneration including retirement benefits more comparable. It is assumed that all pensioners are free to live in whichever country they desire (which holds true within the European Union for every EU citizen).
METHODOLOGY 17
SEO AMSTERDAM ECONOMICS
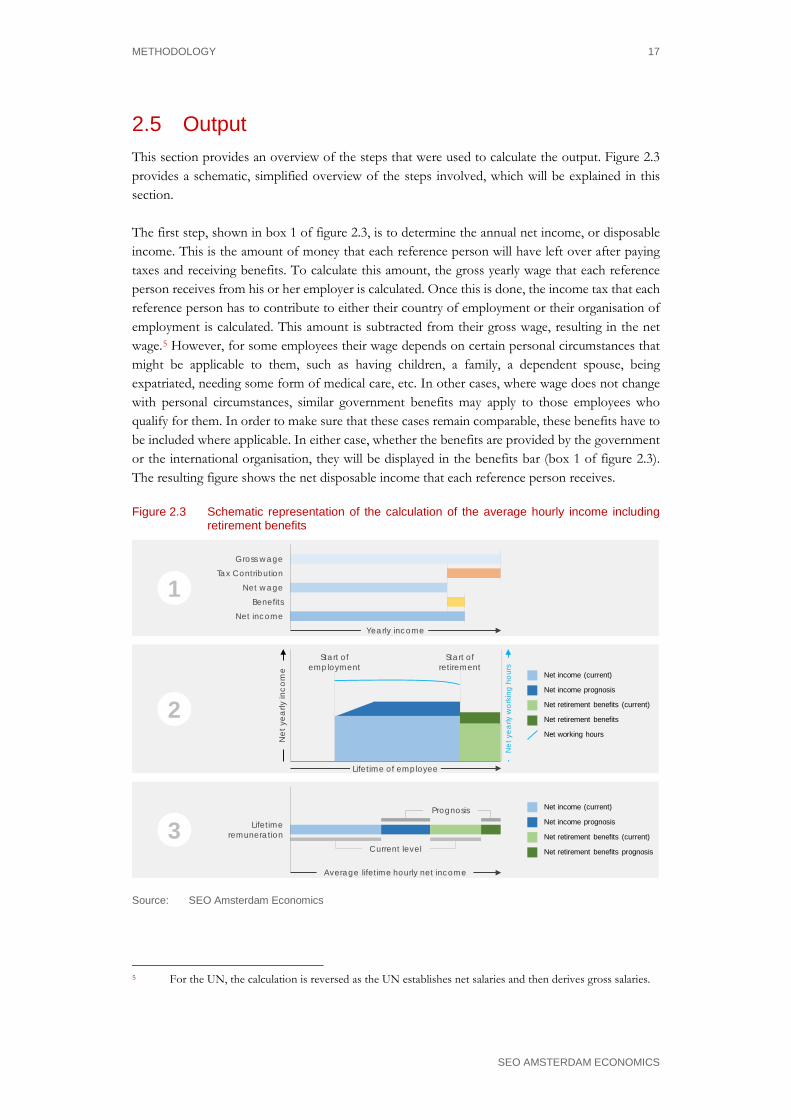
2.5 Output This section provides an overview of the steps that were used to calculate the output. Figure 2.3 provides a schematic, simplified overview of the steps involved, which will be explained in this section. The first step, shown in box 1 of figure 2.3, is to determine the annual net income, or disposable income. This is the amount of money that each reference person will have left over after paying taxes and receiving benefits. To calculate this amount, the gross yearly wage that each reference person receives from his or her employer is calculated. Once this is done, the income tax that each reference person has to contribute to either their country of employment or their organisation of employment is calculated. This amount is subtracted from their gross wage, resulting in the net wage.5 However, for some employees their wage depends on certain personal circumstances that might be applicable to them, such as having children, a family, a dependent spouse, being expatriated, needing some form of medical care, etc. In other cases, where wage does not change with personal circumstances, similar government benefits may apply to those employees who qualify for them. In order to make sure that these cases remain comparable, these benefits have to be included where applicable. In either case, whether the benefits are provided by the government or the international organisation, they will be displayed in the benefits bar (box 1 of figure 2.3). The resulting figure shows the net disposable income that each reference person receives.
Figure 2.3 Schematic representation of the calculation of the average hourly income including retirement benefits
Net
yea
rly w
orki
ng h
ours
Net
yea
rly in
com
e
Gross wage
Net wage
Net income
Tax Contribution
Benefits
Start ofemployment
Start ofretirement
Net income (current)
Net income prognosis
Net retirement benefits
Net retirement benefits (current)
Net working hours
Lifetimeremuneration
Current level
Prognosis
1
2
3Net income (current)
Net income prognosis
Net retirement benefits prognosis
Net retirement benefits (current)
Lifetime of employee
Yearly income
Average lifetime hourly net income
Source: SEO Amsterdam Economics
5 For the UN, the calculation is reversed as the UN establishes net salaries and then derives gross salaries.

18 CHAPTER 2
SEO AMSTERDAM ECONOMICS
The next step (box 2 in figure 2.3) is to calculate the total remuneration including retirement benefits for each reference person. To do so, each reference person’s net yearly income is plotted over time for the course of their entire career. After their retirement, however, they will still receive payments in the form of a pension. This is also plotted on the chart, after correction for taxes and applicable benefits. As can be seen in box 2 of figure 2.3, the net income and net pension are constant throughout the employee’s entire lifetime. These wage increases as a result of increases in steps within salary scales are illustrated in the figure as the ‘net income prognosis’. The ‘net pension prognosis’ is the pension that is related to these wage increases (the assumptions underlying each reference person’s career paths are explained in section 2.4.1). Next, the total remuneration including retirement benefits is determined. It consists of the wage and the value of the future pension. While there might be differences in yearly income between different organisations, there might also be differences in yearly hours spent working. To correct for this, the yearly amount of net hours that each employee works contractually is calculated. This is the amount of hours per year that each employee works at the employer’s headquarters after public holidays and vacation days have been deducted. Then, each reference person’s hourly remuneration including retirement benefits is calculated by dividing the sum of the expected values of all yearly income by the total lifetime amount of hours worked. Dividing the cumulative income including pension rights by the cumulative amount of lifetime hours worked results in the hourly remuneration including future income and pension rights (box 3 of figure 2.3). This represents the total net worth of income that each employee receives for each hour they work at the organisation. The result consists of four parts. The first is the net income, which is the amount of money that the employee will receive periodically during their time of employment for every hour worked at the organisation. The next component is the pension, i.e. the total amount of pension that the employees (or their family members) receive during their lifetime per hour worked. Finally, the net income prognosis and net pension prognosis represent the extra wage and pension that the reference persons will receive due to steps made within their salary scale. Combined they constitute the total hourly remuneration, and they can also be seen as the total income that each employee receives from their employer (and sometimes partially the government of their country of employment, as with government benefits).

COMPARING THE REMUNERATION AT INTERNATIONAL ORGANISATIONS WITH THAT AT NATIONAL GOVERNMENTS 19
SEO AMSTERDAM ECONOMICS
3 Income differences
On average, remuneration at international organisations is considerably higher than at national governments for similar jobs. This is the case after correcting for tax contributions and charges, benefits, working hours and postponed remuneration in the form of retirement benefits. In the cases explored, most reference persons would earn more if they would work at an international organisation than when they would fulfil a similar position at a national government. This result holds true in terms of annual gross income, annual disposable income and hourly wage, and also when looking at the hourly remuneration including retirement benefits and future steps within the current salary scale. Reference persons working for the Dutch government generally earn the least of all the organisations covered in net terms, partially due to the high tax contribution, low benefits, and modest annual gross salaries. In order to compare the differences in labour remuneration across the eight different organisations, the hypothetical incomes of 11 fictitious reference persons are analysed (see section 2 for more details about the methodology).
3.1 Base salary The first step in the analysis is to compare labour remuneration across organisations to determine the total yearly disposable income for each reference person in their first year. To do so, the gross base salary that corresponds to each job within each organisation is analysed. Then, based on this, the income tax and social security premiums that each reference person needs to pay to their respective country or organisation are calculated. Subtracting them from the gross salary gives the net annual wage. However, to fully capture the total disposable income, any allowances and benefits handed out by the employer or government are also taken into account. Figure 3.1 provides an overview of these figures. Corrected for purchasing power, the gross yearly salaries excluding pension contribution offered by the national governments range between approximately € 20,000 for the 30-year-old secretary in France and € 113,000 for the 58-year-old head of unit in France, with an average across all reference persons of around € 50,000 (see appendix A for a detailed overview of each reference person’s gross income, tax contribution, benefits and net disposable income in absolute terms). Comparing the average gross salaries corrected for purchasing power across the three national governments it is clear that those working in France earn the least, at around 80 percent of the average across the three countries. Reference persons working for the Dutch government earn a little over 1 percent less than the average across the three national governments, while those working in Germany earn close to 21 percent more (figure 3.1). These results reflect not only the difference in absolute gross wage, but also in the cost of living between Paris, The Hague and Berlin.

20 CHAPTER 3
SEO AMSTERDAM ECONOMICS
Figure 3.1 The difference between international organisations and national governments increases when taxes and charges are subtracted and benefits and allowances are added
0%
10%
20%
30%
40%
0%
20%
40%
60%
80%
Annual tax and social security contribution (excluding healthcare premiums) As percentage of gross wage
ECNL DE FR OECD CoE NATO UN
Annual benefits and allowances received As percentage of gross wage
ECNL DE FR OECD CoE NATO UN
Legend:
0
0. 5
1
1. 5
2
2. 5
0%
50%
100%
150%
200%
250%
Annual gross wage (excluding pension contribution)100% indicates the average gross wage across the three national governments for each reference person
ECNL DE FR OECD CoE NATO UN
0%
50%
100%
150%
200%
250%
Annual net income (after taxes, charges, benefits and allowances)100% indicates the average net income across the three national governments for each reference person
ECNL DE FR OECD CoE NATO UN
Employer averageNational governments average
Reference person (1 to 11 from left to right)
Source: SEO analysis Note: For each reference person the annual gross wage and annual net income are displayed relative to
the average amount that they would receive working at the national governments of the Netherlands, Germany and France. This value was calculated by dividing the amount that each reference person receives at each of the organisations (in euros and corrected for purchasing power parity) by the average amount the same reference person receives at the three national governments.
For an overview of all of the amounts in absolute terms, see appendix A.

INCOME DIFFERENCES 21
SEO AMSTERDAM ECONOMICS
The three CCR organisations, the OECD, CoE and NATO, pay respectively 4 percent, 4 percent and 12 percent more on average to each reference person than their counterparts at the national governments receive (figure 3.1). The differences in gross salaries between the three CCR organisations is largely due to the fact that the level within each salary scale depends on the country of employment. Furthermore, they are slightly affected by the differences in costs of living between France and Belgium. In terms of average gross wage excluding pension contribution reference persons working at the three CCR organisations stand at the bottom of the international organisations. At the EC, average gross salaries are 17 percent higher than for similar positions at the three national governments. Relative to their counterparts at the national governments the highest salaries can be found at the more senior positions and top level jobs. This means that on average the 58-year-old reference persons earn 36 percent more than they would if they would hold a similar job at a national government. For the reference persons aged 30 and 40 the difference is more modest, at 6 percent above the average at the national governments. From all international organisations, the jobs paying the highest average gross salaries can be found at the UN, offering earnings that are over 48 percent higher than for the same jobs at the national governments. Within the UN there is a clear difference between the salaries of the secretary and supporting policy officer on the one hand, and the policy makers and heads of unit on the other. The former jobs fall under the general services category, whereas the latter fall under the professional staff category. The latter group receives the so-called post adjustment, whereas general service staff do not receive this additional income. Tax contributions made by each reference person vary greatly across countries and employers (figure 3.1). The highest tax contributions are made by civil servants working for the Dutch government, who pay around 27 percent of their gross wage on average, followed by UN employees, with an average contribution of just over 24 percent. Employees of the EC pay around 19 percent on average, although the progressiveness of the taxation scheme ensures that the relative amount of the tax contribution increases with wage. Employees of the CCR organisations do not pay income tax, but they do a social security contribution. In Germany and France the average tax contribution across all 11 reference persons is around 20 and 19 percent of the annual gross wage, respectively. In the case of France, this includes social security contributions. The main reason for the relatively low contributions in France and Germany is the fact that for the purpose of calculating tax contributions taxable income can be spread over some or all members of the household. Since it is assumed that out of all 11 reference persons 4 have children and 8 have dependent spouses (lowering the average household income) this results in large tax discounts (see chapter 4.2 for a sensitivity analysis in which the assumption of a dependent spouse is dropped). Similarly, while the average tax contribution in Germany and France for the reference persons covered is relatively low, both countries have relatively high marginal tax rates for higher incomes, meaning that the tax contribution increases rapidly with gross wage. Civil servants working for the CCR organisations and the EC receive considerably higher allowances and benefits than their counterparts at the three national governments and the UN, both in absolute and relative terms (figure 3.1). On average, reference persons working for the

22 CHAPTER 3
SEO AMSTERDAM ECONOMICS
CCR organisations receive around 10 percent of their gross income in the form of family allowances, while at the EC this figure is higher at almost 19 percent. At the national governments the allowances are considerably lower than at international organisations. This is, in part, because civil servants working for the Dutch, German and French government receive benefits in the form of tax discounts, as is the case with children and dependent spouses. These types of benefits do not appear in figure 3.1 as allowances, but rather as a reduction in taxes levied. However, the total amount of benefits and allowances received by civil servants working for the national governments is considerably lower than that of employees of international organisations. The relatively high tax contributions combined with the low benefits received by Dutch civil servants increases the relative differences between their average annual net income and the three national government average. While in gross terms their salaries were 1 percent below the average for the three national governments, after taxes and benefits the average net income for reference persons working for the Dutch government lies almost 8 percent below the average at the national governments. France and Germany offer significant tax benefits to employed parents and families with a dependent spouse. In France, where the relative difference with other national governments was almost 20 percent less in gross terms, this difference slightly decreases in net terms to just below 19 percent. In Germany, where earnings were 21 percent higher in gross terms after tax contributions and benefits, this difference increases to 26 percent (figure 3.1). Across the CCR organisations, where tax contributions (including social security payments) are low and benefits and allowances are high relative to the other organisations studied (with the exception of the EC in the case of benefits and allowances), the average net yearly income across all reference persons is 44 percent higher at the OECD, 44 percent higher at the CoE and 50 percent higher at NATO compared to the average that each reference person receives at the national governments. The differences in net yearly income generally increase with job level and age, in some cases even reaching a relative difference of almost 70 percent, as is the case for the 58-year-old head of unit at NATO (figure 3.1). Reference persons working for the EC receive a net yearly income that is 44 percent higher on average than at the national governments for each job. In terms of net yearly income, the 30-year-olds without children or a spouse earn less than their older colleagues and also less than the average at the three national governments as they do not qualify for some of the benefits (figure 3.1). The UN is the only international organisation included in this comparison where tax contributions made by employees are considerably higher than the allowances and benefits received. Here the reference persons receive a net income that is 50 percent higher on average than for similar positions at the national governments. Again, there is a clear difference between the so-called general service jobs (secretary and supporting policy officer positions) and the professional jobs (policy maker and head of unit positions) (figure 3.1).

INCOME DIFFERENCES 23
SEO AMSTERDAM ECONOMICS
3.2 Hourly wage The next step is the calculation of the hourly wage based on the total yearly disposable income. The reason for this is that the yearly wage, or even the yearly disposable income, does not paint a complete picture of the labour remuneration since it does not take into account the amount of work expected of an employee in return for the received salary. If, for example, one employer pays twice as much as another but expects the employee to work three times as many hours, one can argue whether or not the former employer pays more than the latter. To calculate the hourly wage, the total amount of hours that each employee is contractually obliged to work is taken into account. Figure 3.2 provides an overview of the contractual working hours for full time employees (FTE) at each organisation. At some organisations, like the Dutch government and the EC, the amount of working hours required decreases with age. Therefore, the working times shown in figure 3.2 are in some cases only representative for the 30 year-old reference persons.
Figure 3.2 Overview of weekly working hours, leave days and total yearly working hours
17671759
167917511767
15951820
16550 200 400 600 800 1000 1200 1400 1600 1800 2000
0 0. 1 0. 2 0. 3 0. 4 0. 5 0. 6 0. 7 0. 8 0. 9 1
VN
Eur opese Com m iss ie
NA VO
Raad v Eu r.
OESO
Fr ankr ij k
Dui t s land
Ned erl and
0
UN
EC
NATO
CoE
OECD
FR
DE
NL
3024
3032
3025
3023
1017
1010
108
98
0 5 10 15 20 25 30 35 40 45
0 0. 1 0. 2 0. 3 0. 4 0. 5 0. 6 0. 7 0. 8 0. 9 1
VN
Eur opeseCom m iss ie
NA VO
Raad v Eu r.
OESO
Fr ankr ij k
Dui t s land
Ned erl and
FTE weekly hours Annual leave daysand public holidays
Average annual working hours
Paid public holidaysPaid vacation
4040
384040
3541
36
0
0
Source: SEO analysis Note: The average yearly working hours in this table are calculated by taking the amount of work days in
the average year, then subtracting the total amount of leave days that each employee is entitled to (vacation and public holidays) and multiplying the end result by the number of hours worked every day. When analysing the hourly remuneration including retirement benefits of reference persons, the actual number of working hours of each specific year is used rather than that of an average year.
As can be seen in figure 3.2, the contractual amount of work hours required by each organisation for FTEs varies greatly, as do the number of paid holidays and vacation days6. Additional paid home leave days only exist for expatriated staff at the OECD, CoE, NATO and the EC, which is covered in chapter 4.1 of this report. It should be noted that while the contractual amount of work hours is quantified in absolute terms, there are differences in the ways employees must fulfil them that can have a significant impact on their quality of life, but are not taken into account in this analysis. For instance, civil servants working for the Dutch government can be quite flexible when defining their working hours, often being able to decide how to spread them over the week. Among the organisations covered, French civil servants are the ones with the shortest official work week with 35 hours, followed by civil servants in the Netherlands with 36 and NATO employees with 38. It should be noted that in the case of NATO, the 38 hour work week is specific to UN employees stationed in Brussels. Were they stationed in Germany or the Netherlands, their
6 For the calculation of lifetime hourly income, changes in contractual working hours with age are taken into
account.

24 CHAPTER 3
SEO AMSTERDAM ECONOMICS
contractual work hours would be 40 per week. German civil servants have the longest work week with 41 hours. By combining the weekly hours with the total amount of paid vacation days and holidays, it can be seen that in an average year French civil servants have the least amount of contractual yearly working hours with 1595 hours, followed by the Dutch with 1655 hours. Of the three CCR organisations, OECD employees have the highest amount of working hours with 1767 hours (172 hours more than French civil servants), having two leave days less than employees of the CoE and working 2 hours per week longer than their counterparts at NATO. Due to their longer work weeks German civil servants officially work the most hours per year, with 224 more hours than their French counterparts. Dividing total annual net income by the total amount of hours worked, gives the hourly net salary. Strictly speaking, this result incorrectly includes allowances and benefits, such as a children’s allowance, which are sometimes fixed and therefore do not depend on the number of hours worked. However, for the purposes of this analysis and since it is assumed that employees have no choice with regard to the total amount of hours worked, these are included in the analysis of the total hourly remuneration. Figure 3.3 shows an overview of the net hourly income in an average year for each reference person covered. When analysing the hourly remuneration including retirement benefits, however, the actual working hours for each year are used.
Figure 3.3 In most cases the hourly remuneration at the international organisations is higher than at the national governments
Legend:
0%
50%
100%
150%
200%
250%
NL NL NL NL NL NL NL NL NL NL NL NL NL NL DE DE DE DE DE DE DE DE DE DE DE DE DE DE FR FR FR FR FR FR FR FR FR FR FR FR FR FR OECD OECD OECD OECD OECD OECD OECD OECD OECD OECD OECD OECD OECD OECD CoE CoE CoE CoE CoE CoE CoE CoE CoE CoE CoE CoE CoE CoE NATO NATO NATO NATO NATO NATO NATO NATO NATO NATO NATO NATO NATO NATO EC EC EC EC EC EC EC EC EC EC EC EC EC EC UN UN UN UN UN UN UN UN UN UN UN UN UN UN
Hourly net income100% indicates the average hourly net income across the three national governments for each reference person
ECNL DE FR OECD CoE NATO UN
Employer averageNational governments average
Reference person (1 to 11 from left to right)
Source: SEO analysis Note: For each reference person the hourly net income is displayed relative to the average amount that they
would receive working at the national governments of the Netherlands, Germany and France. This value was calculated by dividing the amount that each reference person receives at each of the organisations (in euros and corrected for purchasing power parity) by the average amount that the same reference person receives at the three national governments.
For an overview of all of the amounts in absolute terms, see appendix B.
The results in figure 3.3 show that employees of the three national governments receive a lower hourly wage on average than their counterparts at the international organisations. However, the average for civil servants working for the German government lies 18 percent above the three country average, in spite of working considerably more hours. In the Netherlands, the average hourly net income is almost 5 percent below the average across the three countries, while French civil servants earn 13 percent less than the national governments’ average on an hourly basis. In

INCOME DIFFERENCES 25
SEO AMSTERDAM ECONOMICS
the Dutch, French and German cases, the relative differences are quite homogenous across all reference persons within each country, although this is partly due to the indexation with respect to the average across the three national governments. Employees at the OECD, CoE and NATO receive a net hourly income that is respectively 38 percent, 40 percent and 52 percent higher on average than what their counterparts at the three national governments receive. As can be seen, when annual salaries are corrected for working hours the difference between NATO and the other two CCR organisations increases further. It should be noted, however, that the difference in working hours is entirely due to the fact the organisations studies are in different countries. Had we analysed NATO employees working in France, or OECD and CoE employees in Belgium, the difference would disappear. The differences in income across reference persons increase with age and job title (figure 3.3). At the EC, the average hourly income gap for each reference person with similar positions in the three national governments is 38 percent. Again, as was the case in the previous section, there is a clear distinction between employees with children and/or a dependent spouse and employees without (figure 3.3). For the UN, the clear distinction between the so-called general services (secretary and supporting policy officer positions) and the professional and higher categories (policy maker and head of unit positions) remains after correcting for hours worked. On average, UN employees receive a 44 percent higher hourly income than their counterparts working in similar positions at national governments. However, looking at each of these two categories separately, the employees in general services receive an hourly income that is just over 12 percent higher on average while for those in the professional and higher categories the average difference is 82 percent.
3.3 Remuneration including retirement benefits In addition to the hourly wage that each employee receives periodically in their first year of work, this study looks at the remuneration that each employee is entitled to during the rest of their career including their retirement benefits and salary steps increments. In other words, salary step increments (within the current salary level) and retirement benefits are taken into account. The assumption that reference persons stay in their current salary scale is made to determine the level of pension received, as this is often based on their final salary alone rather than their current one. An important exception is NATO, where staff hired after 2005 have a defined contribution scheme. That implies that their pension level is insecure and based on the total contributions and is not dependent on the final salary. In most cases, employees’ salaries increase annually or bi-annually if they perform satisfactory. For the organisations covered in this report, the remuneration progression follows the steps on the salary scale in the relevant staff regulations. This has been discussed more extensively in the previous section.

26 CHAPTER 3
SEO AMSTERDAM ECONOMICS
Figure 3.4 When retirement benefits are taken into account, the average total net remuneration is higher at the international organisations than at the countries
Legend:
-30%
-15%
0%
15%
30%
45%
NL NL NL NL NL NL NL NL NL NL NL NL NL NL DE DE DE DE DE DE DE DE DE DE DE DE DE DE FR FR FR FR FR FR FR FR FR FR FR FR FR FR OE CD OE CD OE CD OE CD OE CD OE CD OE CD OE CD OE CD OE CD OE CD OE CD OE CD OE CD Co E Co E Co E Co E Co E Co E Co E Co E Co E Co E Co E Co E Co E Co E NA TO NA TO NA TO NA TO NA TO NA TO NA TO NA TO NA TO NA TO NA TO NA TO NA TO NA TO EC EC EC EC EC EC EC EC EC EC EC EC EC EC UN UN UN UN UN UN UN UN UN UN UN UN UN UN
Net hourly income prognosisAs percentage of net hourly lifetime income
ECNL DE FR OECD CoE NATO UN
0%
25%
50%
75%
NL NL NL NL NL NL NL NL NL NL NL NL NL NL DE DE DE DE DE DE DE DE DE DE DE DE DE DE FR FR FR FR FR FR FR FR FR FR FR FR FR FR OE CD OE CD OE CD OE CD OE CD OE CD OE CD OE CD OE CD OE CD OE CD OE CD OE CD OE CD Co E Co E Co E Co E Co E Co E Co E Co E Co E Co E Co E Co E Co E Co E NA TO NA TO NA TO NA TO NA TO NA TO NA TO NA TO NA TO NA TO NA TO NA TO NA TO NA TO EC EC EC EC EC EC EC EC EC EC EC EC EC EC UN UN UN UN UN UN UN UN UN UN UN UN UN UN
Net hourly retirement benefitsAs percentage of net hourly lifetime income
ECNL DE FR OECD CoE NATO UN
0%
15%
30%
45%
60%
NL NL NL NL NL NL NL NL NL NL NL NL NL NL DE DE DE DE DE DE DE DE DE DE DE DE DE DE FR FR FR FR FR FR FR FR FR FR FR FR FR FR OE CD OE CD OE CD OE CD OE CD OE CD OE CD OE CD OE CD OE CD OE CD OE CD OE CD OE CD Co E Co E Co E Co E Co E Co E Co E Co E Co E Co E Co E Co E Co E Co E NA TO NA TO NA TO NA TO NA TO NA TO NA TO NA TO NA TO NA TO NA TO NA TO NA TO NA TO EC EC EC EC EC EC EC EC EC EC EC EC EC EC UN UN UN UN UN UN UN UN UN UN UN UN UN UN
Net hourly retirement benefits prognosisAs percentage of net hourly lifetime income
ECNL DE FR OECD CoE NATO UN
0%
50%
100%
150%
200%
250%
NL NL NL NL NL NL NL NL NL NL NL NL NL NL DE DE DE DE DE DE DE DE DE DE DE DE DE DE FR FR FR FR FR FR FR FR FR FR FR FR FR FR OE CD OE CD OE CD OE CD OE CD OE CD OE CD OE CD OE CD OE CD OE CD OE CD OE CD OE CD Co E Co E Co E Co E Co E Co E Co E Co E Co E Co E Co E Co E Co E Co E NA TO NA TO NA TO NA TO NA TO NA TO NA TO NA TO NA TO NA TO NA TO NA TO NA TO NA TO EC EC EC EC EC EC EC EC EC EC EC EC EC EC UN UN UN UN UN UN UN UN UN UN UN UN UN UN
Total hourly net lifetime remuneration100% indicates the average net hourly lifetime income across the three national governments for each reference person
ECNL DE FR OECD CoE NATO UN
Employer averageNational governments average
Reference person (1 to 11 from left to right)
Source: SEO analysis Note: For each reference person the total hourly remuneration including retirement benefits is displayed
relative to the average amount that they would receive working at the national governments of the Netherlands, Germany and France. This value was calculated by dividing the amount that each reference person receives at each of the organisations (in euros and corrected for purchasing power parity) by the average amount that the same reference person receives at the three national governments.
For an overview of all of the amounts in absolute terms, see appendix B.
INCOME DIFFERENCES 27
SEO AMSTERDAM ECONOMICS
Figure 3.4 shows the expected hourly remuneration for each reference person. The figures show the expected wage prognosis for every reference person relative to their current hourly net income, the expected retirement benefits that each reference person or their household will receive during their retirement for each hour worked relative to their current net income, as well as the expected increase in pension as their salary steps increase within their salary scale (called pension prognosis). Finally, all of these amounts are combined with the net hourly income calculated in section 3.2 to arrive at the total hourly remuneration including retirement benefits for each reference person in each of the organisations, which is shown in the last graph of figure 3.4. The steepest remuneration progression in terms of income can be found in France, with an average increase of 15 percent with respect to the current income, followed by the UN with 13 percent. Officials working for the Dutch government and the CCR organisations follow, with average salary increases of 9 percent in the Netherlands, 8 percent at the OECD and NATO and 6 percent at the CoE. As might be expected, in most cases the income of the 30-year-olds is expected to grow most over the years relative to their starting income, as they are always currently in the lowest salary step of their scale. In other cases, the figure shows negative income prognoses, which may seem surprising. However, this does not mean that the reference persons’ salary decreases over time, but rather that it does not increase enough to make up for the loss of other benefits and allowances such as children’s benefits, for which they will no longer qualify over time as their children grow older (figure 3.4) and which are not included in their pension rights. There is no straightforward method to assign built up pension to hours worked in a DB pension scheme. The reason is that the amount received does not necessarily have a linear relationship with either the time worked or the salary received over time. In most schemes, the proportion of the last salary received increases as the employee’s years of service increase, with a certain maximum. However, often employees can earn the right to a maximum pension earlier, by reaching a certain age and number of years in service. For the calculation of retirement benefits, this analysis follows the assumption that all reference persons have been working since the age of 30 at their current organisation and retire when they reach the statutory retirement age (see table 3.1). This means that they have earned the right to receive a pension in all cases where applicable. For all reference persons where past income is relevant for determining pension rights, it is assumed that they have built up pension during their previous working years for an amount similar to that earned in 2016. For example, for the 58-year-old reference persons working for the Dutch government it is assumed that between the ages of 30 and 57 every year the reference persons have been building up the same amount of pension that they did at the age of 58. It should be noted that in reality, employees at many of the international organisations leave their position without any pension rights as their employment period does not reach the required minimum of 10 years in order to qualify, which is the case at the OECD, CoE, NATO and the EC. As an example, at the OECD less than 30 percent of the current staff have built up pension rights. In these cases the employees are reimbursed for their pension contribution, but given the rationale behind mandatory pension contributions one can question whether these reimbursements make up for the lack of a future pension security. However, for the sake of analysis the comparison is made between employees who do qualify for a pension. The final results shown in figure 3.3

28 CHAPTER 3
SEO AMSTERDAM ECONOMICS
more closely resemble the situation in which no pension rights are built up. On the other hand, the consequences of leaving ones job on pension is not unique to the international organisations, as retirement benefits of civil servants working for the national governments could also be affected by an early departure. When comparing the total hourly net remuneration including retirement benefits across employers, employees at national governments earn considerably less than they would in similar jobs at international organisations. On average, the reference persons working for the French government earn the least, with an hourly remuneration that is 6 percent below that of the three country average for each position, followed by those working for the Dutch government with a negative difference of almost 3 percent. German reference persons, on the other hand, earn almost 9 percent more than the average at the national governments (figure 3.4). Reference persons employed at the CCR organisations receive, on average, the highest remuneration including retirement benefits of all organisations covered excluding the UN, with a difference with respect to the national government average of 40 percent for the OECD, 40 percent for the CoE and 34 percent for NATO. The differences in net hourly pension between NATO and their the other two CCR organisations is largely due to the fact that in the former, all those employed since 2005 have a DC rather than a DB pension. When retirement benefits and remuneration progression are included in the analysis, the average relative difference in remuneration between EC employees and those working at the national governments decreases to 28 percent. The gap with the average remuneration received at the national governments increase with age as well as job level. As was the case with the CCR organisations, the hourly remuneration including retirement benefits of the 30-year-old employees at the EC is considerably lower than that of their older counterparts hired under the old staff regulations and their salaries are indeed in some cases lower than that of the employees at national governments. At the UN, the reference persons receive almost 80 percent more on average than the average hourly remuneration including retirement benefits across the national governments. However, these results should be interpreted with care. Without including pension and prognoses (figure 3.3) the remuneration gap with the average at the three national government is 44 percent, on average. While the career prospects and pension scheme offered to UN employees is attractive relative to the many of the other organisations studied, to a large extend the reason behind this sudden increase is a result of the assumption that when retired, reference persons move to the Netherlands, and therefore discounted to Dutch costs of living. Hence, while the salary of UN employees is discounted for New York costs of living, their pension, which is based on their New York salary, is discounted on PPP figures for The Hague. Finally, the difference between reference persons working in general services and those working in professional staff categories becomes apparent, as it was in the results discussed previously.
COMPARING THE REMUNERATION AT INTERNATIONAL ORGANISATIONS WITH THAT AT NATIONAL GOVERNMENTS 29
SEO AMSTERDAM ECONOMICS
4 Sensitivity analysis and other benefits
This chapter presents results for the case where the assumptions made in the previous chapter do not hold and also discusses some non-quantitative secondary benefits. The results show the impact on remuneration of expatriation allowances at the international organisations. It also shows that the impact having dependent spouses does not considerably alter the results. Many of the benefits that employees of the different organisations are entitled to have not been included in the quantitative results shown in section 3. The reasons for excluding them vary. Some are complex, such as is the case with healthcare, and require many assumptions that would have complicated the comparability of the results. Others are of a conditional character that only apply to specific personal circumstances and would therefore distort the overall picture that applies to the vast majority of employees. However, this does not mean that these are not significant benefits with a potentially great impact on the quality of life of the employees. Therefore, a remuneration comparison would not be complete without looking at them closely.
4.1 Expatriation allowance The results shown in section 3 were calculated based on the assumption that employees working for international organisations do not qualify for an expatriation allowance. In this section, the same comparison is made but with the assumption that the reference persons working for the international organisations do qualify for said allowance and also for additional home leave days (if applicable). For reasons of simplicity and in line with the analysis of section 3, it is still assumed that the reference persons will move to the Netherlands once they reach retirement age. As can be seen from figure 4.1, the expat allowance raises the hourly lifetime remuneration quite substantially at the relevant organisations. As was to be expected, the effect of adding the expat allowance is similar across all reference persons employed at the three CCR organisations (NATO, CoE and OECD). Taking this allowance into consideration, employees of the OECD, CoE and NATO receive respectively 58 percent, 58 percent and 54 percent more income than they would receive when working for the national governments. As can be seen, the 30-year-old reference persons working at the CCR organisations (from left to right: the 1st, 4th and 7th in each organisation) do not experience a great payment increase, since the new regulations state that expats only receive the allowance during their first 5 years of service.

30 CHAPTER 4
SEO AMSTERDAM ECONOMICS
Figure 4.1 With expatriation allowance the remuneration at the international organisations rises, except at the UN
0
0.5
1
1.5
2
2.5
3
0%
50%
100%
150%
200%
250%
300%
NL NL NL NL NL NL NL NL NL NL NL NL NL NL DE DE DE DE DE DE DE DE DE DE DE DE DE DE FR FR FR FR FR FR FR FR FR FR FR FR FR FR OECD OECD OECD OECD OECD OECD OECD OECD OECD OECD OECD OECD OECD OECD CoE CoE CoE CoE CoE CoE CoE CoE CoE CoE CoE CoE CoE CoE NATO NATO NATO NATO NATO NATO NATO NATO NATO NATO NATO NATO NATO NATO EC EC EC EC EC EC EC EC EC EC EC EC EC EC UN UN UN UN UN UN UN UN UN UN UN UN UN UN
ECNL DE FR OECD CoE NATO UN
Change in total hourly net remuneration if reference persons were expatriated100% indicates the average net hourly lifetime income across the three national governments for each reference person
Legend:
Individual change
Reference person (1 to 11 from left to right)
Average change
Employer averageNational government average
Source: SEO analysis Note: For each reference person the total hourly remuneration including retirement benefits is displayed
relative to the average amount that they would receive working at the national governments of the Netherlands, Germany and France. This value was calculated by dividing the amount that each reference person receives at each of the organisations (in euros and corrected for purchasing power parity) by the average amount that the same reference person receives at the three national governments.
For an overview of all of the amounts in absolute terms, see appendix B.
For EC staff the impact of the expat allowance accounts for 22 percent of the average hourly lifetime remuneration at the national governments. As a result, the average hourly lifetime remuneration is 50 percent higher than the average for those who work at the national governments when the expat allowance is taken into account. The impact of adding the expatriation allowance is relatively homogenous across ages and job levels.
4.2 Dependent spouse Another assumption that was made in the analysis of section 3 is that spouses were dependent on the reference persons’ income (for those who have a spouse) and thus do not earn an income themselves. This section examines the effect of this assumption on the results obtained in section 3 for each reference person, by assuming that the reference persons’ spouses have an income equal to their own. It is important to bear in mind that these results only show the difference in remuneration for each reference person, so while the individual lifetime income may decrease the total household income will likely increase due to the spouse’s additional salary. For simplicity and continuity, it is still assumed that the reference persons will move to the Netherlands once they reach retirement age.

SENSITIVITY ANALYSIS AND OTHER BENEFITS 31
SEO AMSTERDAM ECONOMICS
Figure 4.2 The effect of reference persons who no longer have dependent spouses is high across all employers analysed
0
0.5
1
1.5
2
2.5
3
0%
50%
100%
150%
200%
250%
300%
NL NL NL NL NL NL NL NL NL NL NL NL NL NL DE DE DE DE DE DE DE DE DE DE DE DE DE DE FR FR FR FR FR FR FR FR FR FR FR FR FR FR OECD OECD OECD OECD OECD OECD OECD OECD OECD OECD OECD OECD OECD OECD CoE CoE CoE CoE CoE CoE CoE CoE CoE CoE CoE CoE CoE CoE NATO NATO NATO NATO NATO NATO NATO NATO NATO NATO NATO NATO NATO NATO EC EC EC EC EC EC EC EC EC EC EC EC EC EC UN UN UN UN UN UN UN UN UN UN UN UN UN UN
Change in total hourly net remuneration if reference persons’ spouses were not dependent100% indicates the average net hourly lifetime income across the three national governments for each reference person
ECNL DE FR OECD CoE NATO UN
Legend:
Individual change
Reference person (1 to 11 from left to right)
Average change
Employer averageNational government average
Source: SEO analysis Note: For each reference person the total hourly remuneration including retirement benefits without a
dependent spouse is displayed relative to the average amount that they would receive working at the national governments of the Netherlands, Germany and France with a dependent spouse (as calculated in section 3). This value was calculated by dividing the amount that each reference person receives at each of the organisations (in euros and corrected for purchasing power parity) by the average amount that the same reference person receives at the three national governments.
For an overview of all the amounts in absolute terms, see appendix B.
As can be seen from figure 4.2, remuneration decreases for all reference persons with a partner. In France the effect is smallest, closely followed by the Netherlands. Without dependent spouses, employees at the French government earn 7 percent less than the average across the national governments, while in the Netherlands they earn 4 percent less. For Germany, on the other hand, the change is larger than for its neighbouring countries since taxes are levied on the total household income in the former case and on the total income of both partners in the latter. This means that households with a single salary receive significant tax benefits. As a result, the net hourly remuneration including retirement benefits of a German civil servant drops from 9 percent to roughly 2 percent above the national government average calculated in section 3. In the UN, allowances depend both on dependent children and spouses. Since the 30-year-old reference persons have neither children nor a spouse, they are unaffected. The 40-year-old reference persons are only slightly affected, as they will continue to qualify for the allowance as long as their children are dependent on them. Only the 58-year-old reference persons, for whom the received allowance depends only on their partner’s salary, are affected. The average effect is relatively small, as can be seen in figure 4.2: they still earn 76 percent more than each reference person’s average remuneration at the national governments, as calculated in section 3. Employees of the OECD, CoE, NATO and the EC are also affected. However, as can be seen, even without receiving an allowance for a dependent spouse the average net hourly income is still higher than the average at the Dutch, German and French governments, i.e. around 36 percent higher at the OECD, 36 percent at the CoE, 30 percent at NATO and 24 percent at the EC (figure 4.2).

32 CHAPTER 4
SEO AMSTERDAM ECONOMICS
4.3 Healthcare coverage Another aspect that requires special attention in this analysis is the fact that the international organisations provide coverage for their employees’ medical expenses, while the civil servants of the investigated countries fall under national insurance systems. All international organisations covered in this report provide all necessary medical coverage for employees working at their headquarters, and also for their families if they do not have access to other medical insurance. That is the case in this study as spouses are assumed not to earn an income themselves. With the national systems, partners have to pay their own insurance premiums. The systems are compared in table 4.1. This comparison is based on the costs of insurance and own contributions in the case of a medically necessary hospital visit for an employee or his or her spouse. The comparison therefore does not take into account possible coverage for non-hospital treatments like physiotherapy, dental treatments or medical devices like glasses. As in the rest of this study, employees of international organisations are assumed to be working at the headquarters of their organisation. This is relevant as several international organisations have different healthcare plans for different countries.
Table 4.1 France, the EC, CoE and OECD have relatively inexpensive healthcare coverage for employees
System Coverage of hospital visit Partner included Pensioners
included Yearly
contribution (employee)
NL National system Partial (system with deductibles) No In national system Fixed around
€ 1,200
FR National system Partial (system with contributions) No In national system 0.75% of wage
DE National system Full No In national system 9% of wage
UN Employer coverage
Partial (80% of most costs)
Yes, extra contribution
required
Yes, have to pay contribution 4 to 11 % of wage
OECD Employer coverage
Partial (system with contributions) Yes Yes, have to pay
contribution 2.50% of wage
EC Employer coverage
Partial (80-85% of most costs) Yes Yes, have to pay
contribution 1.70% of wage
CoE Employer coverage
Full (for selected hospitals) Yes Yes, have to pay
contribution 2% of wage
NATO Employer coverage
Partial (80-85% of most costs)
Yes, premium includes allowances
Yes, have to pay contribution
3.75 % of wage (including
allowances)
Source: SEO analysis
Most coverage systems are partially financed by contributions from the employees. In all cases, except for the Netherlands, these premiums are wage dependent. For the Netherlands, the employee premium is independent of the wage level. The percentages differ by organisation and country. In Germany, the employees have to pay around 9 percent of their wage and fully finance the system. In France, the premium is lower. The premium in the Netherlands equals 2 percent in the case of a net yearly income of € 60,000. For persons with a low income the contribution is subsidized, but all reference persons earn more than the maximum threshold for that subsidy. In

SENSITIVITY ANALYSIS AND OTHER BENEFITS 33
SEO AMSTERDAM ECONOMICS
these countries, in addition to the employees, the employers also pay health insurance contributions based on the wages. The contribution rate is around 2 to 4 percent for employees of the international organisations. A special case is the UN, where employees at the headquarters can choose between different insurance plans with different premiums, which are higher than the premiums at the other organisations. NATO has a slightly higher premium, which is related to the higher health risks of its employees because it is a military organisation. Most organisations work with a system where the premiums are set in such a way that the organisation pays 2/3 of the total health insurance costs and the employees 1/3, whereby these premiums are adjusted yearly depending on the total medical consumption in the previous year. The plans differ with regard to the coverage that they offer. The Netherlands works with full coverage. However, the first € 400 of expenses are not covered and have to be paid by the insured person. France and the OECD work with minor contributions depending on the type of care that is covered. The insurance plans of Germany and the Council of Europe cover all expenses, at least if they are related directly to healthcare like hospital visits. The UN, EC and NATO insurance plans cover 80-85 percent of expenses.


COMPARING THE REMUNERATION AT INTERNATIONAL ORGANISATIONS WITH THAT AT NATIONAL GOVERNMENTS 35
SEO AMSTERDAM ECONOMICS
5 Conclusions
The remuneration of civil servants of the international organisations under review (OECD, NATO, CoE, EC and UN) is relatively high compared to that of civil servants working for the Dutch, German and French governments. This holds both in terms of annual net income as well as hourly net lifetime remuneration. Contractual working hours are higher at international organisations than in the Netherlands and France. The results show that the remuneration of civil servants of the international organisations under review is relatively high compared to those of civil servants of the national governments of Germany, France and the Netherlands. Employees of the OECD, NATO, CoE, EC and the UN all earn more than employees who work in similar positions for the national governments of the countries under consideration. This is true for almost all staff levels and ages, from secretaries to heads of unit. For the UN this is in line with its statutory principle that it should pay its higher employees equal to or better than the member states and its lower employees equal to employees in similar jobs at their duty station. Also NATO has a similar internal principle. The EC has pushed through a reform where new staff are put in a lower salary scale than current staff. For current starters, the difference in remuneration level between the organisations and countries lower as a result of these reforms, or in some cases even below the remuneration at the national governments This study compares gross and net wages as well as the full value of the net income obtained through working, including pension rights. The comparison shows that gross wages at the international organisations are in some cases a bit higher than those of the civil servants of countries, while in others comparable, but that the difference in net income is very substantial. Employees of these international organisations do not pay income tax in their country of residence or origin, although those working for the EC and UN do pay tax to their own organisation. Employees of the OECD, NATO and CoE pay a relatively small social security contribution. Combined with the relatively generous family allowances and benefits offered to employees of international organisations, this level of taxation often results in a yearly net income that exceeds the yearly gross income. The level of special non-taxable allowances varies between international organisations and national governments. Employees of the OECD, NATO, CoE and the EC are entitled to a large number of allowances compared to the national civil servants. This is true in particular for employees with young children. Expat allowances are not part of the main study. In the cases of the OECD, NATO and CoE they have been made temporary for employees hired after 2011. The UN does not offer an expat allowance, but does give additional days off to expatriated employees in higher jobs. The home leave days are also part of the OECD, NATO and CoE compensation packages. Except for staff hired since 2005 at NATO, all international organisations under consideration work with a defined benefit pension plan based on an employee’s final salary. This system leads to a relatively high pension income for these employees. Furthermore, these retirement benefits are not subject to income tax for EU and UN pensioners (if they retire in the Netherlands). For the OECD, NATO and CoE half of the income tax on the retirement benefits is compensated by an allowance. The costs of this defined benefit pension plan based on the final salary have been a

36 CHAPTER 5
SEO AMSTERDAM ECONOMICS
reason for the Netherlands, for example, to change to a pension plan based on the average salary instead of the final salary in 2004. The OECD has a standard retirement age of currently hired staff of 63, whereas the other organisations and the national governments have retirement ages between 65 and 67 for staff who are currently hired. However, the UN, OECD, NATO and CoE still have a retirement age of 60 for staff who have been hired before 1990 (UN), 2002 (OECD, NATO) or 2003 (CoE). Recent reforms that have increased the retirement age in France, Germany and the Netherlands apply to all employees, including older cohorts. This is contrary to the reforms at the international organisations under consideration, where staff who were already employed at the time of the reform have kept their lower retirement age and old system of pension contributions. Another difference that increases the purchasing power of employees of the OECD, CoE and EC, is the system of health insurance for their staff. These organisations all provide a relatively cheap health insurance package with coverage for the family, including spouses who are not insured themselves (for example if they are expats and do not have a job). This implies that employees of these international organisations pay a relatively low premium for the coverage that they get. These organisations have a policy to pay two thirds of the total sum of healthcare costs, whereas their employees pay one third. France has health insurance that is comparably attractive for employees, a system that is also mainly paid for by all national tax payers and employers. The UN has a relatively unattractive healthcare insurance system for its employees as the contributions are relatively high, whereas the coverage is average. Finally, the comparison of wages and labour benefits is based on several assumptions, some with a minor impact on the results and some with a larger impact. The most important assumption is that there is no selection in the type of civil servants who work for international organisations, which means that these employees are similar to civil servants of national governments with respect to relevant characteristics and skills. For example, it is assumed that there is no difference in productivity, ability or motivation. Furthermore, it is assumed that the number of working hours is equal to the amount specified in employees’ contracts, and remuneration is compared accordingly. Structural differences in working hours compared to contractual hours are therefore not taken into account.

COMPARING THE REMUNERATION AT INTERNATIONAL ORGANISATIONS WITH THAT AT NATIONAL GOVERNMENTS 37
SEO AMSTERDAM ECONOMICS
Appendix A 2016 yearly wages
Figure A. 1 Overview of annual gross wage, tax and social security contribution and charges paid, allowances and benefits received and net wage per reference person
40-year-old 58-year-old30-year-old
Dep
artm
ent h
ead
Secr
etar
ySu
ppor
ting
polic
y of
ficer
Polic
y m
aker
Gross wage(excluding pension contribution)
x1.000 €
Tax and social security contribution
Benefits and allowances
Net disposable income
0
10
20
30
40
0
20
40
60
0
20
40
60
0
10
20
30
40
50
0
20
40
60
0
20
40
60
80
0
20
40
60
80
0
30
60
90
120
0
30
60
90
120
0
40
80
120
160
0
50
100
150
200
1 2 3
4 5 6
7 8 9
1110Reference person#
Source: SEO analysis

38 APPENDIX A
SEO AMSTERDAM ECONOMICS
Table A. 1 Decomposition of annual net income at current level for each reference person and employer
Reference person Employer
Gross wage Tax and social
security contribution
Benefits and allowances (net)
Gross salary Gross family allowance
Family and children’s allowance
Expat allowance
1
NL € 24,863 € 0 -€ 4,665 € 0 € 0
DE € 32,352 € 0 -€ 6,366 € 0 € 0
FR € 20,235 € 0 -€ 3,222 € 0 € 0
OECD € 27,479 € 0 -€ 124 € 0 € 0
CoE € 28,247 € 0 -€ 121 € 0 € 0
NATO € 31,880 € 0 -€ 1,116 € 0 € 0
EC € 24,885 € 0 -€ 3,301 € 0 € 0
UN € 31,485 € 0 -€ 6,818 € 0 € 0
2
NL € 32,978 € 0 -€ 4,839 € 1,732 € 0
DE € 38,193 € 4,511 -€ 5,599 € 4,761 € 0
FR € 21,217 € 813 -€ 2,212 € 0 € 0
OECD € 35,719 € 0 -€ 161 € 9,349 € 0
CoE € 33,542 € 0 -€ 144 € 8,301 € 0
NATO € 41,247 € 0 -€ 1,444 € 9,606 € 0
EC € 31,856 € 0 -€ 4,381 € 22,650 € 0
UN € 43,551 € 0 -€ 9,697 € 1,568 € 0
3
NL € 37,305 € 0 -€ 8,433 € 0 € 0
DE € 46,968 € 1,704 -€ 7,649 € 0 € 0
FR € 26,744 € 0 -€ 3,501 € 0 € 0
OECD € 41,872 € 0 -€ 188 € 2,776 € 0
CoE € 43,099 € 0 -€ 185 € 2,857 € 0
NATO € 46,321 € 0 -€ 1,621 € 3,071 € 0
EC € 46,140 € 0 -€ 7,163 € 3,090 € 0
UN € 49,569 € 0 -€ 11,280 € 1,568 € 0
4
NL € 32,233 € 0 -€ 8,021 € 0 € 0
DE € 39,582 € 0 -€ 8,908 € 0 € 0
FR € 22,324 € 0 -€ 3,676 € 0 € 0
OECD € 31,555 € 0 -€ 142 € 0 € 0
CoE € 32,434 € 0 -€ 139 € 0 € 0
NATO € 35,405 € 0 -€ 1,239 € 0 € 0
EC € 28,381 € 0 -€ 3,843 € 0 € 0
UN € 35,003 € 0 -€ 7,662 € 0 € 0
5
NL € 46,838 € 0 -€ 11,661 € 1,732 € 0
DE € 47,725 € 4,511 -€ 8,274 € 4,761 € 0
FR € 24,986 € 936 -€ 2,756 € 0 € 0
OECD € 40,577 € 0 -€ 183 € 9,670 € 0
CoE € 38,905 € 0 -€ 167 € 8,656 € 0

39
SEO AMSTERDAM ECONOMICS
NATO € 45,921 € 0 -€ 1,607 € 9,910 € 0
EC € 41,107 € 0 -€ 6,076 € 22,860 € 0
UN € 50,294 € 0 -€ 11,471 € 1,568 € 0
6
NL € 52,313 € 0 -€ 15,820 € 0 € 0
DE € 57,676 € 1,704 -€ 10,978 € 0 € 0
FR € 35,244 € 0 -€ 6,589 € 0 € 0
OECD € 43,057 € 0 -€ 194 € 2,855 € 0
CoE € 44,305 € 0 -€ 191 € 2,937 € 0
NATO € 46,978 € 0 -€ 1,644 € 3,115 € 0
EC € 67,365 € 0 -€ 13,113 € 3,570 € 0
UN € 55,274 € 0 -€ 12,782 € 1,568 € 0
7
NL € 37,305 € 0 -€ 10,518 € 0 € 0
DE € 49,765 € 0 -€ 12,893 € 0 € 0
FR € 27,530 € 0 -€ 5,097 € 0 € 0
OECD € 42,536 € 0 -€ 191 € 0 € 0
CoE € 43,720 € 0 -€ 188 € 0 € 0
NATO € 44,077 € 0 -€ 1,543 € 0 € 0
EC € 46,510 € 0 -€ 7,247 € 0 € 0
UN € 69,426 € 0 -€ 16,031 € 0 € 0
8
NL € 59,438 € 0 -€ 17,863 € 1,732 € 0
DE € 57,574 € 4,511 -€ 11,861 € 4,761 € 0
FR € 43,006 € 1,174 -€ 8,512 € 0 € 0
OECD € 54,353 € 0 -€ 245 € 10,581 € 0
CoE € 55,926 € 0 -€ 240 € 9,782 € 0
NATO € 56,328 € 0 -€ 1,971 € 10,589 € 0
EC € 67,365 € 0 -€ 13,113 € 23,454 € 0
UN € 88,955 € 0 -€ 21,936 € 5,377 € 0
9
NL € 66,991 € 0 -€ 23,398 € 0 € 0
DE € 69,840 € 1,704 -€ 15,077 € 0 € 0
FR € 71,511 € 0 -€ 20,064 € 0 € 0
OECD € 72,579 € 0 -€ 327 € 4,812 € 0
CoE € 72,741 € 0 -€ 313 € 4,823 € 0
NATO € 74,144 € 0 -€ 2,595 € 4,916 € 0
EC € 110,395 € 0 -€ 32,081 € 4,544 € 0
UN € 117,177 € 0 -€ 30,611 € 7,433 € 0
10
NL € 59,438 € 0 -€ 17,863 € 1,732 € 0
DE € 91,284 € 4,511 -€ 24,255 € 4,761 € 0
FR € 62,723 € 1,174 -€ 15,674 € 0 € 0
OECD € 77,938 € 0 -€ 351 € 12,142 € 0
CoE € 80,193 € 0 -€ 345 € 11,387 € 0
NATO € 80,764 € 0 -€ 2,827 € 12,183 € 0
EC € 86,236 € 0 -€ 20,398 € 23,881 € 0

40 APPENDIX A
SEO AMSTERDAM ECONOMICS
UN € 151,270 € 0 -€ 43,091 € 9,919 € 0
11
NL € 82,048 € 0 -€ 31,830 € 0 € 0
DE € 96,660 € 1,704 -€ 25,305 € 0 € 0
FR € 113,558 € 0 -€ 39,550 € 0 € 0
OECD € 105,199 € 0 -€ 473 € 6,975 € 0
CoE € 103,048 € 0 -€ 443 € 6,832 € 0
NATO € 108,748 € 0 -€ 3,806 € 7,210 € 0
EC € 124,905 € 0 -€ 39,097 € 4,872 € 0
UN € 176,229 € 0 -€ 53,545 € 12,902 € 0
Source: SEO analysis Note: All amounts are in euros, corrected for purchasing power parity so that each euro has the same
acquisitive power in the country of employment as it does in Belgium. Tax contribution includes social security contributions where applicable. The gross annual salary listed in this table is after payment of the pension contribution. Only German
and French civil servants pay taxes over their family allowance. In some cases, the family and children’s allowance is a combination of multiple allowances. Similarly, the expat allowance listed in the table can be a combination of expat allowances for the employees as well as their family members (if applicable).
The net annual income is the sum of all amounts.

COMPARING THE REMUNERATION AT INTERNATIONAL ORGANISATIONS WITH THAT AT NATIONAL GOVERNMENTS 41
SEO AMSTERDAM ECONOMICS
Appendix B Remuneration including retirement benefits
Figure B. 1 Overview of hourly remuneration including retirement benefits per reference person (€ per hour)
40-year-old 58-year-old25-year-old
Dep
artm
ent h
ead
Secr
etar
ySu
ppor
ting
polic
y of
ficer
Polic
y m
aker
Retirement benefites prognosis
Retirement benefits
Income prognosis
Income
Reference person
05
1015202530
-10
0
10
20
30
40
0
15
30
45
05
101520253035
-100
1020304050
0
10
20
30
40
50
0102030405060
-101030507090
110
0
20
40
60
80
100
-101030507090
110130
020406080
100120140
1 2 3
4 5 6
7 8 9
1110#
Source: SEO analysis

42 APPENDIX B
SEO AMSTERDAM ECONOMICS
Table B. 1 Decomposition of expected total net hourly remuneration including retirement benefits
Reference person Employer
Net lifetime remuneration including retirement benefits
Income Income prognosis Retirement benefits Retirement benefits prognosis
1
NL € 12.08 € 2.33 € 3.50 € 1.37
DE € 14.11 € 2.33 € 2.41 € 1.66
FR € 10.55 € 0.72 € 2.99 € 0.55
OECD € 15.27 € 4.11 € 3.21 € 3.10
CoE € 15.85 € 3.58 € 3.09 € 2.84
NATO € 18.08 € 4.87 € 1.56 € 0.77
EC € 12.00 € 2.00 € 2.98 € 0.88
UN € 13.77 € 4.44 € 3.74 € 5.15
2
NL € 17.86 -€ 0.86 € 5.26 € 0.13
DE € 22.74 -€ 0.34 € 4.44 € 1.40
FR € 12.29 € 1.08 € 2.98 € 1.53
OECD € 25.08 € 0.62 € 5.51 € 2.88
CoE € 23.49 € 1.13 € 4.02 € 4.87
NATO € 29.04 € 0.24 € 0.94 € 0.46
EC € 27.87 -€ 5.83 € 4.62 € 1.76
UN € 19.78 € 2.20 € 8.92 € 4.19
3
NL € 17.49 € 0.98 € 5.05 € 0.50
DE € 22.28 € 0.01 € 5.77 € 0.01
FR € 14.42 € 0.48 € 2.30 € 2.41
OECD € 24.83 € 0.00 € 8.69 € 0.25
CoE € 25.79 € 0.00 € 8.99 € 0.28
NATO € 28.08 € 0.00 € 8.96 € 0.24
EC € 23.39 € 0.32 € 2.04 € 6.54
UN € 22.26 € 0.00 € 13.55 € 0.00
4
NL € 14.48 € 3.45 € 4.53 € 1.48
DE € 16.66 € 2.99 € 2.85 € 2.09
FR € 11.57 € 2.37 € 2.05 € 2.89
OECD € 17.54 € 4.72 € 3.70 € 3.46
CoE € 18.20 € 4.11 € 3.58 € 3.13
NATO € 20.08 € 5.41 € 1.70 € 0.86
EC € 13.64 € 2.28 € 3.41 € 0.99
UN € 15.27 € 5.14 € 4.11 € 5.81
5
NL € 22.07 -€ 0.69 € 6.76 € 0.53
DE € 26.46 -€ 0.21 € 5.59 € 1.28
FR € 14.37 € 1.95 € 2.45 € 3.49
OECD € 27.96 -€ 1.58 € 7.87 € 0.62
CoE € 26.70 -€ 0.02 € 6.99 € 2.08
NATO € 31.87 -€ 1.93 € 1.35 € 0.09
EC € 32.18 -€ 5.28 € 5.96 € 2.22

43
SEO AMSTERDAM ECONOMICS
UN € 22.55 € 1.56 € 11.20 € 3.46
6
NL € 22.11 € 1.43 € 6.79 € 0.62
DE € 26.28 € 0.01 € 6.78 € 0.02
FR € 17.78 € 0.70 € 3.17 € 2.94
OECD € 25.53 € 0.23 € 4.89 € 4.41
CoE € 26.51 € 0.00 € 9.21 € 0.30
NATO € 28.48 € 0.00 € 9.07 € 0.25
EC € 32.14 € 0.40 € 3.68 € 8.48
UN € 24.60 € 0.00 € 15.14 € 0.00
7
NL € 16.02 € 5.25 € 4.17 € 2.86
DE € 20.02 € 3.10 € 3.84 € 1.88
FR € 13.92 € 5.33 € 1.70 € 5.07
OECD € 23.64 € 0.70 € 7.03 € 0.41
CoE € 24.53 € 0.71 € 6.60 € 0.37
NATO € 25.00 € 0.74 € 2.46 € 0.12
EC € 21.83 € 3.44 € 5.55 € 1.53
UN € 29.82 € 6.86 € 9.68 € 8.52
8
NL € 25.89 -€ 0.26 € 8.21 € 0.84
DE € 29.86 € 0.40 € 6.31 € 1.68
FR € 22.13 € 6.18 € 3.10 € 7.31
OECD € 36.12 € 5.05 € 5.77 € 8.15
CoE € 36.89 € 3.07 € 5.76 € 9.14
NATO € 38.17 € 5.57 € 0.87 € 1.36
EC € 43.20 -€ 4.11 € 9.72 € 3.16
UN € 40.43 € 7.82 € 12.28 € 18.15
9
NL € 26.41 € 1.38 € 8.54 € 0.69
DE € 30.66 € 0.59 € 5.58 € 2.66
FR € 31.91 € 1.88 € 2.22 € 9.42
OECD € 43.03 € 0.56 € 5.35 € 10.07
CoE € 43.53 € 0.00 € 15.21 € 0.06
NATO € 44.94 € 0.58 € 5.00 € 9.71
EC € 46.06 € 0.53 € 8.41 € 9.86
UN € 52.49 € 0.50 € 13.69 € 19.41
10
NL € 25.89 € 2.92 € 7.10 € 2.95
DE € 41.44 -€ 2.29 € 10.71 -€ 0.52
FR € 29.91 € 8.52 € 4.04 € 10.22
OECD € 50.10 € 7.95 € 8.72 € 10.51
CoE € 51.40 € 5.07 € 8.78 € 11.80
NATO € 52.97 € 8.76 € 1.42 € 1.90
EC € 49.88 -€ 3.76 € 12.27 € 3.61
UN € 65.95 € 7.18 € 29.84 € 17.34
11 NL € 30.42 € 1.40 € 10.34 € 0.56

44 APPENDIX B
SEO AMSTERDAM ECONOMICS
DE € 39.67 € 0.02 € 10.35 € 0.00
FR € 45.91 € 2.33 € 9.06 € 6.54
OECD € 62.37 € 0.75 € 9.21 € 12.44
CoE € 61.66 € 0.00 € 21.05 € 0.00
NATO € 65.92 € 0.00 € 20.56 € 0.00
EC € 50.41 € 0.60 € 8.85 € 11.16
UN € 75.71 € 0.00 € 49.00 € 0.00
Source: SEO analysis Note: All amounts are in euros, corrected for purchasing power parity so that each euro has the same
acquisitive power in the country of employment as it does in Belgium.