Comparing the Non-Cystic Fibrosis Bronchiectasis Patients ...
35
University of Kentucky University of Kentucky UKnowledge UKnowledge Theses and Dissertations--Public Health (M.P.H. & Dr.P.H.) College of Public Health 2016 Comparing the Non-Cystic Fibrosis Bronchiectasis Patients with Comparing the Non-Cystic Fibrosis Bronchiectasis Patients with Non-Tuberculous Mycobacteria (NTM) and Non-NTM Infections Non-Tuberculous Mycobacteria (NTM) and Non-NTM Infections Maninder Bir Singh University of Kentucky Follow this and additional works at: https://uknowledge.uky.edu/cph_etds Part of the Public Health Commons Right click to open a feedback form in a new tab to let us know how this document benefits you. Right click to open a feedback form in a new tab to let us know how this document benefits you. Recommended Citation Recommended Citation Singh, Maninder Bir, "Comparing the Non-Cystic Fibrosis Bronchiectasis Patients with Non-Tuberculous Mycobacteria (NTM) and Non-NTM Infections" (2016). Theses and Dissertations--Public Health (M.P.H. & Dr.P.H.). 99. https://uknowledge.uky.edu/cph_etds/99 This Graduate Capstone Project is brought to you for free and open access by the College of Public Health at UKnowledge. It has been accepted for inclusion in Theses and Dissertations--Public Health (M.P.H. & Dr.P.H.) by an authorized administrator of UKnowledge. For more information, please contact [email protected].
Transcript of Comparing the Non-Cystic Fibrosis Bronchiectasis Patients ...

University of Kentucky University of Kentucky
UKnowledge UKnowledge
Theses and Dissertations--Public Health (M.P.H. & Dr.P.H.) College of Public Health
2016
Comparing the Non-Cystic Fibrosis Bronchiectasis Patients with Comparing the Non-Cystic Fibrosis Bronchiectasis Patients with
Non-Tuberculous Mycobacteria (NTM) and Non-NTM Infections Non-Tuberculous Mycobacteria (NTM) and Non-NTM Infections
Maninder Bir Singh University of Kentucky
Follow this and additional works at: https://uknowledge.uky.edu/cph_etds
Part of the Public Health Commons
Right click to open a feedback form in a new tab to let us know how this document benefits you. Right click to open a feedback form in a new tab to let us know how this document benefits you.
Recommended Citation Recommended Citation Singh, Maninder Bir, "Comparing the Non-Cystic Fibrosis Bronchiectasis Patients with Non-Tuberculous Mycobacteria (NTM) and Non-NTM Infections" (2016). Theses and Dissertations--Public Health (M.P.H. & Dr.P.H.). 99. https://uknowledge.uky.edu/cph_etds/99
This Graduate Capstone Project is brought to you for free and open access by the College of Public Health at UKnowledge. It has been accepted for inclusion in Theses and Dissertations--Public Health (M.P.H. & Dr.P.H.) by an authorized administrator of UKnowledge. For more information, please contact [email protected].

STUDENT AGREEMENT: STUDENT AGREEMENT:
I represent that my capstone and abstract are my original work. Proper attribution has been
given to all outside sources. I understand that I am solely responsible for obtaining any needed
copyright permissions. I have obtained needed written permission statement(s) from the
owner(s) of each third-party copyrighted matter to be included in my work, allowing electronic
distribution (if such use is not permitted by the fair use doctrine) which will be submitted to
UKnowledge as Additional File.
I hereby grant to The University of Kentucky and its agents the irrevocable, non-exclusive, and
royalty-free license to archive and make accessible my work in whole or in part in all forms of
media, now or hereafter known. I agree that the document mentioned above may be made
available immediately for worldwide access unless an embargo applies.
I retain all other ownership rights to the copyright of my work. I also retain the right to use in
future works (such as articles or books) all or part of my work. I understand that I am free to
register the copyright to my work.
REVIEW, APPROVAL AND ACCEPTANCE REVIEW, APPROVAL AND ACCEPTANCE
The document mentioned above has been reviewed and accepted by the student’s advisor, on
behalf of the advisory committee, and by the Director of Graduate Studies (DGS), on behalf of
the program; we verify that this is the final, approved version of the student’s capstone including
all changes required by the advisory committee. The undersigned agree to abide by the
statements above.
Maninder Bir Singh, Student
David Mannino, MD, Committee Chair
Corrine Williams, ScD, MS, Director of Graduate Studies
1
Comparing the Non-Cystic Fibrosis Bronchiectasis Patients with Non-Tuberculous Mycobacteria (NTM)
and Non-NTM Infections
Capstone Project Paper
A paper submitted in partial fulfillment of the requirement for the degree of Master of Public Health in the University Of Kentucky College Of Public Health
By
Maninder Bir Singh
Lexington, Kentucky
April 19, 2016
_______________________________
David M Mannino, MD, Chair
_______________________________
Sabrina Brown, DrPH, MPH
_______________________________
W. Jay Christian, PhD, MPH

2
Abstract
Objective
The objective of the study is to compare the Non-Cystic Fibrosis Bronchiectasis patients with
Non Tubercular Mycobacteria (NTM) and Non-NTM infection and determine if the NTM and
Non-NTM groups are different.
Methods
Data from the COPD Foundation’s Bronchiectasis Research Registry (BRR) was used in the study
(n=1660).Logistic regression, Cox proportional hazards regression, and Kaplan Meier survival
analysis were used to analyze the data.
Results.
The study found odds ratio for having NTM infection for age to be 1.02 and for gender to be
2.34, after adjusting for all other variables in the multivariate logistic regression, with the p-
value of <0.001. The study found the Log rank test for the Kaplan Meier survival to be 0.7656,
which is greater than p-value of 0.05, and hence found that we did not have strong enough
statistical evidence to say that the two groups have different survival.
Conclusion
This study, one of the first study done using the BRR’s database found age and gender to be
significantly associated with NTM infection, but did not found any difference in survival among
patients of the two groups. Further studies need to be done to expand the horizon of this less
researched topic.

3
Introduction
Bronchiectasis is defined as the abnormal dilatation of the airways, caused by the destruction
of the muscular and elastic components of their walls, due to recurrent infection and
inflammation. The term “Bronchiectasis” is derived from the Greek words “bronchia”, which
means branches of the main bronchi and “ektasis” which means stretching, thereby making
bronchiectasis as the stretching of the branches of the main bronchi. Bronchiectasis was first
described by Laennec in 1819. 1
“This affection of bronchia is always produced by chronic catarrh, or by some other disease
attended by long, violent, and often repeated fits of coughing.”
R. T. H. Laennec. 2
Bronchiectasis was later explained by Sir William Osler in the late 19th century, who himself was
one of the famous patient with non-cystic fibrosis bronchiectasis. He had severe chest
infections for many years suggesting underlying bronchiectasis and died in 1919 as a result of
lung abscess and empyema, which were complications of pneumonia. 3 The introduction of
contrast bronchoscopy by Jean Sicard, which permitted the precise imaging of the destructive
changes in airways, was another landmark in the history of bronchiectasis. Further work on
Bronchiectasis was done by Reid in 1950,s, when he correlated the bronchography with
pathological specimens. 4
4
Bronchiectasis, which has lost its relevance in the late 20th century in the developed world and
was once thought to be decreasing in prevalence, is now being diagnosed with increasing
frequency in United States as well as around the world.
Prevalence
The prevalence of Bronchiectasis is increasing in United States of America. According to a study
by Seitz and colleagues, who analyzed the 5% sample of the Medicare part –B outpatient
databases for bronchiectasis ICD-9 codes, bronchiectasis prevalence increased 8.74% annually
from 2000 to 2007. Prevalence was also shown to increase with age, peaking at ages 80-84
years, and was higher in females, even after the logistic regression controlling for race and CT
scans (OR=1.36). The prevalence of bronchiectasis was also found to be highest in the Asian
population. 5
According to a study done by Weycker et al, based on the insurance claim database, it is
estimated that in the United States at least 110,000 patients are currently being treated for
non- cystic fibrosis bronchiectasis. They further reported that, among person aged 18 to 34
years in United States, the prevalence rate of non-cystic fibrosis bronchiectasis is 4.2 per
100,000, and for those greater than 75 years of age 272 per 100,000. 6 According to Tsang and
Tipoe the prevalence rate of non-cystic fibrosis bronchiectasis is about 16.67 per 100,000
person in Aukland, New Zealand and the rate is 16.4 per 100,000 population among children
and hospital admissions in Hong Kong. 7 There is a great burden caused by non-cystic fibrosis
bronchiectasis on the patients as they require more frequent outpatient visits, longer hospital
stays and more extensive therapy as compared to matched controls .According to study done
5
by Weycker et al in 2001, patients with bronchiectasis averaged two additional days in the
hospital, 6.1 additional outpatient encounters, and 27.2 more days of antibiotic therapy than
those without the disorder. The study also found that total medical expenditures were $5681
higher for bronchiectasis patients. Non-cystic fibrosis bronchiectasis is a great financial burden
with annual costs of approximately $630 million for the United States. 6 A study done by Joish
et al, found first year total medical care expenditure after diagnosis increased by $2319 per
person per year. 8 The mortality rate for bronchiectasis ranged from 10-16% for the
observation period of approximately 4 years. The low Forced Expiratory Volume in one second
(FEV1) values and advanced dyspnea scores were found to be closely related to mortality. 9 An
association between the etiology of bronchiectasis and mortality rate has not been definitely
established, but a recent study done by Geommine and colleagues showed that idiopathic
bronchiectasis has the lowest death rate among all causes of bronchiectasis. 10
Pathophysiology
Bronchiectasis can affect just a section of one lung, or a complete lung, or both of the lungs.
The development of bronchiectasis is a complex process, and the initial damage that can lead to
development of bronchiectasis usually occurs in childhood, symptoms of bronchiectasis
however are usually delayed for months or years. In developing countries the main cause of
bronchiectasis is childhood infections such as measles and whooping cough, but in United
States these causes have decreased due to the childhood vaccines and development of
antibiotics. 11 9 4
6
Cole’s Vicious Cycle model is the generally accepted explanation for development of
bronchiectasis.9 Cole’s model explains that pulmonary infections or tissue injury develop an
exaggerated inflammatory response in the individuals predisposed to bronchiectasis. This
inflammatory response in turn is responsible for the structural damage of the airways, which
can lead to further infection. The structural abnormalities lead to stasis of mucus, which in turn
leads to chronic continuous infection and the cycle persists. The mucus itself is often abnormal,
more complex and the tracheobronchial clearance also has been shown to be slower in patients
with bronchiectasis, thereby leading to increased chances of infection and airway damage. This
retained mucus can overtime lead to formation of plugs and airway obstruction, thereby
further leading to more advanced bronchiectasis.
Regardless of the underlying cause, bronchiectasis results when the bronchial and bronchiolar
wall damage due to inflammation and infection leads to vicious cycle of airway injury. Mikaemi
et al, showed increased chemotactic activity of sputum in the patients with bronchiectasis.
Studies show that the some systemic markers of inflammation are also increased in patients
with bronchiectasis. There are studies showing that the anatomic factors, chronic infection and
inflammation, and host defense all play an important role in the development of bronchiectasis,
but these roles are poorly understood, especially for non-cystic fibrosis bronchiectasis. 12
Signs and Symptoms
The clinical course and symptoms of non-cystic fibrosis bronchiectasis vary to a great extent from
one patient to another. Some patients have minor or no symptoms at all, or only during

7
exacerbations, whereas some patients have them regularly. The most common sign and
symptoms of non-cystic fibrosis bronchiectasis includes cough that occurs for months or years,
daily production of large amounts of sputum, which may contain mucus, trapped particles and
pus, dyspnea or shortness of breath, chest pain, wheezing, clubbing of the fingers, hemoptysis,
weight loss, and decreased exercise tolerance. 13
A large number of patients with non-cystic fibrosis bronchiectasis have frequent exacerbations
of their symptoms, which is defined as having at least four of the following symptoms:
increased cough and dyspnea, change in sputum production, increased wheezing, fever over
380 C, decreased tolerance to exercise, fatigue, lethargy, decrease in pulmonary function,
changes in chest sounds or radiographic changes consistent with new infectious process. 10 The
rate of these exacerbations were found to be 1.5 per year in the countries of Ireland, United
Kingdom and North America. The studies have shown that in the patients with non-smoking
non-cystic fibrosis bronchiectasis there is loss of lung function with an average decline in the
forced expiratory volume in one second (FEV1) of about 50 ml per year. 12 The various signs and
symptoms associated with bronchiectasis worsens as the disease progress, and hence leads to
the decreased quality of life.
Etiology
Based on the etiology, the major cause of bronchiectasis in the developed world is the genetic
disease of cystic fibrosis. So based on this etiology, we can widely divide bronchiectasis into
two major categories:

8
1. Cystic Fibrosis Bronchiectasis
2. Non-Cystic Fibrosis Bronchiectasis
There is a renewed interest in the non-cystic fibrosis bronchiectasis, mainly due to the fact
that we may be able to decrease its incidence or improve the quality of life for
bronchiectasis patients by the use of different vaccinations and modern antibiotics. There
are various causes that can lead to development of non-cystic fibrosis bronchiectasis.
Table showing etiologies for non-cystic fibrosis bronchiectasis :9 10
Post infections: • Viral • Bacterial • Fungal • Atypical Mycobacterial
Idiopathic
Traction: •Post-tuberculosis fibrosis • Post-radiation fibrosis • Collagen vascular disease
• Twisting or displacement of airways after lobar resection
Cilia abnormalities: Primary ciliary dyskinesia
Immune deficiency: •Immunoglobulin deficiency • HIV infection • Job’s syndrome
Injury: • Pneumonia/childhood infections • Aspiration • Smoke inhalation
Obstruction: • Tumor • Foreign body • Lymphadenopathy
Autoimmune disease: • Rheumatoid arthritis • Sjogren’s syndrome
Connective tissue disorder: • Tracheobronchomegaly (Mounier-Kuhn syndrome)
• Marfan’s syndrome • Cartilage deficiency (William Campbell Syndrome)
Hypersensitivity: •Allergic Bronchopulmonary Aspergillosis
Inflammatory bowel disease: • Ulcerative colitis • Crohn’s disease

9
Malignancy: • Chronic lymphocytic lymphoma
•Stem cell transplantation, graft versus host reaction
α-1 antitrypsin deficiency
Yellow nail syndrome
Young’s syndrome
According to an extensive study by Pasteur and colleagues in 2000, 53% of the cases of non-
cystic fibrosis bronchiectasis are idiopathic. 14 Another study showed that only 26% of the
cases remained idiopathic. 15 Both studies, however concluded that the most common
etiology was post-infectious, contributing to about 1/3 of the cases. Research has thus
shown that there is a significant relationship between NTM infection and bronchiectasis.
Non Tuberculous Mycobacteria consists of mycobacteria other than Mycobacterium
tuberculosis and Mycobacterium leprae. Almost 160 different species have been isolated,
many of which may cause disease in humans. NTM are ubiquitous in the environment and
have been isolated from the soil and water, which are presumed source of infection. The
route of contact with NTM is most likely by inhalation of aerosols from natural surface
water and hot water systems. Some studies showed that patients with gastroesophageal
reflux disease (GERD) associated bronchiectasis might be more predisposed to NTM
infection, but the study done by Mirsaeidi et al. found no difference with regard to GERD for
patients with non-cystic fibrosis bronchiectasis in relation to NTM infection. 16 Despite the
fact that NTM are ubiquitous, relatively few individuals develop NTM infection, thereby
10
leading to speculation that there may be a predisposition to develop NTM infection. Non
Tuberculous Mycobacteria pulmonary disease is most common in elderly women with
bronchiectasis and low body mass index, a condition known as “Lady Windermere
Syndrome”, which was first used by Reich and Johnson to describe the pattern of NTM
infection in elderly white women without underlying lung disease. Non Tuberculous
Mycobacteria infection is also commonly associated with conditions such as scoliosis,
pectus excavatum, mitral valve prolapse and cystic fibrosis transmembrane conductance
regulator mutation. 17
There is no evidence of transmission of NTM from human to human or from animals , but
recent studies have shown some possibility of indirect human to human transmission. A
recent case report from United Kingdom demonstrated infection by identified strains of
Mycobacterium kansasii in a couple in London, where no common source of infection was
identified. 18 19
There is no mandatory reporting of NTM disease, and it is difficult to differentiate
between colonization and active infection, thus it is difficult to estimate the exact
prevalence of NTM. Due to improved diagnostic techniques and increased focus on NTM
infection in non-cystic fibrosis bronchiectasis patients, the rates of isolation of NTM are
increasing in the recent years. From 2004 to 2006 the prevalence of NTM infection in the
United States of America increased from 1.4 to 6.6 per 100,000 persons. 20 The rate of all
NTM reports increased from 0.9 per 100,000 in 1995 to 2.9 per 100,000 in 2006, in
Northern Ireland, Wales and England. 21 According to the American Thoracic Society
criteria, the rate of NTM infection in patients with bronchiectasis varies from under to 30%.

11
16 A recent meta-analysis found the overall prevalence of NTM in bronchiectasis patients to
be 9.3%. 21 A study done by Mirsaeidi and colleagues found that MAC is the most frequent
species isolated in the bronchiectasis patients, accounting for 50% to 80% of all NTM
infection. The study also found that NTM is more frequently isolated from female patients
with age 65 years or more. In addition, the study also found that one of the most important
risk factor for acquiring NTM infection is childhood pulmonary infection. 16 A study done by
Han and colleagues showed that MAC infection increases with increasing postmenopausal
years, but is rare in women younger than 50 , suggesting that estrogen has a protective
effect.22
Non Tuberculous Mycobacteria infection is commonly associated with co-infections with
other NTM species and microorganisms. According to a study by Wickremasinghe and
colleagues, P. aeruginosa was the most common copathogen isolated (52% of patients). The
second most common copathogen was S. aureus with a percentage of 28%, followed by
H.influenza(12%), A.fumigatus(4%), C.albicans (8%), and S.maetophila(4%). 23
Most bacteria involved in bronchiectasis form biofilms, which makes the effective
antimicrobial therapy more challenging, as a hydrated matrix of extracellular
polysaccharides and proteins protect them from the host environment. 9
DIAGNOSIS
Diagnosis of bronchiectasis is accomplished using wide range of different tests to rule in or
rule out certain conditions. The various procedures and tests used to diagnose Non-cystic
fibrosis bronchiectasis are;24 23 25

12
Chest CT scan: It is the most common test used for the diagnosis of bronchiectasis. It
is a painless test that creates a precise picture of a patient’s airways and shows the
exact location and extent of damage to the lungs.
Blood Tests: Various types of blood tests are used to detect an underlying condition
that can lead to bronchiectasis, such as immunodeficiency.
Sputum culture: Sputum culture is the standard test for evaluating airway
colonization and infection in non-cystic fibrosis bronchiectasis. Sputum culture can
grow a causative organism, which is very helpful in choosing a treatment antibiotic.
Lung function tests: Various lung function tests, such as forced expiratory volume in
one second (FEV1), are used in the diagnosis of non-cystic fibrosis bronchiectasis.
These tests measure the amount of air a patient can inhale or exhale, and also check
the flow of air, thereby revealing the extent of damage to the lungs.
Sweat test: A sweat test is used to rule out the diagnosis of cystic fibrosis related
bronchiectasis.
Bronchoscopy: In the patients who are unable to expectorate, or if the sputum
culture is negative but the patient has unfavorable clinical outcome, a bronchoscopy
is indicated. During bronchoscopy a flexible tube with a video camera called the
bronchoscope, is passed through the nose or mouth of the patient after anesthesia,
and it gives a video image of the airway and to help in diagnosis.
PREVENTION

13
Widespread use of vaccination programs in childhood, especially for whooping cough and
measles, has likely reduced the prevalence of bronchiectasis but, in addition to universal
childhood vaccination, appropriate and careful treatment of childhood pneumonia is also
important.
Due to a lack of early symptoms, a diagnosis of bronchiectasis may be delayed or initially
diagnosed as a lower respiratory infection. Among those with cystic fibrosis there is good
evidence that prognosis of bronchiectasis can be improved through antibiotic therapy and
other drugs that improve mucociliary clearance, but more studies are needed for the non-
cystic fibrosis bronchiectasis. 14
METHODS AND MATERIAL
This study analyzed the secondary data obtained from the Bronchiectasis Research Registry
(BRR) to compare the characteristics and survival of the non-cystic fibrosis bronchiectasis
patients with Non- Tuberculous Mycobacteria (NTM) and non-NTM infections. Despite the
significant impact of non-cystic fibrosis bronchiectasis in the terms of morbidity, quality of
life, and financial burden, there are limited data sources for examining characteristics of
patients with non- cystic fibrosis bronchiectasis. In order to better understand the
characteristics of patients with non-cystic fibrosis bronchiectasis, the BRR was established
within the COPD Foundation in 2008. The BRR gathers data from the patients aged 18 or
older with non-cystic fibrosis bronchiectasis. The BRR collects data from patients at 13 sites
in the United States, located in the states of Colorado, Connecticut, Florida, Minnesota,
New York, North Carolina, Pennsylvania, Texas, Washington D.C. and the Washington state

14
with the special focus on bronchiectasis and NTM disease. Some states have more than one
center. The data is collected with the help of different forms at individual level and is stored
in form of 13 different data sets. In Bronchiectasis Research Registry, the baseline data sets
includes variables related to demographics, microbiologic, medical history and therapeutic
information etc., and is stored in a central web based database. We merged these different
data sets to create a single data set to analyze the characteristics of the patients with non-
cystic fibrosis bronchiectasis. Patients in the BRR database are classified by the presence or
absence of NTM infection, therefore the BRR contains the patients with NCFB classified by
the presence or absence of NTM infection.
Inclusion and Exclusion Criteria-
Adult patients with a diagnosis of non-cystic fibrosis bronchiectasis established by a
physician were eligible for inclusion in the database.
Patients diagnosed with cystic fibrosis, based on the clinical history, sweat chloride test
results, and/ or genetic testing results at the time of enrollment into the BRR were excluded
from the database.
In this study we used the BRR to compare the characteristics and survival of the non-cystic
fibrosis bronchiectasis patients with Non-Tubercular Mycobacteria (NTM) and non-NTM
infections. Patients were divided into two groups - NTM and non-NTM, and the patients
missing information on their NTM status were excluded. The two groups were compared in
terms of age, gender, smoking status, education level and mortality status. Age was coded
as a continuous variable, whereas other variables were categorical. Gender was coded as 1

15
for the females and 0 for males, with males used as the reference. Smoking status was
categorized as current smoker (1), past smoker (2) and never smoker (3), with never smoker
used as the reference. Educational status, based on the highest level of education attained
was categorized as high school or less (1), some college or associate degree (2), and college
degree or post graduate (3). Since many patients had information missing on education (n=
505, 30.42%), we created a missing category (4), to prevent exclusion and increase the
power of the study. The category high school or less (1) was used as the reference.
Mortality status was divided into 3 categories; Alive (1), Dead (2), and lost to follow up (3).
Alive was used as the reference. In this study we used the logistic regression to compare
characteristics of two groups, cox proportional hazard regression to examine risk of death
and Kaplan Meier survival curve to compare survival times of two groups. March 31, 2015
was used as the end of the study date for censoring.
Statistical Analysis:
Logistic regression: Analysis was performed to determine crude estimates as well as
estimates after adjustment for other factors. Exploratory analysis included use of
descriptive statistics. Mean and standard deviation were calculated for continuous variable
of age. Frequencies and percentages were calculated for categorical variables: smoking
status, gender, mortality status, and education level. The descriptive statistics are presented
in the Table 1. The effects of individual factors were first estimated by including each
variable separately in a logistic regression model to investigate the unadjusted association
between the independent variable and outcome (NTM infection). Odds ratios, 95%
16
confidence intervals and p-values were calculated for each variable. The results are
presented in the Table 2. A multivariate logistic regression was used to estimate the
adjusted odds ratio, 95% confidence interval, and p-value for the observed association
between NTM status and other risk factors. The results for the multiivariate logistic
regression are presented in the Table 3.
For Cox proportional hazard regression, we calculated the hazard ratio and 95% confidence
interval to compare hazards of death for the NTM and non-NTM group, when comparing for
the different variables. The results for the cox proportional hazard regression are presented
in the Table 4.
Kaplan Meier survival analysis was used to compare the survival for the patients in the NTM
and non-NTM groups. Survival time was defined as the difference between the time of the
death and the time of diagnosis. Patients who were alive or lost to follow up were censored.
March 31, 2015 was used as the date for the end of the study, and therefore to censor
patients who were alive until that date. A log rank test was used to check the statistical
significance of the survival curve. SAS v 9.3 was used for all the statistical analysis in the
study. The significance level used in the analysis was p<0.05
RESULTS:
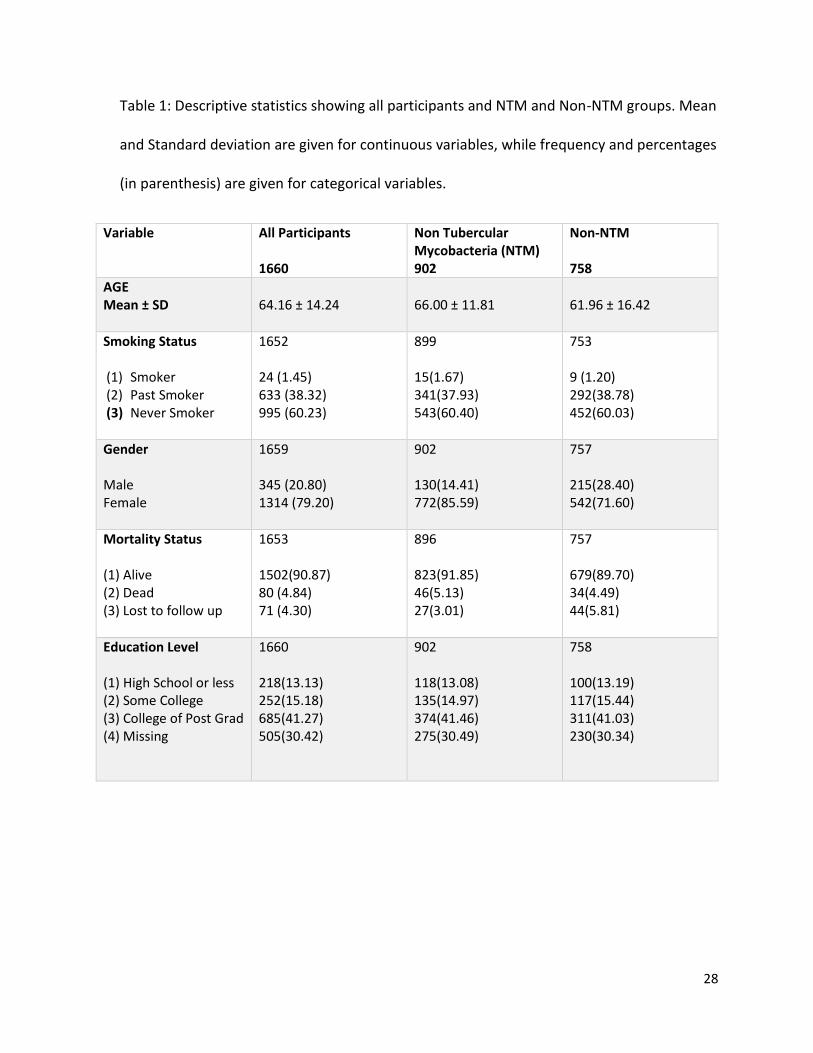
Table 1 presents the distribution of demographic and other characteristics of the total
sample (n=1660) and according to the presence or absence of NTM infection; NTM (n=902)
and non-NTM (n=758). The mean age of all the participants was 64.16 years with the
standard deviation of 14.24. (64.16 ± 14.24). The mean age for the NTM group was 66.00

17
years with the standard deviation of 11.81 (66.00±11.81), and the mean age for the non-
NTM group was 61.96 years with a standard deviation of 16.42 (61.96±16.42).
Smoking status data was available for 1652 participants, including 899 NTM and 753 non-
NTM patients. Among all participants, 24(1.45%) patients were current smokers, while
633(38.32%) were past smokers, and 995(60.23%) were never smokers. In the NTM group
(n=899), 15(1.67%) participants were current smokers, 341(37.93%) were past smokers, and
543(60.40%) were never smokers. In the non-NTM group (n=753), 9(1.20%) were current
smokers, 292(38.78%) were past smokers, and 452(60.03%) were never smokers.
Gender was available for 1659 participants. There were 345(20.80%) male participants and
1314(79.20%) female participants. In the NTM group (n=902), 130(14.41%) participants
were males, and 772(85.59%) were females. In the non-NTM group (n=757), 215(28.40%)
participants were males, while 542(71.60%) participants were females.
Mortality status data was available for 1653 patients, including 896 NTM and 757 non-NTM
participants. Among all participants, 1502(90.87%) were alive, 80(4.84%) were dead and
71(4.30%) were lost to follow up. In the NTM group (n=896), 823(91.85%) patients were
alive, 46(5.13%) were dead and 27(3.01%) were lost to follow up. In the non-NTM group
(n=757), 679(89.70%) of the participants were alive, 34(4.49%) were dead and 44(5.81%)
were lost to follow up.
Education level was available for only 1155 participants, so a category for the missing
observations was created, so as to retain them in the study. For education level (n=1660),
902 participants were in the NTM group and 758 were in the non-NTM group. Among all
18
participants (n=1660), 218(13.13%) were in the high school or less category, while
252(15.18%) had some college or 2 year associate degree. 685(41.27%) had college or post
grad, and 505(30.42%) were missing information on education. In the NTM group (n=902),
118(13.08%) had high school or less, 135(14.97%) were in some college category,
374(41.46%) had college or post grad and 275(30.49%) were missing. In the non-NTM group
(n=758), 100(13.19%) had the highest level of education as high school or less, 117(15.44%)
had some college, 311(41.03%) were in the college or post grad category, and 230(30.34%)
were missing.
Univariate Analysis:
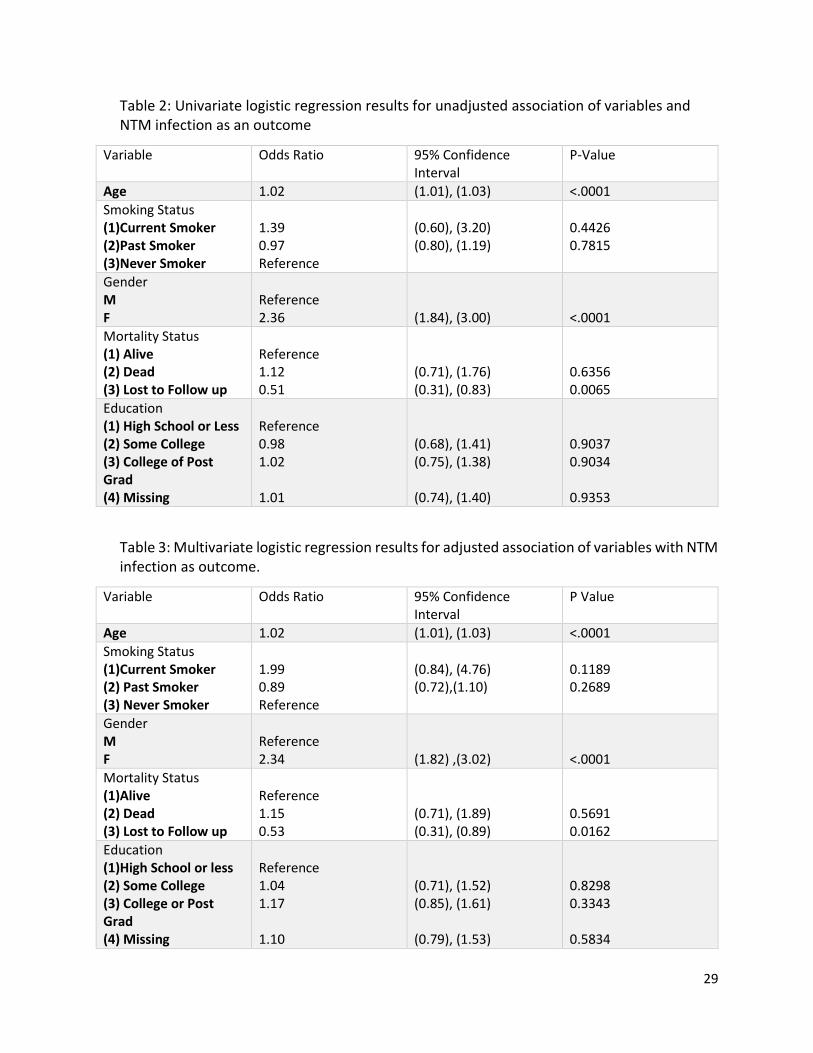
Table 2 presents the results from the univariate logistic regression. Age and gender were
found to be significantly associated with the NTM disease in the patients with non-cystic
fibrosis bronchiectasis. The various variables were associated with NTM disease in the
model at the significance level of p˂0.05. The analysis shows that for one year increase in
age, the odds of having the NTM disease increases by 2.0%, when age is the only variable
adjusted for in the model (OR, 1.02; 95% CI, 1.01-1.03,p < 0.001). The data also shows that
when considering the gender, the odds of having NTM disease are 2.36 times higher for the
females as compared to the males (OR, 2.36;95% CI, 1.84-3.00, p <0.001).
While considering the smoking status, the “never smoker” category was used as the
reference. The data shows that that the odds of having NTM disease in the current smoker
category are 1.39 times the odds for the never smoker category, but the result is not
statistically significant (OR, 1.39; 95%CI, 0.60-3.20, p=0.4426). The data also shows that the
19
odds of having NTM disease in the past smoker are 0.97 times the odds in the never
smoker, but the result is not statistically significant (OR, 0.97; 95%CI, 0.80-1.19, p=0.7815).
While considering the mortality status, the “Alive” category was used as the reference. The
data shows that the odds of having NTM infection in the patient who died are 1.12 times
the odds in the patient who are alive, but results are not significant (OR, 1.12; 95%CI, 0.71-
1.76; p=0.6356). The analyses also shows that the odds of having NTM infection in the
patients who are lost to follow up are 0.51 times the odds for the patients who are alive
(OR, 0.51; 95%CI, 0.31-0.83;p=0.0065)While considering the highest level of education
attained, the level of high school or less was used as the reference. The analyses of the data
shows that for the patients with some college, the odds for having the NTM infection are
0.98 times the odds for the patients with high school or less, but the result is not statistically
significant (OR,0.98; 95%CI,0.68-1.41;p=0.9037). The data also shows that the odds of
having the NTM infection in the patients with college or post grad level of education are
1.02 times the odds for the patient with high school or less (OR,1.02; 95%CI,0.75-
1.39;p=0.9034). the data further shows that the odds of having NTM infection in the
patients in whom in whom the information on education is missing are 1.01 times the odds
for the patient with high school or less (OR<1.01; 95%CI, 0.74-1.40;p=0.9353).
Multivariate Analysis;
We obtained adjusted odds ratio for all the variables by including them together in the
multivariate logistic regression model. Table 3. Presents the results of the multivariate
logistic regression. The analysis of the data shows that while controlling for all other

20
variables in model, with each year increase in the age the odds of having NTM infection
increase by 2.0% (OR,1.02; 95%CI,1.01-1.03;p<0.001)
The data also shows that while considering the gender, the odds of having the NTM disease
in females 2. 34 times the odds for having disease in males, while controlling for all other
variables in the model (OR, 2.34; 95%CI, 1.82-3.02; p<0.001), and since the p-value is less
than 0.05, therefore the results are statistically significant. The data analyses further shows
that while considering the smoking status, in the multivariate regression model, the odds of
current smoker having the NTM infection are 1.99 times compared to the odds of NTM
infection in the patients who are never smoker, while controlling for all other variables in
the model (OR,1.99; 95%CI, 0.84-4.76;p=0.1189). The data further shows that the odds of
having NTM infection in the past smoker compared to the odds in the never smoker are
0.89, while controlling for all other variables in the model, but the results are not
statistically significant (OR, 0.89; 95%CI, 0.72-1.10; p=0.2689).
While considering the mortality status, the data analysis found that the odds of having NTM
infection in the patient who died are 1.15 times the odds for the patient ,who are alive,
while controlling for all other variables in the model (OR, 1.15; 95%CI, 0.71-1.86;p-0.5691).
The data analysis also showed that the odds of having NTM disease in a patient who was
lost to follow up are 0.53 times the odds for the patient who are alive, while controlling for
all other variables in the model (OR,0.53; 95%CI,0.32-0.89;p=0.0162)
While considering the highest level of the education attained, the analysis of the data found
that the odds for having the NTM infection for the patients who have some college are 1.04

21
times the odds for the patients who have high school or less, while controlling for all other
variables in the model (OR, 1.04; 95%CI, 0.71-1.52; p=0.8298), but the results are not
statistically significant. The data also shows that odds of having NTM infection in the patient
with college or post grad are 1.17 times the odds for the patients with high school or less,
while controlling for all other variables in the model (OR,1.17; 95%CI, 0.85-1.61; p=0.3343).
The data also shows that odds of having NTM infection in the patient whom the education
status is missing are 1.10 times the odds for the patients with high school or less, while
controlling for all other variables in the model.(OR,1.10; 95% CI, 0.79-1.53; p=0.58340, but
the results are not statistically significant.
Cox proportional hazard regression;
Table 4. Presents the results from the cox proportional hazards regression.
The data analysis for the NTM group shows that, while controlling for all other variables in
the model, with each year increase in the age at diagnosis of bronchiectasis, the hazards of
death increased by 7.0%(HR,1.07;95%CI,1.04-1.11). The data further shows that the
hazards of death for those who are current smoker are 7.63 times the hazards for those
who are never smokers, while adjusting for other variables in the model
(HR,7.63;95%CI,1.58-36.85), but the result is not significant. The confidence interval is very
large, which can be explained by the fact that there are very few observations for this
category. The data analysis further found that the hazards of death for those who were past
smoker are 1.56 times the hazards for those who are never smoker (HR, 1.56; 95%CI,0.71-

22
3.43), after adjusting for all other variables in the model, but the results are not statistically
significant.
While considering for gender, the data analysis found that the females in the NTM group
has 58% less hazards on time to death than the males, after controlling for all other
variables in the model (HR, 0.42;95%CI,0.17-1.02), but since the confidence interval includes
1, the results are not statistically significant .
The analysis further found that while considering the highest level of education attained ,
the hazards of death for the patient who has some college are 0.64 times or 36% less than
those who has high school or less, while adjusting for all other variables in the model (HR,
0.64;95%CI,0.22-1.86). The data also showed that hazards of death in the patient who have
college or post grad are 0.34 times or 66% less than the hazards in the patient with high
school or less, while adjusting for all other variables in the model(HR, 0.34;95%CI,0.13-0.93).
The data also shows that the hazards of death in the patient with missing education level
are 0.37 times the hazards of death in a patient with high school or less, while adjusting for
all other variables in the model, but the results are not statistically significant
(HR,0.37;95%CI,0.12-1.13)
For the non-NTM group, the data analyses shows that, while controlling for all other
variables in the model, with each year increase in the age at diagnosis of bronchiectasis, the
hazards of death increased by 10.0%(HR,1.10;95%CI,1.05-1.14). The data further showed
that the hazards of death in the patients who are past smokers are 2.28 times the hazards
of death, compared to the patients who are never smokers., while adjusting for all other
23
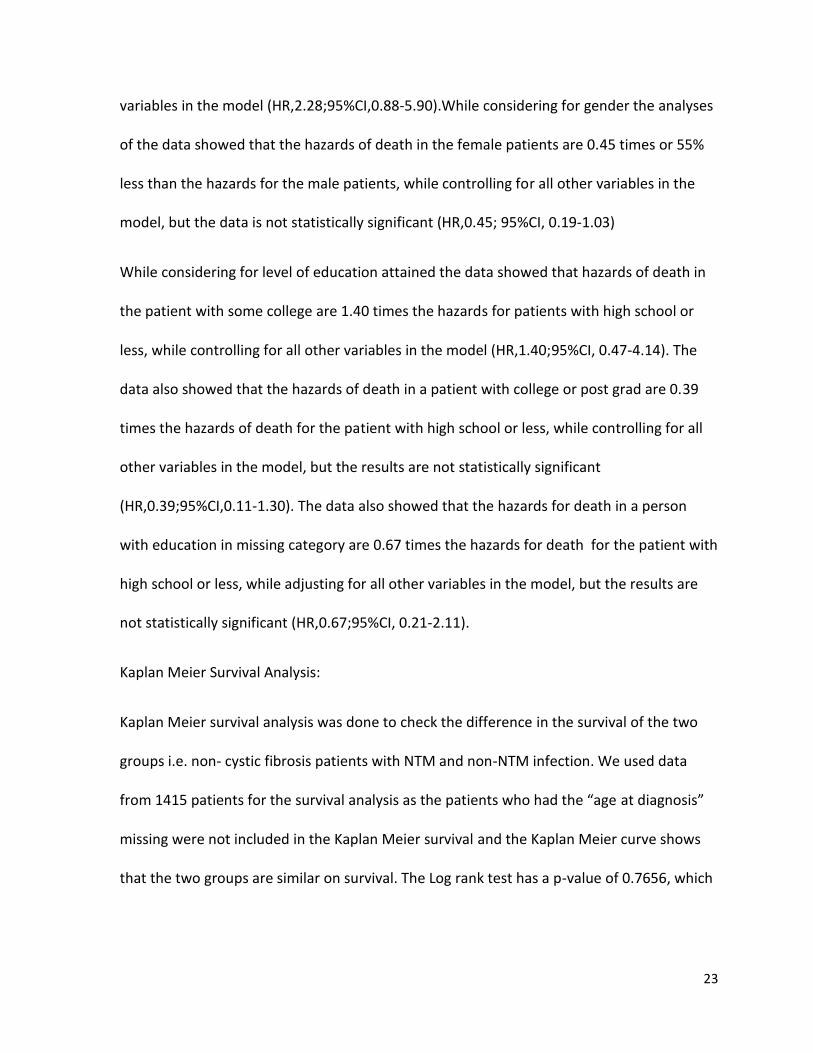
variables in the model (HR,2.28;95%CI,0.88-5.90).While considering for gender the analyses
of the data showed that the hazards of death in the female patients are 0.45 times or 55%
less than the hazards for the male patients, while controlling for all other variables in the
model, but the data is not statistically significant (HR,0.45; 95%CI, 0.19-1.03)
While considering for level of education attained the data showed that hazards of death in
the patient with some college are 1.40 times the hazards for patients with high school or
less, while controlling for all other variables in the model (HR,1.40;95%CI, 0.47-4.14). The
data also showed that the hazards of death in a patient with college or post grad are 0.39
times the hazards of death for the patient with high school or less, while controlling for all
other variables in the model, but the results are not statistically significant
(HR,0.39;95%CI,0.11-1.30). The data also showed that the hazards for death in a person
with education in missing category are 0.67 times the hazards for death for the patient with
high school or less, while adjusting for all other variables in the model, but the results are
not statistically significant (HR,0.67;95%CI, 0.21-2.11).
Kaplan Meier Survival Analysis:
Kaplan Meier survival analysis was done to check the difference in the survival of the two
groups i.e. non- cystic fibrosis patients with NTM and non-NTM infection. We used data
from 1415 patients for the survival analysis as the patients who had the “age at diagnosis”
missing were not included in the Kaplan Meier survival and the Kaplan Meier curve shows
that the two groups are similar on survival. The Log rank test has a p-value of 0.7656, which
24
is greater than 0.05, thereby again showing that there is not enough statistical evidence to
say that the two groups are different on survival.
DISCUSSION
We explored the comparison of the non-cystic fibrosis bronchiectasis patients with Non
Tubercular Mycobacteria (NTM) and non-NTM infections, using the data from the COPD
Foundation’s Bronchiectasis Research Registry. The study has found that the odds of having
NTM infection increases with age, and that the two groups are different with respect to age
as the mean age for the patients in the NTM group is 66.00, while the mean age for the
patients in the non-NTM group is 61.96, which shows that the NTM group has significantly
more participants with higher age. This finding may be explained by the fact that as the age
advances, the symptoms of the bronchiectasis disease worsens, thereby making it more
difficult for the patient to avoid the NTM infection or may be the possibility that the biofilm
on the NTM bacteria helps them to establish themselves in the elderly patients, in whom
the immune defense is decreased.
The study also found that the females are more likely to have NTM infection. The study
shows that 85% of the patients with NTM infection were females compared to 71% in the
non-NTM group. The study also found that females are 2.34 times more likely to have NTM
infection. This may be explained by the fact that sex hormones may plays a role in defense
against NTM infection. There have been studies, which showed the differential effect of sex
hormones on the NTM infection and showed that NTM infection increases in females with
increasing age and the increase was phenomenal after the menopause and since most
25
participants in the NTM group are elderly females, therefore they are more likely to have
NTM infection.16 The study did not found any difference between the groups with regard to
smoking, which may be explained by the fact that very low percentage of the patients are
current smokers, with current smokers constituting 1.67% and 1.20% of the NTM and non-
NTM group respectively, which may have led to no difference between the groups .The
study did not found any major difference in survival of the two groups on the Cox
proportional hazards regression even though the observations in the NTM group are little
better as compared to the Non-NTM group. The study did not found any difference
between the two groups with respect to survival, while using Kaplan Meier, which may be
due to the fact that data of the Bronchiectasis Research Registry is from the tertiary practice
centers. All patients who are in the tertiary practice center gets proper care. With sputum
culture and treatment specific for the culture, which may be controlling the symptoms and
survival in these patients, thereby leading to no difference in survival. Similarly, level of
education may have an impact on the delay of diagnosis, due to proper education and
exposure, but once the person is in the tertiary practice center, the care is of the same high
level, which may have led to no difference in the survival within two groups.
There are several limitations to the study. Since this study analyzes the data from the
Bronchiectasis Research Registry, rather than the population based sample, therefore there
may be potential bias in the demographic information, which may be reflective of the
demographics of the patients frequently seen in the tertiary practice centers participating in
the registry. The most of the tertiary centers participating in the study are located in the
eastern United States, which may further lead to bias.

26
CONCLUSION
The study analyzed the 1660 patients with non-cystic fibrosis bronchiectasis with the basis
of NTM infection and found that the 2 groups differ on age and gender characteristics but
had the similar survival (n=1415 for Kaplan Meier). There are not many studies done on the
patients with non-cystic fibrosis bronchiectasis. This is one of the first study done on the
data from bronchiectasis research registry, so there are not many resources to compare the
results of this study. Further studies need to be done to enhance our knowledge of the non-
cystic fibrosis comparing NTM and non-NTM groups.

27
Acknowledgements
I would like to express my deepest appreciation to my committee chair Dr. David M.
Mannino for his great mentorship throughout the project. Without his guidance and
persistent help this project would not have been possible. My sincere gratitude goes to
my committee members Dr. W. Jay Christian and Dr. Sabrina Brown for their
encouragement, valuable advices and continuous support on this project.
28
Table 1: Descriptive statistics showing all participants and NTM and Non-NTM groups. Mean
and Standard deviation are given for continuous variables, while frequency and percentages
(in parenthesis) are given for categorical variables.
Variable All Participants 1660
Non Tubercular Mycobacteria (NTM) 902
Non-NTM 758
AGE Mean ± SD
64.16 ± 14.24
66.00 ± 11.81
61.96 ± 16.42
Smoking Status (1) Smoker (2) Past Smoker (3) Never Smoker
1652 24 (1.45) 633 (38.32) 995 (60.23)
899 15(1.67) 341(37.93) 543(60.40)
753 9 (1.20) 292(38.78) 452(60.03)
Gender Male Female
1659 345 (20.80) 1314 (79.20)
902 130(14.41) 772(85.59)
757 215(28.40) 542(71.60)
Mortality Status (1) Alive (2) Dead (3) Lost to follow up
1653 1502(90.87) 80 (4.84) 71 (4.30)
896 823(91.85) 46(5.13) 27(3.01)
757 679(89.70) 34(4.49) 44(5.81)
Education Level (1) High School or less (2) Some College (3) College of Post Grad (4) Missing
1660 218(13.13) 252(15.18) 685(41.27) 505(30.42)
902 118(13.08) 135(14.97) 374(41.46) 275(30.49)
758 100(13.19) 117(15.44) 311(41.03) 230(30.34)
29
Table 2: Univariate logistic regression results for unadjusted association of variables and NTM infection as an outcome
Variable Odds Ratio 95% Confidence Interval
P-Value
Age 1.02 (1.01), (1.03) <.0001
Smoking Status (1)Current Smoker (2)Past Smoker (3)Never Smoker
1.39 0.97 Reference
(0.60), (3.20) (0.80), (1.19)
0.4426 0.7815
Gender M F
Reference 2.36
(1.84), (3.00)
<.0001
Mortality Status (1) Alive (2) Dead (3) Lost to Follow up
Reference 1.12 0.51
(0.71), (1.76) (0.31), (0.83)
0.6356 0.0065
Education (1) High School or Less (2) Some College (3) College of Post Grad (4) Missing
Reference 0.98 1.02 1.01
(0.68), (1.41) (0.75), (1.38) (0.74), (1.40)
0.9037 0.9034 0.9353
Table 3: Multivariate logistic regression results for adjusted association of variables with NTM infection as outcome.
Variable Odds Ratio 95% Confidence Interval
P Value
Age 1.02 (1.01), (1.03) <.0001
Smoking Status (1)Current Smoker (2) Past Smoker (3) Never Smoker
1.99 0.89 Reference
(0.84), (4.76) (0.72),(1.10)
0.1189 0.2689
Gender M F
Reference 2.34
(1.82) ,(3.02)
<.0001
Mortality Status (1)Alive (2) Dead (3) Lost to Follow up
Reference 1.15 0.53
(0.71), (1.89) (0.31), (0.89)
0.5691 0.0162
Education (1)High School or less (2) Some College (3) College or Post Grad (4) Missing
Reference 1.04 1.17 1.10
(0.71), (1.52) (0.85), (1.61) (0.79), (1.53)
0.8298 0.3343 0.5834

30
Table 4: Results for Cox proportional hazard regression
Variable
Non-Tubercular Mycobacteria (NTM) Non-NTM
Hazard Ratio 95% Confidence Interval Hazard Ratio 95% Confidence Interval
Age at Diagnosis 1.07
(1.04),(1.11) 1.10 (1.05), (1.14)
Smoking Status 1.Current Smoker 2. Past Smoker 3. Never Smoker
7.63 1.56 Reference
(1.58), (36.85)#
(0.71), (3.43)
* 2.28 Reference
* (0.88), (5.90)
Gender 1. Male 2. Female
Reference 0.42
(0.17),(1.02)
Reference 0.45
(0.19), (1.03)
Education Level 1. High School or less 2. Some College 3. College or post grad 4. Missing
Reference 0.64 0.34 0.37
(0.22), (1.86) (0.13), (0.93) (0.12), (1.13)
Reference 1.40 0.39 0.67
(0.47), (4.14) (0.11), (1.30) (0.21), (2.11)
# Very few observations in the category. * No observations in the category

31
Graph 1: Kaplan Meier survival curve comparing NTM and Non-NTM groups
Survival time in years
NTM 0= No NTM infection and NTM 1= NTM infection
LOG RANK= 0.7656
0 20 40 60
SurvivalTime
0.0
0.2
0.4
0.6
0.8
1.0
Surv
ival P
robabili
ty
10NTM
+ Censored
Product-Limit Survival Estimates
0 20 40 60
SurvivalTime
0.0
0.2
0.4
0.6
0.8
1.0
Surv
ival P
robabili
ty
10NTM
+ Censored
Product-Limit Survival Estimates

32
References
1. Fitzpatrick ME, Sethi S, Daley CL, Ray P, Beck JM, Gingo MR. Infections in "noninfectious" lung diseases. Ann Am Thorac Soc. 2014;11 Suppl 4:S221-226.
2. RTH L. A treatise on the disease of the chest. Vol 78. New York: Library of the New York Academy of Medicine: Hafner Publishing.
3. Wrong O. Osler and my father. J R Soc Med. 2003;96(9):462-464. 4. Barker AF. Bronchiectasis. N Engl J Med. 2002;346(18):1383-1393. 5. Seitz AE, Olivier KN, Adjemian J, Holland SM, Prevots R. Trends in bronchiectasis among
medicare beneficiaries in the United States, 2000 to 2007. Chest. 2012;142(2):432-439. 6. Weycker D, Edelsberg J, Oster G, Tino G. Prevalence and Economic Burden of Bronchiectasis.
Clinical Pulmonary Medicine. 2005;12(4):205-209. 7. Tsang KW, Tipoe GL. Bronchiectasis: not an orphan disease in the East. Int J Tuberc Lung Dis.
2004;8(6):691-702. 8. Joish VN, Spilsbury-Cantalupo M, Operschall E, Luong B, Boklage S. Economic burden of non-
cystic fibrosis bronchiectasis in the first year after diagnosis from a US health plan perspective. Appl Health Econ Health Policy. 2013;11(3):299-304.
9. McShane PJ, Naureckas ET, Tino G, Strek ME. Non-cystic fibrosis bronchiectasis. Am J Respir Crit Care Med. 2013;188(6):647-656.
10. Goeminne P, Dupont L. Non-cystic fibrosis bronchiectasis: diagnosis and management in 21st century. Postgrad Med J. 2010;86(1018):493-501.
11. Bonaiti G, Pesci A, Marruchella A, Lapadula G, Gori A, Aliberti S. Nontuberculous Mycobacteria in Noncystic Fibrosis Bronchiectasis. Biomed Res Int. 2015;2015:197950.
12. O'Donnell AE. Bronchiectasis. Chest. 2008;134(4):815-823. 13. Ellis D, Thornley P, Wightman A, Walker M, Chalmers JD, Crofton J. Present outlook in
bronchiectasis: clinical and social study and review of factors influencing prognosis. Thorax. 1981;36:659-664.
14. Pasteur M, Helliwell S, Houghton S, et al. An Investigation into Causative Factors in Patients with Bronchiectasis. Am J Respir Crit Care Med. 2000;162:1277-1284.
15. Shoemark A, Ozerovitch L, Wilson R. Aetiology in adult patients with bronchiectasis. Respir Med. 2007;101(6):1163-1170.
16. Mirsaeidi M, Hadid W, Ericsoussi B, Rodgers D, Sadikot RT. Non-tuberculous mycobacterial disease is common in patients with non-cystic fibrosis bronchiectasis. Int J Infect Dis. 2013;17(11):e1000-1004.
17. Reich JM, Johnson RE. Mycobacterium avium complex pulmonary disease presenting as an isolated lingular or middle lobe pattern. The Lady Windermere syndrome. Chest. 1992;101(6):1605-1609.
18. Bryant JM, Grogono DM, Greaves D, et al. Whole-genome sequencing to identify transmission of Mycobacterium abscessus between patients with cystic fibrosis: a retrospective cohort study. Lancet. 2013;381(9877):1551-1560.
33
19. Ricketts WM, O'Shaughnessy TC, van Ingen J. Human-to-human transmission of Mycobacterium kansasii or victims of a shared source? Eur Respir J. 2014;44(4):1085-1087.
20. Prevots DR, Shaw PA, Strickland D, et al. Nontuberculous mycobacterial lung disease prevalence at four integrated health care delivery systems. Am J Respir Crit Care Med. 2010;182(7):970-976.
21. Moore JE, Kruijshaar ME, Ormerod LP, Drobniewski F, Abubakar I. Increasing reports of non-tuberculous mycobacteria in England, Wales and Northern Ireland, 1995-2006. BMC Public Health. 2010;10:612.
22. Han XY, Tarrand JJ, Infante R, Jacobson KL, Truong M. Clinical significance and epidemiologic analyses of Mycobacterium avium and Mycobacterium intracellulare among patients without AIDS. J Clin Microbiol. 2005;43(9):4407-4412.
23. Wickremasinghe M, Ozerovitch LJ, Davies G, et al. Non-tuberculous mycobacteria in patients with bronchiectasis. Thorax. 2005;60(12):1045-1051.
24. Chalmers JD, Hill AT. Mechanisms of immune dysfunction and bacterial persistence in non-cystic fibrosis bronchiectasis. Mol Immunol. 2013;55(1):27-34.
25. Fowler SJ, French J, Screaton NJ, et al. Nontuberculous mycobacteria in bronchiectasis: Prevalence and patient characteristics. Eur Respir J. 2006;28(6):1204-1210.