Comparing the Efficiency of Italian Public and Private ... · According to the Ministry of...
33
Ital Econ J (2016) 2:57–89 DOI 10.1007/s40797-015-0022-7 RESEARCH PAPER Comparing the Efficiency of Italian Public and Private Universities (2007–2011): An Empirical Analysis Tommaso Agasisti 1 · Luisa Ricca 2 Received: 28 December 2014 / Accepted: 17 July 2015 / Published online: 4 August 2015 © Società Italiana degli Economisti (Italian Economic Association) 2015 Abstract The aim of this study is to analyse the technical efficiency of Italian public and private universities. We therefore conduct a Data Envelopment Analysis on Italian universities in the years 2007–2011, using a novel integrated dataset from the Statistical Office of the Ministry of Education and from the National Agency for Evaluation. The inputs of the model are the total number of students and faculty staff, while the outputs are the total number of graduates and the revenues from scientific research. The results show differences related to the type of universities (private universities are relatively more efficient than public ones) and geographical area (Northern universities are relatively more efficient than those of the Centre and South). The Malmquist index, used for a comparison of different years, shows that the overall efficiency of Italian universities has increased in the period examined, particularly thanks to pure efficiency. Keywords Efficiency · Higher education · Private universities · Malmquist index JEL Classification I21 · I23 · C14 1 Introduction and Research Objectives Recent years have been characterized by a continuous decreasing of public funding for public and welfare services. In the higher education (HE) sector, institutions have to prove higher education to a growing population without a simultaneous increasing in government funding. The greater autonomy given to Italian universities in the last B Tommaso Agasisti [email protected] 1 Politecnico di Milano School of Management, Milan, Italy 2 IULM University, Milan, Italy 123
Transcript of Comparing the Efficiency of Italian Public and Private ... · According to the Ministry of...
Ital Econ J (2016) 2:57–89DOI 10.1007/s40797-015-0022-7
RESEARCH PAPER
Comparing the Efficiency of Italian Public and PrivateUniversities (2007–2011): An Empirical Analysis
Tommaso Agasisti1 · Luisa Ricca2
Received: 28 December 2014 / Accepted: 17 July 2015 / Published online: 4 August 2015© Società Italiana degli Economisti (Italian Economic Association) 2015
Abstract The aim of this study is to analyse the technical efficiency of Italian publicand private universities. We therefore conduct a Data Envelopment Analysis on Italianuniversities in the years 2007–2011, using a novel integrated dataset from theStatisticalOffice of the Ministry of Education and from the National Agency for Evaluation.The inputs of the model are the total number of students and faculty staff, while theoutputs are the total number of graduates and the revenues from scientific research.The results show differences related to the type of universities (private universities arerelativelymore efficient than public ones) and geographical area (Northern universitiesare relativelymore efficient than those of the Centre and South). TheMalmquist index,used for a comparison of different years, shows that the overall efficiency of Italianuniversities has increased in the period examined, particularly thanks to pure efficiency.
Keywords Efficiency · Higher education · Private universities · Malmquist index
JEL Classification I21 · I23 · C14
1 Introduction and Research Objectives
Recent years have been characterized by a continuous decreasing of public fundingfor public and welfare services. In the higher education (HE) sector, institutions haveto prove higher education to a growing population without a simultaneous increasingin government funding. The greater autonomy given to Italian universities in the last
B Tommaso [email protected]
1 Politecnico di Milano School of Management, Milan, Italy
2 IULM University, Milan, Italy
123

58 T. Agasisti, L. Ricca
years has also led tomore competition in order to increase their efficiency “producing”a greater amount of teaching (more students) and a better quality of research.
Public financial funding for Italian public universities have decreased by approxi-mately 15 % from 2009 to 2013 (author’s estimation on Ministry of Education data);1
the same data for private universities shows that funds have decreased by 22 % in thesame years, in addition to the fact that there are now more beneficiaries.2
It is also interesting to reflect on the relevance of the Italian private institutions.They receive a small amount of funds, but it is recognized the role that they play inthe national system: private universities, such as public ones, respond to the needs andinterests of the society and the business world, producing and transferring knowledgethrough research and teaching. It can therefore be concluded that the state should alsofund private universities as a “reward” for the production to which they contribute(education) and that has a positive effect on the country.
In a context like this, it becomes increasingly important, also for public policies,to analyse the efficiency of universities, in order to understand how productive theyare. The efficiency analysis can be used as an indirect evaluation of the utilizationof funding, in spite it derives from public sources (such as in the case of publicuniversities) or private sources (in the case of private universities).
The aim of this research is to analyse the technical efficiency of the Italian publicand private universities over 5 years (2007–2011), in order to investigate whether thereis an efficiency differential between public and private system, and if this efficiencyis decreased or increased over the years. While many recent studies deal with theefficiency of Italian universities (see, for instance, a review in Agasisti and Lezzi2013), this paper is innovative in that is the first that explicitly compares the relativeefficiency of public and private institutions.
The efficiency analysis has been conducted through Data Envelopment Analysis(DEA), a nonparametric approach that does not require any prior assumption on thefunctional form of the relationship between inputs and outputs and on the distributionof the efficiency scores. While there is no agreement about the exact functioning ofthe universities’ production processes, the existing literature suggests the use of non-parametric techniques for estimating their efficiency (see the discussion inWorthington2001; Johnes 2004), as thesemethods allows not formulating specific hypotheses aboutthe economic behaviour (i.e. do not impose assumptions about their cost-minimizationattitude). The present study, also, uses a statistically-robust version of DEA (followingSimar and Wilson 2000) that is less subject to some traditional weaknesses of DEAdue to its deterministic nature.
Anticipating our results, we can say that we have found differences related to thetype of universities (private universities seem to be relativelymore efficient than publicones) and geographical area (Northern universities seem relatively more efficient thanthose of the centre and the South). The analysis of Malmquist index has also showedthat the overall efficiency of Italian universities has increased over the period examined.
1 Although it should be noted that until the year 2009 the funding for state universities have seen a continuousgrowth.2 In addition to the 14 private universities member of CRUI (the Conference of Italian University Rectors),others 5 have been added to beneficiaries of public funds, including 2 telematic universities.
123

Comparing the Efficiency of Italian Public and Private… 59
The remainder of the paper is organized as follows: in Sect. 2 a brief analysis ofthe Italian context is shown, while in Sect. 3 we present a literature review. Section 4illustrates and explains the reasons for the methodology adopted and presents the dataused. Section 5 illustrates the main results, while Sect. 6 concludes.
2 Background: The Private University System in Italy
In the last half century, the private sector of higher education has grown very rapidly(Levy 2012). This has also taken place in the European context, in spite of the tradi-tional public role attributed to higher education.
The separation between the public and the private sector is not always clearlydefined and it is often possible to find a precise definition only looking at the nationallegislations: the distinction between the two systems is therefore purely legal. Withinthe same sector, private institutions can then be for-profit or not, although the latteroption appears the most common.
There are two aspects that can distinguish the private sector from the public:
– financial contribution, which clearly must derive mostly from private sources,while the public sector is mainly financed through government funds;
– a stronger autonomy, which allows private universities to decide forms of gover-nance or to have more freedom, particularly in relation to decisions on financialpolicy.
To better know the private higher education system, it can be interesting have a lookat some data. Using data from EUROSTAT it is possible to compare enrolment ratesof public and private institutions in several states. As can be seen in Fig. 1, privateinstitutions generally attract fewer students than public ones, representing a 10.6 % atEuropean level,3 about 28 % in United States and 80 % in Japan. Among Europeancountries there is a high variability, with peaks of 67 % in Cyprus and 31 % in Polandand Romania.
The great difference in enrolment rates between European and non-European coun-tries can derive from the typical European idea of university as a public good thatshould be funded by the state. This is not surprising considering that Europe is thebirthplace of the so-called “continental model” of higher education provision (Clark1983), which sees the state at the centre of the higher education system, governingthe funding and defining rules and practices. Higher education is considered a publicgood, and for this reason there is a strong opposition to the privatization of publicuniversities and to public funding of private institutions.
The variation in enrolment rates in private institutions in the decade 2001–2011shows that the states in which the variation is negative are very few and in the majorityof countries the enrolment rate at private institutions have increased over the period,reflecting the growing importance assumed by this system. The variation is even moreimportant for countries of Central and Eastern Europe, but also for Africa and much ofLatin America. It is easy to assume that where the ageing of population is higher and
3 These percentages are calculated considering only private institutions independent from the state; privateinstitutions dependent from the state receive more than half of their funds from the state itself.
123

60 T. Agasisti, L. Ricca
Fig. 1 Enrolment rate to “private institution independent from the state”. Source Author’s elaborationfrom EUROSTAT 2011 (Eurostat defines private universities according to the type of governance of theinstitution and for this reason, given the strong autonomy of the English system here it is reported as 100 %private but dependent from the state)
the school-age population is declining, the competition among universities to attractstudents is expected to grow. In these countries, only the best institutions consideredinnovative and with quality, will be able to compete successfully, whether they arepublic or private.
The Italian setting is characterized by some particular specificity. The first Italianuniversities (universitates studiorum) where founded in the Middle Ages in citieslike Bologna. They born as places to defend rights and privileges of students andscholars, but they soon became places for cultural debate, study and research, opento scholars of any nationality. Other universitates studiorum were founded by popes,emperors and kings, such as the Università degli studi di Napoli Federico II, whichwas founded in 1224 by Frederick II of Swabia andKing of Naples. Over the centuries,universities were gradually transformed into public institutions under the control of thegovernment; this fact has led to the highly centralized nature of the Italian universitysystem until the 80’s. The Italian HE system has been reformed in recent years to jointhe Bologna Process. It currently consists of 96 institutions:
– 67 public universities (including 8 special schools);– 18 private universities legally recognized;– 11 telematics private universities legally recognized.
An important characteristic is the “legal value” of the degree, which means that grad-uates are considered at the same level of knowledge and competence regardless of theuniversity in which they studied. Therefore any kind of differentiation between theinstitutions exists: all universities are formally (i.e. legally) equal.
123

Comparing the Efficiency of Italian Public and Private… 61
The possibility for private to operate in the higher education system is defined inthe Constitution itself, which in the article 33 states that “Private have the right tofound schools and institutions without any additional cost for the state”. Private uni-versities can then be promoted by private parties, and can be of the following differenttypes:
– university strongly linked to the territory in which they born;– universities inspired by religious principles;– universities that meet specific need of a part of the civil society and productivesectors and born to create specific job profiles.
The universities’ autonomy is assured both for public and private institutions,but all of them must comply with certain rules and requirements, in particularwith regard to the structure of the curricula. In order to ensure a uniform level ofknowledge (needed for the legal validity of the degree) subjects’ areas to be taughtare balanced directly by the Ministry of Education. Universities must also complywith various ministerial constraints for the composition of the teaching staff, theteacher/student ratio and the minimum number of professors to have for single pro-grams.
At the ministerial level, the distinctions between public and private universities arefew, the most important is the type and amount of funding and the way of allocation.
Private universities offer a wide range of disciplines, although they are mainlyconcentrated on social and political areas.
According to the Ministry of Education’s Statistical Office in the academic year2012/2013 students enrolled in private universities (excluding the telematics) were5.7 % of the total and students enrolled at the 1st year were 6.5 % of the total.
The current Italian model of public funding for higher education, in force since2003, is based on three pillars:
– the ordinary financing fund for universities (FFO);– the fund for university buildings and scientific equipment;– the fund for the university system’s development.
The FFO is the annual contribution that public universities receive from the govern-ment. It represents the bulk of revenues for public universities, and it is today made upof a base (proportional to the historical allocation for each university) and a part estab-lished in relation to incentives. The allocation is therefore based on a formula-basedmechanism, where a part is however fixed. It should be noted that the part paid on thebasis of competition is small compared to the part distributed for historical allocations,albeit growing.4 In 2010, the contribution received from fees of the students in publicuniversities amounted to 8.5 % of the total revenues.
With regard to private universities, according to the Law 243 of 1991, “the Statemay give contributions, within the limits established by this Law, to private universitiesand higher education institutions that have been legally authorized to give degree withlegal validity”. This contribution covers a minority share of the total budget of private
4 In 2010 the 80 % of FFO has been erogated on historical base and only a 10.2 % has been erogated bycompetitive funding (Turri 2011). In 2014, 18 % of FFO is assigned following the premium formula.
123

62 T. Agasisti, L. Ricca
Fig. 2 Public funding to Italian universities, years 1999–2013
universities, which are mostly self-financed through student fees. In 2010 revenuesfrom student fees corresponded to the 35.7 % of total revenues.5 The amount of thecontribution for private institutions (that is a separated fund from FFO) is the resultof a part proportional to the historical transfer, a part as a balance for the shortfall ofuniversity fees due to the increase (if any) of total grants for students comparing tothose granted in the academic year 2000/2001 and a part established on the basis ofcompetition.6 To this contribution it can be added a “una tantum” amount for specificpurposes.
The total funds for private universities have dropped sharply in recent years,7 morethan the one for public universities. Moreover, the dynamic of public funds revealsthat in recent years the policies realised by various governments, despite the differ-ent political orientations, have been quite similar—i.e. reducing the total amount ofpublic sources devoted to private HEIs, and this is an additional force that potentiallystimulated their efficiency. Politically, in Italy has always been easier to cut (public)educational spending for private institutions than public ones; when attempts about thelatter have been made, they were adverse by strong protests by politicians, institutionsand unions (Fig. 2).
5 If we exclude universities “linked to the territory” that are largely funded by the Provinces (Aosta andBolzano), the value is even higher and equal to 40 %.6 In 2010 the 80 % of FFO has been erogated on historical base, a 11.2 % as balance for shortfall of feesand a 8.8 % has been erogated by competitive funding (Turri 2011).7 Itmust also be noted that in recent years have had access to such funding also some telematics universities:the portion of the contribution, already resized, is now divided among a larger number of universities.
123

Comparing the Efficiency of Italian Public and Private… 63
3 Literature Review About the Efficiency of Italian Universities
Measuring universities’ efficiency has become one of the central themes in the studiesrelated to higher education since the early 1990s. In those years researchers beganto consider improvement in efficiency of the institutions as a way to cope with thenew challenges that the system had to face (Johnes 1993). It is possible to conductefficiency analysis using various techniques; the first studies were implemented usingthe linear regression model (OLS) in order to investigate the changes in output inpresence of a reduction of the input (Johnes and Taylor 1990).
Universities are institutions that use a multitude of inputs in their “productionprocess” to produce at least two outputs (graduates and research). For this reason theanalysis of universities’ performance have abandoned the use of the linear regressionin favor of the adoption of most suitable methods such as the analysis of the stochasticfrontier (SFA) and Data Envelopment Analysis (DEA) (Johnes 2006a).
In this section, we review some previous contributions that focused on the effi-ciency of Italian universities. Some early studies have investigated the efficiency ofsingle institutions, looking at the differences between the departments of a university(Pesenti and Ukovich 1999; Rizzi 1999), while most recent ones have analyzed theefficiency of the university system as a whole (Agasisti and Dal Bianco 2006; Monaco2012; Bergantino et al. 2012; Agasisti and Lezzi 2013) or comparing different coun-tries (Agasisti and Johnes 2009; Agasisti and Pérez-Esparrels 2010; Agasisti and Pohl2012).
Agasisti and Johnes (2009), in their comparison of the technical efficiency of Italianand English universities, have demonstrated that universities in UK are more efficient,even if the Italian institutions show an improvement in efficiency over the years.Agasisti and Pérez-Esparrels (2010) have carried out a similar analysis comparingItalian and Spanish universities, showing that both countries have a good level ofefficiency, with Italian institutions more efficient than Spanish ones. The comparisonbetween Germany and Italy by Agasisti and Pohl (2012) showsmore efficiency amongGerman universities, but with a more rapid improvement for Italian universities. Inboth countries, it is also noted a geographical differentiation: North–South in Italy,East–West in Germany.
Regarding the studies on the Italian system, Agasisti and Dal Bianco (2006)analysed the efficiency of 58 Italian public universities, highlighting the existenceof a small set of universities that can be considered as “best-practice”, mainly locatedinNorthern Italy. The analysis also showed how efficiency analysis could be of supportto the formulation of policy to reward universities in base of their performance.
Monaco (2012), analyzing data for the academic year 2009/2010, shows that privateuniversities have higher efficiency values than public ones. Differences in efficiencycan be also seen in relation to geographical location: the universities in the North aremore efficient than those in the South.
Bergantino et al. (2012) conducted an analysis to investigate the role of competi-tion in determining incentives to improve efficiency, showing that when universitiesoperate in a more competitive environment they are also inducted to improve theirefficiency.
123

64 T. Agasisti, L. Ricca
Agasisti and Lezzi (2013), implementing the DEA model on a dataset of 55 Ital-ian public universities, showed a better performance of Northern universities, anddemonstrated that the reforms due to the Bologna Process have led to a change inthe efficiency frontier. The authors have finally found a strong positive associationbetween efficiency and the revenues from student fees.
To this day, there are two main gaps in this literature, because there is not any studythat analyses the differences between public and private higher education sector inItaly considering several years. These are the reasons that make this study innovative:(i) it takes into account at the same time public and private institutions; and (ii) itanalyses the intertemporal evolution of the efficiency in a 5-year period.
As the primary intention of this research has been to fill the gap and obtain acomparison between public and private Italian universities, we decided to sacrificecompleteness of data, implementing a simplified model of the productive process.Prior studies have often concentrated only on public universities, because not all thedata used (especially when conducting a comparison between countries) were publiclyavailable also for private institutions. The simplification of the production model hasinstead allowed us to analyse at the same time both types of universities.
4 Methodology and Data
There are three different types of efficiency (Johnes 2004): technical efficiency, alloca-tive efficiency and economic efficiency.
The present analysis is focused on the analysis of technical efficiency, because wedo not have information about the differential process of inputs, and also becausethey are not very homogeneous across the various Italian universities—in this sense,there are not proper differentials in terms of allocative efficiency, whilst there is cleardifference in the ratio of transforming inputs’ quantities into outputs (i.e. technicalefficiency).
Data Envelopment Analysis (DEA) represents an appropriate method for the studyof technical efficiency in this field because it is able to capture at the same timemultiple inputs and outputs.Higher education has in fact amultidimensional nature andorganizationsworking there are extremely complex. Institutions seek to achieve awiderange of targets simultaneously, trying to produce amix of teaching and research usingseveral resources (especially financial and human resources, both staff and students).
4.1 DEA Model
The DEAmethod is able to empirically identify the efficiency frontier highlighting thebest-practices; it is a nonparametric approach, for which it is not necessary to specifya priori the shape of the production function.
The model is fully described by Zhu (2003) and Cooper et al. (2006), while itsapplication to the higher education system is described by Johnes (2006b).
Here we can synthetically say that DEA method assumes that the efficiency of aproduction unit (DMUj) can be measured by calculating a weighted ratio betweenmultiple outputs (yjr) and multiple inputs (xji).
123

Comparing the Efficiency of Italian Public and Private… 65
maxu,ν
h0(u, ν) =∑
r
ur yr0/ ∑
νi xi0
However, it is important to highlight that it measures only the relative efficiency, notthe absolute; this means that the efficiency of a university is calculated with respectto the performance of other universities examined: the production units are located onthe efficient frontier, while the inefficient units are below the border.
There are two different specifications of the model: input-oriented and output-oriented.
In the case of universities, we can assume an output-oriented approach: given acertain level of input, universities pursue the maximization of output. In other words,we assume that a university is not efficient if it can be shown that some other universityis able to produce a greater amount of a certain output without decrease at the sametime the production of the other output, and without using more resources.
The value of efficiency of the university ek is in the range (0, 1): university k isefficient if the efficiency score takes the value 1; it is located on the efficient frontier.Consequently, an efficiency score lower than 1 implies that the university is inefficientcompared to the other universities taken into account (and themagnitude of inefficiencyis measured by the distance from 1).
If we assume an output-oriented approach, then inefficient universities shouldincrease their output by a factor of 1/ek in order to reach the efficiency frontier.
DEA can assume constant returns to scale (CRS) or variable return to scale (VRS).The VRS assumption, used in the present study, allows instead to introduce a dimen-sional factor in the DEA model, so that each unit is analysed with respect to anotherof the same “relative” size.
The analysis is implemented with the bootstrap method “since efficiency is mea-sured relative to an estimate of the frontier, estimates of efficiency from nonparametricmodels are subject to uncertainty due to sampling variation. Bootstrap methods hence,may be used to assess this uncertainty by estimating bias, confidence intervals, testinghypothesis and so on” (Daraio and Simar 2007). After the “bootstrap base” pro-cedure, the “bias-corrected” calculation has also been implemented to correct thedistortions.
Finally,we carry out a second level regression of efficiency scores (obtained throughDEA model) relatively to some explanatory variables, which can be considered as“environmental” factors associated with lower levels of efficiency. The second levelregression will be a Tobit one, given that Tobit regression is applied in presence of acensored variable.
Having a panel dataset, we are not only interested in the relative performance of asingle university in a given year, but we also want to investigate how universities havemodified their efficiency over time. To do this we apply the Malmquist index, capableof capturing changes between different years (see Johnes 2004 for a technical descrip-tion). An index value m > 1 indicates a positive growth of the production functionfrom period t to period t + 1, while a value of m < 1 represents a decline. Also theindex allows a decomposition of efficiency changes in two parts: one related to “pureefficiency”, improvements or decline, the other measuring the structural movementsof the efficiency frontier as a whole, over time.
123

66 T. Agasisti, L. Ricca
In order to control for sampling noise and hence verify if Malmquist indices arestatistically significant,we implemented a bootstrap procedure to obtain bias-correctedestimates ofMalmquist indices and their confidence intervals (Parteka andWolszczak-Derlacz 2013; Simar and Wilson 1999).
To check for the statistical significance,we calculated the (1−α) percent confidenceinterval:
m̂i,(t,t+1) + l_m̂α(b) ≤ mi,(t,t+1) ≤ m̂i,(t,t+1) + u_m̂α(b)
The l_m̂α and u_m̂α represent the lower and the upper bootstrap estimates of theconfidence interval of Malmquist index, and α is the size of the interval. We can nowdefine the Malmquist index as significantly different from unity if the interval defineddoes not include unity.
4.2 Data
The literature considers higher education institutions as units that, using a variety ofinputs, produce a variety of outputs (Cohn et al. 1989). In order to implement theDEAmodel it is necessary to simplify the characteristics of the productive process. Inthis work universities are then identified as organizations that through the educationalprocess “produce” graduates and through the research process “produce” financialrevenues. To carry out the analysis, it is necessary define inputs and outputs of theproductive process. The choice of inputs and outputs therefore requires an approxi-mation, even if there is not in the literature a unique suggestion for the selection ofadequate proxies (Johnes 2004).
Considering that one of the objectives of this paper is to analyse the Italian univer-sity system as a whole, including private universities, it has been necessary to simplifythe productive process in order to allow a comparison between public and private insti-tutions. Needing to construct a database containing comparable, complete and reliabledata for both type of institution, it was not possible to consider, for example, the teach-ing infrastructure, because this data is not publicly available. Less parsimonious pro-ductionmodelswith administrative and technical staff, quality of research andfinancialresources have been tested in the robustness checks. While the general categories ofinputs and outputs are quite common across studies, the choice of single indicators(as proxy for the various underlying phenomena) are always subjected to the analysts’discretionality; thus, the final results must be interpreted with caution, knowing thatsome details can vary when employing alternative measures. In the present study:
– as input we used the number of students, considering all typologies: 4 years degree,bachelor and masters of science, and faculty, considering all type of faculty: pro-fessors, associate professors, researchers and temporary researchers;
– the variables used as output are the number of graduates (as a proxy of the edu-cational process) and the amount of financial resources deriving from scientificresearch (as a proxy of the research process). The total financial revenues fromresearch is calculated net of clearance accounts, including third parties activitiesand excludes revenue by the university.
123

Comparing the Efficiency of Italian Public and Private… 67
Data were obtained, not without some difficulties in the collection derived from theabsence of a single database and the non-comparability of certain data:
– from the database of the Statistical Office of the Ministry of Education with regardto students and graduates;
– from the official site of consortium CINECA for information about faculty;– from the annual survey of Evaluation Units, conducted first for CNVSU (NationalCommittee for Evaluation) and then for ANVUR (Italian National Agency forEvaluation), for the financial data on revenues from research.
Trying to have complete information on graduates (Monaco 2012) we decide to com-pute all type of graduates, and not only the regular ones; indeed these, referring to thestudents that have finished their educational career in terms of legal duration of thecourse, represent a partial measure of the educational output, because they reflect onlythe qualitative aspect of the process.
The efficiency analysis was then implemented on a dataset containing the values ofa 5-year period: from 2007 to 2011. With regard to graduates and financial revenueswe consider the calendar year; regarding students: at 2007 correspond the academicyear 2006/2007; with regard to faculty: to year 2007 correspond professors at the dateof December 31.
We are aware that this model is a simplified representation of reality, but in Sect. 5.2we have analysed more complete models in order to conduct robustness checks.
As it cans see in the descriptive statistics in Table 1 data refer to 74 universities for2007 (with 14 private universities), and 77 in 2011 (with 16 private universities). Theoverall data related to students, faculty and graduates show a decrease in the periodexamined, while revenues from research increase.
Table 1 Input and output: descriptive statistics, year 2007 and 2011
Number ofstudents
Number offaculty
Number ofgraduates
Revenues fromresearch
2007
Mean 24,295 835 4022 15,125
Median 16,406 563 2824 10,200
SD 23,699 864 3781 17,458
Min 510 25 96 44
Max 128,125 4638 19,811 80,068
# universities 74
2011
Mean 22,591 746 3787 19,452
Median 15,655 529 2770 11,616
SD 22,260 756 3710 27,226
Min 236 8 29 14
Max 119,126 4103 20,283 185,992
# universities 77
123

68 T. Agasisti, L. Ricca
Table 2 Input and output:descriptive statistics byuniversity type, year 2011
Public Private
Mean SD Mean SD
Number of students 26,911 22,646 6123 9327
Number of faculty 896 764 172 330
Number of graduates 4404 3784 1436 2157
Revenues from research 23,524 29,074 3930 6365
# universities 61 16
Table 3 Variable for secondstage regression
Public Private Total
2007
North 22 7 29
Centre 15 4 19
South 23 3 26
With medicine’s courses 37 3 40
Revenues from fees’ mean (%) 8.5 30.2 12.9
Foreign students (%) 1.5 1.3 1.5
BA/MA students 3.4 5.8 3.9
2011
North 22 8 30
Centre 16 4 20
South 23 4 27
With medicine’s courses 37 3 40
Revenues from fees’ mean (2010) (%) 9.4 35.0 14.5
Foreign students (%) 2.0 2.6 2.1
BA/MA students 2.2 3.1 2.3
Descriptive statistics on the type of university (public–private, in Table 2) show thatprivate universities are generally much smaller than public ones.
For the second stage regression in which we explore the determinants of efficiencyscores, we have also used additional variables,8 presented in Table 3:
– two dummy variables for universities located in Central and Southern Italy;– a dummy variable indicating the presence of medical courses in the university(medicine courses are normally associated with higher unit costs);
– a variable indicating the share of revenues from students’ fees with respect tothe total revenues of the university (the idea is to investigate whether universitieswhich are more funding related to students do have to operate more efficient, ornot), as a proxy for the incentive to improve efficiency responding to student’spressure;
8 Obviously, some of these variables can be considered as not completely exogenous, and partially affectedthrough choices realised by each institution. In this sense, our analysis is purely descriptive, and can provideinformation about statistical correlations, not causal relationships.
123

Comparing the Efficiency of Italian Public and Private… 69
– a variable indicating the share of foreign students, to investigate whether thecompetition also on international scale (to attract more foreign students) and aninternational orientation improve efficiency;
– a variable indicating the proportion of BA students over MA students, to controlif the orientation of the institution for bachelor programs can affect efficiency.
5 Results
5.1 Efficiency Scores of Universities: An Overview
In Table 4 efficiency scores obtained through the implementation of the basic DEAmodel obtained for all single years are shown, in which as input are considered thetotal number of students and professors and as output the total number of graduatesand the revenues from scientific research.
There are universities very stable in all years, with efficiency values steadily in thefirst quartile, and universities steadily less efficient. The results appear to be consistentwith previous studies. Comparing the scores for year 2008 with the analysis made byMonaco (2012) on the same academic year, it could be noted that the universities thatin this research appear as the most efficient (Padova, Bologna and Siena between thepublics; Università Cattolica del Sacro Cuore and Università Luigi Bocconi betweenthe private ones) show high efficiency scores also in Monaco’s work.
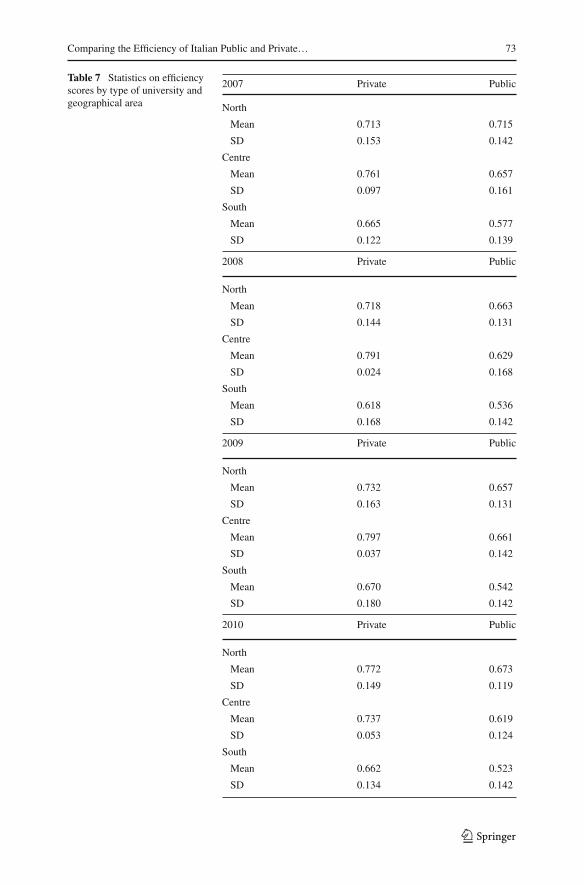
For ease of reading, Tables 5, 6 and 7 show some summary statistics obtained bygrouping universities analysed by type (public and private), and geographical location(North, Centre, South).
These results (reported also graphically in Fig. 3) reveal that private universitiesare on average relatively more efficient than the public ones, and this (relative) dif-ferential seems to increase in the years analysed: when considering the geographicalarea, the results show a greater efficiency of Northern universities than the central andeven more the Southern ones. Finally, combining the type of the university and thegeographical area it can be observed that, while among public universities the mostefficient are located in the North; among private universities efficiency is greater forthose in central Italy.
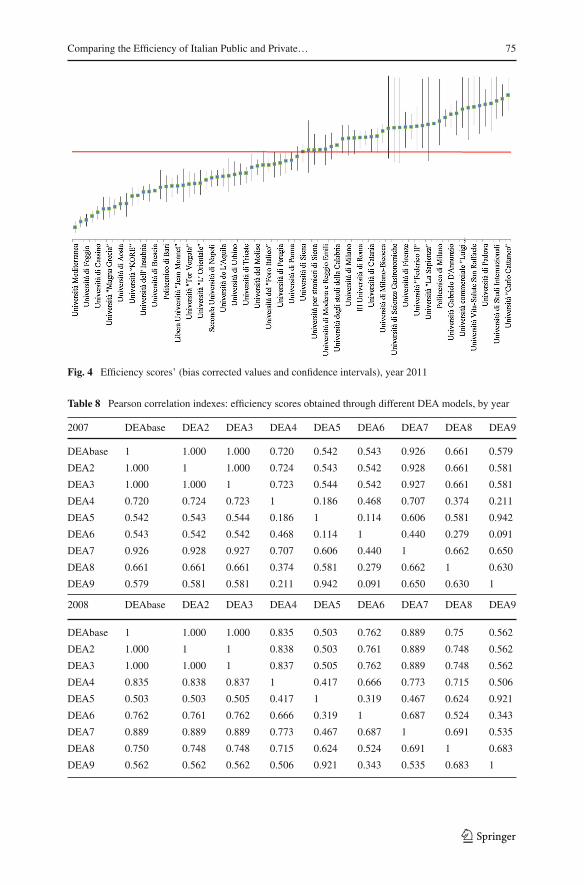
In Fig. 4 are finally represented the efficiency scores of year 2011 for all universities;universities above the horizontal line, which represents the total average, are relativelymore efficient.
5.2 Efficiency Scores of Universities: Robustness Checks
In order to verify the robustness of the model, in Table 8 are reported the Pearsoncorrelation indexes between the base model (implemented with bootstrap method and200 repetitions) and other alternative specifications of the model itself:9
9 Reading the Table 8, it can be noted that we calculated the efficiency scores also for some models whereonly one input and one output at a time are employed. Indeed, while one of the strength of DEA is dealingwith multiple inputs and outputs, we also consider the one input/one output settings to check the consistencyof results across all the various potential specifications—including the simplest ones.
123

70 T. Agasisti, L. Ricca
Table 4 Efficiency scores, by university and year
University Type 2007 2008 2009 2010 2011
Aosta: Università degli studi Private 0.606 0.409 0.380 0.475 0.450
Bolzano: Libera Università Private 0.388 0.612 0.619 0.639 0.731
Bra: Università di Scienze Gastronomiche Private n.d. n.d. n.d. n.d. 0.771
Casamassima: Libera Università “Jean Monnet” Private 0.596 0.508 0.747 0.586 0.525
Castellanza: Università “Carlo Cattaneo” Private 0.785 0.759 0.775 0.866 0.908
Enna: Università “KORE” Private 0.562 0.490 0.421 0.481 0.481
Milano: Libera Università di Lingue e Comunicazione(IULM)
Private 0.733 0.776 0.802 0.767 0.692
Milano: Università Cattolica del “Sacro Cuore” Private 0.857 0.808 0.867 0.915 0.893
Milano: Università commerciale “Luigi Bocconi” Private 0.817 0.822 0.843 0.856 0.848
Milano: Università Vita-Salute San Raffaele Private 0.807 0.838 0.835 0.888 0.859
Napoli: Istituto “Suor Orsola Benincasa” Private 0.836 0.855 0.843 0.809 0.856
Reggio Calabria: Università “Dante Alighieri” Private n.d. n.d. n.d. 0.773 0.773
Roma: LUISS Private 0.599 0.812 0.827 0.795 0.780
Roma: LUMSA Private 0.856 0.819 0.839 0.652 0.677
Roma: UNINT Private 0.790 0.764 0.765 0.739 0.885
Roma: Università “Campus Bio-Medico” Private 0.799 0.770 0.755 0.760 0.769
Ancona: Università Politecnica delle Marche Public 0.604 0.531 0.547 0.512 0.535
Arcavacata di Rende: Università della Calabria Public 0.586 0.611 0.663 0.667 0.698
Bari: Politecnico Public 0.762 0.433 0.553 0.332 0.522
Bari: Università degli studi Public 0.671 0.678 0.689 0.725 0.728
Benevento: Università degli studi del Sannio Public 0.613 0.720 0.553 0.322 0.450
Bergamo: Università degli studi Public 0.470 0.450 0.542 0.507 0.519
Bologna: Università degli studi Public 0.874 0.841 0.869 0.846 0.873
Brescia: Università degli studi Public 0.516 0.511 0.474 0.480 0.504
Cagliari: Università degli studi Public 0.460 0.459 0.507 0.531 0.562
Camerino: Università degli studi Public 0.343 0.421 0.467 0.412 0.437
Campobasso: Università degli studi del Molise Public 0.397 0.388 0.366 0.381 0.609
Cassino: Università degli studi Public 0.388 0.370 0.429 0.377 0.414
Catania: Università degli studi Public 0.758 0.661 0.808 0.732 0.733
Catanzaro: Università degli studi “Magna Grecia” Public 0.519 0.498 0.513 0.477 0.429
Chieti: Università degli studi D’Annunzio Public 0.855 0.948 0.859 0.725 0.828
Ferrara: Università degli studi Public 0.605 0.461 0.489 0.510 0.551
Firenze: Università degli studi Public 0.786 0.856 0.863 0.737 0.773
Foggia: Università degli studi Public 0.488 0.446 0.387 0.401 0.382
Genova: Università degli studi Public 0.808 0.686 0.611 0.620 0.617
L’Aquila: Università degli studi Public 0.613 0.522 0.566 0.564 0.565
Lecce: Università degli studi Public 0.738 0.587 0.637 0.628 0.788
Macerata: Università degli studi Public 0.470 0.439 0.553 0.452 0.501
Messina: Università degli studi Public 0.537 0.488 0.491 0.539 0.524
Milano: Politecnico Public 0.870 0.859 0.832 0.816 0.798
123

Comparing the Efficiency of Italian Public and Private… 71
Table 4 continued
University Type 2007 2008 2009 2010 2011
Milano: Università degli studi Public 0.821 0.784 0.696 0.733 0.727
Milano-Bicocca: Università degli studi Public 0.707 0.662 0.724 0.659 0.757
Modena e Reggio Emilia: Università degli studi Public 0.803 0.667 0.607 0.738 0.680
Napoli: Seconda Università degli studi Public 0.571 0.492 0.516 0.576 0.559
Napoli: Università degli studi “Federico II” Public 0.740 0.717 0.689 0.748 0.778
Napoli: Università degli studi “L’ Orientale” Public 0.526 0.462 0.595 0.493 0.536
Napoli: Università degli studi “Parthenope” Public 0.490 0.417 0.477 0.457 0.428
Padova: Università degli studi Public 0.906 0.852 0.884 0.866 0.869
Palermo: Università degli studi Public 0.776 0.652 0.614 0.660 0.735
Parma: Università degli studi Public 0.656 0.577 0.602 0.619 0.634
Pavia: Università degli studi Public 0.831 0.613 0.603 0.654 0.650
Perugia: Università degli studi Public 0.742 0.544 0.736 0.617 0.622
Perugia: Università per stranieri Public 0.664 0.801 0.748 0.736 0.814
Pisa: Università degli studi Public 0.635 0.647 0.640 0.638 0.613
Potenza: Università degli studi della Basilicata Public 0.436 0.378 0.298 0.353 0.375
Reggio Calabria: Università Mediterranea Public 0.330 0.319 0.366 0.314 0.351
Roma: III Università degli studi Public 0.693 0.775 0.776 0.794 0.730
Roma: Università degli studi “La Sapienza” Public 0.816 0.802 0.782 0.785 0.784
Roma: Università degli studi del “Foro Italico” Public n.d. 0.402 0.473 0.743 0.614
Roma: Università degli studi di “Tor Vergata” Public 0.573 0.566 0.540 0.593 0.532
Salerno: Università degli studi Public 0.548 0.562 0.589 0.595 0.528
Sassari: Università degli studi Public 0.430 0.497 0.386 0.453 0.484
Siena: Università degli studi Public 0.936 0.876 0.864 0.643 0.670
Siena: Università per stranieri Public 0.783 0.775 0.753 0.620 0.678
Teramo: Università degli studi Public 0.425 0.383 0.353 0.355 0.398
Torino: Politecnico Public 0.832 0.810 0.848 0.777 0.864
Torino: Università degli studi Public 0.883 0.888 0.811 0.907 0.831
Trento: Università degli studi Public 0.917 0.556 0.561 0.579 0.568
Trieste: Università degli studi Public 0.667 0.642 0.571 0.594 0.579
Udine: Università degli studi Public 0.598 0.748 0.617 0.645 0.631
Urbino: Università degli studi Public 0.609 0.538 0.601 0.575 0.573
Varese: Università dell’ Insubria Public 0.453 0.518 0.477 0.553 0.500
Venezia: Università degli studi “Cà Foscari” Public 0.629 0.594 0.650 0.662 0.678
Venezia: Università IUAV Public 0.671 0.709 0.842 0.800 0.775
Vercelli: Università del Piemonte orientale Public 0.659 0.626 0.555 0.602 0.578
Verona: Università degli studi Public 0.563 0.528 0.593 0.632 0.604
Viterbo: Università della Tuscia Public 0.818 0.727 0.807 0.666 0.724
The analysis have been implemented through “FEAR” package by R: Wilson (2008)Italic values represent first quartile, bold values represent forth quartile
123

72 T. Agasisti, L. Ricca
Table 5 Efficiency scores’statistics by university’s type
2007 2008 2009 2010 2011
Total
Mean 0.661 0.627 0.638 0.628 0.645
SD 0.156 0.160 0.157 0.152 0.147
Private
Mean 0.716 0.717 0.737 0.733 0.744
SD 0.136 0.142 0.150 0.134 0.141
Public
Mean 0.648 0.606 0.615 0.602 0.619
SD 0.158 0.156 0.149 0.145 0.137
Table 6 Efficiency scores’statistics by geographical area
2007 2008 2009 2010 2011
Total
Mean 0.661 0.627 0.638 0.628 0.645
SD 0.156 0.160 0.157 0.152 0.147
North
Mean 0.715 0.676 0.675 0.697 0.698
SD 0.145 0.136 0.143 0.134 0.133
Centre
Mean 0.679 0.662 0.688 0.642 0.656
SD 0.156 0.164 0.139 0.123 0.126
South
Mean 0.587 0.545 0.557 0.544 0.579
SD 0.140 0.148 0.153 0.149 0.150
– the implementation of the model with 1000 or 1500 repetitions (DEA2 and DEA3)leads to the same results captured by the base model, showing a correlation indexclose to 1;
– the implementation of separate models for teaching (DEA4) and research (DEA5)shows a higher correlation with the base model and the model relative to teaching,highlighting a greater explanatory power of these variables;
– the introduction of the variable “revenues from research for each professor” toreplace the variable “revenues from research” (DEA6) shows a relatively highcorrelation with the base model;
– the analysis of two separate models for BA students (DEA7) and MA students(DEA8) show a very strong correlation for the former, indicating a strongerexplanatory power of the data related to students and graduates of the bachelorcourses;
– as shown in Table 8, the correlation of the model with a model without revenuesfrom research as output (DEA9) is relatively high, with a value varying from 0.382for year 2011 to 0.579 for year 2007.
123
Comparing the Efficiency of Italian Public and Private… 73
Table 7 Statistics on efficiencyscores by type of university andgeographical area
2007 Private Public
North
Mean 0.713 0.715
SD 0.153 0.142
Centre
Mean 0.761 0.657
SD 0.097 0.161
South
Mean 0.665 0.577
SD 0.122 0.139
2008 Private Public
North
Mean 0.718 0.663
SD 0.144 0.131
Centre
Mean 0.791 0.629
SD 0.024 0.168
South
Mean 0.618 0.536
SD 0.168 0.142
2009 Private Public
North
Mean 0.732 0.657
SD 0.163 0.131
Centre
Mean 0.797 0.661
SD 0.037 0.142
South
Mean 0.670 0.542
SD 0.180 0.142
2010 Private Public
North
Mean 0.772 0.673
SD 0.149 0.119
Centre
Mean 0.737 0.619
SD 0.053 0.124
South
Mean 0.662 0.523
SD 0.134 0.142
123

74 T. Agasisti, L. Ricca
Table 7 continued2011 Private Public
North
Mean 0.769 0.672
SD 0.141 0.119
Centre
Mean 0.778 0.626
SD 0.074 0.118
South
Mean 0.659 0.565
SD 0.159 0.144
Fig. 3 Efficiency scores, year 2011
In order to check the robustness of the model, we integrated our dataset and weestimated new DEA models, less parsimonious of our baseline, in which the set ofvariable included in the productive process is “augmented”.10
Knowing that faculty only represent a portion of the total persons working inuniversities, in the first specification of the model we included in the set of inputsadministrative and technical staff, both tenured and untenured.11 The productiveprocess behind the model considers is therefore students, faculty and administra-tive staff as inputs, graduates and revenues from research as outputs. The results are
10 Due to space limits, we are not able to report all the indices for every HEI analyzed. The list of scoresis available upon request.11 Data have been obtained from the annual survey of Evaluation Units.
123
Comparing the Efficiency of Italian Public and Private… 75
Fig. 4 Efficiency scores’ (bias corrected values and confidence intervals), year 2011
Table 8 Pearson correlation indexes: efficiency scores obtained through different DEA models, by year
2007 DEAbase DEA2 DEA3 DEA4 DEA5 DEA6 DEA7 DEA8 DEA9
DEAbase 1 1.000 1.000 0.720 0.542 0.543 0.926 0.661 0.579
DEA2 1.000 1 1.000 0.724 0.543 0.542 0.928 0.661 0.581
DEA3 1.000 1.000 1 0.723 0.544 0.542 0.927 0.661 0.581
DEA4 0.720 0.724 0.723 1 0.186 0.468 0.707 0.374 0.211
DEA5 0.542 0.543 0.544 0.186 1 0.114 0.606 0.581 0.942
DEA6 0.543 0.542 0.542 0.468 0.114 1 0.440 0.279 0.091
DEA7 0.926 0.928 0.927 0.707 0.606 0.440 1 0.662 0.650
DEA8 0.661 0.661 0.661 0.374 0.581 0.279 0.662 1 0.630
DEA9 0.579 0.581 0.581 0.211 0.942 0.091 0.650 0.630 1
2008 DEAbase DEA2 DEA3 DEA4 DEA5 DEA6 DEA7 DEA8 DEA9
DEAbase 1 1.000 1.000 0.835 0.503 0.762 0.889 0.75 0.562
DEA2 1.000 1 1 0.838 0.503 0.761 0.889 0.748 0.562
DEA3 1.000 1.000 1 0.837 0.505 0.762 0.889 0.748 0.562
DEA4 0.835 0.838 0.837 1 0.417 0.666 0.773 0.715 0.506
DEA5 0.503 0.503 0.505 0.417 1 0.319 0.467 0.624 0.921
DEA6 0.762 0.761 0.762 0.666 0.319 1 0.687 0.524 0.343
DEA7 0.889 0.889 0.889 0.773 0.467 0.687 1 0.691 0.535
DEA8 0.750 0.748 0.748 0.715 0.624 0.524 0.691 1 0.683
DEA9 0.562 0.562 0.562 0.506 0.921 0.343 0.535 0.683 1
123

76 T. Agasisti, L. Ricca
Table 8 continued
2009 DEAbase DEA2 DEA3 DEA4 DEA5 DEA6 DEA7 DEA8 DEA9
DEAbase 1 1.000 1.000 0.876 0.503 0.663 0.928 0.729 0.517
DEA2 1.000 1 1.000 0.874 0.503 0.665 0.929 0.732 0.516
DEA3 1.000 1.000 1 0.873 0.501 0.664 0.929 0.73 0.514
DEA4 0.876 0.874 0.873 1 0.522 0.598 0.791 0.712 0.550
DEA5 0.503 0.503 0.501 0.522 1 0.330 0.521 0.569 0.989
DEA6 0.663 0.665 0.664 0.598 0.330 1 0.594 0.697 0.329
DEA7 0.928 0.929 0.929 0.791 0.521 0.594 1 0.671 0.533
DEA8 0.729 0.732 0.730 0.712 0.569 0.697 0.671 1 0.559
DEA9 0.517 0.516 0.514 0.550 0.989 0.329 0.533 0.559 1
2010 DEAbase DEA2 DEA3 DEA4 DEA5 DEA6 DEA7 DEA8 DEA9
DEAbase 1 1.000 1.000 0.911 0.571 0.771 0.911 0.832 0.565
DEA2 1.000 1 1.000 0.91 0.572 0.773 0.91 0.831 0.567
DEA3 1.000 1.000 1 0.909 0.772 0.773 0.91 0.831 0.567
DEA4 0.911 0.910 0.909 1 0.543 0.703 0.861 0.83 0.533
DEA5 0.571 0.572 0.772 0.543 1 0.468 0.505 0.519 0.987
DEA6 0.771 0.773 0.773 0.703 0.468 1 0.732 0.635 0.461
DEA7 0.911 0.910 0.910 0.861 0.505 0.732 1 0.709 0.503
DEA8 0.832 0.831 0.831 0.830 0.519 0.635 0.709 1 0.503
DEA9 0.565 0.567 0.567 0.533 0.987 0.461 0.503 0.503 1
2011 DEAbase DEA2 DEA3 DEA4 DEA5 DEA6 DEA7 DEA8 DEA9
DEAbase 1 1 1 0.811 0.386 0.787 0.893 0.821 0.382
DEA2 1.000 1 1 0.809 0.384 0.787 0.892 0.823 0.379
DEA3 1.000 1.000 1 0.809 0.386 0.788 0.891 0.823 0.381
DEA4 0.811 0.809 0.809 1 0.281 0.625 0.753 0.689 0.288
DEA5 0.386 0.384 0.386 0.281 1 0.354 0.41 0.514 0.986
DEA6 0.787 0.787 0.788 0.625 0.354 1 0.692 0.676 0.341
DEA7 0.893 0.892 0.891 0.753 0.410 0.692 1 0.701 0.417
DEA8 0.821 0.823 0.823 0.689 0.514 0.676 0.701 1 0.502
DEA9 0.382 0.379 0.381 0.288 0.986 0.341 0.417 0.502 1
DEA2 same variables of the base model with 1000 repetitions; DEA3 same variables of the base modelwith 1500 repetitions; DEA4 input = total students, output = total graduates; DEA5 input = total faculty,output = revenues from research; DEA6 input = total students and total faculty, output = total graduatesand revenues from research for single professor; DEA7 input = BA students and total faculty, output = BAgraduates and revenues from research for single professor; DEA8 input = MA students and total faculty,output = MA graduates and revenues from research for single professor; DEA9 input = total students andtotal faculty, output = total graduates
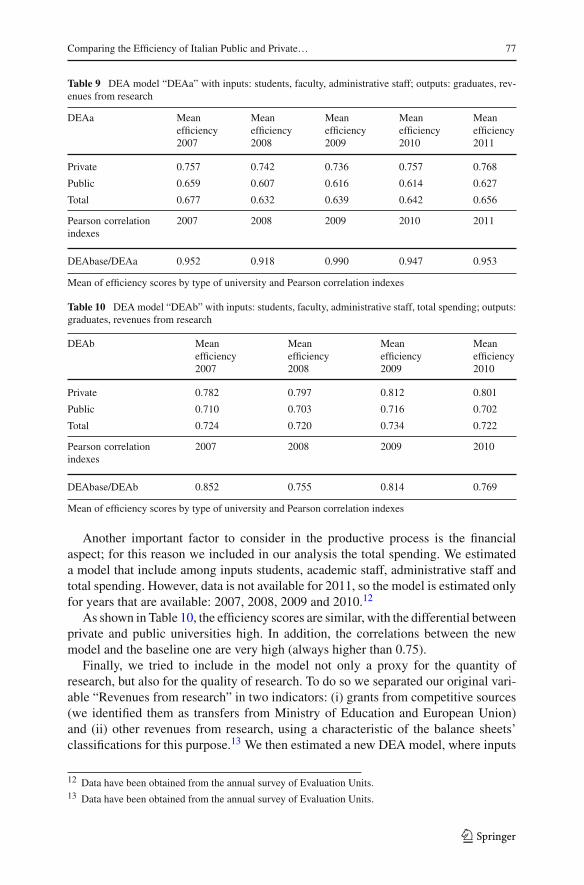
summarized in Table 9, where it is possible to notice that the efficiency scores arequantitatively and qualitatively very similar, with better scores for private universities,and the correlation indexes are very high, always higher than 0.91.
123
Comparing the Efficiency of Italian Public and Private… 77
Table 9 DEA model “DEAa” with inputs: students, faculty, administrative staff; outputs: graduates, rev-enues from research
DEAa Meanefficiency2007
Meanefficiency2008
Meanefficiency2009
Meanefficiency2010
Meanefficiency2011
Private 0.757 0.742 0.736 0.757 0.768
Public 0.659 0.607 0.616 0.614 0.627
Total 0.677 0.632 0.639 0.642 0.656
Pearson correlationindexes
2007 2008 2009 2010 2011
DEAbase/DEAa 0.952 0.918 0.990 0.947 0.953
Mean of efficiency scores by type of university and Pearson correlation indexes
Table 10 DEA model “DEAb” with inputs: students, faculty, administrative staff, total spending; outputs:graduates, revenues from research
DEAb Meanefficiency2007
Meanefficiency2008
Meanefficiency2009
Meanefficiency2010
Private 0.782 0.797 0.812 0.801
Public 0.710 0.703 0.716 0.702
Total 0.724 0.720 0.734 0.722
Pearson correlationindexes
2007 2008 2009 2010
DEAbase/DEAb 0.852 0.755 0.814 0.769
Mean of efficiency scores by type of university and Pearson correlation indexes
Another important factor to consider in the productive process is the financialaspect; for this reason we included in our analysis the total spending. We estimateda model that include among inputs students, academic staff, administrative staff andtotal spending. However, data is not available for 2011, so the model is estimated onlyfor years that are available: 2007, 2008, 2009 and 2010.12
As shown in Table 10, the efficiency scores are similar, with the differential betweenprivate and public universities high. In addition, the correlations between the newmodel and the baseline one are very high (always higher than 0.75).
Finally, we tried to include in the model not only a proxy for the quantity ofresearch, but also for the quality of research. To do so we separated our original vari-able “Revenues from research” in two indicators: (i) grants from competitive sources(we identified them as transfers from Ministry of Education and European Union)and (ii) other revenues from research, using a characteristic of the balance sheets’classifications for this purpose.13 We then estimated a new DEA model, where inputs
12 Data have been obtained from the annual survey of Evaluation Units.13 Data have been obtained from the annual survey of Evaluation Units.
123

78 T. Agasisti, L. Ricca
Table 11 DEA model “DEAc” with inputs: students, faculty, administrative staff, total spending; outputs:graduates, grants from competitive sources, and other revenues from research
DEAc Meanefficiency2007
Meanefficiency2008
Meanefficiency2009
Meanefficiency2010
Private 0.795 0.801 0.809 0.812
Public 0.726 0.702 0.721 0.711
Total 0.740 0.721 0.737 0.731
Pearson correlation indexes 2007 2008 2009 2010
DEAbase/DEAc 0.855 0.747 0.817 0.784
Mean of efficiency scores by type of university and Pearson correlation indexes
are: students, academic staff, administrative staff and total expenditure; and outputsare: graduates, grants from competitive sources, and other revenues from research.The results, reported in Table 11, show that the correlations between the new modeland the baseline one are very high (higher than 0.74) and the efficiency scores verysimilar, with better results for private universities.
We finally decided to check how our baseline results would be affected by theexclusion of some small universities, i.e. universities inwhich the number of students isbelow3500.14 In this case, the “restricted sample” is of 7 (out of 16of year 2011) privateuniversities, and 58 (out of 61 of year 2011) public universities.15 The new results fromDEA, not included here due to space limits but available upon request, reveal thatdifference in the institutions’ size is not a major factor that affects efficiency results:efficiency scores are quite similar and also in this case better for private universities,and correlation indices very high (always higher than 0.87).
5.3 The Evolution of Universities’ Efficiency Over Time: An Analysis Based onMalmquist Index
The analysis over the years has been conducted through the calculation of theMalmquist index (Table 12), which highlights the changes in efficiency over the years.The Malmquist index can be decomposed into two components:
– a component that indicates the efficiency change, or that describes the ability of theinstitutions to produce their output, given their input, with a certain technology;
– a component linked instead to the “change in the efficiency frontier” (frontiershift), which indicates changes in productivity achieved thanks to improved “tech-nology”.
14 We are grateful to one reviewer for this suggestion.15 Private universities excluded from the sample are: Aosta, Bolzano, Bra, Casamassima “Jean Monnet”,Castellanza, Milano San Raffaele, Università per Stranieri “Dante Alighieri”, Roma UNINT e Roma “Cam-pus Bio-Medico”. Public universities, that were excluded from the sample, are: Perugia - Università perstranieri, Università del “Foro Italico” and Siena - Università per stranieri.
123

Comparing the Efficiency of Italian Public and Private… 79
Table 12 Malmquist index
University Type Area Malmquistindex
Efficiencychange
Frontiershift
Aosta: Università degli studi Private North 0.954 0.996 0.957
Bolzano: Libera Università Private North 1.250 1.783 0.701
Casamassima: Università “Jean Monnet” Private South 0.644 0.890 0.723
Castellanza: Università “Carlo Cattaneo” Private North 0.878 0.972 0.904
Milano: Libera Università IULM Private North 0.950 1.537 0.618
Milano: Università Cattolica del “Sacro Cuore” Private North 1.062 0.000 0.768
Milano: Università commerciale“Luigi Bocconi”
Private North 0.991 1.000 0.991
Milano: Università Vita-Salute San Raffaele Private North 1.166 1.000 1.166
Napoli: Istituto “Suor Orsola Benincasa” Private South 0.699 1.038 0.673
Roma: Libera Università LUISS Private Centre 1.719 1.582 1.086
Roma: Libera Università LUMSA Private Centre 0.686 0.925 0.742
Roma: UNINT Private Centre 0.561 0.937 0.599
Roma: Università “Campus Bio-Medico” Private Centre 1.412 1.000 1.412
Università “KORE” Private South 0.497 0.799 0.623
Ancona: Università Politecnica delle Marche Public Centre 1.105 1.092 1.012
Arcavacata di Rende: Università della Calabria Public South 0.941 1.142 0.824
Bari: Politecnico Public South 1.145 0.864 1.325
Bari: Università degli studi Public South 0.928 1.099 0.844
Benevento: Università degli studi del Sannio Public South 1.033 0.769 1.344
Bergamo: Università degli studi Public North 1.205 1.324 0.910
Bologna: Università degli studi Public North 1.223 1.355 0.903
Brescia: Università degli studi Public North 1.073 1.249 0.859
Cagliari: Università degli studi Public South 1.236 1.322 0.935
Camerino: Università degli studi Public Centre 1.377 1.419 0.970
Campobasso: Università del Molise Public South 1.411 1.931 0.731
Cassino: Università degli studi Public Centre 1.049 1.395 0.752
Catania: Università degli studi Public South 0.942 0.783 1.203
Catanzaro: Università “Magna Grecia” Public South 0.959 1.226 0.782
Chieti: Università Gabriele D’Annunzio Public South 0.784 1.115 0.703
Ferrara: Università degli studi Public North 1.149 1.177 0.976
Firenze: Università degli studi Public Centre 1.172 1.049 1.118
Foggia: Università degli studi Public South 0.944 0.956 0.988
Genova: Università degli studi Public North 0.989 0.948 1.044
L’Aquila: Università degli studi Public South 0.834 0.920 0.907
Lecce: Università degli studi Public South 1.805 1.429 1.263
Macerata: Università degli studi Public Centre 1.019 1.618 0.630
Messina: Università degli studi Public South 1.018 1.390 0.732
Milano: Politecnico Public North 1.514 0.000 1.127
Milano: Università degli studi Public North 0.901 0.811 1.110
123

80 T. Agasisti, L. Ricca
Table 12 continued
University Type Area Malmquistindex
Efficiencychange
Frontiershift
Milano-Bicocca: Università degli studi Public North 0.977 1.055 0.926
Modena e Reggio Emilia: Università degli studi Public North 1.152 1.163 0.991
Napoli: Seconda Università degli studi Public South 0.984 1.019 0.965
Napoli: Università degli studi “Federico II” Public South 1.208 1.202 1.005
Napoli: Università degli studi “L’ Orientale” Public South 1.001 1.575 0.635
Napoli: Università degli studi “Parthenope” Public South 1.122 1.383 0.811
Padova: Università degli studi Public North 1.118 1.305 0.857
Palermo: Università degli studi Public South 1.007 1.407 0.715
Parma: Università degli studi Public North 0.947 1.218 0.778
Pavia: Università degli studi Public North 1.077 1.081 0.996
Perugia: Università degli studi Public Centre 1.018 0.966 1.053
Perugia: Università per stranieri Public Centre 0.783 1.222 0.641
Pisa: Università degli studi Public Centre 1.257 1.189 1.057
Potenza: Università della Basilicata Public South 0.936 1.072 0.873
Reggio Calabria: Università Mediterranea Public South 1.020 1.120 0.911
Roma: III Università degli studi Public Centre 0.910 1.118 0.814
Roma: Università degli studi “La Sapienza” Public Centre 1.813 1.707 1.062
Roma: Università di “Tor Vergata” Public Centre 1.124 1.138 0.987
Salerno: Università degli studi Public South 1.728 1.514 1.141
Sassari: Università degli studi Public South 1.261 1.527 0.826
Siena: Università degli studi Public Centre 0.827 1.036 0.799
Siena: Università per stranieri Public Centre 1.376 1.762 0.781
Teramo: Università degli studi Public South 0.916 1.288 0.711
Torino: Politecnico Public North 1.790 1.461 1.225
Torino: Università degli studi Public North 0.894 0.895 0.999
Trento: Università degli studi Public North 1.123 0.872 1.288
Trieste: Università degli studi Public North 0.993 1.111 0.894
Udine: Università degli studi Public North 1.173 1.290 0.909
Urbino: Università degli studi Public Centre 1.025 1.460 0.702
Varese: Università dell’ Insubria Public North 0.988 1.309 0.755
Venezia: Università degli studi “Cà Foscari” Public North 1.249 1.483 0.842
Venezia: Università IUAV Public North 1.056 1.362 0.776
Vercelli: Università degli studidel Piemonte orientale
Public North 1.076 1.056 1.019
Verona: Università degli studi Public North 1.410 1.494 0.944
Viterbo: Università della Tuscia Public Centre 1.164 1.001 0.000
As can be seen in Table 13 (which provides an overall synthesis), the overall effi-ciency appears to be increased over the 5 year examined, and this improvement ismainly due to pure efficiency.
123

Comparing the Efficiency of Italian Public and Private… 81
Table 13 Statistics onMalmquist index by type ofuniversity and geographical area
Malmquist index Total Private Public
Total
Mean 1.091 0.962 1.121
SD 0.264 0.332 0.235
North
Mean 1.115 1.036 1.140
SD 0.194 0.122 0.206
Centre
Mean 1.126 1.094 1.135
SD 0.312 0.485 0.246
South
Mean 1.039 0.613 1.094
SD 0.283 0.085 0.251
Efficiency change Total Private Public
Total
Mean 1.172 1.033 1.204
SD 0.323 0.404 0.291
North
Mean 1.114 1.041 1.137
SD 0.376 0.520 0.314
Centre
Mean 1.243 1.111 1.278
SD 0.268 0.273 0.255
South
Mean 1.184 0.909 1.220
SD 0.280 0.099 0.276
Frontier shift Total Private Public
Total
Mean 0.901 0.854 0.911
SD 0.215 0.233 0.209
North
Mean 0.939 0.872 0.960
SD 0.150 0.175 0.135
Centre
Mean 0.854 0.960 0.825
SD 0.287 0.315 0.271
South
Mean 0.892 0.673 0.921
SD 0.207 0.041 0.203
123

82 T. Agasisti, L. Ricca
Table 14 Malmquist indexes’ confidence intervals, period 2007–2011
DMUwithMalmquist indexstatistically significant
Mean of Malmquistindex∗
Malmquistindex > 1∗
% N % N
Private 78.6 11 0.972 45.5 5
Public 76.7 46 1.157 73.9 34
Total 77.0 57 1.121 68.4 39
∗ Considering only DMU with Malmquist index statistically significant
The universities that have seen a higher improvement are those located in centralItaly, while the analysis by type of university shows a greater improvement for publicuniversities. This evidence is apparently in contrast with what has been shown previ-ously, since the average values tend to mask the great heterogeneity of the system. Itseems to emerge a “catching up” effect of the public universities (respect to privateuniversities) and of Southern and central universities (respect the Northern ones), evenif these changes happen at a slow rate.
The results also highlight a great heterogeneity in the country: the efficiency iswidespread and is not characteristic of a single type of university.
We finally compared our results with the statistically significant ones, calculated atsignificance level of 5% (see Table 14). The cases inwhich the indices are significantlydifferent from unity are over 76 % and their average value is very similar to theoriginal ones. The number of cases in which we can observe a statistically significantimprovement in productivity are 45.5 % for private universities and 73.9 % for publicones, confirming the greater improvement for public universities already registered.
5.4 Exploring Universities’ Efficiency Through a Second-Stage Regression
Through the second level regressionwe can try to understandwhich are themajor deter-minants of efficiency. The second-level regression has been implemented through aTobit regression; efficiency scores are the dependent variable. The explanatory vari-ables in the model are the following:
– the total number of students in the university (total students/1000);– a dummy variable to differentiate the type of university (public, private) (type ofuniversity);
– a dummy variable to differentiate the universities of central Italy (GeographicalArea: Centre);
– a dummy variable to differentiate the universities located in the South of Italy(Geographical Area: South);
– a dummy variable to differentiate universities that offer courses inmedicine (medi-cine courses);
– the share of revenue from student fees (except for year 2011, for which these dataare not publicly available) (revenues from fees).
123

Comparing the Efficiency of Italian Public and Private… 83
The results are reported in Table 15. The geographical area appears to be the majordeterminant of efficiency, being always statistically correlated with the efficiencyscores. The dummy variable “Southern Italy” shows a negative coefficient, whichmeans that the university of the South are related to lower efficiency scores. The typeof university (public/private) appears instead significant only in some years, but witha negative relationship between the efficiency scores and the typology “public univer-sity”.We can also observe that the differential in efficiency between public and privateinstitutions has increased over the years examined. The variables “geographical area:centre”, presence of medicine courses and “revenues from fees” are not significant inany year.
The implementation of the tobit regression adding two new variables: the shareof foreign students and the proportion of BA students over MA, gives the resultsreported in Table 16. In this case the type of university is always significant, witha positive relation between private institutions and higher level of efficiency. Thedummy variable “Southern Italy” remains significant in every year, with the samerelation founded before. The share of foreign students appears to be significant in4 years. The proportion of BA students over MA students is significant only in fewyears.
Implementing the tobit model only with the universities located in Northern Italy,we observe that all variables except the share of foreign students are significant.16 Thetotal number of students, the proportion of BA over MA students and the presenceof medicine courses have a limited coefficient, while the type of university (to be aprivate university) appear to be the major determinant of efficiency while limiting theanalysis on the North of Italy (Table 17).
6 Discussion, Policy Implications and Conclusions
This work has analysed public and private Italian universities.After a short comparison between the two systems, we have carried out an empirical
analysis to investigate the technical efficiency of Italian universities in the years 2007–2011, using public data from the Statistical Office of the Ministry of Education andby ANVUR. The aim of the study was to verify the existence of a difference from thepoint of view of efficiency between public and private university system, and if thisefficiency is decreased or increased over the years.
The implementation of the DEAmodel with inputs the total number of students andfaculty, and with outputs the total number of graduates and revenues resulting fromscientific research has revealed differences related to the type of universities (privateuniversities appear to be relatively more efficient than public ones) and geographicalarea (Northern universities appear to be relativelymore efficient than those of the centreand the South). The model is robust to various alternative specifications; variablesrelated to teaching seem to affect more efficiency, and in particular data related toBachelor programs.
16 It is not possible to include the share of revenue from student fees because they are not publicly availablefor year 2011.
123

84 T. Agasisti, L. Ricca
Table 15 The determinants of efficiency: second stage Tobit analysis, by year
2007 Coeff. Std. Error t P > |t| Sig.
Total students/1000 0.003 0.001 4.23 0.000 ***
Type of university 0.090 0.053 1.69 0.095
Geogr Area: Centre −0.034 0.039 −0.89 0.379
Geogr Area: South −0.119 0.035 −3.40 0.001 **
Medicine courses 0.004 0.036 0.11 0.912
Revenues from fees 0.117 0.151 0.78 0.440
Constant 0.511 0.070 7.32 0.000 ***
2008 Coeff. Std. error t P > |t| Sig.
Total students/1000 0.003 0.001 4.32 0.000 ***
Type of university 0.114 0.057 2.01 0.048 *
Geogr Area: Centre −0.010 0.038 −0.27 0.786
Geogr Area: South −0.113 0.034 −3.32 0.001 **
Medicine courses 0.018 0.035 0.52 0.607
Revenues from fees 0.194 0.158 1.23 0.222
Constant 0.424 0.070 6.05 0.000 ***
2009 Coeff. Std. error t P > |t| Sig.
Total students/1000 0.003 0.001 4.93 0.000 ***
Type of university 0.104 0.056 −1.88 0.065
Geogr Area: Centre 0.006 0.036 0.16 0.874
Geogr Area: South −0.109 0.033 −3.32 0.001 **
Medicine courses −0.026 0.034 −0.77 0.445
Revenues from fees 0.205 0.137 1.49 0.140
Constant 0.453 0.068 6.64 0.000 ***
2010 Coeff. Std. error t P > |t| Sig.
Total students/1000 0.004 0.001 5.94 0.000 ***
Type of university 0.146 0.049 2.99 0.004 ***
Geogr Area: Centre −0.043 0.032 −1.32 0.192
Geogr Area: South −0.131 0.030 −4.42 0.000 ***
Medicine courses 0.024 0.030 0.78 0.439
Revenues from fees 0.213 0.128 1.66 0.103
Constant 0.373 0.063 5.96 0.000 ***
2011 Coeff. Std. error t P > |t| Sig.
Total students/1000 0.004 0.001 5.19 0.000 ***
Type of university 0.183 0.037 4.91 0.000 ***
Geogr Area: Centre −0.032 0.035 −0.90 0.370
Geogr Area: South −0.103 0.032 −3.19 0.002 ***
Medicine courses −0.010 0.033 −0.30 0.766
Constant 0.387 0.064 6.01 0.000 ***
123

Comparing the Efficiency of Italian Public and Private… 85
Table 16 The determinants of efficiency: second stage Tobit analysis (second regression), by year
2007 Coeff. Std. error t P > |t| Sig.
Total students/1000 0.003 0.001 4.51 0.000 ***
Type of university 0.146 0.056 2.58 0.012 *
Geogr Area: Centre −0.044 0.037 −1.18 0.242
Geogr Area: South −0.085 0.039 −2.21 0.031 *
Medicine courses −0.013 0.037 0.34 0.732
Revenues from fees −0.000 0.160 0.00 0.440
Foreign students 1.815 1.105 1.64 0.105
BA/MA students −0.009 0.005 −1.84 1.000
Constant 0.467 0.077 6.07 0.000 ***
2008 Coeff. Std. error t P > |t| Sig.
Total students/1000 0.003 0.001 4.89 0.000 ***
Type of university 0.180 0.060 3.02 0.004 **
Geogr Area: Centre −0.018 0.035 −0.50 0.618
Geogr Area: South −0.070 0.035 −1.99 0.050 *
Medicine courses 0.005 0.035 0.15 0.885
Revenues from fees 0.062 0.173 0.36 0.722
Foreign students 2.350 0.790 2.97 0.004 **
BA/MA students −0.013 0.007 −1.82 0.073
Constant 0.351 0.071 4.93 0.000 ***
2009 Coeff. Std. error t P > |t| Sig.
Total students/1000 0.004 0.001 5.35 0.000 ***
Type of university 0.185 0.061 3.02 0.004 **
Geogr Area: Centre 0.001 0.034 0.02 0.986
Geogr Area: South −0.077 0.036 −2.12 0.038 *
Medicine courses −0.047 0.035 −1.36 0.179
Revenues from fees 0.013 0.160 0.08 0.936
Foreign students 1.756 0.840 2.09 0.040 *
BA/MA students −0.020 0.009 −2.08 0.042 *
Constant 0.403 0.074 5.41 0.000 ***
2010 Coeff. Std. error t P > |t| Sig.
Total students/1000 0.004 0.001 6.51 0.000 ***
Type of university 0.219 0.059 3.71 0.000 ***
Geogr Area: Centre −0.052 0.031 −1.65 0.103
Geogr Area: South −0.092 0.034 −2.75 0.008 **
Medicine courses 0.018 0.032 0.58 0.563
Revenues from fees 0.066 0.161 0.41 0.685
Foreign students 1.953 0.733 2.66 0.010 **
123

86 T. Agasisti, L. Ricca
Table 16 continued
2010 Coeff. Std. error t P > |t| Sig.
BA/MA students −0.016 0.010 −1.57 0.121
Constant 0.292 0.069 4.24 0.000 ***
2011 Coeff. Std. error t P > |t| Sig.
Total students/1000 0.367 0.674 5.54 0.000 ***
Type of university 0.193 0.036 5.40 0.000 ***
Geogr Area: Centre −0.030 0.034 −0.89 0.376
Geogr Area: South −0.074 0.035 −2.10 0.040 *
Medicine courses −0.021 0.032 −0.64 0.523
Foreign students 1.444 0.608 2.38 0.021 *
BA/MA students −0.022 0.010 2.24 0.029 *
Constant 0.392 0.071 5.52 0.000 ***
Table 17 The determinants of efficiency: second stage Tobit analysis, only Northern universities
Coeff. Std. error t P > |t| Sig.
Total students/1000 0.004 0.000 10.47 0.000 ***
Type of university 0.180 0.021 8.71 0.000 ***
Medicine courses −0.080 0.018 −4.36 0.000 ***
Foreign students −0.285 0.566 −0.50 0.615
BA/MA students −0.021 0.003 −7.73 0.000 ***
Constant 0.486 0.038 12.88 0.000 ***
Subsequently, we have calculated the Malmquist index, in order to conduct a com-parison over years. This analysis has showed that the overall efficiency of Italianuniversities has increased over the 5 year examined, particularly thanks to an improve-ment in pure efficiency. The universities that have seen a higher improvement werethose located in central Italy and public universities.
To investigate the main determinants of efficiency, we have finally carried out a sec-ond level regression, which shows that the geographical area is the major determinantof efficiency: universities located in the South of Italy are related to lower efficiencyscores.
This study thus shows how Italian private universities are more efficient than publicones, confirming the impression that the former are able to “produce” more educa-tional and research outputs with the same (or lower) level of inputs. Data also showthat differences between Northern and Southern universities persist: it is not possibleto attribute to the structural characteristics of universities the differentials in efficiency,as the type of institutions doesn’t determine the differential. Differences in efficiencyscores do not reside in the structural characteristics of universities but on the manage-ment and processes of single institutions.
123

Comparing the Efficiency of Italian Public and Private… 87
Comparing our results to those of other authors, we can compare evidence withstudies focused only on the Italian system: Agasisti and Dal Bianco (2006), Monaco(2012), Agasisti and Lezzi (2013). First of all, the gap in efficiency scores betweenuniversities in different geographical areas is a common characteristic of these studies.On the other hand, in contradiction to our findings, Agasisti and Lezzi (2013) concludethat productivity growth was due to major technological change—while we find morepure efficiency gains; however they analyse overall change between 2001 and 2011, notincluding private institutions. They also found a significant relation between the levelof student fees and efficiency, while in our analysis this variable is not significant. Asemerged in Monaco (2012), also our study denoted that private universities are moreefficient than public, although in her paper, having a single academic year, wasn’tconducted the Malmquist analysis, so our work innovates in giving a clearer ideaabout the dynamics of efficiency across sectors. As already cited in the paper, thecomparison of some scores reveals that the most efficient institutions of our study alsoobtain efficiency scores also in Monaco’s work.
Our work has three main policy implications. The first evidence is the persistenceof a differential in terms of efficiency between Northern and Southern universities, asit has been showed in previous studies. Given the observed trend of performance andefficiency, it is not possible to fill the gap between South and North unless the designof policies specifically targeted. This is a “local” problem, so it is evident that a uniquenational policy is inefficient in this case. For Northern universities policies aimed toreduce costs are ineffective, because those universities have already reached a goodlevel of efficiency and so there are few margins of improving in this sense. To increasethe overall efficiency of the system, and fill the gap between North and South, thenational legislature can introduce some actions to permit to Southern universities tostudy and follow the managerial practices of the most efficient Northern universities.Also, policies should be differentiated for the different areas of the country. The secondmain result of the study is that private universities are more efficient than public ones.We can therefore say that public universities can somehow “learn” from the privatesector. The traditional distinction and separation between Italian public and privateuniversities has no basis in terms of efficiency. The creation of a unique system, inwhich universities compare themselves and compete, can create more opportunitiesto improve their practices. In this sense, the separation of funds for financing publicuniversities and private ones, with government funds per student lower for the latter,has no explication for policy purposes. The financing system may be reconsideredwith a view on how funds are effectively used, rather than with the actual system pri-marily based on historical principles. One way to fasten the two systems is to mergethe ordinary financing fund for universities (FFO) and the fund deriving from the Law243 of 1991 to create a unique national financial fund. The third evidence is related tothe second stage analysis. If we look at the results we can note that several variablesaffect the efficiency: revenues from fees, foreign students, etc., but in a non-stable way.This may be due to the fact that data collected from the official sites and used for thepresent analysis are inadequate for the study of this phenomenon. It could be usefulfor the central bodies to promote a collection of information related to the manage-rial practices of universities. The absence of a comparable database on the differentmanagerial aspects of the Italian institutions does not permit to deepen the present
123

88 T. Agasisti, L. Ricca
analysis to understand which are the managerial practices that are associated withhigher efficiency scores; exploring some detailed characteristics about the decision-making processes and activities can be an interesting direction for taking the efficiencyanalysis a further step.
Thinking on future research, it should finally be noted that, due to a discontinuity ofthe time series, in the present work it has not been possible to include data on contractteachers, which for private universities represent a significant share of the total faculty.We can also note that the availability of standardized tests on student achievement,an output indicator already used in some studies for other countries, would help inconducting analysis on the efficiency of universities. The possibility of use individualdata on students may also allow a more detailed analysis. Many studies have in factshown that the results of the education process depend also on the characteristics of thestudents themselves. We hope that the development of the “Anagrafe degli Studenti”(Census of Students), recently promoted by the Ministry of Education, would helpresearchers in the next future.
Acknowledgments Part of thiswork has been realized during the projectwork for theMaster ofUniversityManagement (Master SUM) at theMIP Politecnico di Milano Graduate School of Business. We are gratefulto two anonymous referees for their useful and challenging comments and suggestions. All eventual errorsare our solely responsibility.
References
Agasisti T, Dal Bianco A (2006) Data envelopment analysis of the Italian University System: theoreticalissues and policy implications. Int J Bus Perform Manag 8(4):344–367
Agasisti T, JohnesG (2009)Beyond frontiers: comparing the efficiency of higher education decision-makingunits across more than one country. Educ Econ 17(1):59–79
Agasisti T, Lezzi M (2013) The efficiency of Italian public universities in the medium run (2001–2011): adata envelopment analysis. Politecnico di Milano School of Management, Working Paper, Mimeo
Agasisti T, Pérez-Esparrels C (2010) Comparing efficiency in a cross-country perspective: the case of Italianand Spanish state universities. Hig Educ 59(1):85–193
Agasisti T, Pohl C (2012) Comparing German and Italian public universities: convergence or divergence inthe higher education landscape. Manag Decis Econ 33(1):71–85
Bergantino AS, Capozza C, Porcelli F (2012) Measuring the efficiency of the Italian University system:the role of market structure. A two step DEA analysis at faculty level. XXV Conferenza della Societàitaliana di economia pubblica
Clark BR (1983) The higher education system: academic organization in cross-national perspective. Uni-versity of California Press, Berkeley
Cohn E, Rhine SLW, Santos MC (1989) Institutions of higher education as multi-product firms: economiesof scale and scope. Rev Econ Stat 71(2):284–290
Cooper WW, Seiford LM, Tone K (2006) Introduction to data envelopment analysis and its uses. Springer,New York
Daraio C, Simar L (2007) Advanced robust and nonparametric methods in efficiency analysis. Methodologyand applications. Springer, New York
Johnes G (1993) The economics of education. The MacMillan Press, LondonJohnes J (2004) Efficiency measurement. In: Johnes G, Johnes J (eds) International handbook on the
economics of education. Edward Elgar Publishing Ltd, CheltenhamJohnes J (2006a) Measuring teaching efficiency in higher education: an application of data envelopment
analysis to economics graduates from UK universities. Eur J Open Res 174(1):443–456Johnes J (2006b) Data envelopment analysis and its application to the measurement of efficiency in higher
education. Econ Educ Rev 25(3):273–288
123

Comparing the Efficiency of Italian Public and Private… 89
Johnes J, Taylor J (1990) Performance indicators in higher education: UK Universities. Open UniversityPress and the Society for Research into Higher Education, Milton Keynes
LevyDC (2012) How important is private higher education in Europe? A regional analysis in global context.Eur J Educ 47(2):178–197
Monaco L (2012) Measuring Italian University efficiency: a non-parametric approach. MPRA Paper No37949
Parteka A, Wolszczak-Derlacz J (2013) Dynamics of productivity in higher education—cross Europeanevidence based on bootstrapped Malmquist indices. J Prod Anal 40(1):67–82
Pesenti R, Ukovich W (1999) Evaluating academic activities using DEA. Internal Report, DEEI-Universitàdi Trieste
Rizzi D (1999) L’efficienza dei dipartimenti dell’Università Ca’ Foscari di Venezia via DEA e DFA, Econo-mia pubblica
Simar L, Wilson P (1999) Estimating and bootstrapping Malmquist indices. Eur J Oper Res 115:459–471Simar L, Wilson P (2000) A general methodology for bootstrapping in non-parametric frontier models. J
Appl Stat 27(6):779–802Turri M (2011) L’università in transizione. Governance, struttura economica e valutazione, Guerini studio,
MilanoWilson PW (2008) FEAR 1.0: a software package for frontier efficiency analysis with R. Socio-Econ Plan
Sci 42:247–254Worthington A (2001) An empirical survey of frontier efficiency measurement techniques in education.
Educ Econ 9(3):245–268Zhu J (2003) Quantitative models for performance evaluation and benchmarking. Kluwer, Boston
123