The Business Simulation Paradigm: Tracking Effectiveness ...
Comparing the effectiveness of tracking methods for medium ... · Comparing the effectiveness of...
7
ZOOLOGIA 28 (2): 207–213, April, 2011 doi: 10.1590/S1984-46702011000200008 © 2011 Sociedade Brasileira de Zoologia | www.sbzoologia.org.br | All rights reserved. Many mammal species are not easily observed in their habitats. Among non-invasive methods proposed to overcome this limitation, tracking traps have been one of the most widely used. Track registry has been largely used in ecological studies of wild mammals to estimate mammal abundance, density, distribution, and richness (JUSTICE 1961, MARTEN 1972, SCHALLER 1980, TRAVAINI et al. 1996, WILSON et al. 1996, and others). It is one of the oldest methods for the identification of medium- sized to large mammals (BECKER & DALPONTE 1991). Among the several techniques proposed to obtain tracks, the sand plot (usually called scent-station when baited) is the most used. Sand plots consist basically of a plot of fine soil to record tracks. After the development of the sand plot technique, some new tracking methods have been proposed. Kymograph paper (SEALANDER et al. 1958), toner or talcum powder applied over contact papers (MAYER 1957), and carbon-sooted alu- minium plates (BARRETT 1983, RAPHAEL et al. 1986, TAYLOR & RAPHAEL 1988) have been used to record tracks of small rodents and medium-sized carnivores. Nevertheless, little is known about their performances, and many of them are susceptible to adverse weather conditions. Smoked aluminium surfaces, kymograph paper, and sand plots are usually damaged by rain (CONNER et al. 1983, NOTTINGHAM et al. 1989, DIEFENBACH et al. 1994, MABBE 1998), and sand plots may dry during warm days before animals step on them, which may compromise track registry. In addition, track stations made of print ink board are impractical for registering tracks of large mammals (RATZ 1997, but see PALMA & GURGEL-GONÇALVES 2007). MABEE (1998) described a tracking method for small mam- mals based on tracking tubes designed by MERRIAM (1990) and VAN APELDOORN et al. (1993) which withstand wet environmen- tal conditions. Different kinds of covers have been proposed to protect tracking plots from precipitation, such as cages or plastic sheeting to host the tracking plots (ZIELINSKI & KUCERA 1995, LOUKMASS et al. 2002, BALDWIN et al. 2006, PALMA & GURGEL- GONÇALVES 2007). However, they are overall impractical, especially if they need to be large enough to protect tracking plots designed for medium-sized to large mammals. Besides the limitations of these methods, their adequacy for use in par- ticular habitats, weather conditions, and different taxa can only be assessed by systematic experiments that test their efficiency and point out their advantages under each condition. Never- Comparing the effectiveness of tracking methods for medium to large-sized mammals of Pantanal Natalie Olifiers 1,3 ; Diogo Loretto 2 ; Vitor Rademaker 3 & Rui Cerqueira 2 1 School of Biomedical and Biological Sciences, University of Plymouth, Drake Circus, Plymouth. PL4 8AA, UK 2 Laboratório de Vertebrados, Departamento de Ecologia, Universidade Federal do Rio de Janeiro. Caixa Postal 68020, 21941-590 Rio de Janeiro, RJ, Brazil. 3 Laboratório de Biologia e Parasitologia de Mamíferos Silvestres Reservatórios, Instituto Oswaldo Cruz, Fundação Oswaldo Cruz. 21040-360 Rio de Janeiro, RJ, Brazil. ABSTRACT. Most Neotropical mammals are not easily observed in their habitats, and few studies have been conducted to compare the performance of methods designed to register their tracks. We compared the effectiveness of track registry between sand plots and two tracking methods that use artificial materials to record tracks: the sooted paper, and the plastic board methods. The latter is described here for the first time. From 2002 to 2005, we conducted two experiments in three study sites in the Pantanal region of Brazil. We compared the artificial methods with the sand plot by registering track presence/absence, the number of identifiable tracks, and the total number of tracks (identifiable and unrecognizable) in each tracking plot. Individuals avoided artificial tracking plots either by not stepping on them or by doing it fewer times than on the sand plots. The use of artificial materials to register mammal tracks resulted in under- estimates that are especially relevant to short-term ecological studies. We recommend the use of the traditional sand plot method whenever possible and the development of detailed studies on the efficiency of artificial methods under a variety of environmental conditions and time lengths. Despite their relatively lower efficiency, we believe that artificial methods are useful under specific conditions and may be more efficient if used in more comprehensive sampling efforts. KEY WORDS. Mammals; Pantanal; plastic board, scent-station; track-plates.
-
Upload
nguyendiep -
Category
Documents
-
view
216 -
download
0
Transcript of Comparing the effectiveness of tracking methods for medium ... · Comparing the effectiveness of...
ZOOLOGIA 28 (2): 207–213, April, 2011doi: 10.1590/S1984-46702011000200008
© 2011 Sociedade Brasileira de Zoologia | www.sbzoologia.org.br | All rights reserved.
Many mammal species are not easily observed in theirhabitats. Among non-invasive methods proposed to overcomethis limitation, tracking traps have been one of the most widelyused. Track registry has been largely used in ecological studiesof wild mammals to estimate mammal abundance, density,distribution, and richness (JUSTICE 1961, MARTEN 1972, SCHALLER
1980, TRAVAINI et al. 1996, WILSON et al. 1996, and others). It isone of the oldest methods for the identification of medium-sized to large mammals (BECKER & DALPONTE 1991).
Among the several techniques proposed to obtain tracks,the sand plot (usually called scent-station when baited) is themost used. Sand plots consist basically of a plot of fine soil torecord tracks. After the development of the sand plot technique,some new tracking methods have been proposed. Kymographpaper (SEALANDER et al. 1958), toner or talcum powder appliedover contact papers (MAYER 1957), and carbon-sooted alu-minium plates (BARRETT 1983, RAPHAEL et al. 1986, TAYLOR &RAPHAEL 1988) have been used to record tracks of small rodentsand medium-sized carnivores. Nevertheless, little is knownabout their performances, and many of them are susceptibleto adverse weather conditions. Smoked aluminium surfaces,
kymograph paper, and sand plots are usually damaged by rain(CONNER et al. 1983, NOTTINGHAM et al. 1989, DIEFENBACH et al.1994, MABBE 1998), and sand plots may dry during warm daysbefore animals step on them, which may compromise trackregistry. In addition, track stations made of print ink board areimpractical for registering tracks of large mammals (RATZ 1997,but see PALMA & GURGEL-GONÇALVES 2007).
MABEE (1998) described a tracking method for small mam-mals based on tracking tubes designed by MERRIAM (1990) andVAN APELDOORN et al. (1993) which withstand wet environmen-tal conditions. Different kinds of covers have been proposedto protect tracking plots from precipitation, such as cages orplastic sheeting to host the tracking plots (ZIELINSKI & KUCERA
1995, LOUKMASS et al. 2002, BALDWIN et al. 2006, PALMA & GURGEL-GONÇALVES 2007). However, they are overall impractical,especially if they need to be large enough to protect trackingplots designed for medium-sized to large mammals. Besides thelimitations of these methods, their adequacy for use in par-ticular habitats, weather conditions, and different taxa can onlybe assessed by systematic experiments that test their efficiencyand point out their advantages under each condition. Never-
Comparing the effectiveness of tracking methods for mediumto large-sized mammals of Pantanal
Natalie Olifiers1,3; Diogo Loretto2; Vitor Rademaker3 & Rui Cerqueira2
1 School of Biomedical and Biological Sciences, University of Plymouth, Drake Circus, Plymouth. PL4 8AA, UK2 Laboratório de Vertebrados, Departamento de Ecologia, Universidade Federal do Rio de Janeiro. Caixa Postal 68020,21941-590 Rio de Janeiro, RJ, Brazil.3 Laboratório de Biologia e Parasitologia de Mamíferos Silvestres Reservatórios, Instituto Oswaldo Cruz, Fundação OswaldoCruz. 21040-360 Rio de Janeiro, RJ, Brazil.
ABSTRACT. Most Neotropical mammals are not easily observed in their habitats, and few studies have been conducted
to compare the performance of methods designed to register their tracks. We compared the effectiveness of track
registry between sand plots and two tracking methods that use artificial materials to record tracks: the sooted paper,
and the plastic board methods. The latter is described here for the first time. From 2002 to 2005, we conducted two
experiments in three study sites in the Pantanal region of Brazil. We compared the artificial methods with the sand plot
by registering track presence/absence, the number of identifiable tracks, and the total number of tracks (identifiable and
unrecognizable) in each tracking plot. Individuals avoided artificial tracking plots either by not stepping on them or by
doing it fewer times than on the sand plots. The use of artificial materials to register mammal tracks resulted in under-
estimates that are especially relevant to short-term ecological studies. We recommend the use of the traditional sand
plot method whenever possible and the development of detailed studies on the efficiency of artificial methods under a
variety of environmental conditions and time lengths. Despite their relatively lower efficiency, we believe that artificial
methods are useful under specific conditions and may be more efficient if used in more comprehensive sampling efforts.
KEY WORDS. Mammals; Pantanal; plastic board, scent-station; track-plates.

208 N. Olifiers et al.
ZOOLOGIA 28 (2): 207–213, April, 2011
theless, a few studies have compared the performance of meth-ods designed for track registry (LOUKMASS et al. 2002, BELANT 2003,SARGEANT et al. 2003, BALDWIN et al. 2006, GOMPPER et al. 2006).Therefore, it is necessary to test the efficiency of tracking meth-ods, and to find alternative methods to overcome their pitfalls.
We have experimentally compared the efficiency of twoartificial tracking methods against sand plots: the first methodis called plastic board and is described here for the first time;the second method is the sooted paper method. We comparedthe track presences/absences, the total number of tracks andthe number of identifiable tracks between sand plot and artifi-cial tracking plots to investigate the effectiveness of the artificialmethods. We expected a greater number of total tracks andtrack presence on sand plots, since some species may be waryof, and avoid stepping on, plastic board or sooted paper, dueto their shape or smell. We also expected the performance ofeach method to vary according to environmental conditions.We anticipated a greater number of identifiable tracks on theplastic board, once it is protected against rain and it is notaffected by dry weather conditions. Sooted paper and sand plotmethods were expected to perform in a similar way under wetconditions, as both are susceptible to damage by rain. How-ever, sooted paper would not be affected by dry conditions andtherefore, may perform between under such condition.
MATERIAL AND METHODS
The comparison between techniques took place in threeareas located in the Nhecolândia sub-region of Pantanal, Bra-zil: Alegria ranch (19°08’S, 56°49’W), Nhumirim ranch (18º59’S,56º39’W), and Rio Negro ranch (19°34’S, 56°14’W). ThePantanal is the world’s largest seasonal floodplain. This regionis characterized by sandy soil with a mosaic vegetation ofsemideciduous forest, dispersed shrub vegetation, and season-ally flooded fields (RODELA 2006). Several permanent andtemporary ponds and “salinas” (brackish water ponds) arepresent. Human population density is low (< 2 people per km2)and the main economic activity is cattle ranching (ADAMOLI
1987). The Pantanal has a high diversity and density of me-dium-sized to large mammals (ALHO et al. 1988, MITTERMEIER etal. 1990, ALHO & LACHER 1991), which makes it an adequatearea for this study.
The three study sites differ mainly in land use: the RioNegro ranch is a preserved area located at the margin of theNegro River, where cattle ranching is absent. Alegria ranch andNhumirim ranch are neighbour ranches located in an area with-out major rivers nearby. Nhumirim ranch is a research stationof the Brazilian Agricultural Research Corporation (Embrapa)where there is a preserved area, but also pasture lands for cattleranching; Alegria ranch is predominantly composed of pasturesin which cattle ranching is the main economic activity.
The new tracking method consists of two overlappingplastic sheets. The plastics are commonly used together in a
toy named “magic board” (we have adopted the name “plasticboard” to describe this new method), and its commercial nameis Lamicel© (CIPATEX). This is a synthetic laminated plastic usedin baby carts, bag covering, plastic paints, toys, domestic andoffice utensils, and can be obtained from companies workingwith plastic manufactures.
The upper sheet is made of a fluorescent pink plastic,and the lower one is a white sheet. Both sheets are 0.2 mmthick. When the animal steps on the trap, the upper sheet ispressed against the lower one and the tracks become visible(Fig. 1). Track images remain visible until one separates theplastics by pulling them apart. To protect the plastic board fromrainfall, we covered it with a thin light-brown plastic. The plas-tics were then attached with adhesive tape to a basis made of ahard material that is able to account for substrate irregularities(usually a thin light metal or hard plastic sheet).
Figures 1-2. (1) Track of C. thous on the plastic board plot and (2)tracking station showing a sand plot and a plastic board placedside by side in 2002 at the Rio Negro ranch, Pantanal, Brazil.
The other method tested was the sooted tracking paper.We used sheets of glossy paper coated with soot from a kero-sene-camphor torch (15 g per kerosene litre; adapted fromBARRET, 1983, TAYLOR & RAPHAEL 1988, HESKE 1995).
1
2

209Comparing the effectiveness of tracking methods for medium to large-sized mammals
ZOOLOGIA 28 (2): 207–213, April, 2011
From July, 2002 to June, 2005, we developed two experi-ments in the three study sites. The performance of the artificialmethods was tested by comparing their effectiveness againstthe sand plot method in a total of six expeditions to Alegriaranch (March 2003), Nhumirim ranch (June 2005), and RioNegro ranch (July-August 2002, February 2003, May 2003, andOctober 2004). Tracking stations with the plastic board wereestablished in Rio Negro (2002 and 2003) and Alegria ranches(2003), whereas sooted paper stations were placed in the RioNegro (2004) and Nhumirim (June 2005) ranches.
We established a total of 69 tracking stations spaced atleast 200 m apart, each composed of two 0.49 m2 tracking plots(70 x 70 cm; Fig. 2). One of the plots was either set with theplastic board, or the sooted paper, and the other was a sandplot made of sifted and moistened sand. We used several dif-ferent baits, such as bacon, meat, roots, seeds, fruits, and saltplaced in the centre of each tracking plot; bobcat, fawn, andrabbit urines were also used as attractants. The same type ofbait or attractant was used in each pair of tracking plots. Thetracking stations were checked every day and damaged plotswere fixed or replaced; baits or attractants were renewed asneeded. We set up to seven tracking stations a day. Each re-mained at the same site for a maximum of five days. Byfrequently moving the tracking station sites, we maximizedthe number of habitats sampled, avoiding occasional trap-happy resident individuals. Track stations were set in differenthabitats, including open areas, forest, edge of salinas, andponds, and along dirty roads.
Tracks obtained on the plastic board were photographedand copied by overlapping and outlining the tracks on an ac-etate sheet; those obtained on sooted paper were photographed,cut away and laminated. Tracks were then identified by com-paring them with a reference collection of footprints obtainedon the plastic board from mammals of the Rio de Janeiro’s Zoo(Fundação RIO-ZOO) and with track field guides for Brazilianmammals (BECKER & DALPONTE 1991, BORGES & TÓMAS 2004).
To investigate the relative efficiency of the methods inrecording species tracks, we counted the number of identifi-able tracks (those judged as clearly recognizable) on eachtracking plot and used them to compare between sand plotsand artificial tracking plots (either the plastic board or thesooted paper) using Wilcoxon matched pairs test (SIEGEL 1977).Lost records such as plots damaged by adverse weather condi-tions or animal interference were included in this particularanalysis because we understand that they reflect the limita-tions of the methods being compared. The Wilcoxon test is anon-parametric test designed for dependent samples, whichare the two plots of a tracking station in this case. Therefore,variables not directly linked to the two plots being compared(e.g. different baits used between stations) do not represent asource of error in the comparison. The only variables that mustbe controlled are those directly related to the two plots beingcompared in a tracking station (e.g. plots of the same size and
baited with the same bait or attractant). Moreover, given thatour experiment was designed for a pair wise analysis (sand plotvs. plastic board and sand plot vs. sooted paper), a three-waycomparison using a Kruskal-Wallis test, for example, would notbe adequate for this dataset. To investigate whether some spe-cies avoid the plastic board or sooted paper methods, wecompared the frequency of track presence/absence on pairs oftracking methods using the McNemar test (SIEGELL 1977), andthe total number of tracks (identifiable and unrecognizable)using the Wilcoxon matched pairs test.
An additional way of evaluating the degree to which spe-cies are wary of the artificial methods is to compare the observedfrequency of animals visiting the plastic board or the sootedpaper with the “expected frequency” of visits, after an animalhas been detected in a tracking station. Therefore, we selectedthe tracking stations where animals occurred and comparedthe observed frequency of tracks on artificial plots with theexpected frequency using Chi-square tests. The presence of ananimal at a station was determined by its tracks on any track-ing plot of a station. The expected frequency of tracks on theartificial plots was expected to be 50%, i.e., once present at atracking station, the probability of an individual stepping ornot on an artificial plot was assumed to be the same. For thosestations that remained in the field for a total of five consecu-tive days, we presented cumulative species richness curves forthe sand plots and the alternative methods using a diversityrarefaction analysis (PAST 1.99 software, HAMMER et al. 2001).
When more than twenty tracks were found on a track-ing plot, the total number of tracks was rounded off to thenearest ten; we did this to compensate for the increased errorprobability when counting a large number of tracks. When-ever possible, registries of the most abundant species – thecrab-eating fox, Cerdocyon thous Smith, 1839 and the agouti,Dasyprocta azarae Lichtenstein, 1823 – were analyzed separately.Data for the remaining species were clumped and analyzedtogether due to small sample sizes. Since the occurrence of thesespecies on the tracking stations was somewhat rare, the effectof each on the test result was similar.
We considered � = 0.05 for large samples sizes (C. thous,N > 70). For the remaining comparisons, � = 0.10, given thesmall sample sizes (N < 30) and the relatively low power of theanalyses (e.g. Power = 73% for N = 30 and medium effect size ina two-tailed comparison between number of tracks usingWilcoxon test – FAUL et al. 2007).
RESULTS
We obtained 138 records (number of species per trackstation-night) of 11 medium to large-sized mammal species(Tab. I) on a total of 173 tracking station-nights. Fourteen mam-mal track records could not be identified at the species levelbut were included in the statistical analysis. Tracks of young C.thous are usually undistinguishable from those of the hoary
210 N. Olifiers et al.
ZOOLOGIA 28 (2): 207–213, April, 2011
fox, Lycalopex vetulus Lund, 1842. Nevertheless, because L.vetulus is rare or absent in the studied areas, we considered alltracks as being of C. thous in the analysis.
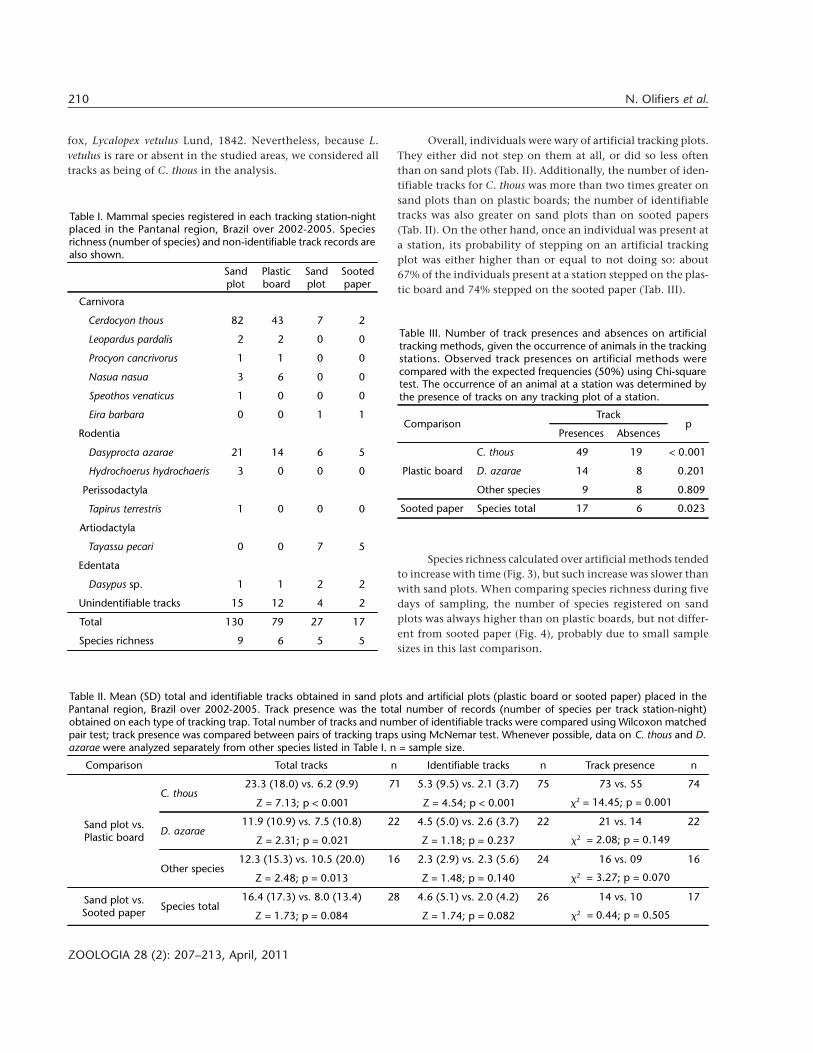
Overall, individuals were wary of artificial tracking plots.They either did not step on them at all, or did so less oftenthan on sand plots (Tab. II). Additionally, the number of iden-tifiable tracks for C. thous was more than two times greater onsand plots than on plastic boards; the number of identifiabletracks was also greater on sand plots than on sooted papers(Tab. II). On the other hand, once an individual was present ata station, its probability of stepping on an artificial trackingplot was either higher than or equal to not doing so: about67% of the individuals present at a station stepped on the plas-tic board and 74% stepped on the sooted paper (Tab. III).
Table III. Number of track presences and absences on artificialtracking methods, given the occurrence of animals in the trackingstations. Observed track presences on artificial methods werecompared with the expected frequencies (50%) using Chi-squaretest. The occurrence of an animal at a station was determined bythe presence of tracks on any tracking plot of a station.
ComparisonTrack
p Presences Absences
Plastic board
C. thous 49 19 < 0.001
D. azarae 14 8 0.201
Other species 9 8 0.809
Sooted paper Species total 17 6 0.023
Table I. Mammal species registered in each tracking station-nightplaced in the Pantanal region, Brazil over 2002-2005. Speciesrichness (number of species) and non-identifiable track records arealso shown.
Sandplot
Plasticboard
Sandplot
Sootedpaper
Carnivora
Cerdocyon thous 82 43 7 2
Leopardus pardalis 2 2 0 0
Procyon cancrivorus 1 1 0 0
Nasua nasua 3 6 0 0
Speothos venaticus 1 0 0 0
Eira barbara 0 0 1 1
Rodentia
Dasyprocta azarae 21 14 6 5
Hydrochoerus hydrochaeris 3 0 0 0
Perissodactyla
Tapirus terrestris 1 0 0 0
Artiodactyla
Tayassu pecari 0 0 7 5
Edentata
Dasypus sp. 1 1 2 2
Unindentifiable tracks 15 12 4 2
Total 130 79 27 17
Species richness 9 6 5 5
Table II. Mean (SD) total and identifiable tracks obtained in sand plots and artificial plots (plastic board or sooted paper) placed in thePantanal region, Brazil over 2002-2005. Track presence was the total number of records (number of species per track station-night)obtained on each type of tracking trap. Total number of tracks and number of identifiable tracks were compared using Wilcoxon matchedpair test; track presence was compared between pairs of tracking traps using McNemar test. Whenever possible, data on C. thous and D.azarae were analyzed separately from other species listed in Table I. n = sample size.
Comparison Total tracks n Identifiable tracks n Track presence n
Sand plot vs.Plastic board
C. thous23.3 (18.0) vs. 6.2 (9.9) 71 5.3 (9.5) vs. 2.1 (3.7) 75 73 vs. 55 74
Z = 7.13; p < 0.001 Z = 4.54; p < 0.001 �2 = 14.45; p = 0.001
D. azarae11.9 (10.9) vs. 7.5 (10.8) 22 4.5 (5.0) vs. 2.6 (3.7) 22 21 vs. 14 22
Z = 2.31; p = 0.021 Z = 1.18; p = 0.237 �2 = 2.08; p = 0.149
Other species12.3 (15.3) vs. 10.5 (20.0) 16 2.3 (2.9) vs. 2.3 (5.6) 24 16 vs. 09 16
Z = 2.48; p = 0.013 Z = 1.48; p = 0.140 �2 = 3.27; p = 0.070
Sand plot vs.Sooted paper
Species total16.4 (17.3) vs. 8.0 (13.4) 28 4.6 (5.1) vs. 2.0 (4.2) 26 14 vs. 10 17
Z = 1.73; p = 0.084 Z = 1.74; p = 0.082 �2 = 0.44; p = 0.505
Species richness calculated over artificial methods tendedto increase with time (Fig. 3), but such increase was slower thanwith sand plots. When comparing species richness during fivedays of sampling, the number of species registered on sandplots was always higher than on plastic boards, but not differ-ent from sooted paper (Fig. 4), probably due to small samplesizes in this last comparison.

211Comparing the effectiveness of tracking methods for medium to large-sized mammals
ZOOLOGIA 28 (2): 207–213, April, 2011
DISCUSSION
This is one of the few studies attempting to compare therelative efficiency of tracking trap methods for medium-sizedto large mammals (see also FORESMAN & PEARSON 1998, HARRISON
et al. 2002, LOUKMASS et al. 2002, GOMPPER et al. 2006, BAREA-AZCÓN
et al. 2007). Despite the small sample sizes, the differences be-tween tracking methods were evident: sand plots performedbetter than artificial methods in 2/3 of the comparisons (Tab.II). Individuals were generally reluctant to step on the plasticboard or the sooted paper.
Many medium-sized to large mammals, especially carni-vores, have an outstanding sense of smell or sight, which allowsthem to perceive artificial materials in the environment. It isnot surprising, therefore, that the canid C. thous avoided theplastic board. The same behaviour seems to occur in other mam-malian taxa; BALDWIN et al. (2006) have found that bobcats andcoyotes avoided sites where scent stations were covered by plas-tic sheets. Likewise, GOMPPER et al. (2006) found that some greyand red fox individuals were not detected by track plates at thestudied site, although they were registered by cameras traps(but see BULL et al. 1992), and SARGEANT et al. (2003) found thatswift foxes visited sand stations 2.4 times more frequently thantrack plates.
Despite species wariness, we noticed that once an indi-vidual was detected at a tracking station, the probability of itstepping on the artificial plot was always equal to or greaterthan the probability of it not doing so (Tab. III). Therefore, webelieve that species richness underestimates generated by theutilization of artificial methods are not too severe and may beminimized by keeping artificial track plots in the field for ex-tended lengths of time, so that animals can get used to them.In fact, GOMPPER et al. (2006) noticed that each species requiresan acclimation period that precedes its willingness to step on
track plates; for instance, it is necessary to place track platesfor about 30 days in the field before the probability of captur-ing raccoon and mustelid tracks reaches 100%. Furthermore,we observed that species richness obtained with artificial track-ing methods tended to increase even during a short period oftime (five days). However, it was not possible to provide a mini-mum time length necessary to attain reliable estimates of speciesrichness.
Despite the overall species wariness with respect to artifi-cial methods in this study, the same may not be true for studiescarried out in other regions or involving other species. Speciesmay respond differently to distinct census techniques (seeBALDWIN et al. 2006, GOMPPER et al. 2006, BAREA-ASCÓN et al. 2007),and there is still a need for testing different tracking techniques,not only under different environmental conditions, but also fordifferent taxa. Due to our small samples, we had to clump dataon some species, which prevented us from detecting additionalinterespecific variation on the degree of wariness with respectto the methods employed. However, differences are obvious be-tween crab-eating foxes and agoutis, with agoutis beingapparently less wary of artificial methods than foxes (Tab. II).
In half of the comparisons, the number of identifiabletracks on artificial methods was lower than on sand plots. Thisis an additional indication that sand plots perform better thanartificial methods, since species identification relies on identi-fiable tracks. However, in the remaining two comparisons, thenumber of identifiable tracks obtained with artificial methodswas not different from sand plots (Tab. II). Moreover, one actu-ally needs just a single or a few good tracks to identify most ofthe medium and large mammalian species. In this sense, artifi-cial methods are useful, especially when utilized for extendedperiods of time. In addition, there were few rainy days duringthe sampling period, since most of the study took place duringthe dry season. The plastic boards might have performed bet-
0
2
4
6
8
10
12
14
1 2 3 4 5
Days
Cum
ula
tive
specie
srichness
Sand Plot Sand Plot Conf. Interval
Plastic Board Plastic Board Conf. Interval
0
1
2
3
4
5
1 2 3 4 5
Days
Cum
ula
tive
specie
srichness
Sand Plot Sand Plot Conf. Interval
Sooted Paper Sooted Paper Conf. Interval
Figures 3-4. Cumulative species richness and confidence intervals obtained with tracking stations that remained in the field for 5consecutive days over 2002-2005 in the Pantanal region, Brazil; (1) sand plot vs. plastic board (N = 15) and (2) sand plot vs. sootedpaper (N = 5).
3 4

212 N. Olifiers et al.
ZOOLOGIA 28 (2): 207–213, April, 2011
ter than the sand plots in wetter conditions because they wereprotected from rain.
The plastic board can be easily protected from precipita-tion and it is inexpensive, reusable, and lightweight. Moreover,the upper fluorescent plastic sheet can be obtained in differentcolours (e.g. grey or green) and thickness, which might resultin better track record efficiency. Therefore, despite species wari-ness, the plastic board may be a good option under specificconditions, such as extremely wet weather or when track plotscannot be checked every day. Its efficiency under such condi-tions remains to be tested.
We have found that mammal species respond differentlyto the tracking method used. We believe that artificial trackingmethods are disadvantageous in short-term surveys becauseindividuals and species tend to need time to get used to them.In long-term studies, however, these methods seem to yieldrobust estimates of species richness. We encourage further stud-ies comparing tracking methods under different weatherconditions, biomes, time lengths, and for different taxa, so thatresearchers can select the best method under specific environ-mental conditions and for particular species. As noticed byGOMPPER et al. (2006), the use of non-invasive surveying tech-niques is wide and is increasing, which highlights theimportance of studying their limitations and biases.
ACKNOWLEDGEMENTS
We are thankful to Conservation International, EmpresaBrasileira de Pesquisa Agropecuária, and H. Herrera for givingpermission to conduct this research on their properties.Fundação Rio-Zoo also helped in logistic and lodging matterduring the development of this study, and CS Aguiar Repres-entações Ltda provided the material for the plastic board. Specialthanks to Peter Vacchina who helped us reviewing an earlierversion of the manuscript. Financial support was provided byFAPERJ-RJ, Brazil.
LITERATURE CITED
ADAMOLI, J. 1987. Vegetação do Pantanal, p. 23-25. In: A.C. ALLEM
& J.F.M. VALLS (Eds). Recursos forrageiros nativos do Pan-tanal mato-grossense. Brasília, Embrapa-Cenargen.
ALHO, C.J.R.; T.E. LACHER Jr; Z.M.S. CAMPOS & H.C. GONÇALVEZ. 1988.Mamíferos da Fazenda Nhumirim, sub-região de Nhecolândia,Pantanal do Mato Grosso do Sul: levantamento preliminarde espécies. Brazilian Journal of Biology 48: 213-225.
ALHO, C.J.R. & T.E. LACHER JR. 1991. Mammalian conservationin the Pantanal of Brazil, p. 280-94. In: A. MARES & D.J.SCHMIDLY (Eds). Latin american mammalogy – history,biodiversity, and conservation. Norman, University ofOklahoma Press.
BALDWIN, R.; P.S. GIPSON; G.L. ZUERCHER & R. TROY. 2006. The effectof scent-station precipitation covers on visitations by
mammalian carnivores and eastern cottontails. Transactionsof the Kansas Academy of Science 109: 3-10.
BAREA-AZCÓN, J.M.; E. VIRGÓS; E. BALLESTEROS-DUPERÓN; M. MOLEÓN
& M. CHIROSA. 2007. Surveying carnivores at large spatialscales: a comparison of four broad-applied methods.Biodiversity and Conservation 16: 1213-1230.
BARRET, R.H. 1983. Smoked aluminum track plots fordetermining furbearer distribution and relative abundance.California Fish and Game 69: 189-190.
BECKER, M. & J.C. DALPONTE. 1991. Rastros de mamíferos silves-tres brasileiros. Brasília, Editora da Universidade de Brasília.
BELANT, J.L. 2003. Comparison of 3 tracking mediums fordetecting forest carnivores. Wildlife Society Bulletin 31:744-747.
BORGES, P.A.L. & W.M. TOMÁS. 2004. Guia de rastros e outrosvestígios de mamíferos do Pantanal. Corumbá, Embrapa-Pantanal.
BULL, E.L.; R.S. HOLTHAUSEN & L.R. BRIGHT. 1992. Comparison of3 techniques to monitor marten. Wildlife Society Bulletin20: 406-410.
CONNER, M.C.; R.F. LABISKY & D.R. PROGULSKE Jr. 1983. Sand plotindices as measures of population abundance for bobcats,raccoons, gray foxes, and opossums. Wildlife SocietyBulletin 11: 146-152.
DIEFENBACH, D.R.; M.J. CONROY; R.J. WARREN; W.E. JAMES; L.A. BAKER
& T. HON. 1994. A test of the scent-station survey techniquefor bobcats. Journal of Wildlife Management 58: 10-17.
FAUL, F.; E. ERDFELDER; A.G. LANG & A. BUCHNER. 2007. G*Power 3:A flexible statistical power analysis program for the social,behavioral, and biomedical sciences. Behavior ResearchMethods 39: 175-191.
FORESMAN, K.R. & D.E. PEARSON. 1998. Comparison of proposedsurvey procedures for detection of forest carnivores. Journalof Wildlife Management 62: 1217-1226.
GOMPPER, M.E.; R.W. KAYS; J.C. RAY; S.D. LAPOINT; D.A. BOGAN &J.R. CRYAN. 2006. A Comparison of non-invasive techniquesto survey carnivore communities in north-eastern NorthAmerica. Wildlife Society Bulletin 34: 1142-1151.
HAMMER, Ø.; D.A.T. HARPER & P.D. RYAN. 2001. PAST: Paleontologicalstatistics software package for education and data analysis.Palaeontologia Electronica 4 (1): 1-9.
HARRISON, R.L.; D.J. BARR & J.W. DRAGOO. 2002. A comparison ofpopulation survey techniques for swift foxes (Vulpes velox)in New Mexico. American Midland Naturalist 148: 320-337.
HESKE, E.J. 1995. Mammalian abundances on forest-farm edgesversus forest interiors in southern Illinois: is there an edgeeffect? Journal of Mammalogy 76: 562-568.
JUSTICE, K.E. 1961. A new method for measuring home rangesof small mammals. Journal of Mammalogy 42: 462-470.
LOUKMASS, J.J. & D.T MAYAK. 2002. Track plate enclosures: boxdesigns affecting attractiveness to riparian mammals.American Midland Naturalist 149: 219-224.

213Comparing the effectiveness of tracking methods for medium to large-sized mammals
ZOOLOGIA 28 (2): 207–213, April, 2011
MABEE, T.J. 1998. A weather-resistant tracking tube for smallmammals. Wildlife Society Bulletin 26: 571-574.
MARTEN, G.G. 1972. Censuring mouse populations by means oftracking. Ecology 53: 859-867.
MAYER, M.V. 1957. A method for determining the activity ofburrowing mammals. Journal of Mammalogy 38: 531.
MERRIAM, G.M. 1990. Ecological processes in time and space offarmland mosaics, p. 121-133. In: I.S. ZONNEVELT & R.T.T.FORMAN (Eds). Changing landscapes: an ecologicalperspective. New York, Springer-Verlag.
MITTERMEIER, R.A.; I.G. CAMARA; M.T.J. PADUA & J. BLANCK. 1990.Conservation in the Pantanal of Brazil. Oryx 24: 101-112.
NOTTINGHAM B.G.; K.G. JOHNSON JR & M.R. PELTON. 1989.Evaluation of scent-station surveys to monitor raccoondensity. Wildlife Society Bulletin 17: 29-35.
PALMA, A.R.T. & R. GURGEL-GONÇALVES. 2007. Morphometricidentification of small mammal footprints from ink trackingtunnels in the Brazilian Cerrado. Revista Brasileira de Zo-ologia 24: 333-343.
RAPHAEL, M.G.; C.A. TAYLOR & R.H. BARRET. 1986. Smokedaluminum track stations record flying squirrel occurrence.Research note PSW 384: 1-3.
RATZ, H. 1997. Identification of footprints of some smallmammals. Mammalia 61: 431-441.
RODELA, L.G. 2006. Unidades de vegetação e pastagens nati-vas do Pantanal da Nhecolândia, Mato Grosso do Sul.Availabe on-line at: http://www.teses.usp.br/teses. [Accessed:28/03/2011].
SARGEANT, G.A.; P.J. WHITE; M.A. SOVADA & B.L. CYPHER. 2003. Scent-
station survey techniques fox swift and kit foxes, p. 99-105.In: M.A. SOVADA & L. CARBYN (Eds). The swift fox: ecologyand conservation in a changing world. Regina, CanadianPlains Research Center.
SCHALLER, G.B. 1980. Movement patterns of jaguar. Biotropica12: 161-168.
SEALANDER, J.A.; D.N. GRIFFIN; J.J. DECOSTA & D.B. JESTER. 1958. Atechnique for studying behavioral responses of smallmammals to traps. Ecology 39: 541-542.
SIEGELL, S. 1977. Estatística não-paramétrica para as ciênciasdo comportamento. São Paulo, McGraw-Hill do Brasil.
TAYLOR, C.A. & M.G. RAPHAEL. 1988. Identification of mammaltracks from sooted track stations in the Pacific Northwest.California Fish and Game 74: 4-15.
TRAVAINI, A.; R. LAFFITTE & M. DELIBES. 1996. Determining therelative abundance of European red foxes by scent-stationmethodology. Wildlife Society Bulletin 24: 500-504.
VAN APELDOORN, R.; M. EL DAEM; K. HAWLEY; M. KOZAKIEWCIZ; G.MERRIAM; W. NIEUWENHUIZEN & J. WEGNER. 1993. Footprints ofsmall mammals: a field method of sampling data for differentspecies. Mammalia 57: 407-422.
WILSON, D.E.; F.R. COLE; J.D. NICHOLS; R. RUDRAN & M.S. FOSTER.1996. Measuring and monitoring biological diversity:standard methods for mammals. Washington, D.C.,Smithsonian Institution Press.
ZIELINSKI, W.J. & T.E. KUCERA. 1995. American marten, fisher,lynx, and wolverine: survey methods for their detection.Albany, USDA Forest Services, General Technical ReportPacific Southwest Research STN 157.
Submitted: 23.III.2010; Accepted: 28.XI.2010.Editorial responsibility: Paulo Inácio de K.L. de Prado