Comparing the Costs of the Canada Pension Plan with Public ... · sion Plan (HOOPP), the Ontario...
12
fraserinstitute.org FRASER RESEARCH BULLETIN 1 FRASER RESEARCH BULLETIN February 2016 Proponents of the CPP and those who argue for its expansion often claim it has low costs and economies of scale, whereby the ratio of costs to assets declines as the value of assets under management grows. This paper examines that claim by compar- ing the total costs (investment and adminis- trative) of the CPP with five other large public pension plans based in Ontario including the Ontario Teachers’ Pension Plan (OTPP), the Ontario Municipal Employees Retirement Sys- tem (OMERS), the Healthcare of Ontario Pen- sion Plan (HOOPP), the Ontario Pension Board (OPB), and the OPTrust. Overall, the paper finds no systematic rela- tionship between the size of pension plan as- sets and their cost (measured as a percentage of assets). The CPP, the largest plan with $269 billion of assets, had the highest expense ratio at 1.07% of its assets on average for the whole period between 2009 and 2014. The OTPP, the next largest plan at $154 billion of assets, had the fourth highest average expense ratio (0.63%). In fact, there may be diseconomies of scale for larger public pension plans because of the complexity of implementing their investment strategies, which include contracting out for external experts—a practice that has become increasingly popular, with plans investing more in non-traditional assets such as real estate, infrastructure, and private equity. These more aggressive investment strate- gies raise costs. Whether they are justified by higher rates of return will not be known for decades, and depend on whether the assump- tion that markets have mispriced these assets is borne out. SUMMARY Comparing the Costs of the Canada Pension Plan with Public Pension Plans in Ontario by Philip Cross and Joel Emes
Transcript of Comparing the Costs of the Canada Pension Plan with Public ... · sion Plan (HOOPP), the Ontario...

fraserinstitute.org FRASER RESEARCH BULLETIN 1
F R A S E R RESEARCHBULLETIN
February 2016
�� Proponents of the CPP and those who argue for its expansion often claim it has low costs and economies of scale, whereby the ratio of costs to assets declines as the value of assets under management grows.
�� This paper examines that claim by compar-ing the total costs (investment and adminis-trative) of the CPP with five other large public pension plans based in Ontario including the Ontario Teachers’ Pension Plan (OTPP), the Ontario Municipal Employees Retirement Sys-tem (OMERS), the Healthcare of Ontario Pen-sion Plan (HOOPP), the Ontario Pension Board (OPB), and the OPTrust.
�� Overall, the paper finds no systematic rela-tionship between the size of pension plan as-sets and their cost (measured as a percentage of assets). The CPP, the largest plan with $269 billion of assets, had the highest expense ratio
at 1.07% of its assets on average for the whole period between 2009 and 2014. The OTPP, the next largest plan at $154 billion of assets, had the fourth highest average expense ratio (0.63%).
�� In fact, there may be diseconomies of scale for larger public pension plans because of the complexity of implementing their investment strategies, which include contracting out for external experts—a practice that has become increasingly popular, with plans investing more in non-traditional assets such as real estate, infrastructure, and private equity.
�� These more aggressive investment strate-gies raise costs. Whether they are justified by higher rates of return will not be known for decades, and depend on whether the assump-tion that markets have mispriced these assets is borne out.
Summary
Comparing the Costs of the Canada Pension Plan with Public Pension Plans in Ontario
by Philip Cross and Joel Emes

Comparing the Costs of Pension Plans in Ontario
fraserinstitute.org FRASER RESEARCH BULLETIN 2
IntroductionThe Canada Pension Plan is the largest pen-sion plan in the country with roughly 13.5 mil-lion contributing members and 7.1 million ben-efits paid out in 2014/15 (Service Canada, 2015a; 2015b). Its investment arm, the Canada Pen-sion Plan Investment Board (CPPIB), managed $269 billion in assets in 2015, which it claims makes it one of the ten largest pension funds in the world (CPPIB, 2015). So it is important that Canadians understand its operations and meth-ods, especially given calls for an expanded CPP. However, despite its vast size and importance to most Canadians, there has been surprisingly little scrutiny of the CPP’s efficiency in pro-cessing pensions and questioning of the cost of the new investment model adopted in 2006.
Proponents of the CPP and those who argue for its expansion often claim it has low costs and economies of scale.1 In this view, an expan-sion of the plan would lead to larger amounts being invested through the CPPIB which would reduce costs further by distributing expenses over a larger asset base, reflecting presumed economies of scale in operating such a giant pension fund.2 Similar arguments are made in support of the new Ontario Retirement Pension Plan (ORPP).
There are several flaws in these arguments. As noted in our 2014 Fraser Institute paper, Accounting for the True Cost of the Canada Pension Plan, the published costs of running
1 The Canadian Labour Congress applauded the CPP’s “very low management costs” (CLC, 2015).
2 One reason given in support of CPP expansion is that “fees are expected to decrease with the growth of the fund” (NUPGE, 2012: 4).
just the investment arm—the Canada Pension Plan Investment Board—do not include all the expenses of operating the CPP, such as the costs incurred by the federal government in the planning and administration of pensions (Cross and Emes, 2014). When all the docu-mented costs of running the CPP and the CPPIB are added together, they amount to about 1% of the total assets of the CPP. Moreover, the costs of running the CPP have doubled over the past decade, reflecting a large increase in external management fees required to administer the CPPIB’s more complex active investment strat-egy since 2006.
More importantly, the idea that the CPP has a cost structure below the industry norm has not been tested. This paper fills that gap by comparing the total costs (administrative and investment) of the CPP with five other large public pension plans based in Ontario. These are the Ontario Teachers’ Pension Plan (OTPP), the Ontario Municipal Employees Retirement System (OMERS), the Healthcare of Ontario Pension Plan (HOOPP), the Ontario Pension Board (OPB), and the OPTrust (a plan for mem-bers of the Ontario Public Service Employees Union).
One objective is to see whether the CPP’s costs are less than other large public pension plans. All pension plans have two types of costs: those associated with administering their pen-sions, and the cost of investing their pension assets. We focus on total costs but also pres-ent breakdowns since administrative costs are not as comparable as investment costs. A sec-ond objective is to use the fact that these plans’ assets range from $17 to $154 billion to test the idea that there are economies of scale for large pension plans.

Comparing the Costs of Pension Plans in Ontario
fraserinstitute.org FRASER RESEARCH BULLETIN 3
An overview of public pension plans in Ontario
The five Ontario pension plans included in this study are among the ten largest pension funds in Canada in terms of assets (Boston Consulting Group, n.d.). We begin with a brief background note on each of the Ontario-based pension plans, proceeding from the largest to the small-est based on the size of their assets.
The Ontario Teachers’ Pension Plan took over the management of pension assets for teachers in 1990 when it was allowed to invest in assets ranging from real estate, private equity, infra-structure, and ordinary stocks and bonds (pre-viously the Teachers’ fund was limited to only buying government bonds) for its 311,000 mem-bers who are contributing or receiving pen-sion benefits.3 The OMERS was founded in 1962 and administers pensions for 410,000 members, with a similar portfolio diversification as the Teachers’ Plan. The HOOPP was created in the early 1960s and manages pensions for 269,000 nurses, lab technicians, and other staff in hos-pitals, clinics, and addiction centers across Ontario. The OPB dates back to the early 1920s and administers the Public Sector Pension Plan for 78,000 members who work directly for the provincial government. The OPTrust was founded in 1995 and oversees the pensions of 76,000 provincial government workers who are members of the Ontario Public Service Employ-ees Union.4
3 All membership numbers noted here are for 2014 and include active and retired members.
4 Notably, the OPTrust was audited by the provincial government when its former CEO filed a wrongful dismissal lawsuit alleging he was fired for attempt-ing to rein in “lavish” spending at the fund. See McFarland (2012, June 11).
The size of the five Ontario pension plans in this study cover a broad spectrum from the rel-atively small to a behemoth nearly ten times as large that approaches the scale of the CPP. This wide range allows us to study if there are any obvious economies (or diseconomies) of scale in operating large public pension plans. Mea-sured by the assets under their management, the two smallest plans are the OPTrust and the OPB, at $17 billion and $22 billion respectively. HOOPP and OMERS are mid-sized plans with $61 billion and $72 billion of assets. By far the largest plan is the Ontario Teachers’ at $154 bil-lion, putting it in a class with the CPP. The size of the Teachers’ fund reflects that it is the old-est pension plan, the large number of teachers in Ontario, the very high average salaries of its contributing members, and above average investment returns.
All the plans included in this study are based in Ontario, with headquarters in downtown Toronto. This choice was made for three rea-sons. First, it removes the distortion that could result from comparing plans in different prov-inces or cities with different cost structures, notably the cost of labour, land, and taxes. Costs in Vancouver, for example, could be inflated by higher land prices, while expenses in Alberta might be reduced by lower taxes. Second, the location of all the plans in Toronto also means they are all competing for the same talent pool and therefore will have similar wage costs for the particular profile of an individual employee. Using pension plans based in the same province and city helps to standardize for all possible regional differences. Finally, the costs of these Ontario-based pension plans are relevant to the possible cost of the new ORPP once it is set up.
The existence of several large pension plan headquarters in Toronto (including the CPPIB)
Comparing the Costs of Pension Plans in Ontario
fraserinstitute.org FRASER RESEARCH BULLETIN 4
has ramifications besides comparable costs. The group of plans has spawned its own finan-cial services industry which provides advice on everything from investment strategies to accounting, legal and technical support, and even journalists dedicated to covering the industry. It then becomes in the interest of this financial services industry to see public pension plans expand and to encourage the creation of new plans, such as the Ontario Retirement Pen-sion Plan (DiSalvo, 2015: 133).
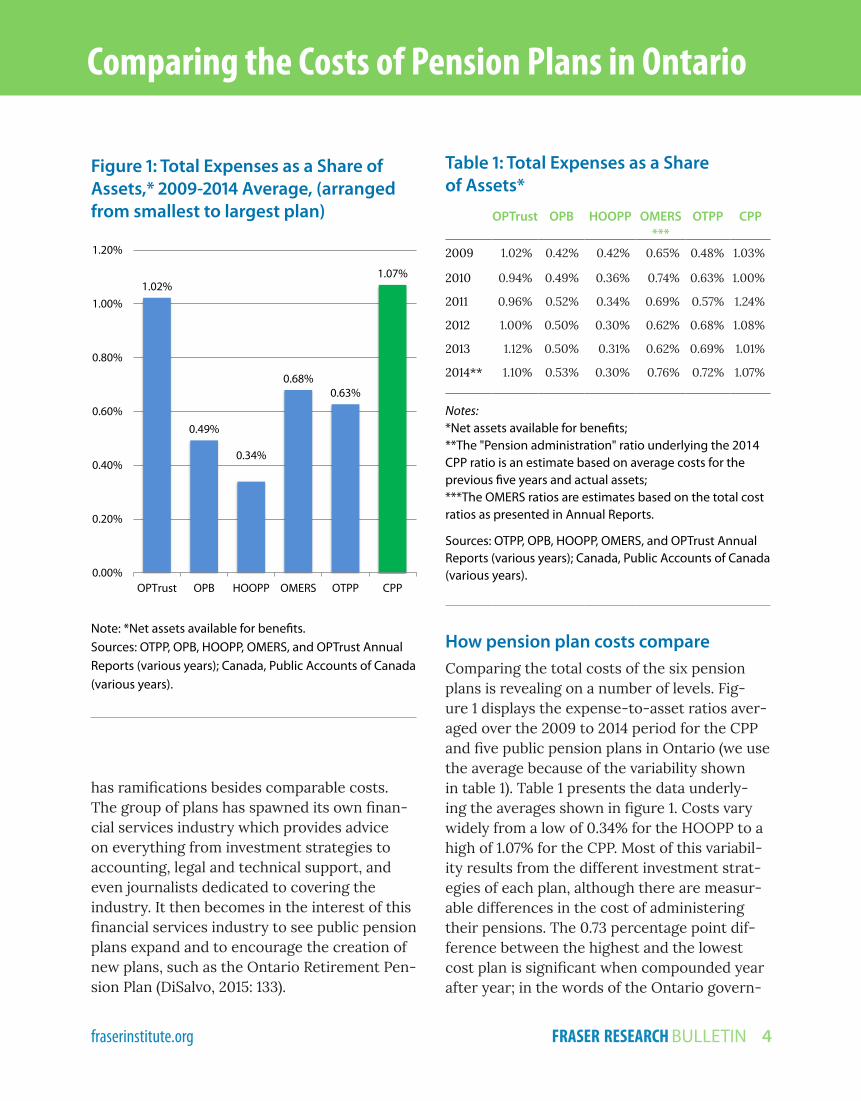
How pension plan costs compare Comparing the total costs of the six pension plans is revealing on a number of levels. Fig-ure 1 displays the expense-to-asset ratios aver-aged over the 2009 to 2014 period for the CPP and five public pension plans in Ontario (we use the average because of the variability shown in table 1). Table 1 presents the data underly-ing the averages shown in figure 1. Costs vary widely from a low of 0.34% for the HOOPP to a high of 1.07% for the CPP. Most of this variabil-ity results from the different investment strat-egies of each plan, although there are measur-able differences in the cost of administering their pensions. The 0.73 percentage point dif-ference between the highest and the lowest cost plan is significant when compounded year after year; in the words of the Ontario govern-
Figure 1: Total Expenses as a Share of Assets,* 2009-2014 Average, (arranged from smallest to largest plan)
Note: *Net assets available for benefits. Sources: OTPP, OPB, HOOPP, OMERS, and OPTrust Annual Reports (various years); Canada, Public Accounts of Canada (various years).
Table 1: Total Expenses as a Share of Assets*
OPTrust OPB HOOPP OMERS ***
OTPP CPP
2009 1.02% 0.42% 0.42% 0.65% 0.48% 1.03%
2010 0.94% 0.49% 0.36% 0.74% 0.63% 1.00%
2011 0.96% 0.52% 0.34% 0.69% 0.57% 1.24%
2012 1.00% 0.50% 0.30% 0.62% 0.68% 1.08%
2013 1.12% 0.50% 0.31% 0.62% 0.69% 1.01%
2014** 1.10% 0.53% 0.30% 0.76% 0.72% 1.07%
Notes: *Net assets available for benefits; **The "Pension administration" ratio underlying the 2014 CPP ratio is an estimate based on average costs for the previous five years and actual assets; ***The OMERS ratios are estimates based on the total cost ratios as presented in Annual Reports.
Sources: OTPP, OPB, HOOPP, OMERS, and OPTrust Annual Reports (various years); Canada, Public Accounts of Canada (various years).
1.02%
0.49%
0.34%
0.68%0.63%
1.07%
0.00%
0.20%
0.40%
0.60%
0.80%
1.00%
1.20%
OPTrust OPB HOOPP OMERS OTPP CPP
Comparing the Costs of Pension Plans in Ontario
fraserinstitute.org FRASER RESEARCH BULLETIN 5
ment when introducing its Retirement Pension Plan, a “small increase in fees can have an impact on an individual’s retirement savings” (Ontario Ministry of Finance, 2014: chapter IV, 4).
Our 2014 paper on the true cost of the CPP noted that the CPPIB only reported expenses related to its investments. Since the costs of adminis-tering pensions are borne by the plan mem-bers and charged by the government of Can-ada, the CPPIB does not report on these costs. It is noteworthy that the costs reported by the five Ontario-based pension plans in this study include expenses related to both the adminis-tration of pensions and their investment strat-egy. The CPPIB’s reputation for “extremely low fees” may partly result from this “apples to oranges” comparison of its costs, which exclude administrative expenses, with other plans that include these costs. Only by adding in all the expenses related to the CPP can one accurately judge how efficient its overall operations are compared with other public plans.
Total public pension plan costs are risingIn absolute terms, the cost of all six pension plans are rising because their membership is expanding. The industry convention is to com-pare costs to assets. By this metric, costs for five of the six pension plans have increased slowly in recent years. The slight increase for the CPP was in line with the experience of most plans. The outliers were the Ontario Teachers’ Plan, which has seen expenses rise from 0.48% of assets in 2009 to 0.72% in 2014, and the HOOPP, the only plan where expenses fell after 2009. Almost all of the increases reflected ris-ing expenses related to investing their pension funds, as five of the six were able to lower their
administrative expense-to-assets ratio. Even small increases in the ratio of expenses to assets are notable, given the sizable inflation of most asset prices in the global recovery after 2009.
Each pension plan separates its costs between those contracted out to external sources (mostly investment advice and transaction fees) and those incurred internally. Internal costs can then be broken down between those related to the administration of pensions and those asso-ciated with planning or executing its invest-ment strategy. Administrative costs for pen-sions include collecting pension contributions from members, evaluating claims, and issuing cheques. Not every organization may define or allocate costs between pension administration and investing in exactly the same way, which is one reason to start with total costs. The strictest separation between these two func-tions is for the Canada Pension Plan, where all the administrative costs are incurred by the government of Canada, which deducts these from the assets it transfers to the CPPIB. The expenses of the CPPIB for managing the pen-sion assets of the CPP are presented separately in its annual report.
Most of the recent increase in the cost of pen-sion plans was due to rising external expenses. The exception is the HOOPP, which has no external investment costs. This reflects HOOPP’s philosophy, as articulated by its then-presi-dent, that “there’s a certain size threshold that should be considered by pension funds thinking of insourcing their administration and technol-ogy. Once they have reached $20 billion in assets under management, they are big enough to start bringing in the best people and the right tech-nology to manage assets” (HOOPP, 2011).

Comparing the Costs of Pension Plans in Ontario
fraserinstitute.org FRASER RESEARCH BULLETIN 6
No economies of scale for public pension plansOverall, there is no systematic relationship between the size of pension plan assets and their cost (measured as a percentage of assets). The CPP, the largest plan with $269 billion of assets, had the highest expense ratio at 1.07% of its assets on average for the whole period between 2009 and 2014 (see figure 1). How-ever, the next highest average expense ratio belonged to OPTrust, the smallest fund in this study at $17 billion. The other small fund, the OPB, had below average expenses of 0.49% (using the simple average of 0.71% for the six plans). As a result of its low-cost invest-ment strategy, the lowest expenses are for the HOOPP, which ranks in the middle in size, with $61 billion of assets. The other mid-sized plan, the OMERS, had costs of 0.68%, close to the average of 0.71%.
It is not surprising that there are no econo-mies of scale for public pension plans. This is
one reason why pensions for Ontario public servants are split across five different plans, each with its own bureaucracy and investment strategy. HOOPP’s then-CIO Jim Keohane (now its president and CEO) stated that once a fund grows beyond $75 billion, its costs can start to increase, implying there are diseconomies of scale (Erman, 2011, Dec. 10).
Table 2 presents the detailed breakdown of costs between pension administration and investments for each pension plan (the data are averages for the period 2009 to 2014). Admin-istrative costs are measured as a percentage of assets, although a good case can be made that these costs should be compared with the num-ber of members since that is the primary deter-minant of costs. However, there are good rea-sons to compare the cost of implementing their investment strategy to their assets; indeed, a Boston Consulting Group study commissioned by the five large Ontario pension plans uses this measure (Boston Consulting Group, n.d.).
Table 2: Expenses by Pension Plan, Percent of Assets*, 2009-2014 Average
Pension administration
(1)
Internal investment
(2)
External investment
(3)
Total investment (4) = (2 + 3)
Total cost
(5) = (1 + 4)
CPP** 0.32% 0.25% 0.51% 0.75% 1.07%
OTPP 0.04% 0.25% 0.34% 0.59% 0.63%
OMERS*** 0.10% 0.48% 0.10% 0.58% 0.68%
HOOPP 0.11% 0.23% 0.00% 0.23% 0.34%
OPB 0.13% 0.07% 0.30% 0.37% 0.49%
OPTrust 0.14% 0.42% 0.47% 0.89% 1.02%
Notes: *Net assets available for benefits; **The "Pension administration" ratio for 2014 is an estimate based on average costs for the previous five years and actual assets; ***OMERS "External investment" and “Total investment” ratios are esti-mates based on the total cost ratios presented in Annual Reports.
Sources: OTPP, OPB, HOOPP, OMERS, and OPTrust Annual Reports (various years); Canada, Public Accounts of Canada (vari-ous years).

Comparing the Costs of Pension Plans in Ontario
fraserinstitute.org FRASER RESEARCH BULLETIN 7
Administrative costs are hard to compare across plansEven for the simple administration of pensions, there appear to be no economies of scale. Four of the six plans have similar expense ratios of between 0.10% and 0.14% despite a wide range in their size (table 2). Beyond that, costs are lowest for the Ontario Teachers’ Plan (at 0.04%) and highest for the CPP (at 0.32%), the two big-gest plans. The pension administration cost of the CPP is more than twice as high as the next most expensive plan (0.32% versus 0.14%) and nine times higher than the most efficient plan.
Since all the expenses the government of Can-ada makes to administer the CPP are deducted from the assets transferred to the CPPIB for investment in the pension plan and ultimately paid out to pensioners, it is reasonable to ask why the CPP’s expenses are so much higher than all the others. Mitigating factors may include that CPP benefits are paid to disabled people as well as pensioners, which would increase demand for its services compared with the other pure pension plans (11.5% of the CPP’s payouts were for disability claims, although the HOOPP also covers disability claims and it has below-average administration costs) (Can-ada, 2014). As well, operating across the coun-try and keeping track of individual earnings from a wide range of employers over time may increase the complexity of CPP operations. Whatever the reason for its high costs relative to assets, there is no compelling evidence of economies of scale in the pure pension admin-istration side of the CPP compared with other pension plans in Ontario. However, this com-parison may not be ideal, given the tenuous expected link between administrative expenses and asset prices (the denominator); a crash in financial market prices, for example, could send the ratio of administrative costs to assets soar-
ing without telling us anything about the effi-ciency of operations.
It makes more sense to compare the cost of administering a pension plan to the number of members it serves. Even then, the mix between workers currently contributing and pension-ers receiving benefits will affect administra-tive costs. The CPP’s ranking as the most costly plan changes markedly if costs are compared with the number of plan members. In terms of administrative expenses per member, the CPP has the lowest cost at $30 a member (table 3). Economies of scale now appear to be a fac-tor for administration, as the large Ontario Teachers’ plan has the next lowest cost ($146 per member), while the smallest plans had the highest costs at nearly $300 per member. How-ever, there are reasons to believe the adminis-
Table 3: Administrative Expenses per Member (Contributors & Pensioners)
OTPP OPB HOOPP OMERS OPTrust CPP
2009 $131 $325 $167 $132 $250 $28
2010 $146 $297 $174 $145 $261 $29
2011 $147 $292 $192 $155 $259 $40
2012 $145 $294 $197 $143 $274 $30
2013 $147 $314 $225 $143 $310 $26
2014 $158 $303 $256 $198 $263 $26
Avg. $146 $304 $202 $152 $270 $30
Notes: CPP pensioners based on total number of benefits paid. 2013 and 2014 CPP contributors were estimated using employment growth from the Labour Force Survey. HOOPP deferred members estimated at 25,000 for 2009 through 2012.
Sources: Various plan Annual Reports; online CPP statistics (see Service Canada, 2015a).

Comparing the Costs of Pension Plans in Ontario
fraserinstitute.org FRASER RESEARCH BULLETIN 8
trative costs of the CPP and these large public pension plans in Ontario are not comparable. For example, the Ontario plans all have to deal with members transferring in and out from other plans, plan amendments arising from col-lective bargaining, and spend more time com-municating with members than the CPP does.
Investment costs are more important and easier to compareInvestment costs are more easily compared across pension plans, partly because there is no question that these costs should be mea-sured relative to assets. Every pension plan has a unique investment strategy and therefore a different mix of internal and external expenses for its investments. At one extreme, the HOOPP keeps all investment activities in-house and the OMERS manages 91.3% of its assets internally.5 At the other, the OPB relies heavily on exter-nal sources to plan and execute its investments. The Ontario Teachers Plan and the OPTrust spend about 40% of their investment expenses internally, with the other 60% for services out-side of their fund. The CPP sources around 65% of its investment expenses externally.
There is no obvious relationship between out-sourcing investments and the total cost of implementing an investment strategy. The HOOPP keeps all its investment activities in-house and easily has the lowest costs. However, the OMERS, with most of its investment costs accruing internally, has average costs. Overall, the three largest plans (the CPP, the OTPP and the OMERS) all spent more on investing than the 0.57% average for plans in this study. This justifies the conclusion that there is little evi-dence of economies of scale, either for the cost
5 OMERS long-term goal is to manage 95% of its as-sets. See OMERS (2014: 25).
of investing for public pension plans in Ontario, or for their total costs, which are dominated by investment expenses.
Investment strategies: Do high rates of return signal high risk?Of course, the more expensive pension plans could justify higher costs if they generated higher investment returns. All the pension plans in this study boast of their high rates of return in recent years. This reflects aggres-sive investment strategies at a time when many firms are allegedly hoarding cash.6
All the pension funds in this study claim to have surpassed their benchmark returns in recent years, except OMERS. This suggests that public pension funds live in a “Lake Wobegone” world where everyone is above average. Such claims should be regarded skeptically. Many of the investments made by pension plans in infra-structure, real estate, and private equity are long-term, illiquid investments that often are without a recent reference price. This allows management some discretion in their valuation, and it is in management’s interest to maximize these valuations while minimizing the returns on assets in the benchmark group.
Moreover, the OECD and the Bank of Inter-national Settlements, the central bank for the world’s central banks, both recently expressed skepticism about the sustainability of high returns on investment given the risk under-taken in their pursuit. The OECD in its latest
6 The chief executive officer of the CPPIB explicitly attacked firms for holding large amounts of cash on their balance sheets, arguing that “the general trend toward sitting on cash rather than investing it productively is emblematic of a short-term mindset.” See Wiseman (2015, May 30).

Comparing the Costs of Pension Plans in Ontario
fraserinstitute.org FRASER RESEARCH BULLETIN 9
business and financial outlook raised a funda-mental question about the high returns pension funds and other investors have reaped. It noted that low interest rates have “encouraged large players in financial markets to pursue a ‘search for yield’ and to pay prices for assets in bond and equity markets that may not realistically reflect inherent risks” (Gurria, 2015: 24). This has led to what it calls “a risk puzzle: why do so many people managing listed companies that carry out a large portion of the world’s capital formation see so much risk on the horizon while so many players in financial markets apparently see so little risk? Someone will inevitably be proved wrong” (Gurria, 2015: 20). In the OECD’s view, hoarding cash is a prudent response to the risks in the global economy today. The vulner-ability of the world economy to a shock com-ing from the financial sector due to imbalances from years of easy monetary policies echoes similar views expressed recently by the Bank of International Settlements (2015, June 28).
The CPPIB investment strategy is an unproven experiment
Of course, the rising expense of the CPP’s investment strategy after 2007 could be jus-tified if the rate of return remains high. The problem is that we will not know for years, or even decades, if the rate of return stays ele-vated. This is especially true of the CPP’s pur-chase of illiquid assets such as infrastructure, land, and private equity. This strategy pre-sumes first that these assets are mispriced because they are relatively unknown and infre-quently traded, and second that the mispricing of assets is on the low and not the high side. In other words, there is a presumption of market failure in price discovery, which large pension funds can identify and profit from better than other investors such as hedge funds.
This view may be borne out by a higher return to CPP investments over the decades. Or it may be disproven if returns falter. It is important to remind people that this is an experiment in progress, not the execution of a proven strat-egy. It is worth remembering that The Econo-mist observed recently that hedge funds once “sold themselves as clever and flexible enough to take advantage of opportunities that conven-tional fund managers neglected,” but this claim has been disproven over time (The Economist, 2015, August 1: 62).
It is also worth noting that high returns earned by the CPPIB’s assets will not benefit its mem-bers; the CPP remains largely a pay-as-you-go pension plan, with only 17% funded by CPPIB investments. Since members will not benefit from higher returns, why does management undertake investment strategies that involve more risk? Meanwhile, younger Canadians are already overpaying in terms of the ratio of their contributions to benefits, to compensate for the underfunding before the CPP was over-hauled in 1997 (Canada, OSFI, 2013; Godbout, Trudel, and St-Cerny, 2014).
At a minimum, the CPPIB has not done a good job explaining publicly why its strategy justifies the additional expense and risk in its invest-ments. Nor has it been shown that an active investment strategy has not distracted man-agement from maximizing the efficiency of both the administrative and investment arms of the CPP, something it promised to do when it adopted this new strategy in 2006. This ref-erence to improving efficiency seems to have been its last utterance on the subject, making it appear to be an empty slogan when maxi-mum efficiency should be the foundation for the operations of the entire CPP, or indeed of any organization entrusted with the public’s money or supported by taxes (it is telling that

Comparing the Costs of Pension Plans in Ontario
fraserinstitute.org FRASER RESEARCH BULLETIN 10
the lower cost OPB refers to efficiency in its Annual Report, but the CPPIB does not). Devel-oping intricate investment strategies and open-ing branches around the world may create a more interesting work environment for man-agers, but this does not guarantee the rate of return that results from higher efficiency and lower costs.
ConclusionThe implications of this analysis of the costs of pension plans are sobering for proponents of more and larger public pension plans. Despite its reputation, the cost of the CPP is actually above the average for comparable plans based in Ontario, for both total costs and expenses related to making investments. There is little evidence to support the claim that there are economies of scale to operating large pension plans for either total costs or those related only to making investments. Indeed, there may even be diseconomies of scale for larger public pen-sion plans because of the complexity of imple-menting their investment strategies.
Although beyond the focus of this paper, the material presented above suggests several implications for the creation of the Ontario Retirement Pension Plan. The costs of its set-up and administration are going to be signifi-cant, with even the government admitting the cost could be much higher than the CPP’s. As the plan grows, it will be difficult to keep costs from rising, especially when it begins distribut-ing benefits. The only way to recoup these high costs will be through large returns on invest-ment. This will be challenging in the current investment climate of high valuations in stock and bond markets, and low interest rates, even if the Ontario Plan is not directed by the gov-ernment to invest in infrastructure assets in Ontario.
References
Bank of International Settlements (2015). 85th Annual Report (June 28). Bank of International Settlements. <http://www.bis.org/publ/arpdf/ar2015_ec.pdf>, as of January 4, 2015.
Boston Consulting Group [BCG] (n.d.). Canada’s Top Ten Pension Funds: Helping Drive National Prosperity. <https://hoopp.com/uploadedFiles/Content/Newsroom/newsdocs/Top_10_Funds_Investing_for_Canada.pdf>, as of October 4, 2015.
Canada (2014). Annual Report of the Canada Pension Plan 2013–2014. Government of Canada. <http://www.esdc.gc.ca/en/reports/pension/cpp_reports/2014/cpp_report.page>, as of November 24, 2015.
Canada, Office of the Superintendent of Financial Institutions [OSFI] (2013). Actuarial Report (26th) on the Canada Pension Plan. Government of Canada.
Canada Pension Plan Investment Board [CPPIB] (2013). Annual Report 2013. Canada Pension Plan Investment Board.
Canada Pension Plan Investment Board [CPPIB] (2015). Who We Are: CPPIB at a Glance. Web page. CPPIB. <http://www.cppib.com/en/who-we-are/at-a-glance.html>, as of November 24, 2015.
Canada, Receiver General for Canada (2011-2014 editions). Public Accounts of Canada, Vol. 1—Summary Report and Consolidated Financial Statements. Government of Canada.
Canadian Labour Congress [CLC] (2015, April 25). Are You Looking Forward to Retirement, or Worrying about Ever Being Able To? Web page. CLC. <http://canadianlabour.ca/issues-research/are-you-looking-forward-retirement-or-worrying-about-ever-being-able>, as of November 24, 2015.

Comparing the Costs of Pension Plans in Ontario
fraserinstitute.org FRASER RESEARCH BULLETIN 11
Cross, Philip, and Joel Emes (2014). Accounting for the True Cost of the Canada Pension Plan. Fraser Institute Research Bulletin (September). <https://www.fraserinstitute.org/sites/default/files/accounting-for-the-true-cost-of-the-canada-pension-plan.pdf>, as of November 24, 2015.
DiSalvo, Daniel (2015). Government against Itself. Oxford University Press.
The Economist (2015, August 1). Investment Funds: Roaring Ahead. The Economist.
Erman, Boyd (2011, Dec. 10). Bigger Not Better for Ontario Pension Plans, HOOPP Argues. Globe and Mail. <http://www.theglobeandmail.com/report-on-business/streetwise/bigger-not-better-for-ontario-pension-plans-hoopp-argues/article620732/>, as of November 24, 2015.
Godbout, Luc, Yves Trudel, and Suzie St-Cerny (2014). Differential Returns by Year of Retirement under the Canada Pension Plan. Canadian Public Policy 40, 4 (Dec.): 364-376.
Gurria, Angel (2015). Editorial. Business and Finance Outlook 2015. Office of the OECD Secretary General.
Healthcare of Ontario Pension Plan [HOOPP] (various years). Annual Report (2010-2014 editions). HOOPP.
Healthcare of Ontario Pension Plan [HOOPP] (2011). HOOPP’s Formula for Success = Fully Funded. Speaking Notes for John Crocker, President & CEO for the NASDAQ Closing Bell Ceremony. HOOPP.
McFarland, Janet (2012, June 11). Ontario Orders Audit of OPTrust. Globe and Mail. <http://www.theglobeandmail.com/report-on-business/ontario-orders-audit-of-optrust/article4249268/>, as of November 24, 2015.
National Union of Public and General Employees [NUPGE] (2012). Top 10 Reasons to
Expand the CPP (January). NUPGE. <http://nupge.ca/sites/nupge.ca/files/publications/ATN__Pensions_6_Expand_CPP_for_web.pdf>, as of November 24, 2015.
Ontario Municipal Employees Retirement System [OMERS] (various years). Annual Report (2009-2014 editions). OMERS.
Ontario Ministry of Finance (2014). Chapter IV: Strengthening Retirement Security in Ontario. 2014 Ontario Budget. Government of Ontario. <http://www.fin.gov.on.ca/en/budget/ontariobudgets/2014/ch4.html>, as of November 24, 2015.
Ontario Pension Board [OPB] (various years). Annual Report (2009-2014 editions). OPB.
Ontario Public Service Employees Union Pension Trust [OPTrust] (various years). Annual Report (2010-2014 editions). OPTrust.
Ontario Teachers’s Pension Plan [OTPP] (various years). Annual Report (2010-2014 editions). OTPP.
Service Canada (2015a). 2014 – CPP and OAS Statistics Tables. Government of Canada. <http://www.servicecanada.gc.ca/eng/services/pensions/statistics/statbook/cppoasstatistics.shtml>, as of Nov. 24, 2015.
Service Canada (2015b). Canada Pension Plan and Old Age Security – Monthly Statistical Bulletins – March 2015. Government of Canada. <http://www.servicecanada.gc.ca/eng/services/pensions/statistics/bulletins/03-15.shtml>, as of Nov. 24, 2015.
Wiseman, Mark (2015, May 30). Pension Funds Need to Focus on the Long View, Not a Single Record Year. Globe and Mail. <http://www.theglobeandmail.com/report-on-business/rob-commentary/investors-need-to-focus-on-the-long-view-not-a-single-record-year/article24700609/>, as of November 24, 2015.

Comparing the Costs of Pension Plans in Ontario
fraserinstitute.org FRASER RESEARCH BULLETIN 12
Joel Emes is a former senior advi-sor to British Columbia’s provincial government. He previously served a senior research economist at the Fraser Institute, where he initiated and led several flagship projects in the areas of tax freedom and gov-ernment performance, spending, debt, and unfunded liabilities. Joel holds a B.A. and an M.A. in econom-ics from Simon Fraser University.
Copyright © 2016 by the Fraser Institute. All rights re-served. Without written permission, only brief passag-es may be quoted in critical articles and reviews.
ISSN 2291-8620
Media queries: call 604.714.4582 or e-mail:
Support the Institute: call 1.800.665.3558, ext. 586, or
e-mail: [email protected]
Visit our website: www.fraserinstitute.org
Philip Cross worked for 36 years at Statistics Canada, the last few as its Chief Economic Analyst. He wrote Statistics Canada’s monthly assess-ment of the economy for years, as well as many feature articles for the Canadian Economic Observer. After leaving Statistics Canada, he has worked as a contract researcher for a variety of organizations. He has been widely quoted over the years, and now writes a bi-weekly column for the National Post and other papers.
AcknowledgmentsThe authors would like to thank Charles Lammam, Director of Fiscal Studies at the Fraser Institute, for his support in prepar-ing this study. They also acknowledge the anonymous reviewers for their comments, suggestions, and insights. Any remaining errors or oversights are the sole respon-sibility of the authors. As the researchers have worked independently, the views and conclusions expressed in this paper do not necessarily reflect those of the Board of Directors of the Fraser Institute, the staff, or supporters.