Comparing Sizes of MOs
8
by Nancy P . Moreno, Ph.D. Barbara Z. Tharp, M.S. Deanne B. Erdmann, M.S. Sonia Rahmati Clayton, Ph.D. James P. Denk, M.A. © 2008 by Baylor College of Medicine Houston, Texas RESOURCES Free, online presentations of each activity, downloadable activities in PDF format, and annotated slide sets for classroom use are available at www.BioEdOnline.org or www.k8science.org. Comparing Sizes of Microorganisms
-
Upload
federico-leon -
Category
Documents
-
view
216 -
download
0
Transcript of Comparing Sizes of MOs

8/13/2019 Comparing Sizes of MOs
http://slidepdf.com/reader/full/comparing-sizes-of-mos 1/8
by
Nancy P. Moreno, Ph.D.
Barbara Z. Tharp, M.S.
Deanne B. Erdmann, M.S.
Sonia Rahmati Clayton, Ph.D.
James P. Denk, M.A.
© 2008 by Baylor College of MedicineHouston, Texas
RESOURCESFree, online presentations of
each activity, downloadable
activities in PDF format, and
annotated slide sets for
classroom use are available
at www.BioEdOnline.org or
www.k8science.org.
Comparing Sizes of Microorganisms
8/13/2019 Comparing Sizes of MOs
http://slidepdf.com/reader/full/comparing-sizes-of-mos 2/8
© 2008 by Baylor College of Medicine
All rights reserved.
Printed in the United States of America
ISBN-13: 978-1-888997-54-5
ISBN-10: 1-888997-54-0
TEACHER RESOURCES FROM THE CENTER FOR EDUCATIONAL OUTREACH
AT BAYLOR COLLEGE OF MEDICINE
The mark “BioEd” is a service mark of Baylor College of Medicine. The information contained in this publication is for educational
purposes only and should in no way be taken to be the provision or practice of medical, nursing or professional healthcare advice
or services. The information should not be considered complete and should not be used in place of a visit, call, consultation or
advice of a physician or other health care provider. Call or see a physician or other health care provider promptly for any health
care-related questions.
Development of The Science of Microbes educational materials is supported, in part, by a Science Education Partnership Award
from the National Center for Research Resources (NCRR) of the National Institutes of Health (NIH), grant number 5R25 RR018605.
The activities described in this book are intended for school-age children under direct supervision of adults. The authors, Baylor
College of Medicine (BCM), the NCRR and NIH cannot be responsible for any accidents or injuries that may result from conduct of
the activities, from not specifically following directions, or from ignoring cautions contained in the text. The opinions, findings and
conclusions expressed in this publication are solely those of the authors and do not necessarily reflect the views of BCM, image
contributors or the sponsoring agencies.
Cover images of children and teacher (models) © 2007 PunchStock. Photographs used throughout this guide, whether copyrighted
or in the public domain, require contacting original sources to obtain permission to use images outside of this publication. The
authors, contributors, and editorial staff have made every effort to contact copyright holders to obtain permission to reproduce
copyrighted images. However, if any permissions have been inadvertently overlooked, BCM will be pleased to make all necessary
and reasonable arrangements.
Many microscopic images used in this guide, particularly images obtained from the Public Health Image Library of the Centers for
Disease Control and Prevention (CDC), are part of an online library containing other images and subject matter that may be unsuit-
able for children. Caution should be used when directing students to research health topics and images on the Internet. URLs from
image source websites are provided in the Source URL list, to the right.
Authors: Nancy P. Moreno, Ph.D., Barbara Z. Tharp, M.S., Deanne B. Erdmann, M.S.,
Sonia Rahmati Clayton, Ph.D., and James P. Denk, M.A.
Creative Director and Editor: Martha S. Young, B.F.A.
Senior Editor: James P. Denk, M.A.
ACKNOWLEDGMENTS
This guide was developed in partnership with the Baylor-UT Houston Center for AIDS Research, an NIH-funded program (AI036211).
The authors gratefully acknowledge the support and guidance of Janet Butel, Ph.D., and Betty Slagle, Ph.D., Baylor-UT Houston
Center for AIDS Research; and William A. Thomson, P h.D., BCM Center for Educational Outreach. The authors also sincerely
thank Marsha Matyas, Ph.D., and the American Physiological Society for their collaboration in the development and review of thisguide; and L. Tony Beck, Ph.D., of NCRR, NIH, for his assistance and support. In addition, we express our appreciation to Amanda
Hodgson, B.S., Victor Keasler, Ph.D., and Tadzia GrandPré, Ph.D., who provided content or editorial reviews; and J. Kyle Roberts,
Ph.D., and Alana D. Newell, B.A., who guided field test activities and conducted data analyses. We also are grateful to the
Houston-area teachers and students who piloted the activities in this guide.
We are endebted to many scientists and microscopists who contributed SEM and TEM images to the CDC’s Public Health Image
Library, including Janice H. Carr, James D. Gathany, Cynthia S. Goldsmith, M.S., and Elizabeth H. White, M.S. We especially
thank Louisa Howard and Charles P. Daghlian, Ph.D., Electron Microscope Facility, Dartmouth College, for providing several of the
SEM and TEM images used in this publication. We thank Martha N. Simon, Ph.D., Joseph S. Wall, Ph.D., and James F. Hainfeld,
Ph.D., Department of Biology-STEM Facility, Brookhaven National Laboratory; Libero Ajello, Ph.D., Frank Collins, Ph.D., Richard
Facklam, Ph.D., Paul M. Feorino, Ph.D., Barry S. Fields, Ph.D., Patricia I. Fields, Ph.D., Collette C. Fitzgerald, Ph.D., Peggy S. Hayes.
B.S., William R. McManus, M.S., Mae Melvin, Ph.D., Frederick A. Murphy, D.V.M., Ph.D., E.L. Palmer, Ph.D., Laura J. Rose, M.S.,
Robert L. Simmons, Joseph Strycharz, Ph.D., Sylvia Whitfield, M.P.H., and Kyong Sup Yoon, Ph.D., CDC; Dee Breger, B.S., Materials
Science and Engineering, Drexel University; John Walsh, Micrographia, Australia; Ron Neumeyer, MicroImaging Services, Canada;
Clifton E. Barry, III, Ph.D., and Elizabeth R. Fischer, National Institute of Allergy and Infectious Diseases, NIH; Mario E. Cerritelli,
Ph.D., and Alasdair C. Steven, Ph.D., National Institute of Arthritis and Musculoskeletal and Skin Diseases, NIH; Larry Stauffer,
Oregon State Public Health Laboratory-CDC; David R. Caprette, Ph.D., Department of Biochemistry and Cell Biology, Rice University;
Alan E. Wheals, Ph.D., Department of Biology and Biochemistry, University of Bath, United Kingdom; Robert H. Mohlenbrock, Ph.D.,
USDA Natural Resources Conservation Service; and Chuanlun Zhang, Ph.D., Savannah River Ecology Laboratory, University of
Georgia, for the use of their images and /or technical assistance.
No part of this book may be reproduced by any mechanical, photographic or electronic process, or in the form of an audio recording;
nor may it be stored in a retrieval system, transmitted, or otherwise copied for public or private use without prior written permis-
sion of the publisher. Black-line masters reproduced for classroom use are excepted.
Center for Educational Outreach, Baylor College of Medicine
One Baylor Plaza, BCM411, Houston, Texas 77030 | 713-798-8200 | 800 -798-8244 | edoutreach @bcm.edu
www.BioEdOnline.org | www.k8science.org | www.bcm.edu /edoutreach
SOURCE URLsBAYLOR COLLEGE OF MEDICINE
BIOED ONLINE | K8 SCIENCE
www.bioedonline.org | www.k8science.org
BAYLOR-UT CENTER FOR AIDS RESEARCH
www.bcm.edu/cfar
MOLECULAR VIROLOGY AND MICROBIOLOGY
www.bcm.edu/molvir
BAYLOR-UT CENTER FOR AIDS RESEARCH
www.bcm.edu/cfar
BROOKHAVEN NATIONAL LABORATORY
BIOLOGY - STEM FACILITY
www.biology.bnl.gov
CENTERS FOR DISEASE CONTROL AND PREVENTION
PUBLIC HEALTH IMAGE LIBRARY
www.cdc.gov | http://phil.cdc.gov
DARTMOUTH COLLEGE
ELECTRON MICROSCOPE FACILITY
www.dartmouth.edu/~emlab
DREXEL UNIVERSITY
MATERIALS SCIENCE AND ENGINEERINGwww.materials.drexel.edu
MICROBIAL LIFE EDUCATIONAL RESOURCES
SCIENCE EDUCATION RESEARCH CENTER AT
CARLETON COLLAGE
http://serc.carleton.edu/microbelife
MICROIMAGING SERVICES (Canada)
www.microimaging.ca
MICROGRAPHIA (Australia)
www.micrographia.com
NATIONAL CENTER FOR RESEARCH RESOURCES, NIH
www.ncrr.nih.gov
SCIENCE EDUCATION PARTNERSHIP AWARD (SEPA)
www.ncrrsepa.org
NATIONAL INSTITUTE OF ALLERGY AND INFECTIOUS
DISEASES, NIH
www.niaid.nih.gov
NATIONAL INSTITUTE OF ARTHRITIS AND
MUSCULOSKELETAL AND SKIN DISEASES, NIH
www.niams.nih.gov
NATIONAL INSTITUTES OF HEALTH (NIH)
www.nih.gov
OREGON HEALTH AUTHORITY PUBLIC HEALTH-CDC
http://public.health.oregon.gov/laboratoryservices
RICE UNIVERSITY
BIOCHEMISTRY AND CELL BIOLOGY
www.biochem.rice.edu
UNIVERSITY OF BATH (United Kingdom)
BIOLOGY AND BIOCHEMISTRY
www.bath.ac.uk/bio-sci
USDA NATURAL RESOURCES CONSERVATION
SERVICE
www.plants.usda.gov
8/13/2019 Comparing Sizes of MOs
http://slidepdf.com/reader/full/comparing-sizes-of-mos 3/8
iiiIntroduction/Using Cooperative Groups in the ClassroomThe Science of Microbes
I nfectious diseases have plagued
humans throughout history.
Sometimes, they even have shapedhistory. Ancient plagues, the Black
Death of the Middle Ages, and the
“Spanish flu” pandemic of 1918 are
but a few examples.
Epidemics and pandemics always
have had major social and economic
impacts on affected populations, but in
our current interconnected world, the
outcomes can be truly global. Consider
the SARS outbreak of early 2003.
This epidemic demonstrated that new
infectious diseases are just a planetrip away, as the disease was spread
rapidly to Canada, the U.S. and Europe
by air travelers. Even though the SARS
outbreak was relatively short-lived
and geographically contained, fear
inspired by the epidemic led to travel
restrictions and the closing of schools,
stores, factories and airports. The
economic loss to Asian countries was
estimated at $18 billion.
The HIV/AIDS viral epidemic, particu-
larly in Africa, illustrates the economic
and social effects of a prolonged and
widespread infection. The dispropor-
tionate loss of the most economically
productive individuals within the popu-
lation has reduced workforces and eco-
nomic growth in many countries, espe-
cially those with high infection rates.
This affects the health care, education,
and political stability of these nations.
In the southern regions of Africa,
where the infection rate is highest, life
expectancy has plummeted in a single
decade, from 62 years in 1990–95 to
48 years in 2000–05. By 2003, 12 mil-lion children under the age of 18 were
orphaned by HIV/AIDS in this region.
Despite significant advances in infec-
tious disease research and treatment,
control and eradication of diseases are
slowed by the following challenges.
• The emergence of new infectious
diseases
• An increase in the incidence or
geographical distribution of old
infectious diseases
• The re-emergence of old infectiousdiseases
• The potential for intentional
introduction of infectious agents
by bioterrorists
• The increasing resistance of patho-
gens to current antimicrobial drugs
• Breakdowns in public health
systems
Baylor College of Medicine, Department of Molecular
Virology and Microbiology, www.bcm.edu/molvir/.
Cooperative learning is
a systematic way for
students to work together
in groups of two to four. It
provides organized group
interaction and enables
students to share ideas
and to learn from one
another. Students in such
an environment are more
likely to take responsibil-
ity for their own learning.
Cooperative groups enable
the teacher to conduct
hands-on investigations with
fewer materials.
Organization is essential
for cooperative learning to
occur in a hands-on science
classroom. Materials must
be managed, investigations
conducted, results recorded,
and clean-up directed and
carried out. Each student
must have a specific role, or
chaos may result.
The Teaming Up!
model* provides an efficient
system for cooperative
learning. Four “jobs” entail
specific duties. Students
wear job badges that
describe their duties. Tasks
are rotated within each
group for different activi-
ties so that each student
has a chance to experience
all roles. For groups with
fewer than four students,
job assignments can be
combined.
Once a model for learning
is established in the class-
room, students are able to
conduct science activities
in an organized and effec-
tive manner. Suggested job
titles and duties follow.
H I V v i r u s p a r t i c l e .L .H o w a r d , C .D a g h l i a n ,D a
r t m o u t h C o l l e g e .
* Jones, R.M. 1990. Teaming Up! LaPorte, Texas: ITGROUP.
USING COOPERATIVE GROUPS IN THE CLASSROOM
Principal Investigator
• Reads the directions
• Asks the questions
• Checks the work
Maintenance Director
• Follows the safety rules
• Directs the cleanup
•Asks others to help
Reporter
• Records observations and results
• Explains the results
• Tells the teacher when
the group is finished
Materials Manager
• Picks up the materials
• Uses the equipment
• Returns the materials
For an emerging disease to
become established, at least two
events must occur: 1) the infec-
tious agent has to be introduced
into a vulnerable population,
and 2) the agent has to have the
ability to spread readily from
person to person and cause
disease. The infection also must
be able to sustain itself within
the population and continue to
infect more people.
© 2008 Baylor College of MedicineBioEd Online | K8 Scienc
8/13/2019 Comparing Sizes of MOs
http://slidepdf.com/reader/full/comparing-sizes-of-mos 4/8

8/13/2019 Comparing Sizes of MOs
http://slidepdf.com/reader/full/comparing-sizes-of-mos 5/8
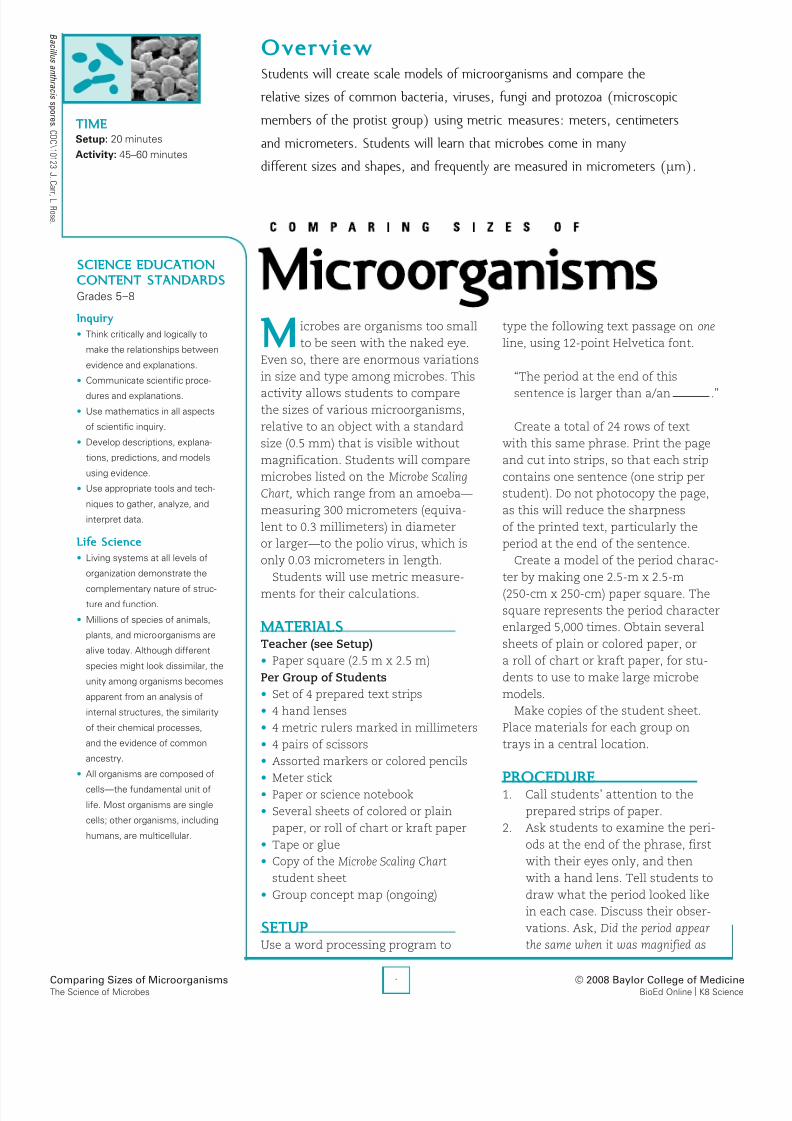
2 Comparing Sizes of MicroorganismsThe Science of Microbes
when you observed it with a naked
eye? (When magnified, the periods
are square.)
3. Have students record their obser-
vations in science notebooks or
on sheets of paper.
4. Ask, What can you say about the
size of the period? Tell students the
period is about 0.5 millimeters
(mm), or 500 micrometers (µm),
in length and width. Have stu-
dents identify the centimeter
and millimeter markings on a
centimeter ruler. Ask, How many
periods could be lined up, end-to-end,
within a meter? (2,000)
5. Before continuing, you may wish
to review the metric system.
Explain that the meter is the fun-
damental unit of length in the
metric system. At 39.37 inches,
a meter is slightly longer than a
yard (36 inches). A centimeter is
approximately the width of an
average fingernail (0.3937 inches).
Ask students, How many centime-
ters make a meter? Hopefully, they
will say “100” (the prefix, “centi,” is
Latin for one hundred). Ask,
How many millimeters make a
meter? (1,000; the prefix, “milli,”
signifies one thousand.) Thus, one
centimeter (cm) is equivalent to
10 millimeters (mm).
6. Introduce students to an even
smaller measure, the micrometer
(µm), or micron, which is one
millionth (or 10-6) of a meter.
Mention that a micrometer is
a measure too small for the
naked eye to see, and that one
centimeter contains 10,000
micrometers. Ask, What is the size,
in micrometers, of the period you
observed? (500 µm) Follow by ask-
ing, Why is the ruler not divided into
micrometers? (markings would be
too small)
7. Ask students, What do you know
about scale models? For example,
you might mention a road map or
a model of the solar system. Ask,
Why do we make scale models? (to
understand the relative position,
size or distance of objects)
8. Next, tell students that they are
going to make a scale model of
microbes, called a “Microbial
Mural,” using the size of the peri-
od as the scale standard. Ask, If I
increased the length and width of the
Continued
100 centimeters (cm)
1,000 millimeters (mm)
1,000,000 micrometers (µm)
Micrometers also are referred
to as “microns.”
ONE METER EQUALS
MODEL SCALE
50 cm = 100 micrometers (µm)
CUTTING EDGE TOOLS
AND TECHNIQUES
enable scientists to isolate and
examine things as small as
individual virus particles and
their components. Joanita
Jakana and Matthew Dougherty,
of the National Center for Macro-
molecular Imaging at Baylor
College of Medicine, look at two
virus images obtained using a
high resolution electron microscope. The virus image on the left monitor was taken directly
from the microscope. The image on the right monitor is a 3-D structural composite of the
virus, created with specialized software developed by Mr. Dougherty.
The National Center for Research Resources, National Institutes of Health, supports several
centers dedicated to visualizing 3-D structures within cells and viruses (www.ncrr.nih.gov).
M. Young © Baylor College of Medicine.
EXTENSION
Have students research other
microbes and create additional
scale models to add to the
Microbial Mural.
The word “meter” comes from
the Greek word for “measure.”
The meter (m) is the standardunit of length in the International
System of Units (SI). Below are
definitions of SI units for length.
SI subdivisions of a meter (m)
0.1 m = 1 decimeter (dm)0.01 m = 1 centimeter (cm)
0.001 m = 1 millimeter (mm) 0.000001 m = 1 micrometer (µm) 0.000000001 m = 1 nanometer (nm)
SI measures larger than 1 m
10 m = 1 decameter (dam)
1,000 m = 1 kilometer (km)
Other equivalents
1 m = 39.37 inches (in.)1 cm = 0.3937 in.
1 mm = 0.03937 in.*1 nm = 10 Ångstrõm
*1 mm is about 1/2
METRICS
© 2008 Baylor College of MedicineBioEd Online | K8 Science
8/13/2019 Comparing Sizes of MOs
http://slidepdf.com/reader/full/comparing-sizes-of-mos 6/8
3
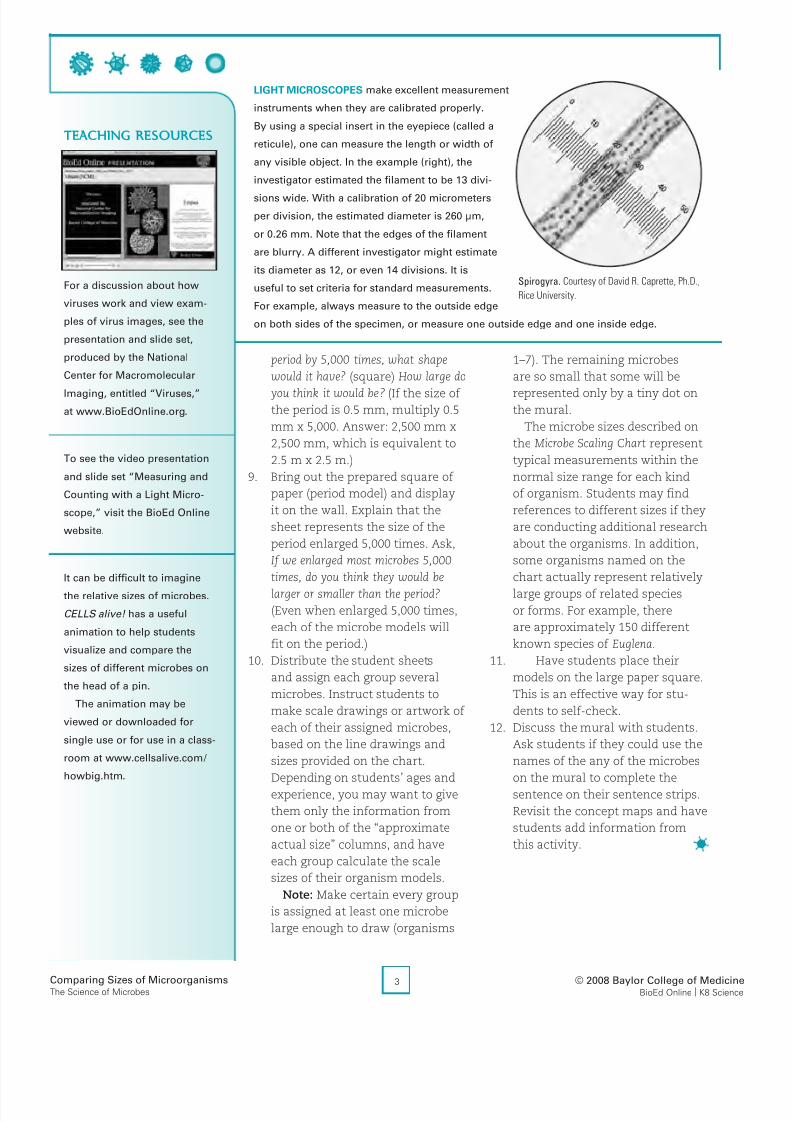
LIGHT MICROSCOPES make excellent measurement
instruments when they are calibrated properly.
By using a special insert in the eyepiece (called a
reticule), one can measure the length or width of
any visible object. In the example (right), the
investigator estimated the filament to be 13 divi-
sions wide. With a calibration of 20 micrometers
per division, the estimated diameter is 260 µm,
or 0.26 mm. Note that the edges of the filament
are blurry. A different investigator might estimate
its diameter as 12, or even 14 divisions. It is
useful to set criteria for standard measurements.
For example, always measure to the outside edge
on both sides of the specimen, or measure one outside edge and one inside edge.
Comparing Sizes of MicroorganismsThe Science of Microbes
period by 5,000 times, what shape
would it have? (square) How large do
you think it would be? (If the size ofthe period is 0.5 mm, multiply 0.5
mm x 5,000. Answer: 2,500 mm x
2,500 mm, which is equivalent to
2.5 m x 2.5 m.)
9. Bring out the prepared square of
paper (period model) and display
it on the wall. Explain that the
sheet represents the size of the
period enlarged 5,000 times. Ask,
If we enlarged most microbes 5,000
times, do you think they would be
larger or smaller than the period?
(Even when enlarged 5,000 times,
each of the microbe models will
fit on the period.)
10. Distribute the student sheets
and assign each group several
microbes. Instruct students to
make scale drawings or artwork of
each of their assigned microbes,
based on the line drawings and
sizes provided on the chart.
Depending on students’ ages and
experience, you may want to give
them only the information from
one or both of the “approximate
actual size” columns, and have
each group calculate the scale
sizes of their organism models.
Note: Make certain every group
is assigned at least one microbe
large enough to draw (organisms
1–7). The remaining microbes
are so small that some will be
represented only by a tiny dot onthe mural.
The microbe sizes described on
the Microbe Scaling Chart represent
typical measurements within the
normal size range for each kind
of organism. Students may find
references to different sizes if they
are conducting additional research
about the organisms. In addition,
some organisms named on the
chart actually represent relatively
large groups of related species
or forms. For example, there
are approximately 150 different
known species of Euglena.
11. Have students place their
models on the large paper square.
This is an effective way for stu-
dents to self-check.
12. Discuss the mural with students.
Ask students if they could use the
names of the any of the microbes
on the mural to complete the
sentence on their sentence strips.
Revisit the concept maps and have
students add information from
this activity.
Spirogyra. Courtesy of David R. Caprette, Ph.D.,
Rice University.
To see the video presentation
and slide set “Measuring and
Counting with a Light Micro-
scope,” visit the BioEd Online
website.
It can be difficult to imagine
the relative sizes of microbes.
CELLS alive! has a useful
animation to help students
visualize and compare the
sizes of different microbes on
the head of a pin.
The animation may be
viewed or downloaded for
single use or for use in a class-
room at www.cellsalive.com /
howbig.htm.
For a discussion about how
viruses work and view exam-
ples of virus images, see the
presentation and slide set,
produced by the National
Center for Macromolecular
Imaging, entitled “Viruses,”
at www.BioEdOnline.org.
TEACHING RESOURCES
© 2008 Baylor College of MedicineBioEd Online | K8 Science

8/13/2019 Comparing Sizes of MOs
http://slidepdf.com/reader/full/comparing-sizes-of-mos 7/8
4
0.3
0.25
0.2
0.13
0.01
0.002
0.001
0.001
0.002
0.0003
0.0002
0.00015
0.0001
0.00008
0.00003
0.00003
0.5
300
250
200
130
10
2
1
1
2
0.3
0.2
0.15
0.1
0.08
0.03
0.03
500
Comparing Sizes of MicroorganismsThe Science of Microbes
–
1
2
3
4
5
6
7
8
9
10
11
12
13
14
15
16
Centimeters(cm)
Millimeters(mm)
Micrometers(µm)ORGANISM
APPROXIMATE ACTUAL
S IZ E OF A S INGLE U NI T
MODEL
SCALE S IZ E
B a c i l l u s a n t h r a c i s s p o r e s . C D C \ 1 0 1 2 3 J . C a r r ,L .R o s e .
.
Protists
Protists
Protists
Protists
Fungi
Bacteria
Bacteria
Bacteria
Bacteria
Viruses
Viruses
Viruses
Viruses
Viruses
Viruses
Viruses
Amoeba - Group of single-celled organisms known for
their constantly changing shape.
Paramecia - Group of single-celled freshwater organisms
that are slipper-shaped and move with cilia.
Diatoms - Large group of single-celled fresh or saltwater
algae.
Euglena - Group of single-celled freshwater organisms
that use a single hair (flagellum) to propel themselves.
Baker’s yeast - Single-celled organism used to make
bread rise.
Escherichia coli - Bacterium that helps digest food in the
intestines; one form of E. coli causes serious food poisoning.
Staphylococcus - Group of bacteria on skin that can cause
infections; some kinds cannot be killed with most antibiotics.
Cyanobacteria - Large group of bacteria capable of
photosynthesis.
Lactobacillus - Group of bacteria used to make yogurt; also
found in the digestive tract.
Smallpox virus - Virus that causes smallpox (brick-shaped);
also called “Variola virus.”
T4 bacteriophage - Virus that attacks E. coli bacteria.
Rabies virus - Bullet-shaped virus that causes the disease
called “rabies.”
Influenza virus - Group of viruses that cause influenza;
also known as the “flu.”
Adenovirus - Group of viruses that cause respiratory
diseases.
Polio virus - Virus that causes the disease known as polio-
myelitis; also called “polio.”
Rhinovirus - Group of viruses that cause the common cold.
“Period” character - Helvetica type,12-point size.
150
125
100
65
5
1
0.5
0.5
1
0.15
0.1
0.075
0.05
0.04
0.015
0.015
250
Actual size: 1 millimeter (mm) = 1,000 micrometers (µm). Drawings not to scale.
Micrometers also are referred to as “microns.”
GROUP
Model Scale Size0.5 cm = 1 µm
© 2008 Baylor College of MedicineBioEd Online | K8 Science
8/13/2019 Comparing Sizes of MOs
http://slidepdf.com/reader/full/comparing-sizes-of-mos 8/8
5A Powerful ToolThe Science of Microbes
P e d i c u l u s h u m a n u s , o r f e m a l e b o d y l o u s e . C
D C \ 9 2 4 4 J . C a r r , J . S t r y c h a r z ,K .Y o o n ,F . C o l l i n s .
M edical researchers
and other scientists
today have powerful tools
for observing and studyingmicrobes. One such tool is
the scanning electron micro-
scope, or SEM.
This type of microscope
uses electrons to view and
image structures too tiny to
be seen with an ordinary light
microscope. It allows scien-
tists to see three-dimensional
aspects of infectious agents,living organisms and nonliving
surfaces, without distortion
and without destroying
specimens in the process.
To create the images, a
filament inside an electron
“gun” shoots a beam of
electrons down through a
stack of electromagnetic
lenses onto a specimen,
held in a vacuum chamber
below. The beam continu-
ally scans across the sample,
which responds by emitting
electrons from its own sur-
face. These are collected by
a detector inside the sample
chamber.
This process results in a
simultaneous recreation of the
sample’s surface on a viewing
screen. With the twist of
a dial, or the wiggle of a mouse
(in newer models), the specimen’s
contours can be explored in any
magnification, from about eight
times the actual size up to
hundreds of thousands of times—
as much as a million times!
Watching the image on the screen
is like looking out the window of a
plane. The landscape “below”
continually changes as your “plane”
flies above or around it,
zooming in and out or hover-
ing for a photo.
Other research instruments
can be attached to the SEM
to extend the range of infor-
mation a specimen can yield.
One tool produces a spectrum
of elements present in a given
sample. Software programs
are utilized to further analyze
a sample’s size, shape and
other physical characteristics.
Most modern SEMs are
controlled by computer soft-
ware, and require samples
to be dry and coated with a
thin film of gold. Some SEMs
also can vary the pressure in
the sample chamber, or even
introduce water vapor. This
makes it possible to observe
fresh samples (like medical
tissues) in their natural stateand introduces the dimension
of time. For example, crystals
now can be seen dissolving
and resolidifying in real time.
Microscopes like the SEM
have allowed researchers to
see the external and internal
appearance of microbes.
Still, scientists and engineers
continue to develop morepowerful SEMs and other
tools, including new micro-
scopes that allow us to see cells at
the subatomic level. These advance-
ments in microscope technology
will help solve a host of medical
problems.
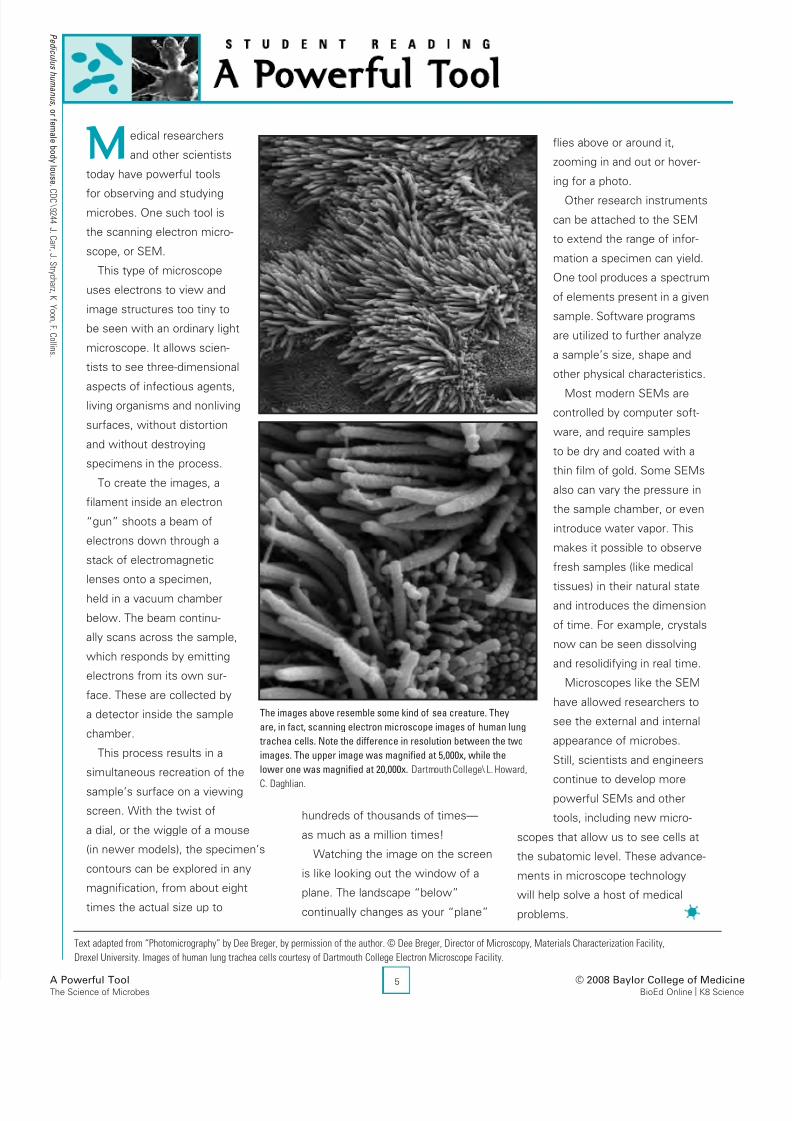
The images above resemble some kind of sea creature. They
are, in fact, scanning electron microscope images of human lung
trachea cells. Note the difference in resolution between the two
images. The upper image was magnified at 5,000x, while the
lower one was magnified at 20,000x. Dartmouth College\ L. Howard,
C. Daghlian.
Text adapted from “Photomicrography” by Dee Breger, by permission of the author. © Dee Breger, Director of Microscopy, Materials Characterization Facility,
Drexel University. Images of human lung trachea cells courtesy of Dartmouth College Electron Microscope Facility.
© 2008 Baylor College of MedicineBioEd Online | K8 Science