Comparing OSV operations in Brazil with NorwayWe will in this study highlight the differences...
118
1 Comparing OSV operations in Brazil with Norway - Qualitative benchmark study of the cost drivers using interviews By Thomas Vikenes and Carl-Emil Kjølås Johannessen Supervisor: Siri Strandenes Pettersen Master Thesis within the Master of Science Major: Financial Economics NORWEGIAN SCHOOL OF ECONOMICS This thesis was written as a part of the Master of Science in Economics and Business Administration at NHH. Please note that neither the institution nor the examiners are responsible − through the approval of this thesis − for the theories and methods used, or results and conclusions drawn in this work. Norwegian School of Economics Bergen, Fall 2014
Transcript of Comparing OSV operations in Brazil with NorwayWe will in this study highlight the differences...

1
Comparing OSV operations in Brazil with Norway
- Qualitative benchmark study of the cost drivers using interviews
By Thomas Vikenes and Carl-Emil Kjølås Johannessen
Supervisor: Siri Strandenes Pettersen
Master Thesis within the Master of Science
Major: Financial Economics
NORWEGIAN SCHOOL OF ECONOMICS
This thesis was written as a part of the Master of Science in Economics and Business
Administration at NHH. Please note that neither the institution nor the examiners are
responsible − through the approval of this thesis − for the theories and methods used, or
results and conclusions drawn in this work.
Norwegian School of Economics
Bergen, Fall 2014

2
Abstract The objective of this thesis is to map the main drivers behind the operational and capital
expenditures related to offshore support vessels in Brazil and in the North Sea. We compare
the two regions using the North Sea as the benchmark.
Our study is qualitative and the data is gathered using semi-structured interviews with
Norwegian offshore shipping companies, both in Brazil (Rio de Janeiro) and in Norway. Our
findings are mainly based on information gathered in these interviews, but reports from
shipbrokers and other financial institutions, together with interviews with other actors in
the offshore shipping industry, are used to get a different perspective on the topic.
In the first part of our thesis, the external environment in the offshore shipping industry is
analyzed. Three different analyses are performed assessing: the drivers behind the demand
for offshore vessels, the attractiveness of the offshore shipping industry and how it is to do
business for Norwegian shipowners in Brazil compared to Norway. In the second part, the
company specific factors, OPEX and CAPEX, are analyzed. An investment case, evaluating
whether to invest in a vessel in Norway or Brazil is presented at the end of this part.
Based on our analysis of the external environment in the offshore shipping industry, we find
out that; the demand for offshore vessels is stagnating due to lower E&P spending, the
attractiveness of the offshore shipping industry is low, and the difference between Norway
and Brazil in terms of doing business is large.
Based on our analysis in the second part of our thesis, we conclude that both the OPEX and
the CAPEX (Docking and Shipbuilding) related to the operation of a vessel is higher in Brazil
than in the North Sea. The higher OPEX is mainly driven by higher crew and technical costs,
and increased costs due to a challenging client. The higher docking cost is mainly driven by a
lack of dry-docks, and issues related to the importation of equipment. The higher
shipbuilding cost is driven by a low supply of commercial yards, delays in the shipbuilding
process, and issues related to the importation of equipment.
In the investment case at the end of part two, our recommendation is that shipowners
should invest in Norway rather than Brazil.

3
Preface This thesis is the last step to complete our Master of Science in Financial Economics at
Norwegian School of Economics (NHH), and our CEMS-degree in International Management.
Through our studies at NHH we have developed an increasing interest for the shipping
industry and especially the operation of offshore support vessels. Both of us have worked
part-time in shipping companies during our Bachelors at NHH, and we have participated in
shipping related activities offered by NHH’s Shipping and Logistics Group (STG).
The offshore shipping industry is at different maturity stages around the globe. The North
Sea is the most mature market in the world, with a sophisticated spot-market for offshore
support vessels. The market in Brazil is rather immature, without any real spot-market,
where most of the offshore vessels are on long contracts, between 4 and 8 years excluding
options. The cost of operating vessels in Brazil has increased substantially the last decade,
making it harder for shipowners to earn good profits. However, the growth prospects look
very promising.
For the Norwegian economy, the offshore- and shipping industry is essential both in terms
of value creation and employment. Several Norwegian shipowners are major players in the
business globally, and the Norwegian fleet is one of the most modern and advanced in the
world, thus making it interesting to compare Norway to other regions.
Throughout the process of writing this thesis we have gained substantial knowledge about
the offshore shipping industry in the North Sea and Brazil. The process of writing the thesis
has been tough, and we will like to thank Siri Pettersen Strandenes for the valuable
discussions we have had with her. We would also like to thank the Norwegian Shipowners
Association’s representative in Brazil (ABRAN) and DOF ASA for the help they provided
during our stay in Brazil.
Bergen, 19.desember 2014
__________________________ __________________________ Thomas Vikenes Carl-Emil Kjølås Johannessen

4
Table of content
Abstract ................................................................................................................................................... 2
Preface .................................................................................................................................................... 3
Table of content ...................................................................................................................................... 4
Figures ..................................................................................................................................................... 7
Tables ...................................................................................................................................................... 7
Introduction and research questions ...................................................................................................... 8
1 Scope of study and definitions ...................................................................................................... 10
1.1 Definition of terms and concepts ......................................................................................... 10
1.2 Definition of Industry ............................................................................................................ 12
1.2.1 Menon’s definition of offshore shipping ...................................................................... 12
1.2.2 Our definition of offshore support vessels ................................................................... 12
1.2.3 The vessel types ............................................................................................................ 13
1.3 The offshore shipping industry in Brazil and Norway ........................................................... 17
1.3.1 The North Sea ............................................................................................................... 17
1.3.2 The Brazilian continental shelf ...................................................................................... 18
2 Method ......................................................................................................................................... 20
2.1 Choice of research method ................................................................................................... 20
2.2 Data gathering ...................................................................................................................... 21
2.3 Power of results .................................................................................................................... 23
2.4 Analysis method .................................................................................................................... 25
3 Drivers of demand for offshore support vessels........................................................................... 28
3.1.1 PSV ................................................................................................................................ 29
3.1.2 AHTS .............................................................................................................................. 29
3.1.3 CSV ................................................................................................................................ 30
3.1.4 Overall outlook .............................................................................................................. 30
4 Strategic Profitability Analysis ...................................................................................................... 31
4.1 Rivalry among competitors ................................................................................................... 31
4.2 Threats of substitutes ........................................................................................................... 34
4.3 Threats from new entrants ................................................................................................... 35
4.4 Bargaining power of suppliers .............................................................................................. 37
4.5 Bargaining power of buyers .................................................................................................. 40
4.6 Summary ............................................................................................................................... 42
5 Country analysis - Norway and Brazil ............................................................................................ 42
5
5.1 Cultural distance ................................................................................................................... 43
5.2 Administrative distance ........................................................................................................ 44
5.3 Geographical distance ........................................................................................................... 45
5.4 Economic distance ................................................................................................................ 46
5.5 Summary ............................................................................................................................... 47
6 OPEX .............................................................................................................................................. 48
6.1 OPEX - Norway ...................................................................................................................... 49
6.1.1 Crew .............................................................................................................................. 50
6.1.2 Technical ....................................................................................................................... 54
6.1.3 Insurance ....................................................................................................................... 55
6.1.4 Breakdown .................................................................................................................... 55
6.1.5 Bunkers and lube oil ...................................................................................................... 56
6.1.6 Port and pilot fees ......................................................................................................... 56
6.1.7 Inspection ...................................................................................................................... 57
6.2 OPEX - Brazil .......................................................................................................................... 57
6.2.1 Specific characteristics with the Brazilian market ........................................................ 57
6.2.2 Crew .............................................................................................................................. 60
6.2.3 Technical ....................................................................................................................... 65
6.2.4 Insurance ....................................................................................................................... 68
6.2.5 Breakdown .................................................................................................................... 68
6.2.6 Bunkers and lube oil ...................................................................................................... 70
6.2.7 Port and pilot fees ......................................................................................................... 70
6.2.8 Inspection ...................................................................................................................... 71
6.2.9 Other costs .................................................................................................................... 71
6.3 Comparison and summary of OPEX ...................................................................................... 71
7 CAPEX ............................................................................................................................................ 72
7.1 CAPEX - Norway .................................................................................................................... 72
7.1.1 Docking .......................................................................................................................... 72
7.1.2 Shipbuilding ................................................................................................................... 75
7.1.3 Advantages and disadvantages of building vessels in Norway ..................................... 77
7.2 CAPEX - Brazil ........................................................................................................................ 78
7.2.1 Dry Docking ................................................................................................................... 78
7.2.2 Shipbuilding ................................................................................................................... 82
7.2.3 Advantages and disadvantages of building vessels in Brazil ......................................... 85
6
7.3 Comparison and summary of CAPEX .................................................................................... 91
8 Tax and foreign exchange costs .................................................................................................... 92
8.1 Tax ......................................................................................................................................... 92
8.2 Financial Cost - Currency - FX risk ......................................................................................... 94
9 Investment case: Brazil vs. Norway .............................................................................................. 95
9.1 Methodology ......................................................................................................................... 95
9.2 Assumptions .......................................................................................................................... 99
9.3 Analysis ............................................................................................................................... 100
9.4 Recommendation ................................................................................................................ 103
10 Conclusion ............................................................................................................................... 104
11 Limitations of the study and further research ........................................................................ 105
12 Bibliography ........................................................................................................................... 107
13 Appendix ................................................................................................................................. 113
7
Figures
Figure 1: Development in PSV newbuilding prices 2004-2014 ............................................................. 14
Figure 2: Development in AHTS newbuilding prices 2004-2014........................................................... 15
Figure 3: Offshore Support services along the life-cycle of an oil field ................................................ 28
Figure 4: Overview of the North Sea supply fleet 2007-2014 .............................................................. 32
Figure 5: Hofstede(2001) dimensions - Power distance and masculinity ............................................. 44
Figure 6: Average breakdown of OPEX for supply vessels in the North Sea and Brazil ........................ 49
Figure 7: Average daily OPEX (1000 USD) for PSV, AHTS and CSV ........................................................ 49
Figure 8: Average number of crew on PSV and AHTS ........................................................................... 52
Figure 9: Breakdown of social benefits on top of crew salary in Brazil ................................................ 63
Figure 10a: Contract structure and revenue tax for International vessels in Brazil ............................. 92
Figure 10b: Contract structure and revenue tax for Brazilian vessels in Brazil .................................... 92
Tables Table 1: Orderbook PSV 2014-2016 ...................................................................................................... 14
Table 2: Orderbook AHTS 2014-2016 ................................................................................................... 16
Table 3: The World Bank rankings - ease of doing business in Norway and Brazil ............................... 45
Table 4: Valuation assumption Norway .............................................................................................. 101
Table 5: Valuation result Norway ....................................................................................................... 101
Table 6: Valuation assumptions Brazil ................................................................................................ 102
Table 7: Valuation result Brazil ........................................................................................................... 102
8
Introduction and research questions We will in this study highlight the differences between operating offshore support vessels in
Norway and Brazil, with main focus on operating expenses, shipbuilding and docking costs.
The Norwegian market for offshore support vessels (OSV) was established together with the
discovery of oil on the Norwegian continental shelf. The first orders of OSVs by Norwegian
shipowners were done in 1969 (Norwegian Shipowners' Association, 2011). The Brazilian
market for OSVs was established around the same time, but it was not before the
discoveries made in the beginning of the 2000s that the industry really started to develop.
(Abeam, 2013)
To gather data and understand the differences between the two regions, we have
conducted interviews with top managers in Norwegian offshore shipping companies in Rio
de Janeiro, and in cities along the coast of Norway. Together these companies control about
237 OSVs1. 80 of these vessels are operating in Brazil, while about 100 operate in the North
Sea. As a result, Norwegian shipowners control more than 20% total fleet in Brazil, and the
same shipowners about ⅓ of the fleet in Norway. (RS Platou 2014). In addition, several
interviews have been conducted with other actors in the industry, like banks, insurance
companies, yards and shipbrokers.
Among the Norwegian offshore shipping companies that operate in Brazil, DOF is the largest
player with a total of 25 vessels, followed by Farstad with 18 vessels and Siem Offshore with
13 vessels (Abeam, 2014). Farstad, Siem Offshore, Havila Shipping, Olympic Shipping, Deep
Sea Supply and K-line are mainly operating in the anchor handling tug supply (AHTS) and
platform support vessel (PSV) segment, while DOF and Solstad are major players in the
subsea segment, as well as PSV and AHTS.
Through interviews with key players from the offshore shipping industry and comprehensive
study of relevant theory we have aimed to answer the following questions:
● What are the main drivers for operational and capital expenditures related to
operation of PSVs, AHTS’ and CSVs in Brazil and how do they differ compared to the
North Sea?
1 The fleet number is derived from annual reports (DOF ASA, 2014a, Havila Shipping, 2014, Olympic Shipping, 2014, Siem Offshore, 2014, Solstad ASA , 2014, K-Line Offshore, 2014)

9
● Where should Norwegian Shipowners invest in their next OSV?
We answer these questions through an analysis divided into two parts. The first part is an
analysis of the external environment where we look at the external factors that influence
the demand for OSVs, the attractiveness of the offshore shipping market in Brazil and
Norway, and the differences between Norway and Brazil when it comes to doing business.
The second part of the study is an analysis of company specific factors. We focus on the
costs related to operating OSVs and the associated cost drivers. Norway and Brazil are
compared throughout the study in order to highlight the main differences in cost levels and
cost drivers. We have grouped the costs in several sub groups, and analyzed each group
separately in order to draw interesting conclusions. The second part is ended with an
investment case where we look at where a Norwegian shipowner should build and operate
a newly built offshore vessel.
10
1 Scope of study and definitions
1.1 Definition of terms and concepts
Vessels and offshore units
OSV - Offshore support vessel, general term for all vessels supporting the oil companies
PSV - Platform supply vessel
AHTS - Anchor handling tug supply vessel
CSV - Construction support vessel
PLSV - Pipe lay support vessel
DSV - Diving support vessel
FPSO - Floating production, storage and offloading unit
ROV - Remotely operated vehicle
FPU - Floating production unit
Flags
BRL-flagged vessel - Vessel flying under the Brazilian flag
INT-flagged vessel - Vessel flying under an International flag
REB-flagged vessel - Vessel flying under the special Brazilian flag
NIS-flagged vessel - Vessel flying under the Norwegian International Ship Register flag
NOR-flagged vessel - Vessel flying under the Norwegian flag
Other
IOC - International oil companies
CAPEX - Capital Expenditure
OPEX - Operational Expenditure
EBN - Brazilian Shipping Company
NCS - Norwegian Continental shelf
BCS – Brazilian Continental shelf
Institutions and Associations
ANTAQ - National Agency of Waterway Transportation in Brazil
IBAMA - Brazilian Institute for the Environment and Natural Resources
ABRAN - Brazilian Association of Norwegian Shipowners
ABEAM - Brazilian Association of Offshore Support Companies

11
ANP - National Petroleum Agency in Brazil
NSA - Norwegian Shipowners Association
FMM - Marine Merchant Fund - Giving financing to BRL-built vessels
BNDES - The Brazilian development bank - Giving out the loans on behalf of FMM
Import
REPETRO - Brazilian special customs regime
Tax
ISS - Tax on services
ICMS - Tax on circulation of goods and services
CPRB - Social Security Contribution on Gross Revenue
PIS - Contribution to the Social Integration Program
COFINS - Contribution to Social Security Financing
Labor agreements
CLT - Consolidation of Labor Laws
CBA - Collective Bargaining Agreement
Offshore regions
Norwegian offshore shipping market - The North Sea, both UK and NCS
Brazilian offshore shipping market - The Brazilian Continental Shelf
Offshore shipping
Charterer - The company (Statoil/Petrobras) hiring the vessel from the shipowner
Shipowner - The company owning the vessels. In this paper also used when talking about
managers of Norwegian subsidiaries in Brazil
Operator/Manager - The company in charge of the vessels, could be the shipowner
Bunkers - Fuel used for the vessel’s engines.
Pilot - Person being onboard the vessel when the vessel goes to port. (“Los” - Norwegian)
Inspection - Companies like Det Norske Veritas GL (DNV GL), giving certificates to vessels
Thrusters - Propellers on the side of the vessel, making it go sideways and spin
DP system - Dynamic positioning system, positioning the vessel in the correct spot
Winch - Equipment used during anchor handling operations
Classification - All vessels are classified by DNV GL or similar institutions. Otherwise they
cannot operate.

12
Chief engineer - The person in charge of the machinery onboard of the vessel (engine room)
Deck Cadet - People working on the deck of the vessel
Dry-docking - Process where the vessel is taken out of the sea, in order to do maintenance.
Financial expressions
CF - Cash Flow
NPV - Net present value
EMARK - Market premium
IRR - Internal rate of return
Rf - Risk free rate
Re - Required return on equity
E - Equity
D - Debt
EBITDA - Earnings before interest, taxes, depreciation and amortization.
CAPM - Capital Asset Pricing Model
1.2 Definition of Industry
1.2.1 Menon’s definition of offshore shipping
Menon’s definition of offshore shipping (Norwegian Shipowners’ Association, 2012): All
enterprises that is owning, operating, designing, building, supplying equipment or
specialized services to all types of ships and other floating units.
Offshore shipowner: Owners and operators of supply vessels, anchor handling vessels,
construction vessels, seismic- and other offshore related special vessels, including subsea
entrepreneurs.
1.2.2 Our definition of offshore support vessels
In the offshore support industry we include PSV (Platform supply vessels), AHTS (Anchor
Handling Tug Support Vessel) and CSV (Construction Support Vessel). When we refer to the
OSV (Offshore Support Vessels) market this is the market for PSVs, AHTS’ and CSVs. Several
people would argue that the OSV market only consist of PSVs and AHTS’ (Offshore supply
vessels), and that CSV are considered to be subsea vessels. We argue that all the different
vessel-types perform support services for the offshore industry; hence all of them are part
of the common term offshore support vessels (OSV).

13
1.2.3 The vessel types
The main categories of offshore vessels are Platform Supply vessels (PSV), Anchor Handling
Tug Supply Vessels (AHTS) and Construction Support Vessels (CSV). The two first groups are
normally categorized based on their size, engine power and technical equipment on board.
CSVs are more specialized and cannot be categorized in a similar way. The CSVs are
primarily used for subsea operations. These vessels are more advanced and different vessels
with different equipment are used depending on the type of project. A more detailed
explanation of the three types of vessels follows underneath.
Platform Supply Vessel (PSV)
The PSV’s are specially designed to supply oil platforms offshore. The length of a PSV can
vary from 20m to a 100m. The main purpose of the vessel is to transport cargo or crew to oil
platforms or other offshore installations. The cargo transported to the platforms is
pulverized cement, fuel, drinking water, chemicals used in the drilling process, pipelines,
food and other equipment. Returning from the platforms the PSV bring drilling mud, and
other disposable products that are handled onshore. (Norwegian Shipping Association,
2012)
The PSVs have tanks underneath the deck where they can carry liquid substances, while
containers and other equipment can be carried on top of the deck. The technical equipment
installed on a PSV can distinguish it from another vessel. Some PSVs have been designed, or
converted, to perform a specific task. An example is DOF ASA’s vessel Skandi HAV who has
been converted from a PSV to a Pipe-lay support vessel (PLSV) to be able to support in pipe
laying activities. Some of the PSVs carry equipment for extinguishing or fighting fires on
platforms (Norwegian Shipowners’ Association, 2012), and other PSVs have Remotely
Operated Vehicle (ROV) equipment onboard or oil spill recovery equipment. The extra
equipment are qualities that can lead to higher day rates for the vessels, or at least make
them able to bid on more tenders.
The PSVs are normally grouped based on their size (length), their deck area or the
deadweight ton (dwt) capacity. In the table showing newbuilding activity underneath the
vessels are categorized by deck area (m2).

14
Figure 1: Development in PSV newbuilding prices 2004-2014
(RS Platou, 2014)
The development in newbuilding prices for a PSV is shown in the graph above. There was a
large increase in prices before the financial crises, followed by a dip and stabilization in
prices afterwards. The largest PSVs with deck space of over 899 m2 cost about $55 million
today.
The current PSV fleet is about 1369 vessels. As seen in the table underneath, the
newbuilding activity for PSVs is high.
Table 1: Orderbook PSV 2014-2016
Platform Supply Vessel Total 2014 2015 2016+
PSV<500 m2 85 49 24 12
PSV 500-749 m2 120 50 57 13
PSV 750-899 m2 134 58 58 18
PSV 900+ m2 133 70 45 18
PSV Total 472 227 184 61
(RS Platou, 2014)
There will be built about 227 new PSVs in 2014, which corresponds to 16,5% of the current
fleet. Some vessels might be scrapped during 2014, reducing the fleet growth, but many
shipowners and investors believe that the growth in supply is so large that it won’t be
absorbed by the demand from the offshore oil companies. The balance between supply and
demand is the main driver of the dayrates that the shipowners receive.
Anchor Handling Tug Supply Vessel (AHTS)
Anchor Handling Tug Supply Vessels’ main purpose is towing the oil rigs from one well (field)
to another and anchor them to the seabed. These vessels are also able to supply the
platforms the same way as the PSVs, but their deck capacity is usually much smaller. They

15
differ from PSVs in that they are equipped with winches for towing and anchor-handling
operations. They also have open sterns to allow anchors to be raised onboard (Norwegian
Shipowners’ Association, 2012). In addition to winches for towing, AHTS’ are sometimes
equipped with large cranes, and ROV systems. DOF’s Skandi Skansen is an AHTS with both
cranes and a ROV installed, making it a versatile vessel, able to conduct both anchor
handling and construction support activities (DOF ASA, 2014b).
The AHTS’ can fix anchors at new locations, and make the seabed ready for jack-up rigs. The
demand for the vessels is very dependent on the amount of rigs working at a specific time
(Pareto E&P Survey, 2014). Compared to PSVs, AHTS’ have much more engine power, which
is natural because it is needed when handling heavy anchors and towing extremely heavy
platforms. Larger anchor handlers have the ability to support larger rigs and to perform
more steady and safe towing work. To remove a rig, 4 AHTS’ are normally required.
As seen on the graphic on the next page, the development in newbuilding prices has been
similar for AHT’S and PSVs the last 10 years. The prices increased before the financial crisis,
followed by a drop and then stabilization. Very large AHTS is however an exception, where
the prices have increased with 20-30% from 2008/09 until today. This could be driven by the
increasing demand for larger vessels as oil drilling move from shallow water to more deep-
water operations. The largest AHTS’ costs around $105 million today, while medium sized
AHTS’ cost $70 million on average (RS Platou 2014).
Figure 2: Development in AHTS newbuilding prices 2004-2014
(RS Platou, 2014)
16
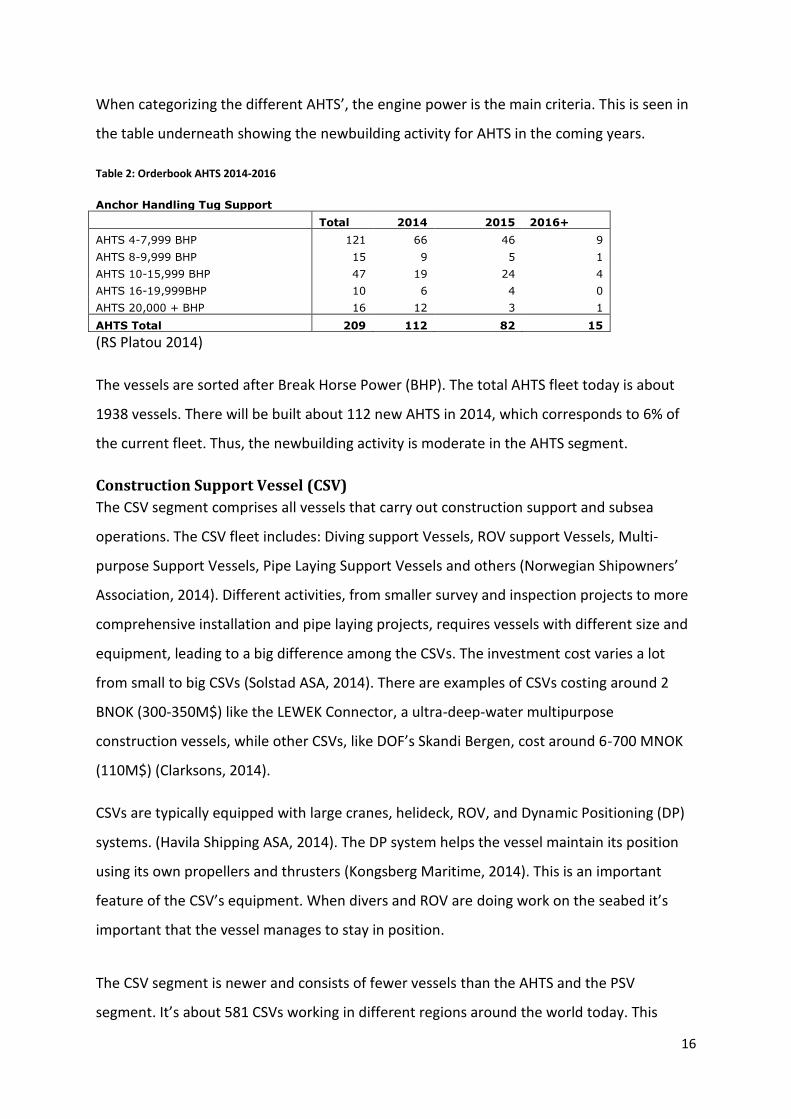
When categorizing the different AHTS’, the engine power is the main criteria. This is seen in
the table underneath showing the newbuilding activity for AHTS in the coming years.
Table 2: Orderbook AHTS 2014-2016
Anchor Handling Tug Support Total 2014 2015 2016+
AHTS 4-7,999 BHP 121 66 46 9
AHTS 8-9,999 BHP 15 9 5 1
AHTS 10-15,999 BHP 47 19 24 4
AHTS 16-19,999BHP 10 6 4 0
AHTS 20,000 + BHP 16 12 3 1
AHTS Total 209 112 82 15
(RS Platou 2014)
The vessels are sorted after Break Horse Power (BHP). The total AHTS fleet today is about
1938 vessels. There will be built about 112 new AHTS in 2014, which corresponds to 6% of
the current fleet. Thus, the newbuilding activity is moderate in the AHTS segment.
Construction Support Vessel (CSV)
The CSV segment comprises all vessels that carry out construction support and subsea
operations. The CSV fleet includes: Diving support Vessels, ROV support Vessels, Multi-
purpose Support Vessels, Pipe Laying Support Vessels and others (Norwegian Shipowners’
Association, 2014). Different activities, from smaller survey and inspection projects to more
comprehensive installation and pipe laying projects, requires vessels with different size and
equipment, leading to a big difference among the CSVs. The investment cost varies a lot
from small to big CSVs (Solstad ASA, 2014). There are examples of CSVs costing around 2
BNOK (300-350M$) like the LEWEK Connector, a ultra-deep-water multipurpose
construction vessels, while other CSVs, like DOF’s Skandi Bergen, cost around 6-700 MNOK
(110M$) (Clarksons, 2014).
CSVs are typically equipped with large cranes, helideck, ROV, and Dynamic Positioning (DP)
systems. (Havila Shipping ASA, 2014). The DP system helps the vessel maintain its position
using its own propellers and thrusters (Kongsberg Maritime, 2014). This is an important
feature of the CSV’s equipment. When divers and ROV are doing work on the seabed it’s
important that the vessel manages to stay in position.
The CSV segment is newer and consists of fewer vessels than the AHTS and the PSV
segment. It’s about 581 CSVs working in different regions around the world today. This

17
number is expected to grow with 35 (6%) vessels in 2015 and 27(4,5%) in 2016 (DNB
Markets, 2014). The two biggest segments are ROV support and Pipe-lay support vessels
representing more than half of the newbuildings. The prices can, as already mention, vary
depending on the type of vessel that is purchased.
1.3 The offshore shipping industry in Brazil and Norway
1.3.1 The North Sea
History and development
The North Sea comprises of Norwegian and British continental shelf. The offshore shipping
industry in Norway started with the discovery of oil on the Norwegian continental shelf
(NCS) in 1969. The first offshore supply vessels used on the NCS was converted fishing
vessels. The fish boat companies had great competitive advantage when operating on the
NCS because they were used the heavy waves and the dark and cold environment. These
tough conditions also required ships and equipment of high quality, which put pressure on
the local shipyards, naval architects and equipment manufactures to develop robust,
durable and innovative solutions (Norwegian Shipowners’ Association, 2011). On British side
gas was first discovered in 1965. In 1968 oil was still not found on British side and the oil
companies lost interest in further exploration in the British sector. The situation changed
when oil was discovered on Norwegian side in 1969, and in 1970 BP discovered oil in the
Forties Oil Field (Bamberg, 2000).
Alongside a rapidly growing oil industry the offshore shipping industry has evolved fast, and
today there are more than 600 offshore vessels in the North Sea. (RS Platou, 2014). From
the very beginning the North Sea has been open for international players. Even though the
Norwegian government in 1972 decided that Statoil should control 50% of all new
extraction permissions and that the corporate tax should be set to 80%, the Norwegian
continental shelf has always been strongly influenced by international players. With the
competitive advantage the Norwegians had from fishing, the Norwegian offshore shipping
industry grew to be the most modern and advanced in the world. Several innovative
solutions have been developed in Norway, and the most advanced vessels are still being
built in Norway. During the development of the offshore shipping industry in Norway a

18
unique cluster of shipowners, shipbuilders, equipment suppliers have arisen along the west
coast of Norway. (Olje- og Energidepartementet, 2013)
Characteristics of the market
The North Sea is today the only place in the world where there is a well functioning spot
market. This means that instead of hiring vessels on long-term contracts, the charterer can
hire a vessel only for the period they need it. The period could be from a few days up to
several months. The main reason why a well-functioning spot market exists in the North Sea
is that the North Sea market is very open, with few regulations from the governments.
International players are allowed into the North Sea market on the same terms as the
Norwegian and British companies.
Due to the tough conditions in North Sea the oil companies require advanced vessels with
modern technology. Larger vessels are often equipped with several backup solutions in case
something should break down. Today the development in the North Sea is moving towards
drilling at deeper waters, which also create a demand for larger vessels. A third factor
leading to larger vessels in the exploration of oil and gas in the arctic environment. This is an
even rougher climate than the North Sea, and the distance from shore is even longer.
1.3.2 The Brazilian continental shelf
History and development 345
The development of the Brazilian OSV industry started with the first oil discoveries between
1968 and 1975. At that time 13 vessels were imported to work for Petrobras. By 1981 there
were 43 Brazilian offshore vessels operating in Brazil and by 1989 the number of vessels had
reached 110 (Abeam, 2014). The number of proven reserves in Brazil has grown steadily
since the first discoveries in 1975, with discoveries mainly on the Campos Basin and the
Santos Basin. However, it was not before 2007, with the discoveries of the Pre-salt fields
outside Rio de Janeiro that the oil and gas industry really boomed. In 2007 there were about
168 offshore vessels working on the BCS, both international and Brazilian vessels. By 2013
this number had grown to 450, where of 50% had Brazilian flag. Petrobras forecast that they
will need another 200 vessels on the Pre-salt field in the next 5-6 years until 2020 (ABRAN
FGV Seminar, 2014).

19
Petrobras or “Petróleo Brasileiro S/A” is the world’s 3rd largest oil company and the largest
industry conglomerate in South-America. The company controls about 90% of the oilfields in
Brazil, giving them tremendous power. Even though the Brazilian market was opened to
foreign oil companies in 1997, Petrobras has retained its position as monopolist. This
monopoly situation is making operations challenging both for domestic and international
shipowners. Strict regulations, a complex tax system and a country only speaking
Portuguese makes the operations challenging. As for the future, more international oil
companies should appear. But Petrobras is supposed to be the sole operator, and owner of
at least 30%, of all the Pre-salt fields being developed in the next coming years, slowing
down the production as foreign players are not let in a 100%.
Characteristics of the market
The Brazilian oilfields are mainly located at ultra deep waters (1000-3000m) with a long
distance from shore. The ultra-deepwater fields require different oil production units.
Floating Production Storage and Offloading (FPSO) units are used rather than the Jack-up
rigs that often are used at shallow waters. The FPSO require a different service from the
OSVs than rigs working at shallower water. FPSOs can normally move around from one oil
field to another without the help of an anchor handler, but they normally get support from
anchor handlers when offloading oil to oil tankers. Because of the long distance from shore
to the oilfields, larger PSV are required in order to transport more goods to and from the
FPSOs. The AHTS are also larger in Brazil, both in terms of size and engine power. Today
most AHTS’ in Brazil have more than 16 000 BHP (Break Horse Power), and the engine
power will likely increase in the future as operations move to even deeper waters. The
power is necessary in order to pull heavy anchors at extreme water depths, while ensuring a
safe operation.
As of today, there is not really a functioning spot market in Brazil; most contracts are very
long, between 2 and 10 years. A typical contract with Petrobras last for 8 years, where the
shipowner have a certain 4-year contract + an option to continue for 4 years. The long
contracts look attractive for the banks financing the vessels, but history has shown that
inflation and high cost-increases have led to several contracts being unprofitable over time.

20
2 Method In this chapter we will describe the methods we have used to answer our research
questions. The data gathering in our thesis has mainly been done through interviews with
top management in offshore shipping companies, located both in Brazil and in Norway. We
will in this chapter discuss our choice of research method, how we have collected the data,
the validity and reliability of the data, the data sample and how we have analyzed the data.
2.1 Choice of research method
Qualitative vs. quantitative research methods
Research methods refer to the systematic, focused and orderly collection of data for the
purpose of obtaining information from it and to solve our research questions. The methods
are different depending on the techniques used for data collection and procedure. In
qualitative research, findings are not obtained by statistical methods or other procedures of
quantification. Qualitative research requires a different toolset from the researcher where
the findings are based on rational, intuition and exploratory abilities, rather than
quantitative models (Ghauri & Grønhaug, 2010).
Qualitative research is characterized by its aims, which relate to understanding some aspect
of social life, and its methods that in general generate words, rather than numbers, as data
for analysis. Qualitative methods seek to answer questions about the ‘what’, ‘how’ or ‘why’
of a phenomenon rather than ‘how many’ or ‘how much’, which are answered by
quantitative methods.
Criticism of qualitative research:
● Samples are small and not necessarily representative of the broader population,
making it difficult to know how far we can generalize the results
● The findings lack rigor
● Difficult to tell how far the findings are biased by the researcher’s own opinions
(Bricki, 2007)
Choice of study type
It can be argued that structured and quantitative methods are more “scientific” and thereby
better than qualitative research methods. We argue that the quality of a study and the

21
appropriate use of methods depend on the research question and the available information,
meaning that qualitative studies could be just as good. Albert Einstein put it this way: “Not
everything that can be counted counts, and not everything that counts can be counted”
The purpose of our master thesis is to analyze the offshore support industry, and especially
how the operations of OSVs are different in Brazil and Norway. The choice of study method
mainly depends on the type of data that is available and the formulated research question.
In our research it is not possible to collect quantitative data, because the shipowners
potentially could break competition law when sharing their financial information, thus a
qualitative approach, with the focus on the drivers behind the different costs was more
suitable for our study.
More about qualitative research, citation of Denzin and Lincoln (2000):
“Qualitative research is a situated activity that locates the observer in the world. It consists
of a set of interpretive, material practices that make the world visible. These practices
transform the world. They turn the world into a series of representations, including field
notes, interviews, conversations, photographs, recordings, and memos to the self. At this
level, qualitative research involves an interpretive, naturalistic approach to the world. This
means that qualitative researchers study things in their natural settings, attempting to make
sense of, or interpret, phenomena in terms of the meanings people bring to them”
2.2 Data gathering
Primary data vs secondary data
For the purpose of analysis two types of data have been collected, primary- and secondary
data. Secondary data is data that have already been collected for some other purpose.
Secondary data could be published summaries or books. Market reports from shipbrokers
are an example of secondary data used in this study. The main advantage with secondary
data is that you save resources using less time to collect information, while the
disadvantage could be that the data is not collected for the same purpose as your study, and
that you do not have control of the data quality (Saunders, et al., 2009).
Throughout our study we have collected primary data through interviews with several
companies in the offshore shipping industry. The gathering of primary data does normally

22
strengthen the study, because it gives firsthand information and valuable insights. There are
however some disadvantages:
1. The process of gathering enough data is long
2. Access to target persons that are willing to be interviewed is limited
3. Researcher cannot control unforeseen responses/events
4. The data quality depends on the cooperation from the target persons (companies)
For our study we have used interviews to collect primary data.
3 types of interviews
According to Punch 2004 there are three types of interviews that can be conducted in a
research paper:
1. Structured interviews:
These types of questionnaires are usually based on a standardized or identical set of
questions. Saunders et al. 2009 refers to the method as interviewer-administered
questionnaires. Questions in these types of interviews usually have pre-coded answers that
make it easier to analyze the results later on. Structured interviews are often used to collect
quantifiable data.
2. Semi-structured interviews
In semi-structured interviews the researcher uses an interview guide consisting of topics
with related questions. Each interview does not need to be exactly the same and the topics
and questions raised could differ depending on the interview object. The order of questions
may also vary depending on the flow of the conversation. The advantage of semi-structured
interviews is that the researcher allows the interview object to talk more freely. On the
other hand, the structure of the interview guide could lead to topics being undiscovered.
3. Unstructured interviews
Unstructured interviews are the most informal form of interviews and should be conducted
almost like a normal dialog. These types of interviews are used to get in depth information
about a general area, which is of your interest. There is not a predetermined list of
questions in these interviews. Instead the interview object is given the opportunity to speak
freely. The advantage with this type of interview is that the researcher gets all the
information the interview object wants to share, while in more structured interviews the

23
researcher might not manage to ask all the “right” questions. Unstructured interviews could
be challenging to analyze.
Choice of interview type
Structured interviews are normally conducted to collect data that will be used in a
quantitative analysis, while non-structured interviews are used to gather data that will be
analyzed qualitatively. The choice of interview type depends on the purpose of the research
paper. As this master thesis’ main focus is on the cost drivers behind capital and operational
expenditures for OSVs in Norway and Brazil, we have found it most convenient to conduct
semi-structured interviews. This will help us to figure out how the cost-groups differ in the
two regions, what the drivers behind the different cost-groups are and why the cost-level is
different in Brazil compared to Norway. Using semi-structured interviews does not
completely narrow down the responses received from the interview participant, thus
widening the potential findings in the study.
The making of the interview guide
In order to create an appropriate interview guide, that covered the most important issues
within the offshore support industry, we read all the annual reports from the Norwegian
shipowners operating in Brazil, in addition to reports from shipbrokers and banks covering
the offshore support industry. This gave us a good picture of the topics that had to be
discussed. We discussed the interview guide with representatives from both ABRAN and
DOF ASA to ensure that we had covered the most interesting topics. Throughout our thesis,
the interview guide was evaluated and edited after each interview, without changing the
core content. All interviews were based on the same main questions. The interviewee did
not receive the interview guide, it was just used as a starting point for the interview, and
more specific follow up question were asked. The interview guide can be found in the
appendix.
2.3 Power of results In qualitative research reliability and validity is used as a measure of the quality of the
research. The validity of the data explains to which extent the data collection method
accurately measures what they were intended to measure and to which extent research
findings are really about what they intended to explain. The reliability of the data explains to

24
which extent the data collection technique yields consistent findings and if similar
observations and conclusions would be made by other researchers (Punch, 2004).
Validity
There are 2 types of validity in exploratory studies, construct validity and external validity.
Construct validity is whether our empirical data measure what it is supposed to measure
(Yin, 2009). To fulfil this requirement we have used several information sources. We have
read reports from both the offshore shipping companies and shipbrokers, talked with
people from different part of the industry and used relevant theory about the industry. We
have also tried to talk with people with first-hand information about the topic under
investigation, e.g. yards when the topic has been shipbuilding and ship owners when the
topic has been OPEX on OSVs. We have also used a lot of time to gain knowledge about the
offshore shipping industry to be able to conduct accurate interviews.
External validity is whether the results can be generalized. In our study this means whether
the results are valid for other companies within the industry (Yin, 2009). In general it is
difficult to generalize information based on few observations. To maintain the external
validity we have chosen to focus on Norwegian offshore shipping companies present in both
Norway and Brazil, and within this group we have been able to conduct interviews with all
of the players, thus retaining a high external validity.
Reliability
It can be hard to fulfill the reliability requirements in qualitative studies, because the data is
not gathered with the exact same structure. Further, it would be difficult for other
researchers to get the same observation and conclusions due to information being gathered
in different contexts and by researchers with different knowledge and experience. These
factors all lead to a different interpretation of the data (Johannessen et al., 2011). This is
also the case in our research. First of all, since the interviews we conducted were semi-
structured they would not be identical if conducted again. Interviews with different people
would result in different answers, because of different interpretation and opinions.
Secondly, the business environment in the offshore shipping industry is rapidly changing and
the same interview would likely give different results on a later stage. Lastly, our experience
and knowledge influences the way we interpret the information and this interpretation
would likely be different for other researchers.

25
We have tried to maintain the reliability in our research by explaining the goal of our study,
our choice of sample and by attaching the interview guide.
Choice of sample
Sampling means saving work by examining the sample instead of the whole population. The
sample size is the number of participant within a specific study. Increased sample size will,
in general improve the quality of the results (Ghauri og Grønhaug, 2010). Our master thesis
was a result of a project initiated by DOF ASA and ABRAN, where they wanted to compare
the operation of offshore support vessels in Brazil with Norway. The scope was originally
limited to the companies that were members of ABRAN (about 7 offshore shipping
companies), but we have conducted interviews with shipbrokers, shipyards, banks and
insurance companies to increase the sample and to get a different perspective on the OSV-
industry.
The sample of shipowners is however limited to offshore shipping companies owned and
controlled by Norwegians. In Norway, both public companies (on the Stock Exchange) and
fully private companies have been included in the scope. In Brazil, both shipowners having
their own EBN (Brazilian shipping company) and shipowners working through a third party
(a Brazilian company) are part of the study. Interviews have in several cases been conducted
with the same company both in Brazil and in Norway. The interview objects have usually
been top managers (CEO, CFO, COO) within the companies, but sometimes also people at
lower levels in the organization.
In terms of vessels type and vessel flag, the focus has been on companies that have PSVs,
AHTS’ or CSVs, with international, Brazilian or Norwegian flag. This has resulted in a wide
scope, which we believe will give a correct picture of the industry, and how it is to operate
as a Norwegian shipowner in the North Sea and Brazil respectively. We have conducted just
over 20 interviews, had several visits to offshore support vessels and visited shipyards both
in Norway and Brazil.
2.4 Analysis method Qualitative research creates diverse and complex information, and one of the big challenges
is to structure the information for further analysis (Punch, 2004). Data analysis of qualitative
information requires decomposing and organization of the data and presentation of the
26
information with use of figures, tables and discussions (Creswell, 2007). There are a variety
of methods used to analyze qualitative data, and the diversity among the methods implies
that there is no correct way of data analysis (Johannessen et al., 2011).
Four steps of analysis
According to Miles and Huberman (1994) the process of analyzing qualitative data consists
of three processes.
1. Data reduction includes summarizing and simplifying the data collected. The aim of the
process is to make the data easier to handle. This can be done through interview
summaries, coding and categorizing of the data.
2. Data display is a process of displaying the data true matrices, diagrams and graphs.
Qualitative data collection produces hours of audio recorded interviews with additional
notes. This information is usually comprehensive and poorly ordered. Miles and Huberman
(1994) argue that displaying the data with the use of matrices, diagrams and graphs will
make the analysis process easier.
3. Drawing and verifying conclusions is made easier by using data display. In this way you
can make comparison between the data and identify relationships, key themes, patterns
and trends. The conclusions cannot be drawn before all data is gathered and analyzed.
Before drawing the conclusions it is important that the data is verified.
We recorded all of our interviews and took key notes during each one. After each interview,
we listened to the recording and took more comprehensive notes. To make sure that vital
information was not left out, we listened to the audio recordings for a second time while
taking detailed notes. We then grouped the information into categories based on the
interview guide and its topics. This gave us a better overview of what each interview object
had answered.
After this we sorted the answers from the different interview objects based on different
criteria. This gave us a better overview of the interview objects opinion of the different
matters. We compared the answers from all the interviews and tried to find patterns,
trends, similarities and disagreements. After having consolidated and analyzed the findings
we were able to start drawing conclusions and answer our research questions.

27
The numerical information we got during the interviews where gathered in Excel to get an
overview of similarities and differences between the different companies. We used average
numbers to make comparisons between Brazilian and Norwegian vessels. The information is
presented in graphs and diagrams throughout this paper.

28
PART 1: Analysis of the external environment
In this part of our thesis we conduct 3 different analyses. In the first one we elaborate
shortly on the drivers behind the demand for offshore vessels. In the second analysis we
evaluate the attractiveness of the offshore shipping industry, and in the third analysis we
show the differences of operating a company in Brazil compared to Norway.
3 Drivers of demand for offshore support vessels The main task for OSVs is to support oil companies in their operations, thus the demand for
offshore support vessels is dependent on the activity in the oil and gas sector. The OSVs
support the oil companies at different stages in the life-cycle of oilfields, as shown in the
illustration underneath.
Figure 3: Offshore Support services along the life-cycle of an oil field
(Yeo & Øy, 2010)
The exploration and production (E&P) activity can be a good overall indicator of the demand
for offshore support vessel. But as explained under the chapter “types of vessels”, PSVs,
AHTS and CSV have different purposes, which means that each segment has different
drivers of demand.
The exploration and production activity is driven, to a large extent, by the oil price. As seen
lately (October 2014) in the Norwegian newspapers, analysts and experts on the oil and gas
industry are afraid that the investment level on the Norwegian continental shelf will
decrease substantially if the oil price decrease to a level lower than $80, showing how the
E&P activities is correlated with oil price (E24, 2014). The current oil price is $65, and most
companies in the oil and gas industry are expecting a challenging time going forward. We
Exploration
Development
Production
Decommissioning
Offshore Support Vessels provide services during the whole life cycle

29
will now briefly explain the drivers behind the demand for the three different types of
offshore vessels.
3.1.1 PSV
PSV vessels mainly do three types of jobs. 50-60 % of the demand is related to production
support, both for fixed and floating units, 30-40% of the demand come from rig support and
around 10% of the demand is related to construction support. This means that the demand
for PSV vessels is mostly influenced by the numbers of fields in production. Offshore
production is long lasting processes and it will be a constant demand for PSV vessels even
though the E&P spending decline. PSV vessels supporting drilling rigs are exposed to a
bigger change in demand as the drilling activity is influenced by the oil price. The
construction support demand also varies with the oil price and the market situation. Oil
companies do more maintenance on subsea equipment and installation of new equipment
when the oil price is high and they have good cash flows, which will lead to a higher demand
for construction support during good times.
The future demand for PSVs is difficult to anticipate, because it is hard to know what the oil
companies will do regarding exploration of new fields. If the oil price is low the oil
companies tend to delay projects and it is therefore difficult to know when projects will
start. Even though most of the PSVs are operating for producing units, a decreasing activity
in the exploration of new fields will lead to a lover demand for PSVs. However, today’s rigs
are bigger, they drill at deeper water and use more fuel due to DP3 systems, all leading to
an increasing demand for PSV vessels. The supply of PSVs on the other side is huge. At the
moment, the order book is 40% of the existing fleet. The huge supply of new vessels will
cover any increasing demand from the oil companies; therefore the dayrates for PSVs are
predicted to remain low going forward (DNB Markets, 2014).
3.1.2 AHTS
The main task for anchor handlers is to tow rigs from one oilfield to another, pre-lay anchors
and anchor rigs and other offshore installations, like floating production units (FPU), to the
seabed. As a result, the demand of AHTS is mainly driven by the rig activity offshore. The
offshore drilling fleet has grown significantly over the past decade and is expected to grow
by 10% in 2015e and 6% in 2016e (DNB Markets, 2014). A good indicator of the balance in
the AHTS market is the amount of AHTS/rig or FPU, that is the number of AHTS per working

30
rig or FPU. If this relationship (fraction) remains constant, the work for AHTS should remain
quite stable. The last decade, the number of AHTS per rig has increased. Because many new
projects are in deeper water with harsh environments, larger rigs are required, which in turn
increases the demand for large vessels. The fact that new rigs are built with dynamic
positioning systems somewhat reduce this increase in demand. In terms of the market going
forward, we believe that the rates and utilization will remain the same as today’s level, as
the growth in the number of AHTS is about 6%, while the growth in number of rigs is 10%
(DNB Markets, 2014). This stable outlook could however change if the oil companies
continue to decrease their investment activities as a result of a persistent low (decreasing)
oil price.
3.1.3 CSV
The construction vessels do a variety of different tasks, but the biggest driver for the CSV
demand is the number of subsea trees being installed and the meters of cables (pipes) being
laid. With increased number of deep-water fields, subsea constructions are more and more
common. These leads to an increased demand for CSVs because new subsea constructions
need to be installed and old constructions need maintenance. Anticipating the demand for
CSVs in a longer run is difficult because of the uncertainty related to when the oil companies
will start their projects. The number of subsea trees ordered will drop by 12% to around 500
subsea trees in 2014 compared to 2013, but it will be a quick rebound in 2015 with more
than 600 subsea trees ordered. The rates and utilization are predicted to remain on the
same level as they are today.
3.1.4 Overall outlook
The outlook for all three types of vessels look stable and the rates will remain on the same
level as today. We could however see a decrease in dayrates if the fall in oil price continues.
The AHTS segment is the segment mostly influenced by the E&P spending, and thus the oil
price. A persistent low oil price can therefore lead to lower rates for AHTS. The PSVs and
CSVs rates are not that strongly influenced by the oil price in the short run, as many of these
vessels are needed on already started long term projects. In the longer run however, a
decline in E&P spending will influence the rates negatively for these vessels as well, as
future projects can be delayed or cancelled.

31
4 Strategic Profitability Analysis Porter’s Five Forces approach considers how the company’s performance depends on
conditions within the given industry (Peng, 2009). According to Porter (2008), the industry
structure, manifested in the five competitive forces, sets industry profitability in the
medium and long run. Understanding the competitive forces, and their underlying causes,
reveals the roots of an industry’s current profitability while providing a framework for
anticipating and influencing competition (and profitability) over time (Porter, 2008). To
determine the attractiveness of an industry, not only the competition among the industry
rivals is taken into account, but also the threat of new entrants, the threat of substitutes,
supplier power and customer power.
We will in this section describe the characteristics of the OSV-industry in Brazil and Norway,
using the five forces framework. By understanding the competitive situation in the industry
and how the different players affect the industry profitability, it becomes easier for
companies to figure out what measures they can take to succeed. The five forces framework
is also helpful in understanding the drivers behind OPEX and CAPEX in Brazil and Norway.
4.1 Rivalry among competitors The intensity of the competition within the industry is determined by the degree of rivalry
among existing companies. In industries with intense rivalry it is harder for a company to
achieve a substantial profit margin. The following factors drive the competition in the OSV
industry:
1. Growth in the industry
2. Exit barriers
3. Absence of strong market leaders
4. Differentiation
Industry growth
Low growth in the industry will increase the rivalry among existing companies, because they
would try to capture market shares from each other. The OSV industry has grown rapidly
the last 30 years due to high activity in the oil and gas industry, driven by an increasing oil
price. Lately the growth in Norway has declined and the fight for market shares has
increased. The reduction in the fleet (AHTS, PSV) is shown in the graphic underneath. The

32
development of Johan Sverdrup should however lead to an increased demand for OSVs
(Statoil, 2014).
Figure 4: Overview of the North Sea supply fleet 2007-2014 (Term, Spot, Available and Yard/Lay-Up)
(RS Platou, 2014)
In Brazil the demand for OSVs is driven by Petrobras’ activity, which has currently slowed
down due to internal problems and political issues. The government has decided that
Petrobras needs to be the sole operator on all the Pre-salt fields, which has delayed
exploration and development. Because Brazil is not yet oil self-sufficient, Petrobras has
experienced liquidity problems because they have had to buy oil on the international
market and sell it at a lower price in Brazil, so that the government manages to keep the
fuel prices low. Despite these problems Petrobras says that they will double the production
of oil by 2020 and this will create a demand of 200 new OSVs. The growth is therefore
anticipated to be large in Brazil.
In good times, when growth forecasts are positive, shipowners tend to order vessels to
increase their market share. When competitors see that one shipowner is trying to capture
market shares, they often start ordering new vessels to secure their own position. This
eventually leads to an oversupply of vessels, which in turn decreases that rate and the
companies’ profitability. Thus, the growth in the industry does not necessarily lead to higher
profits for the shipowning companies due to the fight for market share.
Exit barriers
High exit barriers increase the competition, because it becomes difficult for companies to
leave the industry. The OSV industry has quite low exit barriers because it exists a quite

33
liquid market for sale and purchase of vessels. Due to the cyclical fluctuations in the OSV
market the vessels prices vary, it is therefore not given that you are able to get a good
enough price for your vessel when you want to exit the market.
Brazilian built vessels are less tradable than international built vessels because of their high
building cost. It can therefore be more difficult to exit the Brazilian market, which again can
lead to increased competition in this market.
Concentration among competitors
A low concentration among competitors will lead to increased rivalry because no one is able
to control the market. The total fleet of OSV vessels consists of approximately 1400 PSVs,
1400 AHTS and 700 CSVs. The market share of the 10 biggest companies is around 30% in all
the three segments. This means that the OSV industry is very fragmented, which imply a
high degree of competition.
The concentration varies in different geographical regions. In the Norwegian and Brazilian
market there is no sole dominant player in any segment. The absence of an industry leader
makes it difficult for any company to lobby for industry interest. This is partly solved with
companies forming alliances like ABEAM and ABRAN in Brazil, and NSA in Norway.
Differentiation
The services offered by the different OSV companies are very similar. The differentiation is
low, especially within the PSV market. As long as a vessel meets the technical requirements
in a tender, the price offered to the charterer is without doubt the most important factor
deciding who will win the contract. However, fuel consumption, safety records and previous
performances also impact the decision. In Brazil, Petrobras have an excellence program that
rewards companies with good safety records, commitment to doing business in Brazil and
good previous achievements. Companies with good rankings in this program receive better
rates than other companies. In Norway, Statoil has similar audit programs where they rank
their suppliers based on similar type of criteria. Companies try to differentiate themself
through minor measure. Solstad offshore has for example started a “green operation”
program where they save fuel on their vessels, and thereby decrease the total cost for the
charterer. This could give them a benefit in a tendering process.

34
Within the more advanced vessel segments the vessels are more customized for special
geographical areas and operations, and therefore somewhat easier to differentiate from
other players.
Overall, we consider the rivalry among companies in the OSV market to be medium to high.
The market is very fragmented, and it is difficult to differentiate from others. The growth in
the market do to some extent compensate for these factors.
4.2 Threats of substitutes A substitute, according to Porter (2008), is a product which performs the same or similar
function as an industry’s product, only by different means. Substitutes represent a threat to
the established company if there is high enough incentive for customers to switch. This
usually occurs if:
● Substitutes have superior quality than existing products.
● Substitute products have sufficient price-performance trade-off
● Buyers face low switching cost.
Historically, the OSV industry has not had any immediate substitutes threatening the
operation of offshore support vessels. This has however changed during the last years, as
more and more deep-water rigs have been equipped with dynamic positioning (DP) systems.
DP systems are used to position vessels/rigs in the correct place in relation to the seabed
and have made it possible for rigs to move from one oil field to another by it self. Originally,
rigs have been moved using AHTS, and they still are today. But with the new rigs having
their own DP systems, they are able to maneuver the rig without help from an AHTS, thus
the rig itself could be a substitute for the AHTS.
The DP systems are a bigger substitute to AHTS in Brazil. For the DP system to work the
water depth need to be more than 1000 meter. Only a few places in the North Sea have
such water depths, while it is more common in Brazil. Using the DP system to move the rig
or keep the rig in position is in some cases not profitable because of the large consumption
of fuel. If a rig is meant to drill at specific location for a long time, it is usually better that it
uses anchors instead of its own DP system to stay in position.

35
For PSVs, there are not any substitutes. The rigs will always need supplies for their
operations offshore and the PSVs are the cheapest mode of transport as of today.
Some of the CSVs’ operations, like installing subsea trees could also be done by rigs, but it is
cheaper for the oil companies to use a CSV, the rigs are not a real substitute.
In conclusion, the threat from substitutes are present to a certain degree for AHTS, but
inexistent for PSV and CSV.
4.3 Threats from new entrants New entrants in an industry increases the supply, and their desire to gain market share puts
pressure on the existing players, which may result in price wars and cost pressure. Especially
large multinational companies adding a new country to their portfolio can easily leverage
developed resources and therefore increase the rivalry and add new know-how which might
reduce the profit of existing companies (Peng, 2009). The threat of new entrants is defined
by the entry barriers in the industry, including:
● Economies of scale and scope
● Capex requirements (Sunk cost)
● Knowledge/experience
● First mover advantage
● Regulation restriction
● Access to distribution channels
● High exit cost for current players
● High fixed costs and existing players’ ability to cut prices to keep up volume
● High switching cost for customers
We have observed that the Economies of scale/scope, CAPEX requirement, the knowledge
and experience and the regulation restrictions are the most important factors defining the
threat of new entrants.
Economies of Scale/Scope
Having several vessels is an advantage for the shipowners because they can divide the
administration cost like accounting, vessel management, etc. on several vessels. Have a
bucket of crew and a bucket of vessels (a fleet) is easing the operation, because of the
possibility to move crew from one place to another when needed.

36
A wide range of vessels could also be an advantage for shipowners because it makes it
possible for them to provide a full range of services to the oil companies. When the oil
companies have good experience using a company’s PSV, it is easier to use the same
company’s AHTS, rather than screening the market for a new supplier. However, in practice
we see that companies do not get any advantages for providing a full range of services.
CAPEX requirement
The shipping industry is a capital-intensive industry where investments in expensive vessels
are necessary in order to operate. A new PSV could cost around 55 M $ in Norway and as
much as 75 M $ in Brazil. As long as the investments are profitable it should not be a
problem to get funding in an efficient capital market, but due to the risk related to the
investment, not everyone can start an offshore shipping company tomorrow. The fact that
the shipping industry is a cyclical industry makes it more risky, thus harder to raise capital.
The high capital investment is a large barrier for potential new entrants.
For companies that are already established in one region (country) with a large fleet,
wanting to enter into new regions, raising capital is easier. These companies often have
financial muscles, and they can leverage their already existing resources. This means that
there will always be a high threat of new entrants from existing players that are located in
other regions.
Knowledge and Experience
The complexity of the operation conducted by offshore support vessels varies from the PSV
segment to the CSV segment. PSV-operations are pretty simple, as one are only supplying
the oil rigs with different type of goods. PSVs could be seen as the truck of the sea, and are
by the oil-companies often looked at as a commodity (standardized product). AHTS perform
more complex operations like anchor handling and towing, thus requiring more specialized
knowledge. The CSV segment is even more complex, different knowledge is required on a
diving support vessel than on a pipe lay support vessel.
The knowledge and experience needed to be able to operate these vessels in a safe and
efficient way is a large entry barrier for investors that want to start a greenfield operation.
Several investors, especially private equity firms have been attracted by high margins in the
shipping industry during good times, and have invested a lot of money, especially in PSVs,

37
because of its “simple” operation. The knowledge barrier can be avoided by being a
“tonnage provider”, meaning that you purchase the vessel, before renting it out to another
shipowner who operates it for you.
Nevertheless, to be able to establish a shipowning company, that not only will own the
vessels but operate them as well, knowledge and experience is essential.
Regulation restrictions
Even though the Brazilian market has seen companies entering after the Pre-Salt discoveries
in 2007, there are several regulations making it hard for foreigners to establish a company in
Brazil. First of all, to be able to operate as a shipping company and enter into contracts with
oil companies in Brazil the shipowner must have an EBN, explained later in chapter 6.2.1.
Secondly, a certain % of Brazilian crew is required depending on how long your vessel
operate in Brazilian waters (according to RN72). In addition, there are environmental
regulations that need to be followed and several other requirements from Petrobras. These
regulations make it a challenge to enter into the Brazilian market.
In the North Sea there are not many entry barriers. Everyone can enter the market
regardless of the flag the vessel is flying and the nationality of the crew. If the vessel is going
to operate on NCS most of the charterers do require the crew to speak a Scandinavian
language. The charterers in the Norway also requires vessels with high redundancy and high
technical standards, often with special equipment like fire fighting and oil spill recovery
systems, making it harder to enter this region.
In summary, the threat of new entrants is higher in the less complicated PSV-segment,
where the capital investment and the knowledge requirements are lower, while it is lower in
the AHTS and CSV segment. Regulations are reducing the threat of entrants in Brazil. Overall
the threat from new entrants is high.
4.4 Bargaining power of suppliers High bargaining power of suppliers allows them to get better deals, which decreases the
profit margin of the counterparty or makes the operations of the latter harder because of
dependence on the supplier (Peng, 2009). Porter (2008) provides several drivers of high
supplier power:

38
Supplier concentration is higher than that of supplied industry
Supplier’s ability to serve several industries with equal importance for the sales
High switching costs in supplied industry and low switching costs for the supplier
Ability of suppliers to integrate forward
Lack of substitutes
In the following section we focus on how the supplier concentration leads to power over the
shipowners, and how the power relationship is affected by the market situation. We have
not focused on other drivers that could lead to high supplier power. It is however worth
mentioning that several shipyards are able to supply more than one industry, which could
make them less dependent on the OSV industry. As an example, Vard Niteroi is producing oil
tankers for Petrobras in addition to the AHTS and PSV they produce for the OSV companies.
The most important suppliers for the shipowners are labor force, that is the crew needed
onboard of the vessels, and the shipyards, both shipyards building ships and the shipyards
providing dry-dock facilities.
Concentration in the industry of suppliers
The supplier concentration varies depending on which region the shipowner is operating in.
In the North Sea, there are many reliable shipyards and dry-dock facilities leading to a low
concentration among the suppliers and good balance between supply and demand. In Brazil
however, there are only a few commercial shipyards that are able to produce high-end,
medium to large-sized offshore support vessels, thus it becomes easier for the shipyards to
gain market power and charge premium prices.
There are about 10 shipyards building OSVs in Brazil, where the four main ones are Vard and
Alianca in Rio de Janeiro, Navship in Santa Catarina, and Wilson Sons in Sao Paulo. The
problem is however that many of these shipyards are owned by shipowners that only
(mainly) build for their own use. Navship is building for the American company Edison
Chouest, while Alianca and Wilson Sons are building ships for the Brazilian companies CBO
and Wilson Sons respectively. This means that the only commercial yard that is able to build
medium and large vessels with international standards is Vard Niteroi/Vard Promar. There
are other shipyards that are able to build AHTS, like Keppel Singmarine and Mac Laren, but
they are however more focused on offshore equipment and semi-submersible platforms.

39
Thus, the concentration of shipyards within the offshore support industry is quite high in
Brazil, giving them some power over the shipowners (Banco Itau, 2014).
In terms of docking-slots in Brazil, the supply is even worse than for the shipyards. There are
only 2-4 docs that could be used for medium to large support vessels in the Rio de Janeiro
area, Renave, Maua and Dockshore (floating dock) located in Niteroi, being the most reliable
ones. All the shipowners that we have talked to in Rio emphasize that there is a lack of good
dry-docks, which causes a huge imbalance between the supply and the demand.
When it comes to the labor force, the marine and offshore crew has had high bargaining
power in many parts of the world the last years, especially in Brazil. Brazil has had a lack of
qualified, well-educated workers, leading to high salaries and competition among the
shipowners and rigs to get the best seafarers. In Norway the supply of qualified crew has
been much better than in Brazil. The Norwegian companies are able to recruit the people
they need without problems.
Market situation - Demand from Shipowners
Higher supplier concentration than that of the supplied industry is an important driver of a
suppliers’ power. Nevertheless, the suppliers’ power depends on the market situation
(where in the cycle the OSV-industry is at a specific time). During good times, every
shipowner wants to build vessels because the day rates are high, thus the shipyards can
charge a higher price. But during a downtime in the cycle the demand is lower, and
shipyards are willing to build ships at lower prices, not even covering all their costs. In good
times, not all shipyards will take whatever price they want, they are careful not to exploit
their power to much, as it could potentially destroy a good relationships with the
shipowner. High prices would also increase the attractiveness of the shipyard industry, and
could lead to entrance of new players, which would lead to more competition and lower
prices.
In summary, the market power of the suppliers is higher in Brazil than in Norway, and is
mainly driven by the lack of commercial shipyards and dry-docks, in addition to the lack of
qualified professional workers. Viewed in isolation, this leads to a high supplier power,
especially in Brazil, but because the suppliers’ power is dependent on the market situation
in the OSV industry the power relationship can vary over time.

40
4.5 Bargaining power of buyers Buyers with high bargaining power can have a negative influence on the markets
profitability. Buyers can reduce industry profitability by demanding better or more services
for the same price, by demanding lower prices or by inducing price wars between service
vendors. The most important factors that can indicate high bargaining power in the OSV
industry are:
1. Few and large buyers with large volumes of purchases
2. Price sensitivity and switching cost
3. Information availability
Buyer concentration
The concentration of buyers is high within the OSV industry, especially in the Brazilian
market where Petrobras is operating between 80 and 90% of the oilfields. This gives them
huge power when bargaining with the OSV companies who have a much lower
concentration. One single OSV company has little possibility to put pressure on Petrobras
because Petrobras have so many other alternatives, and is such an important customer for
all the players in the industry. To be able to do business in the Brazilian market the OSV
companies have to follow Petrobras’ rules. Other big oil companies like Shell, Exxon Mobile,
Statoil and Chevron have only minor market shares in Brazil.
In the North Sea the market concentration among the oil companies is lower than in Brazil.
On the NCS the largest player, Statoil, have about 70% (Store Norske Leksikon, 2014) market
share. On the British continental shelf however the market is fragmented, with no dominant
player. This means that Statoil does not have a dominant position in the North Sea. Thus,
the OSV companies have several alternative customers to whom they may charter their
vessels. However, the concentration among OSV companies is even smaller than that of the
oil companies. In the end, the buyers have more power, at least under normal market
conditions.
Price sensitivity and switching cost
The cost for oil companies related to services done by OSVs are low compared with the total
cost of their projects. The rigs can have dayrates around 500’ USD per day, while the day
rates for OSVs normally are between 30’ and 100’ USD per day. The cost of OSV services

41
represent as little as 6% of the oil companies’ total cost. Because of this the price sensitivity
towards the OSV companies is low. If they need an OSV to proceed with a project they will
pay a high price if that is necessary. In Norway, where a large part of the market is based on
spot contracts, this can lead to very high day rates when there is a shortage of vessels. In
Brazil, the market is mainly based on long term contracts, and it is therefore not common
for oil companies to suddenly need a vessel. On the other hand this leads to an oversupply
of vessels for the charterers in low activity periods.
Most OSVs are standardized and vessels from different companies can do the same tasks.
The PSV segment is the most standardized; PSVs can almost be seen as a commodity.
Because of this the switching cost for the oil companies is low. This puts pressure on the
prices when several vessels are available. More specialized vessels, like large AHTS and CSVs,
are less standardized. The switching costs become higher, because it is more difficult to find
another vessel that can perform the same work.
Even though the OSVs are crucial for the oil companies operations, it has historically not
been in their interest to build their own vessels. Lately several oil companies have due to
increased costs decided to build their own rigs, but they have not yet started to build their
own OSVs, at least not to a big extent. This can be because of the unique skills needed to
operate the most advanced OSV, and because there has been no super profit2 within the
less specialized vessels.
Information availability
Shipbrokers all over the world have constant information about the available vessels, and
what day rates the chartered vessels receive. This is information the customer can get hold
of by talking to the shipbrokers. The oil companies know which rates they can expect for
different vessels and can push the prices down if they know that more vessels are available.
The shipowners also have access to the shipbrokers’ information, and they use this to bid
below each other.
To summarize, we consider the bargaining power of buyers in the Brazilian market to be
high, mostly because one player have a huge market share. In the North Sea, there are more
buyers and none of them have the same market share as Petrobras, thus we conclude that 2 Based on financial statments from annual reports. (Deep Sea Supply, 2014, DOF ASA, 2014a, Havila Shipping, 2014, Olympic Shipping, 2014, Siem Offshore, 2014, Solstad ASA , 2014, K-Line Offshore, 2014)

42
the bargaining power of buyers in the North Sea is medium to high. Overall the bargaining
power of buyers is medium to high.
4.6 Summary The offshore shipping industry in Norway and Brazil is characterized by high competition
among the players; this is to some extent reduced because of growth in the industry. The
threat from new entrants is high, even though there are some entry barriers, especially in
Brazil. The threats from substitutes have historically been non-existing, but rigs with new DP
systems can pose a threat for the AHTS segment. The bargaining power of suppliers is high
in Brazil because of low concentration among suppliers. In the North Sea the bargaining
power of suppliers is lower due to a more developed supplier market. The bargaining power
of buyers is high in both markets, because the concentration among OSV companies is low
compared to the concentration among buyers. Ove all, based on Porter's framework, the
offshore support vessel industry does not look very attractive. But several of the factors are
related to cycles within the industry, and the framework does not give an accurate picture
of the profitability in the industry. A further growth in the industry will for example lead to
higher attractiveness.
5 Country analysis - Norway and Brazil The CAGE framework is developed by Pankaj Ghemawat (2007) and emphasizes to illustrate
the differences between a target country and a home country. The framework helps making
distances visible for managers and could be used to assess whether it is a good strategic fit
for a company to enter into the target country. The framework is divided into differences in
cultural-, administrative-, geographic-, and economic distance. Greater differences are
usually associated with greater costs (Carpenter & Sanjyot, 2012).
We will in this section focus on the differences between Norway (home country) and Brazil
(target country). We will use the framework to illustrate the differences between the
countries, and highlight the most important factors Norwegian companies need to consider
before entering the Brazilian market.

43
5.1 Cultural distance Cultural distance includes differences in language, norms, values, trustworthiness and
religion. Some of the factors like language and religion are easy to observe, but differences
in norms and values are harder to identify. Hofstede's (2001) 5 dimensions of culture can be
helpful to understand the cultural differences between Norway and Brazil. We will also
base some of our statements about cultural differences on information we got through the
interviews.
The most obvious cultural difference between Norway and Brazil is the language difference.
In Norway, Norwegian is used both in the daily life and in the business environment, while
Portuguese is the dominant language in Brazil. In both countries English is the second
language and could be a way to communicate, but in many situations the English level
among Brazilians is not high enough for this to be possible (EF, 2014).
Differences in norms and values and lack of trust are harder to identify. If we look at
Hofstede’s (2001) study we see that the power distance is higher in Brazil. This means that
Brazilians are more acceptant of strict hierarchy and they do as they are told, even though
they do not agree with the decision. This is important for leaders to understand when
working with Brazilians. On the dimension masculinity Brazilians have a much higher score,
meaning that they appreciate achievements and material rewards more than in Norway. An
example is that Brazilians tend to switch jobs if they get marginally higher salaries. Another
cultural difference several interview objects point out is that many Brazilians often try to
find the easiest way to solve a task. In shipbuilding and ship repair accuracy is important,
and what seems to be the easiest solution at the time can lead to problems and increased
work in the future. The differences pointed out by Hofstede are shown in the graphic
underneath.

44
Figure 5: Hofstede(2001) dimensions - Power distance and masculinity
(Hofstede, 2001)
5.2 Administrative distance The administrative distance consists of differences in laws, government policies, currencies,
or trade activities. Especially in industries that are considered vital for a country,
government intervention may be a crucial factor (Carpenter & Sanjyot, 2013). Differences in
bureaucracy and corruption can increase the cost of operating in a foreign country.
Administrative distances can be measured by indices such as “Doing business” created by
the World Bank, indicating administrative barriers in several countries.
The administrative distance in Brazil is substantial compared to Norway. Looking at the
“doing business index”, Brazil ranked 120 out of 189 countries, while Norway was ranked
number 6 (The World Bank, 2013a). As seen in the table underneath, Brazil ranks worse
than Norway in all aspects. The complexity of the tax system is especially challenging for
shipowners expanding their operation to Brazil. For a mid-sized Brazilian firm, it takes 2,600
hours to prepare the annual tax return; almost ten times the global average (The Economist,
2013a). Several representatives from the shipowning companies we interviewed
emphasized the complexity of the tax systems. Even the Brazilians do not understand it.
Brazil ranks 123 (Norway 24) on “trading across borders”. This reflects a big issue for
Norwegian shipowners in Brazil. Brazil is a protectionist country, and has high import taxes
to protect their own industry. Because of a low presence of European and Norwegian
suppliers in Brazil, the shipowners are forced to import a lot of spare parts and equipment
for vessels, driving up the costs. Furthermore, Brazil is still regarded as a corrupt country,
ranking 72 (Norway 7) out of 177 areas and economies (Transparency International, 2013).

45
The table underneath summarizes some of the rankings provided by Transparency
International.
Table 3: The World Bank rankings - ease of doing business in Norway and Brazil
Economy
Starting a
business
Dealing with
Construction
Permits
Registering
Property
Paying
taxes
Trading
Across
Borders
Enforcing
Contracts
Brazil 167 174 138 177 123 118
Norway 22 27 5 15 24 8
(The World Bank, 2013a)
All the rankings mentioned show that there is a big administrative distance between Norway
and Brazil. Offshore Shipping companies must expect higher costs related to dealing with
these challenges. The administrative staff in offshore shipping companies in Brazil will
definitely be larger than in Norway, driven mainly by more work related to tax issues and
paperwork requirement from the main charterer. The oil industry is important for the
Brazilian economy, thus the government has taken actions in order to protect and favor
local workforce and industry. The industry will likely have more interventions from the
government in the future. Petrobras, the main charterer of vessels in Brazil is controlled by
the Brazilian government, making it easy for politicians to intervene in the oil and gas
industry.
5.3 Geographical distance The geographical distance is defined as physical distance, difference in size and climate,
absence of country borders and time zones. Geographical distances can make business
more difficult as well as more costly. A typical example is travel costs associated with
meetings. Another major challenge is cooperation and communication between the office in
Brazil and the office in Norway, because of differences in time zones.
The physical distance between Norway and Brazil is considerable; it is more than 10 000 km
between the two countries and the travel time is on average 20 hours. This makes it difficult
for people to commute between the two countries, and it is therefore hard to have direct
control of the business in Brazil from Norway. Norway and Brazil are in different time zones,
with Brazil being 5 hours behind Norway for most of the year. This means that the work day

46
in Norway ends before lunch in Brazil, and cooperation between the two countries must be
done in the morning Brazilian time.
For offshore shipping companies the possibility to move your vessels from one region to
another is important because this makes it possible to take advantage of good times in
specific regions. However, the sailing time from Norway to Brazil is about 1 month, which
means that vessels operating in Brazil are not easily moved to Norway.
5.4 Economic distance The most important differences between Norway and Brazil that could create challenges for
the Norwegian shipowners are the differences in cost or quality of information and
knowledge, human resources and infrastructure.
Brazil, as opposed to Norway, has had a rapidly growing economy with a GDP growth above
the world average since 2005, though with a decline in the years subsequent the financial
crisis. While Norway is considered a well-developed country, Brazil is still considered to be
an emerging market.
The most obvious source of economic distance in Brazil is related to human resources and
knowledge. Brazil has over the last years had a lack of professional workers and seafarers,
making it tough and expensive for the shipowners to recruit the right people for the jobs,
both on the vessels and onshore. In terms of infrastructure in Brazil, this was ranked 114th
out of 148 countries by World Economic Forum (The Economist, 2013b). The naval
infrastructure is insufficient, there is a big lack of dry-docks for the offshore vessels, and
some ports in Macae3 are not deep enough for the largest vessels, forcing them to sail to Rio
to change crew.
However, the outlook for the oil and gas industry in Brazil is looking good. Petrobras
forecasts a doubling of the production (activity) in Brazil within 2020, which should create a
huge demand for offshore support vessels (ABRAN FGV Seminar, 2014).
3 Macae is a port North of Rio de Janeiro. Convenient to use for crew change because of its location.
47
5.5 Summary There are several major differences between Norway and Brazil. The cultural differences are
considerable, both because of different languages and several differences in norms and
values. Big administrative differences related to dealing with tax issues and government
regulations are important to acknowledge. The geographical distance between Norway and
Brazil is also big, mostly because of the physical distance, but also the time zone difference
plays an important role. The most important differences for offshore shipping companies
are related to economical differences. The lack of skilled workforce has been (and still is to a
certain extent) large in Brazil, and inefficient infrastructure is causing logistical issues along
the value chain. In order to succeed when entering Brazil, Norwegian shipowners have to
keep these factors in mind.

48
Part 2: Analysis of company specific factors
In this part we will analyze the drivers behind the operational and capital expenditures
related to operation of OSVs in Norway and Brazil. We start by analyzing the OPEX followed
by the CAPEX, with Norway as benchmark in both cases. Thereafter, a brief presentation of
tax regimes and issues related to foreign currency is presented. We end this part with an
investment case where we compare two scenarios, building and operating an AHTS in Brazil
or building and operating an AHTS in Norway.
Throughout our interviews with the shipowners the main focus has been on the operational
expenditures and the capital expenditures related to OSV-operations. We have had less
focus on costs related to tax and currency even though these topics have been discussed.
The reason why we have had this approach is because we believed it would be easier, both
for us and the interview objects, to talk about the costs related to the operation of the
vessels, and that we would receive more interesting information.
In the section about OPEX, our main focus has been on the costs directly related to the
operation of the vessels. This comprises costs related to crewing, technical, insurance,
breakdown, inspection, bunkers, port fees and pilot fees. Costs related to the management
of the vessels and its crew, and administration costs related to other support functions
onshore like HR, procurement, legal, accounting, etc. have not been prioritized. The reason
for this choice is mainly that we do not have the capacity to cover everything, but also the
complexity in relating these costs to specific vessels.
In the section about CAPEX, the main focus has been on costs related to building vessels and
periodic maintenance (docking) of the vessels.
6 OPEX In the following chapter we will discuss in detail the different drivers of the operational
expenditure (OPEX) for OSVs in Brazil and Norway (The North Sea). The North Sea is the

49
benchmark and will be presented first. If nothing else is stated, the analysis is based on
information from interviews.
We have divided the OPEX into several groups; crew, technical, insurance, breakdown,
bunkers and lube oil, port and pilot fess, inspection and other. We will discuss the different
cost groups and the associated cost drivers separately, starting with the most important
first. The graph on the left shows a breakdown of the OPEX for an OSV vessel. These are
average numbers based on the interviews we have conducted, and vary from shipowner to
shipowner. They do however give a good picture of the main cost group. The graph on the
right shows the average total OPEX for vessels operating in Brazil, Norway and UK for
different vessel segments (PSV, AHTS, CSV).
Figure 6: Average breakdown of OPEX for supply vessels in the North Sea and Brazil
Figure 7: Average daily OPEX (1000 USD) for PSV, AHTS and CSV
6.1 OPEX - Norway The North Sea is mainly divided into 2 regions, the UK side (British continental shelf) and the
Norwegian side (Norwegian continental shelf). We will refer to the two regions as UK and
NCS. The North Sea is the most developed offshore region in the world; everything is set for
the shipowners to engage their business effectively. There are no specific challenges that
lead to a higher OPEX in the North Sea compared to other regions; it’s rather the price and
prosperity level in Western Europe that drives the operational costs. The OPEX is about 20%
higher in Norway compared to UK, which is exclusively due to difference in crew cost. The
higher crew cost arises because vessels on the NCS fly the NOR-flag and follow Norwegian
wage-tariffs.
«Other» consisting of: Inspection
Port and pilot fee Lube oil

50
We will in the following section go into detail on the different operational costs in the North
Sea and the key drivers behind the costs. As one can see in the breakdown of OPEX graphic
above, the crew cost and the technical cost are the 2 most important costs; this is true both
for the North Sea and Brazil. These costs are always covered by the shipowner himself.
Insurance, breakdown and inspection costs are also covered by the shipowner, but
represent a much smaller part of the total OPEX. Bunkers, lube oil4, port and pilot fees is
covered by the charterer when the vessel is on a contract (Norwegian Shipowners’
Association, 2014).
6.1.1 Crew
The crew cost accounts for 65-70% of the OPEX on OSVs working in the North Sea. With
crew cost we include wages, cost related to training of crew, travel expenses, different types
of social costs as well as food. The main drivers of the crew costs in Norway and UK are
wage tariffs which is driven by the choice of flag, the number of people onboard the vessels
and the shift system. Social benefits, inflation and the supply of professional workers also
have an effect on the crew cost, but not in an extraordinary way.
Cost drivers
Flag regimes and wage tariffs
There is no flag requirement from the Norwegian government when operating on the NCS.
Shipowners could use Norwegian (NOR) flag, Norwegian International Ship Register (NIS)
flag or any international (INT) flag. The advantage with NIS/INT is that you do not have to
follow Norwegian wage tariffs, but the disadvantage is that you are not under the net wage
regime in Norway, and with NIS flag you cannot operate between two Norwegian ports.
Most clients on the NCS require Scandinavian speaking crew, thus most shipowners have
NOR-flagged vessels. Flying NOR-flagged vessels makes it easier to recruit Scandinavians.
Statoil, who has more than 70% market share on the NCS has a Scandinavian language
requirement. They will choose a NOR-flagged vessel over an INT-flagged vessel if they can.
The reason for this is that Statoil want to eliminate any risks related to communication
problems between the rigs and the vessels, ensuring a safe operation. Thus, all shipowners
emphasize that they need NOR-flag when operating on the NCS, especially for PSVs and
AHTS. For vessels in the spot market and for CSVs working on shorter contracts (projects)
4 Lube oil could an expense covered by the shipowner as well.

51
there are exceptions, these often have international flags. At the end of the day, the oil
companies in Norway will actually take whatever tonnage is available in the market if they
really need a vessel, even if that means chartering an international vessel. There are
currently 200 vessels with NOR-flag in the North Sea and about 310 vessels with NIS or INT-
flag. Most of the vessels without NOR-flag are working on the UK-side of the North Sea.
The NOR-flagged vessels must follow Norwegian wage tariffs, which are higher than the
comparable tariffs in UK. Comparing two sister vessels (PSVs), operating in UK would cost
around 50-55 thousand NOK per day, while operating in Norway costs around 70-75
thousand NOK per day. The difference of 15-20 NOK is exclusively related to differences in
crew costs. The high wage tariffs are the main driver of the crew cost in Norway.
The crew salary level does not change substantially from one vessel segment to another, but
the salaries are a little higher on more advanced and complex vessels. Nor is there a big
difference between high ranked officers and low ranked officers. A captain normally earns
from 800 000 to 1 million NOK, while a newly educated able seaman earn around 500 000
NOK. This is different from Brazil where the salary level change quite substantially from one
segment to another and from low ranked positions to high ranked positions. Comparing UK
with Norway, we see that the salary level for captains are pretty similar, but that the salary
level for low ranked officers are much lower in UK, as shipowners are using Filipinos, Poles
and other foreign workers to a larger extent.
Number of seafarers
The number of crew needed onboard a vessel is first of all dependent on the vessel type.
CSVs have a much larger crew than AHTS and PSVs, leading to higher crew cost on more
advanced vessels. Further, the size of the crew can vary from project to project and is
normally specified in the contract. You need more people during an anchor handling
operations than during a rig move. In addition to contract requirements, there are safe
manning requirements, but these do not drive the crew costs as vessels always fulfill the
minimum requirement. Most shipowners also have cadets onboard increasing the size of
the crew. This is an extra cost for the shipowners, but they receive compensation from the
Norwegian government for the training of the cadets.

52
Comparing UK with Norway we see that there are 1-2 more people on the vessels in
Norway. This is driven by strict safety requirements from the charterers on the NCS. The
number of people onboard different vessel varies from time to time, both in UK and on the
NCS. In general, there are 12-15 people on a PSV, 12-19 on an AHTS and 20-35 on a CSV. The
graph underneath show average numbers from the interviews we conducted with
Norwegian shipowners, both in Brazil and Norway. We have decided to exclude number of
crew on CSVs from the graph, since the size of crew varies a lot from the different types of
CSVs.
Figure 8: Average number of crew on PSV and AHTS
(Interviews)
Shift systems
The shift systems on NOR flagged vessels is 4 weeks on and 4 weeks off. This is different in
UK, because vessels in UK fly under different flag regimes. For international flagged vessels
the shift system can vary from person to person. Filipinos for example, are normally
offshore for a longer period than they are onshore. Overall, international flagged vessels
change crew less frequently. The logistical costs related to going into port, changing crew
and getting the crew to their homes becomes higher for vessels with more frequent crew
changes. This leads to a higher crew costs on NOR-flagged vessels compared to other INT-
flagged vessels. One issue in Norway is the costs that occur if the shipowner has to change
the crew one day earlier or one day later than the original plan. In these cases the crew gets
much higher wages, and it could cost as much as 100-130 thousand NOK, which is almost
twice the daily OPEX for a PSV.

53
Supply of workers
There is a good and stable balance between the demand and supply of seafarers in the
North Sea. The supply of seafarers, both Norwegian and international, vary from time to
time, but the shipowners manage to get the manpower they need, and have thereby been
avoiding abnormal salary increases way above inflation levels. There is however some
competition for the labor from rig companies. The labor market for seafarers becomes
tighter during booming times in the rig market. However, over the last few years, the
development in seafarer salary has been healthy. One problem though, is a quite high
turnover among the seafarers leading to high training costs for the shipowners. In addition,
some shipowners see that the Norwegians have a tendency to have more sick leave than
other nationalities.
Labor unions and social benefits
The labor unions for marine crew in Norway are divided into three associations; the
“Offisersforbundet” for officers, “Maskinistforbundet” for engineers/electricians, and
“Sjømannsforbundet” for able seafarers. The unions in Norway do not have any
extraordinary power over the shipowners. They have the right to strike, but issues are
usually dealt with before a strike becomes necessary.
The social benefits in Norway are normally 30-40% of the gross salary (Kunnskapssenteret,
2014). But due to the net wage regime used in Norway, Norwegian shipowners get income
tax, employer payroll tax and social contribution benefit tax reimbursed from the
government. The max reimbursement is 198 000 NOK per employee. The crew cost
including benefits on INT-flagged vessels in UK is lower than on NOR-flagged vessel, even
though they are not under the net wage regime.
Inflation
The average monthly inflation (Consumer price index) in Norway has been 1,95% the last 10
years (Norges Bank, 2014a) and will according to predictions from the Central Bank stay at
this level, or a little above going forward. The Norwegian monetary and fiscal policy is built
around the goal of achieving a yearly inflation of 2,5% for the entire economy (Norges Bank,
2014b). The part of the day-rate that is related to crewing is escalated every year according
to inflation estimates provided by NSA. The increase in salary, in accordance to inflation, is
not an issue for the shipowners at the moment.

54
6.1.2 Technical
Technical cost is the second biggest cost group of OPEX on OSVs. According to the different
shipowners this cost group represents between 15 and 30% of the OPEX. The reason for this
big interval is that different owners have different definitions of their technical cost. We
define technical cost as all costs related to maintenance and repairs including the cost of
importing consumables and spare parts. Lube oil is by some companies included in technical
costs, making technical costs a higher share of the total OPEX. The lube oil cost represents
about 2% of the total OPEX.
Like crew cost, technical cost in the North Sea is mainly driven by a general high price level.
The supply of service engineers and support from suppliers is good, and there are no issues
related to import of goods and services. The last three are big problems in Brazil and will be
discussed later.
Cost drivers
The North Sea is surrounded by well developed countries with a high price level. The high
price level means that procurement of spare parts and equipment becomes expensive. In
addition to the high price level, the complexity of the vessel is somewhat driving the
technical cost as well. More complex vessels, like diving support vessels or anchor handlers,
have much more equipment, which increases the daily maintenance costs compared to
smaller PSVs without much equipment.
By industry standard the shipowners have maintenance days in their contracts. Usually it is
0,5-1 day every month (the days can be accumulated over the year) that could be used for
maintenance without losing the dayrate. In addition to this, the charterers in the North Sea
normally let the shipowners do daily maintenance when the vessel is in port, when it is
moving from A to B, or when it is waiting for its next task/project/operation. With these
paid maintenance days during the year, and the ability to do daily maintenance when the
vessel isn’t operating helps the shipowners avoid extraordinary costs related to
maintenance and repairs.
Norwegian seaman culture has historically been one of the best in the world, leading to
good maintenance of the vessels, decreasing the chance of breakdowns during operation.
There has however been a trend that Norwegians are becoming less dutiful, forcing
55
shipowners to hire a third party to do the repairs and maintenance, increasing the technical
cost. This is however not a big problem in Norway (yet).
On the supplier side, the service given to the shipowners is good. There are normally docks
and service engineers available when the vessels need support. Issues with import of goods
and services, and customs clearance are not present. This is very different from Brazil where
hiring service engineers could be expensive because of their inexistence (almost) in the
country. Import issues arise often because of a complex tax regime and logistical
inefficiencies. We will get back to this later.
6.1.3 Insurance
Insurance represent about 4% of the total OPEX. Ship insurance consist of two different
insurances, marine insurance and protection & indemnity insurance (P&I). Marine insurance
typically covers damage on the vessel, while P&I insurance covers damages the vessel
causes the environment, such as pollution, fines due to pollution and removal of wracks.
Commercial insurers offer the marine insurance, while the P&I insurance is offered by P&I
clubs. A P&I clubs is a group of shipping companies that have agreed on covering each
other’s claims when they arise (Gard, 2014).
Cost drivers
The main driver of the insurance premium is the value and size of the fleet, in addition to
the company’s track record. The premium is somewhat affected by damage statistics for the
industry as a whole, but companies are normally not penalized as a result of their
competitors’ injuries/damages. Other factors that influence the insurance premium on each
individual vessel is: vessel age, vessel type, owner, operator, flag of vessel, composition of
crew and contract terms. We will not go in detail on all of these, but only mention them to
show that several factors influence the final premium. Shipowners get better premiums
when they insure a large fleet, instead of only a single vessel. The insurance is normally
administered centrally from Norway.
6.1.4 Breakdown
With breakdown we refer both to the costs related to failures of engines, thrusters or other
severe equipment causing a 100% off-hire, and penalties received as a result of malfunction
of equipment, however not leading to a 100% off-hire. Receiving penalties, for good or bad

56
reasons is typical for Brazil, and we will get back to that in the section about Brazil. In the
North Sea however, shipowners do not receive penalties from the charterers. If one of the
VHF (Very-High-Frequency) communication systems is down, this does not have any
consequence on the up-time (utilization) of the vessel. In Brazil, this could lead to a certain
percentage downtime, even though the operation continues as normal. Offshore shipping
companies working in the North Sea, only get downtime if something severe happen that
forces them to stop their operation completely. In these cases the emergency is normally
dealt with in a fast and efficient way with support from service engineers that are easily
available. Depending on the size of the accident, some of the costs related to breakdowns
could be covered by insurance companies. Breakdown costs are not a big issue in the North
Sea.
6.1.5 Bunkers and lube oil
Like port and pilot fees, bunkers is a cost that is covered by the charterer when the vessel is
on a contract, both spot and term contracts. When vessels are working in the spot market
the shipowner has to pay for fuel between spot contracts. The shipowners sell the stock of
fuel they have onboard to the charterer when they start a contract, and buy back what is
left when the contract is over. The charterer in general also covers fuel expenses when the
vessel is doing periodic maintenance or dry-docking. This is different from Brazil, where
Petrobras tries to push the fuel expenses over on the shipowner whenever they can. In the
North Sea, the bunkers cost represents a small part of the total OPEX, on average around
3%.
The lube oil represents 2% of total OPEX. The lube oil usage is dependent on the complexity
of the vessel; larger vessels with more equipment consume more lube oil than smaller less
complicated vessels. The lube oil expenses are in some cases covered by the charterer but in
other cases covered by the shipowner, depending on the contract terms. The shipowners
normally have a deal with one supplier of lube oil for their entire fleet, where the price
could vary from region to region.
6.1.6 Port and pilot fees
In the North Sea, the charterer covers port and pilot fees as long as the vessels are on term
contracts. However, when vessels operate in the spot market the shipowner has to pay
these expenses. The price of harbor and pilot fees represent an insignificant amount of the

57
OPEX for offshore support vessels. One port call in Norway costs a couple thousand NOK,
and represents less than 1 % of the OPEX in Norway.
6.1.7 Inspection
Inspection cost in this sense is the cost related to classification of the vessel and the vessel’s
certificates. The cost of the classification could vary between the different classification
companies, and it varies depending on which class the vessel is in. This is a minor cost for
the owners and we have therefore not put any focus on this. This classification cost varies
little between regions and are a bit higher in Brazil than in Norway.
6.2 OPEX - Brazil The Brazilian continental shelf is not as mature as the North Sea, but one of the oil and gas
regions in the world with the highest growth forecast. Because Brazil’s oil industry and oil
service industry is less developed than the North Sea industry, several challenges arise in the
daily operation increasing the OPEX of the vessels. In general, the OPEX is 20% higher in
Brazil, driven by a lack of qualified workers, taxation and importation issues and a
challenging client.
Before starting the analysis of the drivers behind OPEX we will shortly describe some factors
that are specific for the Brazilian market. All dimensions affect the operation of OSVs in
Brazil.
6.2.1 Specific characteristics with the Brazilian market
“EBN” - Empresa brasileira de navegação (Brazilian Shipping Company)
Law 9432/1997, “Brazilian Shipping act” created restrictions to foreign owners and vessels
to operate in Brazil. To be able to operate a vessel in Brazilian waters, companies must be
registered with the National Regulatory Agency for Water Transportation (“ANTAQ” -
Agência nacional de transportes aquaviários) as a Brazilian Shipping Company (“EBN”). The
purpose of law 9432 is to assure that the Brazilian industry develops, so that Petrobras
avoids dependency on to many foreign vessels (Jacobsen, 2014). There are several ways to
get an EBN, one of them is building a ship in Brazil, while another is to buy a Brazilian
flagged vessel. A third option is to enter into a bareboat agreement where you charter a
Brazilian flagged vessel. The process of preparing the necessary paperwork takes between 3
and 6 months. Most Norwegian shipowners have their own EBN in Brazil, but there are

58
companies that go through third parties to charter their vessels to Petrobras. Havila
Shipping and K-Line are examples of companies without an EBN, tendering their vessels
through local Brazilian shipping companies like Asso Maritima or Bravante. Going through a
third party is a way for the shipowners to “test out the waters”, and to learn how the
market works, before investing long term in the region.
Import regime - REPETRO
The REPETRO regime is an import tax regime that makes it possible for international vessels
to import goods without paying import tax. The import regime also allows the shipowners to
bring vessels to Brazil without paying import tax (high tax of 30-60%). International flagged
vessels need to pay an import fee of 3% of the vessel’s value when entering Brazil. This fee is
called the state tax on circulation of goods and services (ICMS). There are currently
discussions between shipowners and the government whether or not this fee needs to be
paid every time the international vessel enters into a new contract. The law is difficult to
interpret, so the decision is brought to court in several cases. After the vessel has paid the
ICMS the vessel flies under the REPETRO tax regime.
There are several criteria that have to be met in order to fulfill the REPETRO requirements.
This means that not all spare parts can be imported under the regime. The most important
requirement is that the price of the spare part must exceed 25 000 dollars and it must be
possible to identify the item, e.g. it needs a serial number. For goods that are not imported
under the REPETRO regime the import tax is between 60% and 90% depending on the
product. Brazilian flagged vessels do not have the opportunity to fly under the REPETRO
regime and must pay import tax on all imported goods. The import tax for the Brazilian
flagged vessels varies from 18% to 30% depending on the imported product and which state
it is imported to.
Environmental regulations - IBAMA
IBAMA is the Brazilian Institute for the Environment and Natural Resources. Under the
Brazilian law, the installation of an enterprise or activity potentially harmful to the
environment must undertake environmental licensing beforehand. IBAMA operates mainly
in the licensing of large infrastructure projects involving impacts in more than one state and
activities of oil and gas on the Brazilian continental shelf, but inspections of offshore support
vessels is part of their scope (The Brazil Business, 2014). IBAMA can deny vessel’s entry into

59
Brazil if they do not fulfill the environmental requirements specified by IBAMA. There are 3
basic requirements that have to be followed:
1. Education program for the crew: Crew need to be trained in environmental
legislations (certain number of hours)
2. Pollution system onboard - Need to document that waste onboard the vessel end up
in the right place.
3. Pollution system for waste going into the sea - Need to document that the system
for waste filtering is working correctly.
IBAMA is giving several shipowners a hard time. In a worst case scenario the start of an
operation could be delayed because the environmental inspector argues that you have the
wrong color on your trashcan.
PEOTRAM
PEOTRAM is an excellence program that involves all Petrobras’ maritime suppliers. In the
program the suppliers are assessed on a comprehensive scope of audits across offices,
operational bases and vessels. Good HSEQ records and commitment of doing business in
Brazil are awarded. The companies are ranked on a scale from 0-100%, where 100% is the
best. If a supplier receives a score lower than 40% they are not allowed to join tenders. With
a score between 85 and 90% the supplier will have a 1% advantage on the daily rates
offered in the tenders. Suppliers with scores higher than 90% will have a 2% advantage on
the daily rate offered in the tenders (DOF Brasil, 2014).
Flag regimes in Brazil
There are three different flag regimes in Brazil, Brazilian flag (BRL), special Brazilian flag
(REB) and international flag (INT). To be able to fly under the Brazilian flag the vessel must
be built in Brazil. Vessels flying under the REB flag are vessels imported to Brazil. To be able
import vessels under the REB regime you need to have 2 Brazilian flagged vessels per REB
vessel. If you are building a vessel in Brazil you are able to have two international vessels
flying the REB flag during the construction process. International flagged vessels are vessels
flying under all other flags. Both INT-flagged vessels and REB-flagged vessel can operate
under the REPETRO regime.

60
We will now go into detail on the different operational costs in Brazil and the key drivers
behind the costs. As in Norway, crew costs and technical costs are the largest cost groups.
Brazil is different from Norway due to the fact that Petrobras has a monopoly, and is
therefore trying to push as much costs as possible over on the shipowners. They manage to
do so in some cases, port and pilot fees being one example.
6.2.2 Crew
As in Norway, crew cost in Brazil represents the largest share of the total OPEX, accounting
for 60-70%. The crew cost in Brazil is on average higher than in Norway.
Cost drivers
RN72
On October 10, 2006 the Brazilian ministry of labor introduced the normative resolution nr.
72 (RN72). This law regulates the employment of foreign professionals working on foreign
flagged vessels or platforms. For OSVs the law states that after ninety days of operation ⅓ of
the crew must be Brazilians. After 180 days of operation half of the crew must be Brazilian
and after 360 days of operation ⅔ of the crew must be Brazilian. It is possible to postpone
the process of finding Brazilian crew by applying for a waiver. These waivers are obtained
individually by each company through an application to ANTAQ. Even though the waivers
are obtained, Petrobras could give penalties to owners because they are not compliant with
RN 72. Penalties reach as high as 30M$(Westshore Shipbrokers, 2014). For Brazilian flagged
vessels, there is no exception and they need to have 100% Brazilian crew
In Brazil, different government bodies interpret laws and legislations differently depending
on where in the country you are and who processes your application. Most offshore
companies interpret that RN 72 states that a share of the entire crew needs to be Brazilian,
while the government tend to interpret the law as stating that a share of the crew on each
section (department) of the vessel needs to be Brazilian. This means that vessels need
Brazilians on the bridge, on deck and in the engine, and cannot run the operation solely with
international officers as many do today.
The introduction of RN 72 in 2006, lead to a high demand for Brazilian seafarers. The
demand for Brazilian Seafarers is still high today. When the demand from the market is

61
higher than the supply of labor, it becomes easier for the seafarers to negotiate higher
salaries and better salary-benefits.
Inflation
The inflation in the Brazilian economy has been, and is still high (6%) (World Bank, 2013)
compared to other regions. This leads to continuous increasing costs. Increase in crew
salaries in the OSV market is driven, not only by the general inflation in the Brazilian
economy, but also by competition among the different shipowners trying to attract the best
qualified crew. This means that the actual inflation in crew salaries in some years has been
more than double that of the Brazilian economy.
In Brazil, only the Navy can educate seafarers, and they have not been able to meet the
growing demand for seafarers and officers from the OSV market. This has reinforced the
increase in the seafarers’ salary. In 2011 the inflation in crew salaries reached a top of 17%
(Tradewinds, 2011), while the average increase in the Consumer Price Index (CPI) in Brazil
that year was 6,5% (Inflation, 2014). Since 2013, the increase in crew salary has however
started to stabilize. This year (2014), the increase in salaries negotiated through the unions
was 7,2% (CPI+ 1,2%). There are several reasons for the current stabilization in crew salaries.
First of all, in 2012 the Brazilian Association of Offshore Support Companies (ABEAM)
started bargaining with the unions on behalf of all the offshore shipping companies in Brazil.
This made it possible to obtain better deals for the shipowners. Secondly, the Navy started
to educate more people, especially low ranked seafarers, after pressure from the offshore
industry. One interview object explained the situation like this: “ABEAM made statistics
where they showed the number of seafarers they planned to educate and the number of
seafarers the industry would need. Then they understood that they had to educate more
people.” A last reason for the stabilization is the decreasing activity among the oil
companies, leading to lower need for the offshore shipping companies and thereby lower
pressure to recruit new crew.
Recruiting officers
Despite the stabilization seen in the labor market for crew today, the demand for well-
educated officers in the Brazilian OSV industry is still higher than the supply. Many of the
educated officers do not end up offshore and the quality of the ones who do is not high.
Several OSV companies has pointed out that the education system in Brazil is not good
62
enough to educate high ranked officers. The reason why people do not end up offshore
even though they have education from the Navy is that they have little “seafarer culture” in
Brazil. People that are studying to be officers have actually never been on the sea and have
no intention of working on a vessel. In Brazil, family is especially important and it is hard to
combine family life with working shifts on an offshore vessel.
Another reason for the lack of well-trained officers is the hard competition from the rig
companies to attract the best talents. The rigs typically pay 20% higher salaries than the OSV
companies, and are offering better shift systems (14 days on and 14 days off instead of 28
days on and 28 days off). The OSV companies are therefore sometimes reluctant to provide
their officers with enough training for them to be able to work on the rigs, which mean that
not enough officers get sufficient job training to operate the most sophisticated vessels. Due
to the difficulties of recruiting officers the wages for these positions have increased more
than the wages for other seafarers.
The minimum wage for the crew on the different types of OSV is decided through a
Collective Bargaining Agreement (CBA). The agreement is negotiated between ABEAM and
the Seafarers’ Labor Union (SINDMAR). The minimum wage for low ranked seafarer is
around 4500 R$ (1800$) per month, while for high ranked officers, like captains, it is around
25 000 R$ (10 000$) per month. For low ranked seafarers the actual salary they receive is
close to the minimum wage, due to a sufficient supply of low ranked seafarers. The officers
often have much higher salaries because they are in a better position when bargaining with
the employer. The wages also differ among the officers depending on the size and the type
of vessel they are operating. In the CBA, the officers are divided into four groups based on
the size and complexity of the vessel, where each group has different terms and conditions.
The difference is around 8-10% between each group.
Unions
The Brazilian unions have a strong position in Brazil, and they have been able to negotiate
high wages and several benefits for their members. According to several OSV companies the
cost for the employer is 60-100% higher than the salary for the employee, caused by social
benefits for Brazilian workers. The benefits are divided into the Consolidation of Labor Laws
(CLT) and the Collective bargaining agreements (CBA). CLT benefits are determined by the

63
government and are calculated as a proportion of the base salary. There are four different
benefits in the CLT.
1. The employee has to pay 9% of the salary in social security cost.
2. Each month the employer needs to pay 8% of the employee's salary into a fund. The
money is locked to this fund until the employee either is dismissed or retires.
3. Each employee receive a 13th salary, which is a month extra salary, usually paid out
in November as a kind of Christmas bonus.
4. Offshore workers also get 1 month extra salary as vacation money. This is
compensation because they work on a shift system, and do not have normal
holidays. If you get fired you will get your outstanding vacation money plus an
additional 30%.
In addition to the CLT, the Brazilian workers get benefits through the CBA. Examples are
food allowance, health care and dental insurance, life insurance and money the employer
set aside in private pension funds. The CLT and the CBA decides what will be the minimum
benefit for the crew. Companies can however offer more benefits if they wish in order to
attract the best people (The Brazilian Business, 2014). The graphic underneath show how
CLT and CBA agreements increase the cost of one employee, compared to base salary.
Figure 9: Breakdown of social benefits on top of crew salary in Brazil
Shift systems
Crew onboard OSVs work a 28 days on, 28 days off (28/28) shift system. It was possible to
use a 35/35 days system before, but after negotiation with the labor unions this is not
possible anymore. The Brazilian shift systems lead to more crew changes than in other parts
64
of the world, where the crew is onboard for a longer period of time. Since Brazil is a big
country the crew changes implies transporting the crew over long distances, often by plane.
This is costly, in particular when the crew needs to fly to the north of Brazil where there is
little competition in the airline market. Plane tickets to the north of Brazil can cost up to
3000 Real (1150$) for a round trip. The OSV companies we interviewed, estimated the
average logistics cost to be around 500$ per employee per crew change. If you have a crew
of 15 people, changing it would then cost around 15 000$ (15*2*500$), which is about the
same as the daily OPEX on a PSV.
Number of seafarers
More people are needed on vessels operating in Brazil than in other parts of the world. The
Brazilian labor union is pushing to create more jobs, thus vessels operating in Brazil are
sometimes forced to have more people on deck, in the kitchen and in the engine room.
Vessels operating in Brazil conduct their operations differently than in the North Sea, driving
up the need for crew. In the North Sea, where there is a well-developed spot market,
vessels typically do one operation before they return to the harbor. In Brazil on the other
hand, the vessels often do another operation directly after the first one without going back
to the harbor (AHTS doing several rig moves in a row for example). To be able to have a safe
operation and fulfill requirements from unions, more people are needed when several tasks
are done consecutively. Strict requirements from Petrobras are another factor leading to
more people on vessels operating in Brazil. Petrobras wants to increase the size of the crew
to ensure a safe operation. A last reason for the crew being larger is that Brazilians are more
inefficient than seafarers from other nationalities, creating a need for more people on the
vessels. Quote Chief Engineer: “If you see a chair you can be sure that it is occupied by a
Brazilian”
Not all shipowners agree that there are more people onboard vessels in Brazil than in other
parts of the world. This might be because some shipowners have more skilled Brazilian crew
then others. Another possibility can be that the Brazilian shipowners do not want to admit
that there are more people on the vessels in Brazil, because this would be admitting that
Brazilians are less efficient than international seafarers.

65
On Brazilian PSVs the average number of crew is between 13 and 16, and on AHTS’ the
average is between 18 and 20. There are however examples of AHTS with only 14 people,
and with as much as 25 people. The reason for the big differences is that the vessels vary a
lot in size, and the type of operation performed requires different amount of crew. Large
vessels with very complicated operations need more people than smaller AHTS doing less
complicated tasks (could be used as PSV). In Norway the size of the crew on a PSV is
normally about 12-16, and on AHTS it is between 12 and 19 people.
Food
The general price level in Brazil is high compared to other parts of the world. This is also the
case for food prices. The prices for food are therefore an additional driver for the crew cost
in Brazil. The clients in Brazil also have more people onboard then what is typical in the
North Sea, increasing the food cost and the need for people in the kitchen.
6.2.3 Technical
Technical cost is one of the most challenging costs in Brazil. Because of high importation
taxes and difficulties with customs, the technical cost in Brazil is higher than in Norway and
also harder to predict. The technical cost in Brazil represents between 15 and 25% of the
total OPEX.
Cost drivers
Lack of suppliers leading to costs related to import of goods
Due to a very limited international supplier network and no international companies with
spare-part stocks in Brazil a lot of the equipment needed to do maintenance and repairs is
imported. Brazilian suppliers can be used, but the quality of the products you find in Brazil is
worse than in Norway and can in some cases not be used. One interview object stated: “We
have bought brand new filters here in Brazil, but the quality was so bad that the chief
engineer threw them away.” In addition, to fulfill warranty requirements new vessels often
need to use original spare parts which cannot be found in Brazil. All these factors leads to
increased costs for the companies due to high import tax, transportation costs and extra
time spent in customs and elsewhere along the importation process. Suppliers have tried to
set up warehouses in Brazil, but without any success. The suppliers are forced to pay full
import tax, and are therefore not competitive on price compared to international vessels
that can import goods under REPETRO.

66
When importing goods to Brazil customs clearance can be a major problem. One interview
object put it this way: “If Petrobras is a problem, then customs are our nightmare.” The time
used to get things through customs can be long, which is unfortunate when a vessel has a
breakdown and spare parts are needed fast. Storing the products in customs is expensive;
the storage is paid in advance, 10 days at the time. A good relation with an experienced
customs agent is important in order to minimize risk related to imports. The OSV companies
emphasize that a good customs agent can significantly reduce the risk of having problems
declaring goods.
A few shipowners have said that they have lower technical cost on BRL-flagged vessels than
on INT-flagged vessels because they do not import consumables, spares and other
equipment, but purchase it locally, thereby reducing technical cost. This has again led to
lower OPEX on the BRL-flagged vessels than on the INT-flagged vessels. Most companies do
however argue that the quality on the local products is insufficient.
Unskilled labor driving maintenance cost
A key driver for the technical cost in Brazil, is the lack of maintenance done by the crew. This
means that the companies need to use third party companies to do the maintenance when
the vessel is in harbor, which increases the cost. This problem is especially big on vessels
with 100% Brazilian crew. There are several reasons for this:
● The education of Brazilian seafarers is poor, and they do not get enough training and
education before they start working on the vessel.
● Brazilians do not have any “seafarer culture”, thus they do not know how to take
good care of a vessel and they do not see it as their responsibility to do maintenance
on the vessel. On interview object stated: “The Brazilian chief engineer is often the
guy with the cleanest work outfit.”
● Some shipowners have experienced that Petrobras deny the crew to do
maintenance during operations. This is particularly true for large AHTS and CSV
where Petrobras always have an inspector on board. For vessels that are in constant
operation for a month at the time the risk of breakdown increases when you do not
have the opportunity to do daily maintenance. Some years back, it was normal to

67
have a few “credit days” in the contract where the shipowner could do maintenance
without losing the day-rate, like in Norway. This condition has been removed.
For international vessels with partial international crew the maintenance problem is smaller.
International crew often has more experience and a culture where they take care of the
vessel. They therefore do more maintenance than the crew on a vessel with 100% Brazilians.
Several companies send Brazilian crew to Norway and other regions, so that they can gain
more experience and learn more about seaman culture, before they come back to Brazil and
start working on Brazilian flagged vessels. This can be quite expensive since Brazilian
seafarers earn a lot more than e.g. Asians and the travel costs increase dramatically if they
start working in the North Sea instead of the Brazilian continental shelf. Despite this, several
OSV companies think it can be beneficial in the long run because the Brazilian crew gain
important knowledge that could lead to a better operation of vessels in Brazil in the future.
Some of the shipowners we have talked to do not agree that Brazilian seafarers do less
maintenance. A reason for this can be that some shipowners have a better-educated crew,
that do more maintenance than other Brazilians, or that they don’t want to blame Brazilians
for doing less maintenance.
Lack of good service engineers
Another driver of the technical cost is the lack of good service engineers/technicians in
Brazil. This is caused by a weak education system, with low education quality and not
enough people being educated. The quality of the service done by Brazilian engineers is
often poor. One interview object stated: “We have experienced that the vessel is in worse
condition after the service than it was before.” As a result, service engineers often need to
be brought in from Europe. This is expensive because of the travel expenses, and it also
takes longer time which can be crucial if it’s an emergency service. Due to Brazilian laws and
regulation it can be problematic for the service engineers to get visas and it could take
about 30 days to receive the visa. In addition, keeping the visa for more than one year is
quite hard. The service companies therefore always need to have people with Brazilian
visas, and the possibility to rotate these people. To be able to support the crew when
technical support is needed some shipowners have their own onshore technicians. This
increases the onshore staff, and wouldn’t be necessary if the vendor’s technical support was
available (ABRAN FGV Seminar, 2014).

68
Climate challenges
The warm climate in Brazil leads to increased maintenance and repair costs. The warm and
salty water combined with high humidity, exposes different parts of the vessel to rust. The
rust can lead to breakdowns of equipment and harm the hull of the vessel. The rust can be
prevented by buying good paint system. Marine growth on the hull is another problem that
occurs because of the climate. If it first starts growing, the growths spread quickly. This can
slow the vessel down and harm the vessel’s hull. Good anti fouling paint can however
prevent this from happening. One interview object stated: “The best investment you do
here in Brazil is to buy the most expensive paint and anti fouling systems.”
6.2.4 Insurance
Insurance represent approximately 2-5% of the total OPEX in Brazil. As mentioned before,
there are two types of insurances, P&I insurance and marine insurance. The P&I insurance is
done outside of Brazil, both for INT-flagged vessels and BRL-flagged vessels. For the marine
insurance Brazilian flagged vessels are obligated to insure at least 40% of the vessel through
a Brazilian insurance company. Thus, this insurance is written partly in Brazil and partly
outside Brazil, where the conditions normally are better. The cost drivers in Brazil are the
same as in Norway.
The insurance premium you pay is usually higher for vessels that operate in Brazil, both for
the marine insurance and the P&I insurance. This is mainly because of the higher breakdown
costs you have in Brazil and the penalties you face if you have an accident that harms the
environment. In some cases, vessels that only caused minor damage to the environment,
still received large fines from the Brazilian government. The crew composition could be
another reason for a higher insurance premium in Brazil than in Norway. The Brazilian crew
is not always as experienced and well educated as other international crew, thus the
insurance companies look at this as a risk.
6.2.5 Breakdown
Breakdown costs occur when something on the vessel is not working according to the
specification outlined by the charterer of the vessel. The breakdown cost is calculated as a
percentage of the daily rate. If the vessel is not able to operate at all due to severe problems
with equipment the vessel will get a 100% downtime. It is also possible to get smaller
breakdowns while the vessel is under operation, e.g. if some equipment that is not in use do

69
not work. This is often called penalties. The main client in Brazil gives a lot of penalties to
the shipowners, both with and without a legitimate reason, e.g. wrong type of milk in the
fridge could for example lead to a certain % downtime. One shipowner put it like this: “It
seems like giving penalties is the inspector’s hobby.” The breakdown cost for the companies
we interviewed varied from 1-5% of the daily rate.
Cost drivers
Lack of maintenance, longer breakdowns
An important driver for the breakdown cost is the lack of maintenance done by the crew, as
well as low quality on the services done by third party companies. The fact that vessels in
Brazil usually are on long term contracts and do not have any maintenance days in the
contract makes it difficult to do maintenance and repairs. The biggest problem however, is
that a breakdown usually lasts much longer in Brazil than in the North Sea. The import of
spare-parts, needed to repair the vessel, often takes a long time. In some cases service
engineers from Europe is sent to help, which prolongs the process even more.
Petrobras
Petrobras is another reason for the high breakdown cost in Brazil. Since Petrobras mainly
has vessels on long term contracts, the only way they can reduce their cost is by reducing
the day rates. This is achieved by giving penalties to the shipowners. Several shipowners
mentioned that Petrobras gives them penalties if not everything on the vessel is according
to the contract, even if the vessel is operating perfectly. One interview object stated:
“Petrobras can give you penalties if a winch is not working, even if they have no intention of
using it. We had 100% utilization last year on vessels not operating with Petrobras, and to
put it this way, we are not doing a better job on those vessels.” Reducing the day rate on the
vessels through penalties is a way for Petrobras to save costs. Another interview object
stated: “With a fleet of 450 vessels, 5% downtime is a big cost reduction for Petrobras.” A
good relationship with the inspectors from Petrobras is important; you have to cooperate
with them to be able to get as few penalties as possible. According to the shipowners the
inspectors give more penalties now compared to only a few years back. Several of the
inspectors are new in the job (the experienced people retired), and have little experience
with the operation of offshore vessels.

70
The breakdown costs vary a lot among the different shipowners. The shipowners with less
breakdown cost have pointed out several factors for this. First of all, modern vessels with a
lot of redundancy systems tend to have fewer breakdowns than older vessels. Secondly,
having a good relation with the inspectors from Petrobras could help reducing the level of
breakdowns. A last reason can be that some shipowners have crew that take better care of
the vessel, e.g. do more maintenance and other preventive work.
6.2.6 Bunkers and lube oil
Bunkers, like port and pilot fees, represent a small part of the total OPEX, normally 2-3%.
The bunkers is covered by the charterer in all contracts, this is a standard within the
industry. However, the shipowners have to pay for bunkers when the vessel is off hire, or
when it is in docking. This is different from the North Sea where the charterer often pays the
bunkers during both downtime and docking. Because most vessels in Brazil are on long term
contracts with high utilization, the bunker cost is small for the shipowners.
The cost of lube oil in Brazil is usually covered by the shipowner, like in Norway. Some
shipowners emphasize that they use a little bit more lube oil in Brazil, and that it could be
caused by slightly higher prices or a slightly higher consumptions due to more salt in the
water driving the need for more lube oil.
6.2.7 Port and pilot fees
The port and pilot fees is higher in Brazil than in Norway, but still only represent 2-5% of the
total OPEX. Port fees are covered by the charterer in most contracts. But Petrobras is forcing
the shipowners to pay this cost in new contracts, especially for CSV vessels. In order to
include the port fees in the budget it is crucial for the shipowner to know how often they
will have a port call. For international vessels it is also mandatory to have a pilot onboard,
Brazilian vessels can avoid this. As for port fees, pilot fees are normally paid covered by the
charterer. Pilot fees are high in Brazil because pilots have, as a result of a monopoly
situation, managed to push their salaries sky high (Safe Seas, 2009). With active lobbying
they have retained the monopoly without any disturbance from the government. One
interview object stated: “Pilots live in Miami and come by helicopter to the vessel, takes a
cup of coffee and flies back to Miami!” A pilot can easily earn up to 80 000 R$ (30 770 $) per
month. Port fees including pilot cost approximately 20 000 R$ (7 600$) for each port call.

71
6.2.8 Inspection
See OPEX Norway
6.2.9 Other costs
EBN management fee
Companies that do not have their own EBN, must as previously mentioned use a third party,
who has EBN status, to be able to operate their vessels in Brazilian water. This third party
will charge a fee for this service, which could lead to higher OPEX for the shipowner.
Administrative Cost
The administrative costs are significantly higher in Brazil compared to Norway. There will in
general be more onshore personnel per vessel in Brazil than in Norway. The higher
administration cost is mainly driven by a complex tax system in Brazil and several
documentation and paperwork requirements from Petrobras. To fulfill requirements from
Petrobras many monthly reports are necessary: crew payment evidences, medical care
evidences, fiscal obligations evidences, fuel consumptions controls, hazard evaluations and
accident reports. The office teams must be large to cope with these bureaucratic client
demands, complex and unstable fiscal scenario, complex labor regulations, logistics
difficulties and importation processes. These are kind of hidden costs that the companies
might not expect when they decide to enter the Brazilian market (ABRAN FGV Seminar,
2014).
6.3 Comparison and summary of OPEX The OPEX is on average higher in Brazil than in the North Sea. This is mainly due to higher
crew and technical costs. The crew cost is driven by more crew onboard the vessels in Brazil,
especially on AHTS, and a higher average cost for each crew member, because of high
officer salaries and high social benefits. The technical cost is driven by the lack of suppliers
leading to importation of equipment. This increases the cost due to import tax and other
costs related to the import process. A last factor increasing the OPEX in Brazil is demanding
requirements from Petrobras, and frequent penalties received for good and bad reasons.
The OPEX in the North Sea is higher for NOR-flagged vessels than for INT-flagged vessels.
This is solely due to higher crew cost on NOR-flagged vessels, mainly because these vessels

72
have to follow Norwegian wage tariffs, but also because vessels with INT-flag on average
have less crew onboard than NOR-flagged vessels.
The OPEX in Brazil is also different based on which flag the vessel is flying. Because BRL-
flagged vessels need 100% Brazilian crew, the OPEX is often higher for these vessels.
However, we do not have numerical evidence supporting this; it is solely based on
information received through interviews. Technical cost will also vary from INT-flagged
vessels and BRL-flagged vessels, because they fly under different import regimes. It is
ambiguous for whom this is an advantage.
7 CAPEX In the following chapter we will discuss the cost drivers behind the capital expenditures
(CAPEX) related to offshore support vessels in the North Sea and Brazil. We will first present
the North Sea market and use this as a benchmark when analyzing the Brazilian market. If
nothing else is stated, the analysis is based on information from the interviews.
We have divided the CAPEX into two groups; cost related to shipbuilding and cost related to
periodic maintenance (hereafter referred to as docking). Even though dry docking costs
occur continuously during the lifetime of the vessel, the costs are capitalized and therefore
determined CAPEX.
7.1 CAPEX - Norway We will first elaborate on the cost drivers of docking vessels in the North Sea. Thereafter,
we present the cost drivers behind shipbuilding in Norway, as well as the advantages and
disadvantages of building vessels in Norway. In the first part about dry docking, we look at
the entire North Sea market, as the shipowners use the best available docking facility
regardless of which country it is located in. In part two about shipbuilding, we solely focus
on shipbuilding in Norway, as this is by far where most of the OSV shipyards in the North
Sea are located and has been the focus in our interviews.
7.1.1 Docking
Description
A dry dock is a structured area wherein construction, repairs and maintenance of merchant
vessels and boats are carried out. The unique construction allows water to be filled up in

73
that area, so that vessels can be maneuvered in and out of the dock. Once the vessel enters
the dry dock, the gates are closed and the seawater is drained out so that hull and other
areas of the ship which have been exposed to seawater for a long time are available for
carrying out maintenance and repair works (Marine Insight, 2010). Dry docks could either be
onshore or floating (in water). According to the International Convention for the Safety of
Life at Sea (SOLAS) vessels must be dry-docked at least twice every 5th year, this is a
requirement from the International Maritime Organization (IMO), and if these standards are
not followed the vessel could lose its classification (IMO, 2014). Almost all vessels are
classed by a classification society like the Norwegian company DNV GL. Without
classification, the vessels could be uninsurable and might not be able to sail. Vessels are in
class when their machinery, hull, structures and equipment correspond with the IMO
standards.
In addition to the 5-year classification docks, dry docking is normally carried out before a
vessel is sold or if an accident occurs. Shipowners are also required to do interim dockings.
These are normally conducted every 2,5 (36 months) year, and does not necessarily need to
be in a dry-dock (Marine Insight, 2010). It could simply be an inspection done in the port by
divers, where they do smaller maintenance on the hull of the vessel. Reasons why some
interim dockings are conducted in dry docks are that the vessel is old and needs
maintenance more frequently, or that the shipowner wants to do an interim dry docking in
order to have less maintenance to do during the 5-year classification dry dock.
The price of a dry-dock vary depending on whether the company is doing an interim docking
or a 5 year classification dry dock. The 5 year dry dock service has a larger scope and is
therefore more expensive than the interim docking. In addition to scheduled dockings,
shipowners sometimes have emergency dockings because of equipment that break down on
the vessel. This is unfortunate as the shipowner’s costs increase and the company loses its
day-rate because of downtime. The cost of an emergency dock varies depending on the
scope of the breakdown and the availability of docks.
Docking in the North Sea
There are several docking facilities in the North Sea, both in Norway, Denmark, Netherland
and in the UK. Which yard the shipowner decides to use varies depending on the location of
74
the vessel and the relationship they have to the different yards. However, since the sailing
time no matter where you are in the North Sea is less than a day, the location of the vessel
is not crucial when deciding where to do the docking.
Because of the Danish yards’ good reputation, docking in Denmark is becoming more and
more popular among the shipowners. Even though the sailing time might be a little longer
compared to Norwegian yards the price for a docking in Denmark is lower. The quality is
better and the time used to perform the docking is shorter in the Danish shipyards. Most of
the workers at Danish yards are Danish with long experience docking vessels. This is
different from Norwegian yards, where most of the workers are foreigners with less
experience. Another reason why shipowners do the docking abroad is that an increasing
number of Norwegian yards have switched focus from docking ships to docking rigs where
the margins have been higher. Due to increasing newbuilding orders for vessels, several
Norwegian yards, which earlier performed dockings, have refocused their business to do
more shipbuilding. This has led to a drop of docking knowledge and services in Norway.
The price of docking a vessel in the North Sea varies a lot depending on several factors. First
of all, the type of vessel is an important factor influencing the price of the docking. Vessels
with more equipment have higher docking costs, PSVs being the cheapest and CSVs the
most expensive. A five-year dock for a PSV normally cost from NOK 5-7 million (0,8-1,2M$) ,
for a AHTS the price could be up to NOK 15 million (2,5M$) while the price for a CSV docking
could exceed NOK 20 million (3,3M$).
Secondly the age of the vessel has a strong influence on the docking price. Older vessels
typically have a higher docking cost, because there is more work that needs to be done. A 15
year classification dock for a PSV cost around NOK 20 million (3,3M$) which is significantly
higher than the price of a 5 year classification dock.
Mainly two factors are driving the cost of docking in the North Sea, the price of equipment
and the price of labor.
75
Cost drivers
Equipment
Highly specialized parts are needed when doing maintenance on machinery like engines,
thrusters and other equipment onboard the vessels. These parts are often made in
industrialized countries like Norway where the production cost is high, driving up the cost of
the docking. More advanced vessels have more equipment to maintain, and need more new
parts in the docking process. This is the reason why the docking is more expensive for these
vessels. Older vessels also require more new parts which partly explain the difference in
docking cost between new and old vessels.
Labor force
The labor hours used in the planning process of the docking and during the docking process
are expensive. Countries like Norway, Denmark, Netherlands and the UK are all
industrialized countries with high living standard and high salaries. Much of the work that is
done in a docking process needs to be done by professional workers with salaries much
higher than the minimum salary in these countries. Even though the workers on North
European yards are efficient compared to for example Brazilians the total labor cost is high.
The docking process takes from 2-3 weeks mainly depending on the age of the vessel. A 5
years classification dock usually takes around 2 weeks, while a 10 and 15 year classification
dock takes around 3 weeks. The tasks done in a 10 and 15 year docking process are more
time consuming, like pulling the shaft and maintaining the engines. The fact that the docking
process is longer for older vessels is another reason why the docking cost increases with the
age of the vessel. The docking process takes more time for more advanced vessels, which
can be another explanation why the docking cost increases for more advanced vessels.
7.1.2 Shipbuilding
Shipbuilding status in Norway
The total fleet in the North Sea consists of around 510 vessels, and has been increasing
steadily over the last decades (DNB, 2014). A major part of these vessels are controlled by
Norwegian shipowners and around 200 of them fly the Norwegian flag (Norwegian
Shipowners’ Association, 2014).
76
There are between 15 and 18 shipyards in Norway building offshore support vessels,
delivering from 20-25 vessels each year. The biggest player in the Norwegian shipbuilding
industry is Vard with the total of 5 shipyards in Norway. Other companies like Kleven,
Ulstein and Havyard are also delivering high quality vessels to the offshore industry.
Cost of building ships
The cost of building offshore support vessels in Norway is high compared to other regions.
The price for a PSV built in Norway is between NOK 250 and 350 million (40-60$M)
depending on the size of the vessels. The price for an AHTS varies from NOK 500-800 million
(80-125$M), also depending on size, but most of the vessels built in Norway are in the upper
segment and the price for these types of vessels are between NOK 700 and 800 million (115-
125$M). The price for CSVs can vary from NOK 600 million (100M$) and up to NOK 2 billion
(335M$) depending on size and complexity.
A big part of the vessel delivered from Norwegian yards is actually built outside Norway. The
steel work and much of the pipe work is done in Eastern Europe in countries like Romania.
The trend in the shipbuilding industry in Norway is that more and more of the work is done
outside the country. To build an offshore support vessel usually takes about 2 years. The
first 15 months of this period takes place in Eastern Europe, before the vessel is towed to
Norway. The last 9 months is spent in Norway installing specialized equipment and ensuring
that the vessel operates like it should.
Cost drivers
Labor cost
The most important cost driver related to shipbuilding in Norway is the cost of labor. To
build an offshore vessel in Norway approximately 500 FTEs are needed. Norway has one of
the highest average wages in the world which highly influence the price of building vessels
(Statista, 2014). Especially educated people like electricians and engineers are expensive in
Norway. These people are required in the finalization process of the vessels, driving up the
labor cost. Even though a lot of the labor-intensive work is done before the vessel arrives in
Norway, several work hours still remains, thus driving up the shipbuilding cost.
77
7.1.3 Advantages and disadvantages of building vessels in Norway
Advantages
The two biggest advantages of building vessels in Norway emphasized by all shipowners are
that you will get a vessel with high quality delivered on time. The Norwegian shipyards are
known for delivering advanced offshore support vessels with high standards. There are
normally no problems with the vessels after delivery, and they manage to operate as
promised. Norwegian yards are known for being the best in the world to build offshore
support vessels, especially advanced vessels like large AHTS and CSVs. Building these vessels
requires a great deal of experience and mistakes are not tolerable. The high quality of the
vessels built in Norway makes the second hand value of the vessel high, potential buyers
know that the vessel will last for a long period of time.
The advantage of having the vessel delivered on time is an important factor. If the
shipowner is building the vessel based on a contract with an oil company, the shipowner will
be forced to pay penalties to the charterer if the vessel is delayed. Even if shipowners build
vessels on speculation a delay is costly, both because the financing costs are running and
because a peak in the market can be missed.
Other advantages of building vessels in Norway are that the shipowners are close to the
yards making it easier and cheaper to supervise the building process. There are examples of
companies building vessels in China sending up to 40 people to supervise the process. This is
an extra cost of building outside of Norway. The actual price for a vessel built in Norway is
normally the same as the budget price presented when the contract was signed, creating
less uncertainty.
Another advantage by building in Norway is the financing you get from GIEK and Export
Credit Norway. With loans from Export Credit the down payment period can be up to 12
years, and the interest rates as low as 5%. Institutions like Export Credit are not unique for
Norway. Several countries have similar institutions, and Brazil has a state of the art financing
scheme.
Disadvantages
The biggest disadvantage of building vessels in Norway is the price of the vessel. The
contractual building price for a PSV in Norway can be twice as high as in China. This is before

78
adding the extra costs that historically have occurred when building in China, e.g. delays and
extra costs related to huge supervision teams needed during the building period. In the end
the price difference can be as little as 10%, and the vessels have lower quality and usually
also lower specifications than comparable Norwegian built vessels.
For more advanced vessels it is more difficult to compare the price, because the vessels built
in China are less advanced than the one being built in Norway. But according to shipowners
some yards in Vietnam and South Korea do manage to build vessels with similar
specifications as in Norway with prices around 10% lower. If the vessel is built for operations
in the North Sea the mobilization cost is high because it takes a long time to transport it
from Asia. It normally costs 1-2 M$ to get the vessel back to Norway, which is something the
shipowners have to pay. This extra cost will reduce the cost advantages of building in the Far
East. If you, on the other hand, plan to operate the vessels in the Far East or in Australia, the
mobilization cost will be lower if the vessel is built in the Far East.
7.2 CAPEX - Brazil We will in the following chapter discuss the drivers behind CAPEX related to operating
vessels in Brazil. We will start by presenting the drivers behind the docking costs. Then we
will discuss the cost drivers behind shipbuilding and the advantages and disadvantages of
building vessels in Brazil.
7.2.1 Dry Docking
Cost of docking
According to the Norwegian OSV-companies in Brazil, a 5 year dry-docking could cost 30-
50% more than in Norway. However, to determine an average price is difficult as it will
depend on the vessel type, the vessel size, equipment onboard and the scope of the dry-
docking. The cost of the interim docking is normally half of the 5 year-docking. All OSV-
companies in Brazil emphasized that it is mainly two things that make the dry-docking more
expensive, the first one being the rent of the dock and the second the cost of importing the
necessary equipment. The cost of renting a dock in Brazil depends on the size of the dry
dock. Lack of dry docks has led to high prices. The Norwegian shipowning companies in
Brazil normally have medium and large OSVs. The rent of docks for these vessels could
range from 20-30 000 dollars/day compared to only 5000 dollars/day in Denmark. One of

79
the shipowners put it this way when talking about dry dock prices: “Dock owners can take
whatever price they want; it’s the only girl in town”. There are however several other
factors leading to high dry docking prices in Brazil, these drivers will be explained in detail in
the following section.
One of the shipowner summarizes the dry dock situation like this: “Lack of shipyards,
shipyards are very old and they have not been updated. So if you see a vessel dock in
Norway, the way they treat the hull and paint the hull, if you see this in Brazil we are 30
years in difference; in performance, in equipment and technology. Takes longer, more
costly….”
Cost drivers
Access to the docks
The main driver of the dry docking cost in Brazil is the access to docks (docking capacity).
Because there are only a few docks in Rio de Janeiro (“Rio”), it is not enough to cover the
demand from the shipowners. As mentioned in the strategic profitability analysis earlier,
there are only 2-4 docs that could be used for medium to large support vessels in the Rio de
Janeiro area, Renave, Maua and Dockshore (floating dock) located in Niteroi, being the most
reliable ones. The number of useable docks in Rio (and Brazil as a whole) depends on what
risk you want to take. One shipowner considered only one dock in Rio to be 75% reliable,
meaning that the quality of these docks is questionable. There are numerous other docking
facilities, but these are either too small or lack the qualified people, equipment or
technology to do the work in a reliable way. As mentioned earlier there are almost 500 OSVs
in Brazil. With vessels needing a classification dry-docking every 5th year, it means that
there could be around 100 classification dockings every year. In addition to this, several
emergency dockings occur causing an even higher demand for docking capacity. To get an
idea of the number of emergency dockings that occur every year, one shipowner said he
had about 0,5 emergency dockings per vessel last year. In summary, the demand is much
higher than the offer from the market, causing rent-prices for the dry docks to skyrocket.
In the future this might be better as new companies are entering the dry-docking service
industry. As far as we know, there is currently one onshore dry dock and one floating dry
80
dock being built in Niteroi/Rio area by Embradock and Dockshore. Shipowners believe the
prices will go down as the supply increases.
Time of docking process - delays
The time it takes to conduct a dry dock in Brazil is another important driver of the docking
cost. A 5 year classification docking should normally take around 20-25 days. There are
however several examples of dockings that took 30 and even 40 days. In Norway, it does not
take more than 12-21 days when the dry-docking goes without problems. One factor
prolonging the process of docking is unreliable shipyards. Yards could confirm to the
shipowner that a space is available in the dock, thus the shipowner takes his vessel out of
contract, but when the vessel arrives at the yard she does not necessarily get access to the
dock right away. The total time of the docking process increase and potential revenues are
lost.
Shipowners emphasize that it is important to plan the docking thoroughly to make sure that
all the equipment and parts needed are in place when the maintenance starts. If a surprise
occurs, a lot of time will be lost due to a slow import process. For example if an imported
spare part arrive at the customs clearing warehouse on a Thursday, you might not get it
before 4-5 days later because of lack of capacity and productivity in the customs office. In
Møre and Romsdal in Norway you would probably be able to get this same part within
hours. In Brazil, an undeveloped supplier industry, with a lack of qualified equipment leads
to a lot of importations; this takes time if not planned properly.
Longer time in the dock means more days of dry dock rent payments, increasing the price of
the docking substantially compared to Norway. The dry docking in Norway is not only faster,
but the price of renting the dock is also lower.
Low quality leading to import of goods and services
Another important driver behind the dry-docking prices is the tax related to import of
equipment and services from abroad. This issue is similar to what is explained as a driver of
the technical cost (maintenance, repairs, etc.), in the section about OPEX in Brazil. In both
cases, tax on import, transportation costs and the cost of the extra time spent is increasing
the total cost of the docking.

81
Import of equipment and the use of technical teams from Europe to manage and conduct
the dry-docking, is done by many OSV-companies. Lack of competence among Brazilian
workers and lack of quality in Brazilian equipment lead to these importations. The extra cost
related to the “import” of the “docking-team” is not substantial, but the cost related to the
import of equipment could be big, especially when something unforeseen happens. If a
repair that was not planned as part of the initial scope has to be done, it takes extra time
due to the long importation process. The price of the equipment will be higher because the
company does not have time to get the item(s) under REPETRO.
If one decides to use local services, another problem that can occur is that they are not
doing the entire scope of the docking, forcing the company to make a new dry-docking after
2,5 years, or that they do maintenance that is outside of the scope increasing the cost of the
docking. The lack of well trained and experienced engineers in combination with a lack of
state of the art equipment and suppliers in Brazil is a big challenge for the shipowners.
Climate
As for technical cost, the climate in Brazil is also a driver of the docking cost. The warm and
humid weather, in combination with very salty and warm water is a factor that increases the
need of maintenance on the vessels. The Brazilian climate leads to corrosion and a faster
formation of algae, tearing down both the vessel’s hull and the moving parts like propellers
and thrusters. To avoid too much wear and tear shipowners need to spend more money on
state of the art fouling and painting. The climate could lead to more frequent visits to the
docks, especially for old vessels, increasing the maintenance (docking) cost for the fleet.
Alternatives to docking in Brazil:
Docking abroad can be an alternative to docking in Brazil. The attractiveness of this depends
on whether the vessel has international or Brazilian flag, and also on the scope of the
docking. The advantage of docking abroad is bigger for more complex and advanced
dockings, e.g. if reconstructions and new installments on the vessel are necessary before the
start of a new project. Abroad, the docking team will most likely be more competent and
use better equipment and technology.
In terms of the cost, the price of dry-docking an AHTS in Brazil could be 5M$ while it is only
3M$ on Las Palmas in the Canary Islands. Shipowners have tried to dock both BRL-flagged
82
vessels and INT-flagged vessels abroad, and the two cases differ. Independent on flag,
vessels needs to be exported from Brazil in order to do the docking and then imported again
afterwards. For the BRL-flagged vessels, the Brazilian shipping company has to pay about
40% tax on the services done in the dry-docking when receiving the invoice from the
shipyard, eating up much of the price difference between Europe and Brazil. For vessels
flying under an international flag the invoice can be sent to the vessels home country,
avoiding this import-tax. The risk in this scenario is that the shipowner can be forced to pay
the 3% tax (ICMS) on the vessels value when it is re-imported into the Brazilian waters.
Some shipowners say it is possible to avoid this while other are not willing to take the risk.
Another downside for both Brazilian and internationally flagged vessels is that it takes more
time to sail to a docking facility that is located abroad. Sailing to Las Palmas for example,
takes 10-12 days, depending on the speed, leading to more days off-hire. Lastly, the
shipyards in Brazil are also aware of the costs related to docking abroad and can therefore
price their own docks accordingly, making sure that it is hard for the shipowners to take
advantage of any arbitrage opportunities. The price of docking abroad is however helping to
put a roof on the price of dockings in Brazil.
7.2.2 Shipbuilding
Shipbuilding status in Brazil
The fleet in Brazil has grown dramatically during the last 5-10 years. The first 5 years of this
century less than 200 vessels were operating in Brazil. According to a report published by
ABEAM (Brazilian Association of Offshore Support Companies) in June 2014, there were 492
OSVs operating in Brazil during the first half of 2014. 233 (47,4%) of these were flying under
the Brazilian flag (BRL) while 259 (52,6%) where flying an international flag (INT). Looking at
the different segments we see that the composition of Brazilian vs. international flag varies.
For PSV there are 108 INT flagged vessels and 97 BRL-flagged vessels. For AHTS it is however
only 20 BRL-flagged vessels while there are 78 INT-flagged vessels. The CSV-segment is
dominated by international vessels (40 vs. 11) (Abeam, 2014).
According to Petrobras another 200 vessels will be needed within 2020 (ABRAN FGV
Seminar, 2014). It will not be possible to build all of these vessels in Brazil, which means that
if Petrobras manages to develop their fields as fast as they say, there will be a demand for
83
international vessels. Shipbrokers and shipowners we have talked with said that around 7-
10 PSV will be built in Brazil every year going forward, and 10-12 AHTS will be built until
2019. The main companies ordering PSV are CBO and Edison Choest, who are building at
their own shipyards. As mentioned already, this is not enough to cover the expected
demand from Petrobras creating a room for international vessels.
Cost of Shipbuilding
The cost of building a vessel depends mainly on the type of vessel being built and where it is
constructed and commissioned. It is cheaper to build vessels in Norway than in Brazil, and it
is even cheaper to build vessels in China. Building a high-end PSV- 4,500 dwt with
Norwegian standards in Brazil could cost 60-80M $, while it would only cost 40-60M $ in
Norway, and as little as 30-35M $ in China. The quality of the vessel and the time of
construction could also vary depending on geographical region. The shipyards in Brazil are
unfortunately known for being less reliable both in term of on-time delivery, and in term of
the quality delivered.
Even though the price of building vessels in Brazil is currently at an all-time high, this has not
always been the case. Between 2000 and 2010, the shipbuilding prices in Brazil were similar
to what you would find in Norway. Shipowners say that the cost of building a PSV in 2002-
2003 was 16-20 M$, but that the prices have increased dramatically since then, especially
between 2010 and 2013. According to shipyards the reason for this is that the vessels being
built in Brazil today are more advanced and bigger than 10 years ago. The Brazilian yards are
not dimensioned for such big vessels, and the workers do not have the skills required to
build such advanced vessels. This has led to delays which is an important cost driver for the
shipbuilding process.
For similar reasons as dry-docking, shipbuilding in Brazil is more expensive than in Norway.
The cost drivers are explained shortly in the next section.
Cost drivers
Access to yards
A lack of slots in good shipyards makes it expensive to build ships in Brazil because the yards
can charge premium prices when there is a high demand. This is similar to the case of dry
docks. There are not enough slots in the shipyards making an imbalance between what the

84
shipowners demand and what the shipyards can supply. As discussed in the strategic
profitability analysis, Brazil does not have many commercial yards.
Importation of equipment/undeveloped supplier industry
The supplier industry in Brazil is quite undeveloped, forcing shipowners to import a big
share of their equipment from abroad in order to get the quality they want. When building
vessels in Brazil it is quite normal that equipment like engines, winches, thrusters or cranes
are imported. There is no law or regulation forcing the shipowner to have a certain amount
of local content. All vessel built in Brazil can fly the Brazilian flag, independent on the
amount of local content used under construction. The shipowners might however have a
local content requirement in their contract with Petrobras. It is normal that 30-60% of the
vessels value is related to equipment imported from abroad, on which a large amount of
taxes are paid, causing an increase in the price of the vessel. It is possible to avoid this tax if
the shipyard is able to document that similar type of equipment is unavailable in Brazil. But
even though this is the case, you will still have to deal with transportation and logistics
costs, customs and extra time spent during the importation process.
Time of construction - delays
The construction of a vessel in a Brazilian shipyard could easily take 30 months instead of
18, which is how fast it can be done under optimal circumstances. If the shipowner already
has a contract with Petrobras, the delay could be very expensive. First of all, the shipowner
would lose its day-rate. In addition, the shipowner has to pay a penalty of 50% of the day-
rate each day the vessel is delayed. If the vessel is one year late the cost of the vessel is
suddenly much higher than forecasted. Depending on the contract agreement between the
yard and the owner, some of the costs related to the delay could be charged to the
shipyard.
Lack of quality in labor force
Because qualified labor is a scarce resource in Brazil it is hard for the yards to get a well-
educated workforce, especially good engineers. This low supply leads to high labor costs. In
many cases, both the competence and the productivity of the Brazilians are worse than for
comparable workers in other oil and gas regions, like the North Sea or Australia.
Having shortly described the drivers behind the shipbuilding cost in Brazil the question now
is whether shipowners should build vessels in Brazil or not…?

85
7.2.3 Advantages and disadvantages of building vessels in Brazil
Most shipowners and brokers in Rio have said that there are few or no advantages related
to building ships in Brazil. It’s more costly, it takes more time and the quality is worse than
in Norway. There are however some companies building, thus some advantages do exist.
Siem Offshore got delivery of Siem Atlas in 2013 and will receive Siem Giant in 2014, both
PSV 4,700 dwt. Deep Sea Supply got delivery of the PSV 4,700 dwt Sea Brazil in 2012/13, and
DOF is building 2 PLSV and 2 AHTS with scheduled delivery between 2016-2017 and 2014-
2015 respectively. DOF Brasil (Norskan + DOF Subsea) is the Norwegian shipowner with the
largest amount of Brazilian flagged vessels, many of them built between 2003 and 2010.
Few shipowners have plans of building vessels the next couple of years.
We will now take one step back, and evaluate the advantages and disadvantages of building
vessels in Brazil with an objective perspective.
Advantages
The advantages related to building ships in Brazil are not measurable, thus it is hard to rank
them. The impression we have from the shipowners is that the priority of the Brazilian flag,
the financing and the ability to get higher rates because of local content are the 3 most
important advantages.
Priority of BRL-flagged vessels and blocking opportunity
The priority of the Brazilian flag is based on rules made by ANTAQ - The National Agency of
Waterway Transportation in Brazil (Westshore Shipbrokers, 2013). ANTAQ has created rules
forcing all contracts between oil-companies and INT-flagged vessels to be circulated in the
market every 12 month. This makes it possible for BRL-flagged vessels, with the same
specifications, to block the contracts, and potentially steal it from the international vessels.
When a contract is blocked, the INT-flagged vessel must stop its operations until the
blockage is removed. As long as the BRL flagged vessel complies with the specifications in
the contract, it can block any INT-flagged vessel. This means that one vessel can potentially
block an unlimited amount of vessels, causing a complete stop in Petrobras’ operation. The
shipowner blocking the contract forces Petrobras into direct negotiations. The shipowner
with a BRL flagged vessel will normally not accept the same dayrate as the INT-flagged
vessel had in the contract, as it is not enough to break-even because of the high CAPEX
related to building in Brazil. But Petrobras does not take local content (Brazilian flag) at any
86
price, and will in some cases rather take a fight with ANP (Agência Nacional do Petróleo)
who is the authority in these processes, and risk getting a fine instead of accepting a higher
rate for a BRL-flagged vessel. Usually, Petrobras ends up with a solution where both the
company blocking and the company getting blocked get a contract. It has, in fact, never
happened that an INT-flagged vessel has lost its contract due to a blocking. The main reason
for this is that Petrobras has needed all the vessels and because ending a contract with an
INT-flagged vessel sends out a negative signal to the market. If an INT-flagged vessel loses its
contract it would seem more risky for the foreign owners to bring their international vessel
to Brazil and this could potentially reduce the competition among the shipowners.
Even though Petrobras have rejected BRL-flagged vessels because of their high dayrate
requirements, the priority of the Brazilian flag and the ability to block gives the shipowners
insurance that they will always have a contract. It is however not sure whether they will get
a premium as a result of the local content provided by them to Petrobras. Some companies
say that INT- and BRL-flagged vessel get the same dayrate, while other say that they get as
much as a 20% premium and that Petrobras understands that a BRL-flagged vessel has a
higher OPEX and a higher CAPEX compared to internationally built vessels. Whether the
company receives a premium or not, also depends on the segment. In the AHTS and CSV
segments competition is lower with few Brazilian flagged vessels making it possible to
obtain good rates, especially for the high-end subsea vessels. The PSV-segment on the other
hand, has been particularly difficult for the Norwegian shipowners. Several Norwegian
shipowners have built expensive (75-80M$) high-end PSVs with international specifications,
while companies like Edison Chouest5 have built, and are building less complex and cheaper
vessels adapted only to the Brazilian market and Petrobras’ requirements. The strategy
behind the Norwegians choice of vessel is that they want to build a vessel that potentially
could operate in a different region. By building a vessel with high specifications this
becomes easier. For Edison Chouest, who is building vessels for Petrobras specifically, it
might be harder to move the vessel to another region. Both types of vessels have BRL-flag,
but the Norwegian companies cannot compete on price with the vessels supplied by Edison
Chouest. When owners with advanced features on their vessels require higher rates from
the charterer (Petrobras), the charterer answers that they did not ask them to build a Ferrari
5 Edison Cheoust (BRAM) – One of world’s largest OSV companies. American orgin, but operate globally.

87
instead of a Volkswagen Golf. This makes it difficult for the Norwegian companies with
expensive PSVs to obtain good day-rates. And an owner could risk not getting a contract on
the BRL-flagged vessel, regardless of the flag priority. The value of the blocking ability is hard
to price, but it should (in theory) be a guarantee for the shipowner that he will always have
a contract.
Financing
The financing of vessels built in Brazil normally consist of financing from several institutions.
The local content can be financed through a Brazilian bank like BNDES (The Brazilian
development bank), using funds from FMM - Maritime Marine Fund. The company ordering
the vessel must provide a bank guarantee from for example DNB to get the loan from
BNDES, a corporate guarantee from the mother company is normally also provided. The
international content of the vessel could be financed by Export Credit Norway or another
financial institution. In the case of Export Credit Norway a bank guarantee from GIEK
(Guaranty Institute Export Credit) and another bank like DNB must be provided as well (DNB
Finance Seminar Rio Oil & Gas, 2014).
The shipowners in Brazil emphasize that the financing from FMM is world class. The cheap
and long maturity loans from FMM are definitely a benefit of building ships in Brazil. For
local content, FMM can provide loans covering 90% of the investment, with maturity up to
20 years and interest rate as low as 3%. This is very competitive compared to conditions
offered by other financial institutions. As an example, the repayment period for loans with
normal commercial banks is 6-10 years while it is 12 years with Export Credit/GIEK.
However, some of the shipowners we interviewed in Norway, pointed out that FMM had
given out a lot of lucrative loans through BNDES the last 10 years, and that this had caused
the terms and conditions on new loans to be worse than before, because of less capital left
in the fund.
Local content
The protection and priority of the local content by ANTAQ described above is a measure to
stimulate the development of the Brazilian shipbuilding industry. Oil companies in Brazil
have requirements from ANP in terms of the amount of local content used in their projects.
Over the years ANP has had 11 auctions of oil licenses. The last auctions had strict minimum
requirements on local content, and the bidders were preferred if they used more local

88
content. As a consequence, some fields have local content requirement as high as 60-70%.
These requirements make the BRL-flagged vessels more attractive than the INT-flagged
vessels that have 0% local content. The cost for oil companies related to chartering OSVs is a
quite small part of their total cost, but it is still an important way for the oil companies to
satisfy their local content requirements. Especially for OSVs operating for international oil
companies (IOC) that use international rigs without local content. Since the rate on offshore
oil rigs is much higher than that of the OSVs, hiring Brazilian rigs is however a better way to
cover the local content requirement. Lastly, we do want to stress that the day-rates are
more dependent on the market situation, rather than the %-rate of local content in the
vessel.
Easier to recruit qualified people
As mentioned earlier, finding the right crew is not easy in Brazil. There has been a lack of
well-educated and trained officers leading to a big increase in salaries the last 10 years.
Having a large BRL-flagged fleet gives an advantage to the shipowners in the recruiting
process. On BRL-flagged vessels 100% Brazilian crew is required, meaning that not only the
able seamen are Brazilian but the chief engineer and the captain too. The chance of
becoming an officer in a company with a large BRL-fleet is much higher than in a company
with only INT-flagged vessels. On INT-flagged vessels up to 67% BRL crew required (RN72),
but the officers are often foreign. The fact that the chance of becoming a captain is higher
on a BRL-flagged vessel attracts people, and gives the company a better opportunity to get
the best qualified crew. This could potentially also put less pressure on crew salaries.
Ability to get EBN
As mentioned earlier a Norwegian shipowner must have an EBN to be able to enter into
contract agreements with oil-companies in Brazil. With their own EBN the international
shipping company avoids going through a third party. Building a vessel in Brazil is one of the
ways to be recognized as an EBN.
No import cost on vessel
The INT-flagged vessels are imported to Brazil under the REPETRO regime. Under this
regime the shipowners are obliged to pay 3% of the vessels value in tax (ICMS) to the
Brazilian government. BRL-flagged vessels avoid this, but they do however pay higher taxes
related to revenues and income, we will come back to this under disadvantages.
89
Showing signal of commitment to Brazil
This is probably more important than one might think. When a vessel is built in Brazil, it is
built to operate in Brazil, otherwise it would have been better to build it elsewhere, with
lower price and probably higher quality. This geographical inflexibility is in itself a
disadvantage. But this means that companies building ships in Brazil show the Brazilian
government (and Petrobras) that they are committed to their business in Brazil, and that
they have a long-term perspective. Petrobras prefers doing business with companies that
are committed to the industry. It means something for the Brazilians if companies will stay
not only for years, but also for generations. Relations are important in the Brazilian culture,
and is something that could make them value that companies are committed to their work
and presence in their country.
Brazilian vessels use Brazilian equipment
A few shipowners have mentioned that it could be advantageous to have a BRL-flagged
vessel rather than an INT-flagged vessel because of the high taxes related to import of goods
and services on INT-flagged vessels. These shipowners say that their OPEX for the BRL-
flagged vessels is lower than for the INT-flagged vessels because the technical cost for the
INT-flagged vessel is high due to import of equipment and spares from abroad. The Brazilian
vessels avoid this because they can use domestic suppliers. The reason why the INT-flagged
vessels are forced to import could be company procedures or simply that they must do it for
warranty reasons, or to make sure they get the same quality. The OPEX being lower on BRL-
flagged vessels, like in this scenario, is nevertheless the exception rather than the rule.
Disadvantages
High CAPEX
As mentioned, the cost of building a high-end PSV in Brazil is between 60 and 80M$ while it
costs from 50-60M$ (30-40% lower) in Norway. The building cost in Brazil could be more
than twice as expensive as building in the Far East. In isolation, this is as an argument
against building vessels in Brazil. Higher initial investment means that the company needs
higher day-rates to break even. A world class financing from FMM/BNDES could, to a certain
degree, compensate for the high CAPEX, but it is still not enough to justify the purchase of a
vessel.

90
Time - Risk of construction delays
Most shipowners say that it is unpredictable to build vessels in Brazil; you have to expect
delays. Some companies said the time could be exceeded by 50%. Normally, it should take
about 2 years to build a vessel. In Brazil however, it could easily take closer to 3 years to
finalize a vessel. DOFs financial report for Q1 2013 illustrates the issue of delays in Brazil.
DOF had delays on all of their 3 AHTS under construction in Brazil at that time. Another
example is Deep Sea Supply’s Sea Brazil (PSV 4700 dwt) that was delayed about 9 months
(Tradewinds, 2012). The construction delays increases the cost of building the vessel, and
the companies also risk receiving penalties from Petrobras. If the vessel was supposed to
start a contract with Petrobras the 1st of January but was not delivered on time, Petrobras
penalize the shipowner with 50% of the day-rate every day that the vessel is late. Some of
this could maybe be charged to the shipyard, depending on contract terms, but doing that is
also a risk, because it could make the shipyard go bankrupt. Lately (2014), the shipyard EISA,
where the Brazilian Shipping Company Astro Maritima is building vessels, closed down for
several months showing how risky it can be to build vessels in Brazil (Hellenic Shipping
News, 2014).
Quality
Initially one cannot say that the quality of a vessel built in Brazil is worse than on a
Norwegian built vessel. Equipment like, generators, thrusters, engines and propellers (40-
50% of vessel value) is normally imported from well-known suppliers like, Rolls Royce,
Wartsila, Man, NOV, etc. The commissioning of the vessels’ hull and its equipment is
however not as good as in vessels built in Norway, and it is normal that shipowners
experience problems with their vessels after delivery from the yard because of bad
commissioning. The skills of the workers in Brazil are not world class, there is a lack of
productivity and they lack the state of the art technology in order to commission and build
the vessels in the same way as in Europe (Hellenic shipping news, 2014).
Increased OPEX
In general, Brazilian flagged vessels have higher OPEX than INT-flagged vessels. This means
that the shipowner needs a higher day rate for his BRL-flagged vessels to break even, not
only because of high CAPEX, but because of a higher OPEX. As this is already elaborated on
earlier in the OPEX section, the details will not be discussed here.

91
Revenue tax and corporate tax
It is a disadvantage to have BRL-flagged vessels for tax purposes. As a Brazilian shipping
company you have to pay tax on the revenues and on the net income of the company. For
INT-flagged vessels up to 80% of the contract’s value (the charter part) could be sent back to
Norway without revenue and corporate tax. BRL-flagged vessels require a higher day rate to
compensate for the tax, making it more expensive for Petrobras (and other IOC) to charter
them. We will go more in detail on the tax system in Brazil in the next section.
In summary the most important advantages are the flag priority, blocking opportunity,
financing conditions from FMM and the ability to recruit Brazilian officers. The most
important disadvantages are the cost of the vessel, potential delays and quality. An
investment case comparing a vessel bought in Norway and a vessel bought in Brazil is
presented in chapter 9.
7.3 Comparison and summary of CAPEX Both dry docking and shipbuilding is more expensive in Brazil than in the North Sea. The
drivers behind the high dry dock prices in Brazil is mainly the lack of docking slots and the
lack of professional workers, the cost related to importation of equipment, and the delays in
the docking process. In North Sea on the other hand, the supply of docks and professional
workers is high, and the dock owners are reliable. The docking process goes smoothly,
without issues related to importation or getting a slot in the dock.
The main drivers behind the shipbuilding costs in Brazil is the lack of commercial yards, the
lack of professional workers and the delays that often (always) occur when building vessels
in Brazil. There is however some advantages related to building vessels in Brazil. Compared
to Norway there are regulatory benefit given to the shipowner when building in Brazil, like
the priority of the Brazilian flag, and the financing provided from FMM. But the price you
pay for the vessel is high, the vessel is often not delivered on time, and you might not get
the same quality as you would in Norway, where the world’s leading builders of advanced
offshore shipping vessels are located.
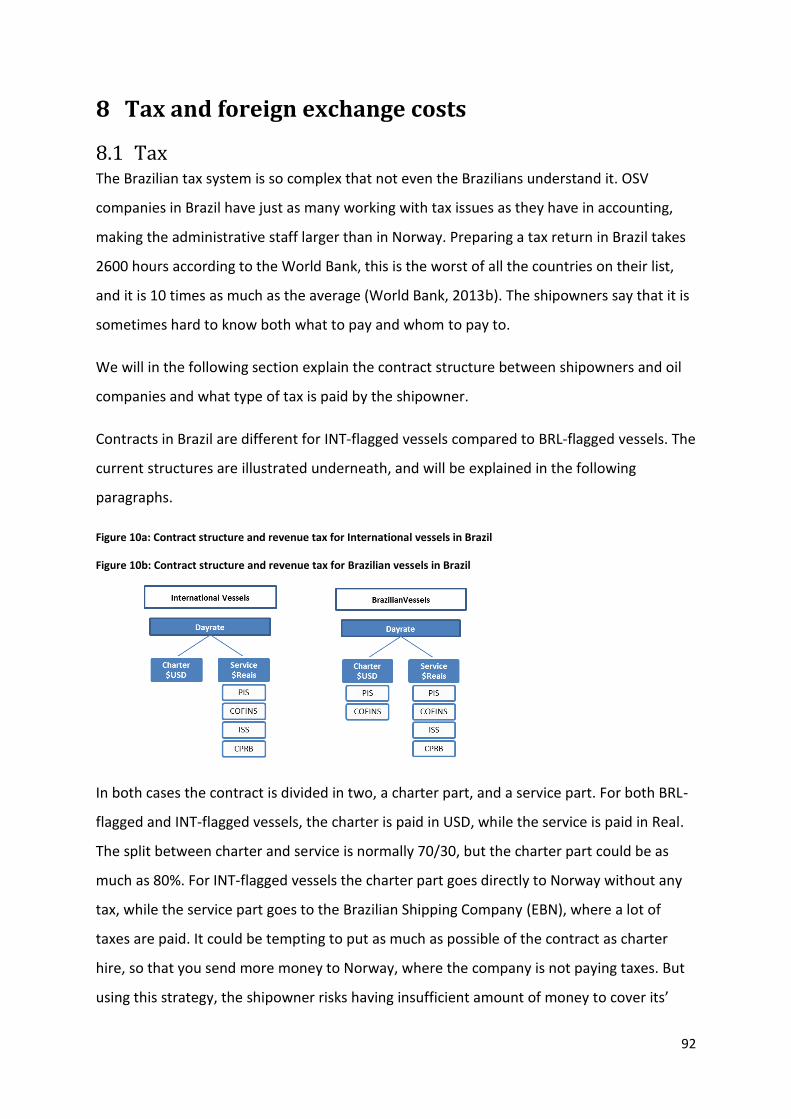
92
8 Tax and foreign exchange costs
8.1 Tax The Brazilian tax system is so complex that not even the Brazilians understand it. OSV
companies in Brazil have just as many working with tax issues as they have in accounting,
making the administrative staff larger than in Norway. Preparing a tax return in Brazil takes
2600 hours according to the World Bank, this is the worst of all the countries on their list,
and it is 10 times as much as the average (World Bank, 2013b). The shipowners say that it is
sometimes hard to know both what to pay and whom to pay to.
We will in the following section explain the contract structure between shipowners and oil
companies and what type of tax is paid by the shipowner.
Contracts in Brazil are different for INT-flagged vessels compared to BRL-flagged vessels. The
current structures are illustrated underneath, and will be explained in the following
paragraphs.
Figure 10a: Contract structure and revenue tax for International vessels in Brazil
Figure 10b: Contract structure and revenue tax for Brazilian vessels in Brazil
In both cases the contract is divided in two, a charter part, and a service part. For both BRL-
flagged and INT-flagged vessels, the charter is paid in USD, while the service is paid in Real.
The split between charter and service is normally 70/30, but the charter part could be as
much as 80%. For INT-flagged vessels the charter part goes directly to Norway without any
tax, while the service part goes to the Brazilian Shipping Company (EBN), where a lot of
taxes are paid. It could be tempting to put as much as possible of the contract as charter
hire, so that you send more money to Norway, where the company is not paying taxes. But
using this strategy, the shipowner risks having insufficient amount of money to cover its’

93
operational costs in Brazil. Having a deficit in Brazil several consecutive years could also lead
to problems with the government. Some companies have been punished because the
government believes they have been doing tax evasion (sending too much money home,
high charter %). Each year, the contracts are escalated using the consumer price index in
Brazil. It is only the service part of the contract that is escalated over the years. This
escalation has been lower than the inflation rate causing operational margins to decrease
over the years.
For the revenues paid to the Brazilian Shipping Company, there are 4 main taxes that could
occur: PIS6, COFINS7, ISS8 and CPRB9.
PIS and COFINS are taxes paid both on the charter and the service contract. PIS, is 7,60% of
gross revenue, while COFINS is 1,65% of gross revenue. In addition to PIS and COFINS, ISS
and CPRB is also paid on the service part of the contract. ISS is a city tax and should be paid
to the city where the service is performed. For the OSV-companies that are operating on the
whole Brazilian continental shelf, one solution is to pay to the city where you have your
headquarters. The ISS tax varies depending on the city it is paid to and what type of service
that is conducted. ROV service has a different tax-rate than PSV-service for example. The
rate is normally somewhere between 2,5% and 5% of gross revenues. The last tax is the
CPRB, which is 1 or 2% of gross revenues. The CPRB tax is replacing a former tax on salaries,
thus this change is beneficial for companies that have a lot of workers. OSV-companies
profit from this change. Overall, more revenue tax is paid for the Brazilian vessels, than for
the international vessels. The Brazilian flagged vessels pay between 10 and 15% on the
service part and 9,25% on the charter part. The INT flagged vessels pay 10-15% on the
service part and 0% on the charter part.
Petrobras has introduced a new contract structure for new Brazilian tenders. INT-flagged
vessel are not affected by this, thus they have the same contract structure as before. The
proposed contract structure for the BRL-flagged vessels is that there is only one contract
6 Contribution to the Social Integration Program (PIS)
7 Contribution to Social Security Financing (COFINS)
8 Tax on services (ISS)
9 Social Security Contribution on Gross Revenue (CPRB)

94
(Brazilian TC). Both service and charter is paid together in USD, where the taxes paid are
only PIS, COFINS and CPRB, thereby avoiding the payment of ISS. This contract is designed
by Petrobras, but is still involving some risk. The government could come after the OSV-
companies at a later stage and require them to pay the service tax (ISS). The difference in
tax payment as a result of this newly proposed contract structure is small.
Shipping companies in Brazil are also paying corporate tax of 34%, giving an incentive to
Norwegian shipowners to have a lower surplus in Brazil and a higher one in Norway where
the corporate tax for shipowning companies is almost 0% (only tonnage tax for shipowning
companies).
8.2 Financial Cost - Currency - FX risk The currency issue in Brazil is an important factor. Income received by the shipowners in
Brazil is split between USD and Real as explained in the previous chapter. The OPEX is
mostly paid in Real, especially for the Brazilian flagged vessels, where 100% of the crew is
Brazilian and thereby receive their salaries in Real. Part of the CAPEX related to dry-docking
is also paid in Real. This means that the company has a risk related to fluctuations in the
exchange rate.
As earlier mentioned the contract is split in two parts. Since the service part is set in Real
and the charter part in USD, the total USD dayrate will vary based on the USD/Real
exchange rate. If the company is not able to cover all the Real cost with the service contract,
dollars from the charter contract must be used to cover the extra cost.
The Real has been strong compared to the dollar the last couple of years, especially before
2012. Companies that are not able to cover their Real cost with the service part of the
contract must cover the extra cost by exchanging the dollar part of the contracts to Real.
Since the Real has been strong the dollar amount used to cover these extra costs has been
high. A strong Real is thus driving the cost in Brazil. This is true both for operational costs
and capital expenditures.
As seen in the graphic below, the USD/Real exchange rate has increased the last couple of
years, meaning that the Real is weaker against the dollar. A weaker Real (increase in
USD/Real exchange rate) has been good for the shipowners. A weaker Real makes the

95
salaries for the employees less expensive for the shipowners. Several shipowners believe
that the Real should be even weaker in the future.
Figure 11: Development in USD/Real exchange rate last 3 years
(Bloomberg, 2014)
9 Investment case: Brazil vs. Norway In this chapter, a comparison between two different business cases is done using the Net
Present Value method. The question we are asking is: “Where should Norwegian offshore
shipping companies invest in their next vessel, Norway or Brazil?
Thus, the first case is an investment in a Norwegian built vessel, meant to operate on an 8-
year term contract in Norway, before it is sold in year 8. The second case is an investment in
a Brazilian built vessel, meant to operate on an 8 year term contract in Brazil, before it is
sold in year 8. The methods and assumptions used in the valuation of the two cases are
presented first. Then the result is analyzed with the help of sensitivity analysis.
9.1 Methodology To create an understanding of the methodology behind the valuation of the two investment
cases, we will shortly describe the principles of valuation. This chapter is based on Berk and
DeMarzos “Corporate Finance” (2011) unless otherwise stated.

96
Time Value of Money
A project that runs over a period of time will both receive payments and pay invoices. Since
this inflow and outflow of cash will happen at different points of time during the project, we
create a cash flow to gain the necessary overview. The stream of cash is presented over a
timeline, as in the following example.
𝑇𝑖𝑚𝑒
𝐶𝑎𝑠ℎ 𝑓𝑙𝑜𝑤
The cash flow above is an example, and every project will have a different timeline and cash
flow structure. To be able to compare different projects we need an equal measurement at
the same point in time. To move the cash flows back to the same period is known as
compounding, and by doing this we will find the present value of the cash flow.
𝑃𝑟𝑒𝑠𝑒𝑛𝑡 𝑣𝑎𝑙𝑢𝑒 = 𝐶𝐹0 +𝐶𝐹1
(1 + 𝑟)+
𝐶𝐹2
(1 + 𝑟)2+ ⋯ +
𝐶𝐹𝑇
(1 + 𝑟)𝑇
“CF” denotes the cash flow, “r” the discount rate and “T” represents the time. To find the
present value, the rate could simply be the inflation of the currency of the cash flow. The
rate however should incorporate all the risks and uncertainties of the project.
Internal Rate of Return
The internal rate of return (IRR) is the interest rate of which the present value of a cash flow
is equal to 0. This measurement can be useful to find the expected total yield on the
investment.
0 = 𝐶𝐹0 ∑𝐶𝐹𝑇
(1 + 𝐼𝑅𝑅)𝑇
𝑁
𝑇−1
1
-1000,-
2 3
5
4
1000,-
1000,-
1000,-
1000,-

97
It is important to note that different projects cannot be compared against each other based
on the IRR. The method does not take into account the risks, the size of investments and the
size of the cash flows.
Net Present Value
The two different projects that are under evaluation will not only vary in the aspects of time
and cash flows, but also in various other areas. This can be related to regulations,
operations, and markets. Even with the wide variety of elements in a project, it is still
necessary to evaluate them on the same basis to make an informed decision.
These different elements of the project are accounted for in the discount rate. The discount
rate should therefore be an expression for the return required for the firm to accept a
project, based on its risk profile.
The traditional way of computing the required rate of return is with the Capital Asset Pricing
Model (CAPM). If you can find a stock with the similar descriptions and risk profile as the
project, you can use the market information to find the required return.
𝑟 = 𝑟𝑓 + 𝛽𝑖 × (𝐸[𝑅𝑀𝑅𝐾])
Where 𝑟𝑓 is the risk free rate, 𝛽𝑖is a measure of the risk relative to the market, and
𝐸[𝑅𝑀𝑅𝐾] is the expected excess return from the market.
To value the two projects we discount the free cash flow to equity (FCFE). The FCFE = Net
income - Net CAPEX - Change in Net Working Capital + New Debt - Debt Repayments.
Different discount rates will be used in the two investment cases, reflecting the risk related
to the two projects.
As the investor in this scenario is a Norwegian shipowner the risk free rate used is the
interest rate on a 10-year Norwegian government bond which is 2% (Trading Economics,
2014a). The risk free rate is reflecting the opportunity cost for the investors. One could
argue that all investors could invest in any market and that it would make more sense to use
a global risk free rate, like a 10 year US government bond. We have however decided to use
the rate on Norwegian government bonds as most Norwegian shipowners are based in
Norway. This is also in line with the study conducted by PwC and the Norwegian Society of
Financial Analysts (NFF), where 50% of the participants said that they use 10 year
98
government bonds as the risk free rate (PWC, 2014). For investments with a short horizon 3-
month NIBOR rate can be used as the risk free rate, but as the horizon of investment under
evaluation is 8 years we argue that the 10-year Norwegian government bond rate better
reflect the risk free rate.
Further, 𝛽𝑖 is calculated using the average unlevered beta for all Norwegian offshore
shipping companies on Oslo Stock Exchange. As we do not have any target capital structure,
the levered beta is calculated using the average leverage ratio for the offshore shipping
companies in the sample, resulting in a levered beta of 1,8. The market premium is 5% and
is based on the study conducted by PwC and NFF (PWC, 2014). By using CAPM, this gives a
required return on equity of 11% in Norway.
We argue that the investment in Brazil is related with more risk. This view is based on the
analysis we have done throughout the thesis, where we have found several reasons why
operating in Brazil is more risky. A challenging client could result in loss of hire due to more
downtime. Delays in the docking process would also affect the utilization for the vessel.
These factors are already accounted for in the cash flow. However, there are other country
specific factors that increases the risk in Brazil compared to Norway. As an example, Brazil
ranks a lot worse than Norway on the ease of doing business index. This is discussed more in
detail in the CAGE-analysis in chapter 5. As a consequence of the additional risk in Brazil, a
risk premium should be added to the discount rate.
By looking at Norway and Brazils credit ratings presented by Fitch, the credit rating for
Norway is AAA while the credit rating for Brazil is BBB (Trading Economics, 2014b). This
rating is measuring countries default risk, which is affected by many of the same reasons
that drive the equity risk, for instance its currency, budget and trade balance and political
stability (Damodaran, 2014). The difference in credit rating supports our decision of adding a
country risk premium for Brazil.
For the investment in Brazil, we have decided to add a country risk premium of 2% to the
discount rate used when valuing the project in Norway. This results in a required return on
equity of 13%. In order to check the effect different discount rates have on the value of the
project, we conduct a sensitivity analysis.

99
9.2 Assumptions Some simplifications are done in the valuation of the two investments. The financial
structure for investments like these is more complicated than what we explain, so is the
escalation in dayrates and OPEX. The assumptions we take do however give a good picture
of the reality and should thus be reasonable.
Net income
The dayrates are averages calculated based on information from shipbrokers, while
utilization and OPEX is based on information from interviews and financial
statements. Sales, general and administration cost is excluded in the valuation of the
investment case.
The growth in the dayrates and OPEX is based on inflation. In Norway, only the
dayrate related to OPEX is escalated, while the dayrate related to financial costs
(depreciation + interest) and operating margin is not. The OPEX is escalated using an
inflation of 2,5%, as this is the target inflation for the Norwegian Central Bank
(Norges Bank, 2014a).
In Brazil, 100% of the dayrate is escalated using inflation estimates. The long-term
inflation forecast for Brazil is 4,6% (Inflation, 2014). The growth in dayrates have
historically been a little under the inflation, thus 4% is used. The growth in OPEX
however, has historically been above the inflation thus inflation + 1,0% is used.
CAPEX and depreciation
The newbuildprice is an average number calculated based on information from
shipbrokers. The price for the AHTS in Norway is 107$M, while it is 125$M in Brazil.
Depreciation is calculated using a lifetime of 20 years; this is common in the industry.
In both cases, 100% of the payment is done when the vessel is delivered. In reality,
20% is often paid when the contract is signed and 80% on delivery.
The docking costs are based on information collected in interviews. Docking cost in
Brazil is assumed to be 40% higher than in Norway.
100
The second hand value of the vessel used in year 8 is the market value today of an
eight year old vessel ($85 500 000). In Norway the book value of the vessel in year 8
is $64 200 000 while it is $75 000 000 in Brazil due to higher purchasing price. Both
book values are lower than the estimated market value of the vessel. The use of the
market value instead of the book values in the valuation is still reasonable since this
is the price you will receive in the market today. We have not escalated the sale
price using an inflation index, even though the global price level, and thus the price
of the vessel, most likely will increase in the future.
Financial Cash flows
Financial cash flows are based on information provided by Export Credit and DNB.
In Brazil, Export Credit normally finances the foreign content, while local content is
financed by BNDES. For loans given from BNDES the financial terms depend on the
vessel’s local content. We assume that 60% of the vessel’s total value is local
content, thus 60% of the financing is done through BNDES and the rest (40%) is done
by Export Credit. As a result, BNDES will be able to provide a finance program with
80% leverage, 16,5 years maturity, with interest rate of 4,5%. For the Norwegian
content, Export Credit provides financing, with 70% leverage, 12 years maturity, with
interest rate of 5,2% (Interest rate Export credit + Guarantee GIEK/BANK + fees)
(Export Credit, 2014).
In Norway the financing is normally done by Export Credit. We assume that 100% of
the financing is done by Export Credit with the same terms as for Brazil, 70%
leverage, 12 years maturity, with interest rate of 5,2%.
The loans are paid back when the vessel is sold.
Other
We have assumed no change in working capital during the project.
9.3 Analysis See appendix for detailed valuation.

101
Case 1: Norway
Table 4: Valuation assumption Norway
Table 5: Valuation result Norway
The FCFE method gives a positive net present value of +4,87M$. This means that the
shipowner should invest in the vessel in Norway as it creates value for the shareholders. The
internal rate of return is 13,6%, which is higher than the required return on equity.
We believe that the parameters that most likely could change from the original scenario are
the second hand value of the vessel and the growth in dayrates. Both of these depend on
the market situation, and can change a lot from good to bad times. We have conducted two
sensitivity analyses where these two parameters are changed, at the same time as the
discount rate varies. The matrixes are shown in the appendix.
If we increase (decrease) the secondhand value of the vessel by 5 M$, while the discount
rate is kept constant at 11%, the NPV increase (decrease) by 2 M$. If the vessel is sold at
book value, the investment does not create value for the shareholders. Assuming that the
vessel is sold for 85,5M$ the discount rate must increase to 14% for the NPV to be negative.
With a discount rate of 11% the NPV is positive even with 0% growth in dayrates. At 1,7%
growth in dayrates the NPV is positive as long as the discount rate is lower than 14%.
Description Data Referecne
Newbuild price ($USD) 107 000 000 RS Platou
Salesprice estimate year 8 ($USD) 85 500 000 RS Platou
Day rates ($USD) 55 000 RS Platou
Utalization 95 %
OPEX ($USD) 16 000 RS Platou/Interviews
Growth in Dayrate 1,7 %
Growth in OPEX 2,5 %
Financing cost 5,2 % Export Credit
Levarage 70 % Export Credit
Maturity (yr) 12 Export Credit
Valuation
Required return on equity 11 %
Net present value ($USD) 4 873 572
Internal rate of retrun 13,6 %

102
Case 2: Brazil
Table 6: Valuation assumptions Brazil
Table 7: Valuation result Brazil
The FCFE method gives a negative net present value of -13,2M$. This means that the
shipowner should not invest in the vessel in Brazil as it destroys value for the shareholders.
The internal rate of return is 3,8%, which is lower than the required return on equity.
We have conducted the same sensitivity analyzes as for the investment in Norway. The
matrixes are shown in the appendix.
At 11% discount rate, the vessel would need to be sold for 115,5M$ for the investment to
be profitable. This price is pretty unrealistic as it is almost 35% higher than the current
market value for 8 year old AHTS.
In the sensitivity analysis where the growth in dayrates and the discount rate is changed, the
growth rate needs to increase a lot to get a positive NPV. With a discount rate of 13% the
growth rate has to be 10% for the NPV to be positive. If we reduce the discount rate to 11%
the growth rate still has to be 9% to give a positive NPV. Some investors might think this is a
likely scenario, as Brazil and Petrobras is expecting a huge growth in the oil production the
next 5-8 years.
Description Data Referecne
Newbuild price ($USD) 125 000 000 RS Platou
Salesprice estimate year 8 ($USD) 85 500 000 RS Platou
Day rates ($USD) 65 000 RS Platou
Utalization 90 %
OPEX ($USD) 20 000 RS Platou/Interviews
Growth in Dayrate 4,0 %
Growth in OPEX 6,1 %
Financing cost BNDES 4,5 % DNB
Levarage BNDES 80 % DNB
Maturity (yr) BNDES 17 DNB
Financing cost ExportCredit 5 % Export Credit
Levarage ExportCredit 70 % Export Credit
Maturity (yr) ExportCredit 12 Export Credit
Valuation
Required return on equity 13 %
Net present value ($USD) 13 239 284-
Internal rate of retrun 3,8 %

103
There are several reasons why the investment in Brazil is not profitable. The three main
reasons are the higher newbuild price, the higher cost of docking and the tax paid both on
revenues and net income. The EBITDA margin in Brazil is decreasing quite a lot over the
projects lifetime due to OPEX increasing more than the dayrate.
9.4 Recommendation Based on the investment case, Norwegian offshore shipping companies should invest in an
AHTS in Norway. The valuation result of the investment in Norway is mainly driven by the
assumed secondhand value and the high utilization. The market situation in offshore
shipping can change quickly which would have a strong impact on our assumptions and the
profitability of the case.
It is harder to see how the project in Brazil could lead to value creation for the equity
holders. This result is in compliance with what we have learned throughout our research
both the acquisition and the operation of vessels are more expensive in Brazil. The
shipowners are not always compensated in the dayrates even though the vessel flies the
Brazilian flag and provide local content for the charterer. However, a boom in the Brazilian
oil and gas industry could lead to a more attractive market and a different conclusion. Even
though a booming market would increase the dayrates, it would also attract vessels from
other regions and thereby increase the supply and push dayrates down again.

104
Part 3: Conclusion and further research
10 Conclusion This study investigates the main drivers for operational and capital expenditures related to
operation of PSVs, AHTS’ and CSVs in Brazil and how this differs from the North Sea. The
study also assesses where Norwegian shipowners should invest in their next OSV. Our
analysis is based on interviews with 9 different shipowners, industry and annual reports as
well as interviews with other key actors in the offshore shipping industry.
To better understand the cost drivers within the OSV industry, we have in the first part of
our study analyzed the external environment offshore shipping companies are facing in
Norway and Brazil. The result indicates that the outlook for the offshore shipping industry is
challenging. The future demand for OSVs is uncertain due to predictions of low oil price and
thereby reduced E&P spending and lower rig activity. Based on the strategic profitability
analysis the industry does not look very attractive and there is no sign of “super profit” in
the current market landscape. This is mainly because of high rivalry among the OSV
companies, low entry barriers for new players and high bargaining power of buyers and
suppliers. The country analysis revealed large differences between Brazil and Norway, which
is something Norwegian shipowners have to acknowledge before deciding to enter the
Brazilian market.
In the second part of the study, we perform an analysis of the drivers behind OPEX and
CAPEX for offshore support vessel, and the differences between Brazil and the North Sea.
Based on our analysis we conclude that both OPEX and CAPEX are higher in Brazil than in
the North Sea.
The differences in OPEX are mainly related to crew and technical cost, which are the two
major parts of the OPEX. The difference in technical cost is driven by costs related to
importation of goods in Brazil. The difference in crew cost is mainly driven by governmental
regulations in Brazil. Shipowners are forced to have a certain amount of Brazilians onboard
their vessels and the crew cost is almost twice as high as the base salary because of social
benefits. The lack of well-educated professionals both onboard the vessels and in technical
105
positions onshore, drives up the cost of the crew. Breakdown cost is an additional cost
driving up the OPEX for vessels in Brazil. This cost has arisen due to strict rules created by
Petrobras. The difference in OPEX between Brazil and UK is larger than the difference
between Brazil and the Norwegian Continental Shelf (NCS). The difference between NCS and
the UK is solely due to Norwegian wage tariffs on vessels flying the NOR-flag.
In terms of CAPEX, the cost related to both dry-docking and shipbuilding is higher in Brazil.
Differences in dry-docking cost is mainly driven by the lack of dry-docks, but also by costs
related to importation of goods needed in the docking process. The differences in
shipbuilding cost are driven by few commercial yards present in Brazil, lack of professional
workers, as well as big delays in the building process mainly due to little experience among
the Brazilian shipbuilders.
The result of our study indicates that operation of offshore support vessels in Brazil is both
more challenging and more expensive than in the North Sea. Based on the investment case
we conducted in the end of our study we see that shipowners should not invest in a new
vessel in Brazil, which supports our findings and shows that the dayrates received in Brazil
are not high enough to cover the extra costs. By looking at the investment case, investing in
a vessel in Norway looks quite attractive given our assumption. A change in the market
situation can however change these assumptions substantially. At the moment we see
rough waters ahead for offshore shipping companies.
11 Limitations of the study and further research
Limitations
The scope of our study was defined in the beginning of our thesis. A lack of resources and
time meant that we would not be able to perform an analysis on a global level. To simplify
the task, we decided to focus only on two regions within the oil and gas industry, the North
Sea and Brazil. Further, the scope was limited only to Norwegian offshore shipping
companies that provided offshore support services to oil companies.
Including companies from other countries than Norway would add value to the study, but
would also require more time and resources. Because of our focus only on Norwegian
controlled companies our sample of shipowners becomes small (9), and we cannot

106
necessarily use this study to draw conclusions about offshore shipping companies
originating from other countries than Norway.
Our analysis of OPEX and CAPEX was performed using a qualitative approach. It was based
on semi structured interviews with shipowning companies, and other players within the
offshore shipping industry. This means that we have little or no quantitative data backing up
our findings, only some average numbers provided by the interview objects, and industry
experts.
In the analysis of OPEX the main focus was on the costs directly related to the operation of
the vessels. Costs related to administration and management, in addition to tax and foreign
exchange costs had less attention. This limitation means that we might not have been able
to cover “the whole picture”.
Further research
There are several studies in this area that could be interesting to carry out in the future. The
same study, as we currently have completed, could be carried out with a larger scope,
including companies originating from different countries, or with a focus on different
regions.
Further, the same type of study could be conducted using a quantitative approach. A
quantitative study would make it possible to test the findings in our study, while mapping
the average cost level in the industry and for the industry peers. The study would generate
additional value for the shipowners, as it makes them aware of their own performance
compared to the rest of the industry and the industry peers. A quantitative benchmark
study would require certain participation from the shipowning companies, for the results to
remain anonymous, and a professional clearinghouse would be needed in order to conduct
the study in a proper way, as no company specific information can be shared across the
participating companies.
Lastly, because the “rules of the game” in the offshore shipping industry change frequently,
especially in Brazil, a study similar to this one could be conducted again in 2-4 years with
different results.

107
12 Bibliography Abeam, 2013. Challenges and perspectives for the Offshore segment. [Online]
Available at: http://www.abeam.org.br/upload/ABEAM_NAVALSHORE_12AGO2013_en.pdf
[Accessed 14 August 2014].
Abeam, 2014. Frota de Embarcacoes de Apoio Maritimo em Operacao no Brasil - Junho / 2014, Rio
de Janeiro: Abeam.
ABRAN FGV Seminar, 2014. Norway X Brasil - The growing of the Brazilian Oil & Gas Industry and the
challenges on the regulation of the maritime and offshore support activities. Rio de Janeiro: s.n.
Bamberg, J., 2000. British Petroleum and Global Oil 1950-1975: The Challenge of Nationalism.
Cambridge: Cambridge University Press.
Banco Itau, 2014. Shipbuilding Industry in Brazil, Rio de Janeiro: Banco Itau.
Berk, J. & DeMarzo, P., 2011. Corporate Finance. 2. ed. Essex: Pearson Education.
Bloomberg, 2014. Bloomberg. [Online]
Available at: http://www.bloomberg.com/markets/rates-bonds/
[Accessed 25 November 2014].
Brazilian Secretery of Federal Revenue, 2013. Instrução Normativa RFB nº 1.415 - REPETRO. [Online]
Available at:
http://www.regimerepetro.com.br/documentos/legislacao/instrucao_Normativa_RFB_n_1.415.pdf
[Accessed 15 September 2014].
Bricki, N., 2007. Interview Analysis Tips. s.l.:Medisins Sans Frontiers.
Clarkson, 2014. Shipping Intelligence Database. [Online]
Available at:
http://www.clarksons.net/sin2010/register/Default.aspx?sValues=rOpt%3dsales%7crSel%3d3%7cZS
0_SHIP_TYPE%3dVO89%7ctitle%3dSales+Multi-Functional+Support+Offshore+Sales%7c
[Accessed 15 August 2014].
Creswell, J. W., 2007. Qualitative inquiry & reaserch design: choosing aming five approches. 3. ed.
Thousand Oaks, California: Sage Publications Inc.
Damodaran, A., 2014. QFinance - Measuring Country Risk. [Online]
Available at: http://www.financepractitioner.com/asset-management-best-practice/measuring-
country-risk?page=1
[Accessed 10 Desember 2014].
Deep Sea Supply, 2014. Annual Report 2013, Grimstad: Deep Sea Supply.
Denzin, N. K. & Lincoln, Y. S., 2000. The SAGE Handbook of Qualitative Reaserch. Thousen Oaks,
California: Sage Publication Inc.
DNB Finance Seminar Rio Oil & Gas, 2014. NBCC: Breakfast seminar. Rio de Janeiro: s.n.
108
DNB Markets, 2014. Offshore Supply, Oslo: DNB Markets.
DOF ASA, 2014a. Annual Report 2013, Austevoll: DOF ASA.
DOF ASA, 2014b. DOF Fleet. [Online]
Available at: http://www.dof.no/en-GB/DOF-Fleet/AHTS/Skandi-Skansen.aspx
[Accessed 10 October 2014].
DOF Brasil, 2014. Brasil in Brief, Rio de Janeiro: DOF Brasil.
E24, 2014. På 80 dollar fatet er faren stor for at det kun er Sverdrup som blir bygget ut. [Online]
Available at: http://e24.no/energi/paa-80-dollar-fatet-er-faren-stor-for-at-det-kun-er-sverdrup-som-
blir-bygget-ut/23308351
[Accessed 31 October 2014].
EF, 2014. English Proficiency Index. [Online]
Available at: http://www.ef.no/epi/
[Accessed 3 November 2014].
Eksportkreditt, 2014. Lånebetingelser, Oslo: Eksportkreditt.
Farstad Shipping, 2014. Annual Report 2013, Ålesund: Farstad Shipping.
Financial Times, 2014. News. [Online]
Available at: http://www.ft.com/intl/cms/s/0/226890ba-8754-11e3-ba87-00144feab7de.html
[Accessed 9 April 2014].
Gard, 2014. P&I, Rio de Janeiro: Gard.
Ghauri, P. & Grønhaug, K., 2010. Reaserch methods in Business Studies. 4. ed. Essex: Prentice Hall.
Ghemawat, P., 2007. Redefining Global Strategy: Crossing Borders in a World Where Differences Still
Matter. 1 ed. s.l.:Harvard Business Review Press.
Havila Shipping ASA, 2014. Subsea. [Online]
Available at: http://www.havila.no/fleet/subsea
[Accessed 15 October 2014].
Havila Shipping, 2014. Annual Report 2013, Fosnavåg: Havila.
Hellenic Shipping News, 2014. Brazilian Shipbuilding: An industry in crisis or growing pains. [Online]
Available at: http://www.hellenicshippingnews.com/brazilian-shipyards-industry-in-crisis-or-
growing-pains/
[Accessed 18 September 2014].
Hofstede, G., 2001. The Hofstede Center. [Online]
Available at: http://geert-hofstede.com/norway.html
[Accessed 14 November 2014].

109
IMO, 2014. International Convention for the Safety of Life at Sea. [Online]
Available at: http://www.imo.org/About/Conventions/ListOfConventions/Pages/International-
Convention-for-the-Safety-of-Life-at-Sea-(SOLAS),-1974.aspx
[Accessed 16 September 2014].
Inflation, 2014. Historic inflation Brazil - CPI Inflation. [Online]
Available at: http://www.inflation.eu/inflation-rates/brazil/historic-inflation/cpi-inflation-brazil.aspx
[Accessed 12 October 2014].
Jacobsen, J., 2014. Opportunities and Challenges in the Brazilian Shipping & Offshore Industry, Oslo:
Vieira, Rezende, Barbosa e Guerreiro Advogados.
Johannessen, A., Christoffersen , L. & Tufte, P. A., 2011. Forskningsmetode for økonomisk-
administrativt fag. 3. ed. Oslo: Abstrakt forlag.
K-Line Offshore, 2014. Annual report 2013, Arendal: K-Line Offshore.
Kongsberg Maritime, 2014. Dynamic Positioning - DP Systems. [Online]
Available at:
http://www.km.kongsberg.com/ks/web/nokbg0240.nsf/AllWeb/14E17775E088ADC2C1256A470031
9B04?OpenDocument
[Accessed 15 August 2014].
Kunskapssenteret, 2014. Beregning sosiale kostnader. [Online]
Available at: http://kunnskapssenteret.com/beregning-sosiale-kostnader/
[Accessed 30 October 2014].
Marine Insight , 2010. Dry Dock, Types of Dry Docks & Requirements for Dry Dock. [Online]
Available at: http://www.marineinsight.com/marine/dry-dock-types-of-dry-docks-requirements-for-
dry-dock/
[Accessed 16 September 2014].
Mason, A. C. & Sanjyot, P. D., 2012. Challenges and Opportunities in International Business v.1.0.
[Online]
Available at: http://2012books.lardbucket.org/books/challenges-and-opportunities-in-international-
business/index.html
[Accessed 10 November 2014].
Miles, M. B. & Huberman, A. M., 1994. Qualitativ data analysis: an expanded sourcebook. 2. ed.
Thousand Oaks, California: Sage Publications.
National Immigration Council, 2006. Normative Resoulution NR. 72. [Online]
Available at:
http://portal.mte.gov.br/data/files/FF8080812BAFFE3B012BC0D351D834A4/in_rn_20061010_72.pd
f
[Accessed 15 September 2014].

110
Norges Bank, 2014a. Inflasjon. [Online]
Available at: http://www.norges-bank.no/Statistikk/Inflasjon/
[Accessed 26 November 2014].
Norges Bank, 2014b. Indikatorer for Prisvekst. [Online]
Available at: http://www.norges-bank.no/Statistikk/Inflasjon/Indikatorer-for-prisvekst/
[Accessed 26 November 2014].
Norwegian Shipowners' Association, 2011. En reise i Rederiforbundets historie. [Online]
Available at: http://www.rederi.no/nrweb/cms.nsf/pages/historie
[Accessed 14 August 2014].
Norwegian Shipowners' Association, 2012. Norwegian offshore shipping companies - local value
creation, global success. [Online]
Available at:
http://www.rederi.no/nrweb/mm.nsf/lupgraphics/Norwegian_offshore_shipping_companies.pdf/$fi
le/Norwegian_offshore_shipping_companies.pdf
[Accessed 10 August 2014].
Norwegian Shipowners' Association, 2014. Quarterly information - shipping and mobile offshore
activities, Oslo: Norwegian Shipowners' Association.
Olje og Energi Departementet, 2013. Norsk oljehistorie på 5 minutter. [Online]
Available at: http://www.regjeringen.no/nb/dep/oed/tema/olje_og_gass/norsk-oljehistorie-pa-5-
minutter.html?id=440538
[Accessed 15 October 2014].
Olympic Shipping, 2014. Annual Report 2013, Fosnavåg: Olympic Shipping.
Pareto Securities Equity Reaserch, 2014. E&P Survey, Oslo: Pareto Securities.
Peng, M. W., 2009. Global Strategy. 3. ed. s.l.:Soth-Western, Cengage Learning.
Porter, M. E., 2008. Harvard Business Review. [Online]
Available at: http://hbr.org/2008/01/the-five-competitive-forces-that-shape-strategy/ar/1
[Accessed 15 September 2014].
Punch, K. F., 2004. Introduction to social research: qualitative and qualitative approaches. London:
Sage Publications.
PwC, 2014. The Norwegian Market Risk Premium 2013-2014, Oslo: PwC.
RS Platou, 2014. Global Support Vessel Monthly - November 2014, Oslo: RS Platou.
RS Platou, 2014. OSV Global Sector Report - Oct 2014, Oslo: RS Platou.
Safe Seas, 2009. Brazilian Pilotage - Wages, safety and monopolies. [Online]
Available at: http://safewaters.wordpress.com/2010/01/10/brazilian-pilotage-wages-safety-and-
monopolies/
[Accessed 18 November 2014].
111
Saunders, M., Lewis, P. & Thornhill , A., 2009. Reaserch Methods for Business Students. 5. ed.
s.l.:Pearson Education.
Siem Offshore, 2014. Annual Report 2013, Kristiandsand: Siem Offshore.
Solstad ASA, 2014. Annual Report 2013, Skudneshavn: Solstad ASA.
Statista, 2014. Avarage world wages. [Online]
Available at: http://www.statista.com/statistics/226956/average-world-wages-in-purchasing-power-
parity-dollars/
[Accessed 28 November 2014].
Statoil , 2014. Konseptvalg for Johan Sverdrup-feltet. [Online]
Available at:
http://www.statoil.com/no/NewsAndMedia/News/2014/Pages/13Feb_JohanSverdrup.aspx
[Accessed 5 October 2014].
Store Norske Leksikon, 2014. Store Norske Leksikon. [Online]
Available at: https://snl.no/Statoil_ASA
[Accessed 25 November 2014].
The Brazil Business, 2014. Brazilian Employment Law in a Nutshell. [Online]
Available at: http://thebrazilbusiness.com/article/brazilian-employment-law-in-a-nutshell
[Accessed 9 September 2014].
The Brazil Business, 2014. Enviromental Licensing in Brazil. [Online]
Available at: http://thebrazilbusiness.com/article/environmental-licensing-in-brazil
[Accessed 3 October 2014].
The Economist, 2013a. Tax Brazil. [Online]
Available at: http://www.economist.com/news/special-report/21586678-why-brazil-offers-
appalling-value-money-price-wrong
[Accessed 22 September 2014].
The Economist, 2013b. Infrastructure - The road to hell. [Online]
Available at: http://www.economist.com/news/special-report/21586680-getting-brazil-moving-
again-will-need-lots-private-investment-and-know-how-road
[Accessed 31 October 2014].
Tradewinds, 2011. Brazilian offshore market faces crew. [Online]
Available at: http://www.tradewindsevents.com/assets/Uploads/OM11-LL-BrazilianOffshore-
24.5.2011.pdf
[Accessed 26 November 2014].
Tradewinds, 2012. Deep Sea goes big in Brazil despite the challenges. [Online]
Available at: http://www.tradewindsnews.com/weekly/283382/deep-sea-goes-big-in-brazil-despite-
the-challenges
[Accessed 18 November 2014].

112
Trading Economics, 2014a. Tradingeconomics - Norwegian Government Bond 10Y. [Online]
Available at: http://www.tradingeconomics.com/norway/government-bond-yield
[Accessed 15 November 2014].
Trading Economics, 2014b. Tradingeconomics - Credit Ratings. [Online]
Available at: http://www.tradingeconomics.com/brazil/rating
[Accessed 12 December 2014].
Transparancy International, 2013. Corruption Preception Index. [Online]
Available at: http://www.transparency.org/cpi2013/result
[Accessed 31 October 2014].
Westshore Shipbrokers, 2013. Brazilian Wave - June 2013. [Online]
Available at: http://issuu.com/westshore/docs/brazilian_wave_june_2013
[Accessed 15 October 2014].
Westshore Shipbrokers, 2014. Brazilian Wave September 2014. [Online]
Available at: http://issuu.com/westshore/docs/brazilian_wave_-_september_2014
[Accessed 16 October 2014].
World Bank, 2013a. Ease of Doing Business in Norway. [Online]
Available at: http://www.doingbusiness.org/rankings
[Accessed 31 October 2014].
World Bank, 2013b. Time to prepare and pay tax. [Online]
Available at:
http://data.worldbank.org/indicator/IC.TAX.DURS/countries?order=wbapi_data_value_2013+wbapi
_data_value+wbapi_data_value-last&sort=asc
[Accessed 22 September 2014].
Yeo, A. & Øy, M. M., 2010. MarineMoneyOffshore. [Online]
Available at: http://www.marinemoneyoffshore.com/node/4011
[Accessed 15 Oktober 2014].
Yin, R. K., 2009. Case study reaserch: design and methods. 4. ed. Los Angeles, California: Sage
Publications.

113
13 Appendix Appendix 1: Interview guide ............................................................................................................... 113
Appendix 2: Valuation Norway ........................................................................................................... 117
Appendix 3: Sensitivity analysis discount rate and secondhand value Norway ................................. 117
Appendix 4: Sensitivity analysis discount rate and growth in dayrates Norway ................................ 117
Appendix 5: Valuation Brazil ............................................................................................................... 118
Appendix 6: Sensitivity analysis discount rate and secondhand value Brazil ..................................... 118
Appendix 7: Sensitivity analysis discount rate and growth in dayrates .............................................. 118
Appendix 8: Beta calculation .............................................................................................................. 118
Appendix 1: Interview guide
Interview subject
Name:
Company:
Position:
Age:
Sex:
Introduction
Purpose/parts of the interview
1. Analyze the cost structure for PSVs, AHTS’ and CSVs in Brazil and the related cost drivers, and how
the costs differ from Norway.
2. Market outlook
Define scope
In our study we will focus on PSV, AHTS, CSV.
The focus is mainly on the operational costs, costs related to docking and shipbuilding, tax and
finance costs.
1. Cost Structure
Part 1: Cost groups and drivers
What is the average daily OPEX in Brazil per vessel type? (PSV, AHTS, CSV)
1) Crewing.

114
a) Approximately how much does crewing represent of the total OPEX Brazil, and is this portion
different from Norway?
b) How many people are there on average on each vessel type?
c) What are the main drivers for crewing cost, and are they different in Norway?
d) How does the crewing cost differ for the different vessel types, and is this different in
Norway?
2) Technical costs.
a) Approximately how much of the total OPEX is related to technical cost in Brazil, and is this
portion different in Norway?
b) What are the main drivers for technical cost, and are they different in Norway?
c) How does the technical cost differ for the different vessel types, and is this different in
Norway?
3) Insurance
a) Approximately how much of the total OPEX is related to insurance cost in Brazil, and is this
proportion different in Norway?
b) What are the main drivers for insurance cost, and are they different in Norway?
c) Do you have the same insurance on the entire fleet or do you have different insurance in
each region.
4) Breakdown.
a) What type of breakdown cost do you have and approximately how much of the total OPEX is
related to breakdown in Brazil, and is this proportion different in Norway?
b) What are the main drivers for breakdown cost and are they different in Norway?
c) Is it normal to have breakdown more often on some vessels than others
5) Port and pilot fees, lube oil, bunkers and inspection,
a) Approximately how much of the total OPEX is related to port and pilot fees, lube oil, bunkers
and inspection cost in Brazil? Is this proportion different in Norway?
b) What are the main drivers for port and pilot fees, lube oil, bunkers and inspection cost, and
are they different in Norway?
c) How do the port and pilot fees, lube oil, bunkers and inspection cost differ for the different
vessel types? Is this different in Norway?

115
CAPEX
1) Dry dock
a. How much does it cost for a 5-year dry dock service for the different vessel types in Brazil
and is this different from Norway?
b. What are the main drivers for a dry dock, and are they different in Norway?
2) Shipbuilding: What are the advantages and disadvantage of building ships in Brazil, and what do
you see as the best option, building in Brazil or Internationally?
Other cost groups we want to discuss
3) Tax:
a) How does tax affect the decisions one are taking as a shipowner in Brazil?
b) How does the tax system affect the profitability of the business in Brazil, and what do you do
to minimize the taxes?
4) Currency:
a) How are you affected if there are big changes between REAL and USD?
2 MARKET OUTLOOK
OSV Market now and going forward (Not all the questions were asked in all interviews)
1. How has the type of oil fields and production units are used in Brazil/North Sea changed
over the years?
2. How has development for OSV in Brazil/North Sea been the last decades?
3. Who are the main players (Shipowners) in the Brazilian/North Sea market today? And what
is the competition like in the different segment? (High, medium, low)
4. How do the entry barriers differ for PSVs, AHTS, and CSVs? (High, medium, low)
5. Is it a competitive advantage to be able to provide the whole specter of OSV, instead of e.g.
just PSV?
6. How is the relationship/power between the shipowners and the suppliers (yards and
equipment suppliers)? (High, medium, low)

116
7. How is the relationship/power between the shipowners and the customers? (High, medium,
low)
8. Is there any backward integration in the industry? E.g. shipowners buying yards, or oil
companies buying offshore shipping companies.
9. What will drive the demand for offshore support vessel in the short and long term? Do you
see any differences between Brazilian and international flagged vessels?
10. Do you see a change in the demand for AHTS, after the introduction of rigs with DP-systems?
11. How do old vessels differ from new vessels in terms of safety, capacity, fuel efficiency,
reliability? How does this impact the attractiveness of the vessel in a tendering process?
12. What will happen to the supply of vessels? Are shipowners building more or less vessels than
before in Brazil/Norway?
13. How has the average utilization of the vessels developed over the years in your company, do
you see a better or worse future?
- Is this common for the whole industry?
14. What are key challenges going forward in the offshore support industry?

117
Appendix 2: Valuation Norway
Appendix 3: Sensitivity analysis discount rate and secondhand value Norway
Appendix 4: Sensitivity analysis discount rate and growth in dayrates Norway
Numbers in $USD
Year 0 1 2 3 4 5 6 7 8
Investment cost 107 000 000
Loans Export Credit 74 900 000 68 658 333 62 416 667 56 175 000 49 933 333 43 691 667 37 450 000 31 208 333 -
Dayrates (Revenue) 19 071 250 19 402 031 19 738 550 20 080 905 20 429 198 20 783 532 21 144 012 21 510 745
OPEX 5 840 000 5 986 000 6 135 650 6 289 041 6 446 267 6 607 424 6 772 610 6 941 925
EBITDA 13 231 250 13 416 031 13 602 900 13 791 864 13 982 931 14 176 108 14 371 403 14 568 820
EBITDA - margin (%) 69 % 69 % 69 % 69 % 68 % 68 % 68 % 68 %
Depreciation 5 350 000 5 350 000 5 350 000 5 350 000 5 350 000 5 350 000 5 350 000 5 350 000
EBIT 7 881 250 8 066 031 8 252 900 8 441 864 8 632 931 8 826 108 9 021 403 9 218 820
Interest expense Export Credit 3 718 161 3 394 843 3 071 524 2 748 206 2 424 888 2 101 569 1 778 251 808 296
Net Income before tax 4 163 089 4 671 189 5 181 376 5 693 658 6 208 043 6 724 539 7 243 152 8 410 524
Net income after tax 4 163 089 4 671 189 5 181 376 5 693 658 6 208 043 6 724 539 7 243 152 8 410 524
Change in debt
New debt Export Credit 74 900 000
Repayment Export Credit 6 241 667- 6 241 667- 6 241 667- 6 241 667- 6 241 667- 6 241 667- 6 241 667- 31 208 333-
CAPEX
Add back depreciation 5 350 000 5 350 000 5 350 000 5 350 000 5 350 000 5 350 000 5 350 000 5 350 000
Interim/Classification docking 5 000 000- 12 000 000- 6 000 000-
Sales price yr 8 85 500 000
CF to equity 32 100 000- 3 271 423 3 779 522 710 291- 4 801 991 6 683 623- 5 832 873 351 485 68 052 191
NPV year 0 4 873 572,24
IRR 13,6 %
NPV year 0 (M$)
4,87 65 500 000 70 500 000 75 500 000 80 500 000 85 500 000 90 500 000 95 500 000
4% 12 16 19 23 26 30 33
5% 9 12 16 19 22 25 29
6% 7 10 13 16 18 21 24
7% 4 7 10 13 15 18 21
8% 2 5 7 10 12 15 17
9% 0 3 5 7 10 12 14
10% -1 1 3 5 7 9 11
11% -3 -1 1 3 5 7 9
12% -4 -3 -1 1 3 5 6
13% -6 -4 -2 -1 1 3 4
14% -7 -5 -4 -2 -1 1 2
15% -8 -6 -5 -4 -2 -1 1
Second hand value
Re
NPV year 0 (M$)
4,87 0,0% 0,5% 1,0% 1,5% 2,0% 2,5% 3,0%
4% 19 21 23 25 27 29 32
5% 15 17 19 21 23 25 27
6% 12 14 16 18 20 21 23
7% 9 11 13 14 16 18 20
8% 7 8 10 11 13 15 17
9% 4 6 7 9 10 12 14
10% 2 4 5 6 8 9 11
11% 0 2 3 4 6 7 8
12% -2 -0 1 2 4 5 6
13% -3 -2 -1 0 2 3 4
14% -5 -3 -2 -1 -0 1 2
15% -6 -5 -4 -3 -2 -1 1
Re
Growth in dayrate
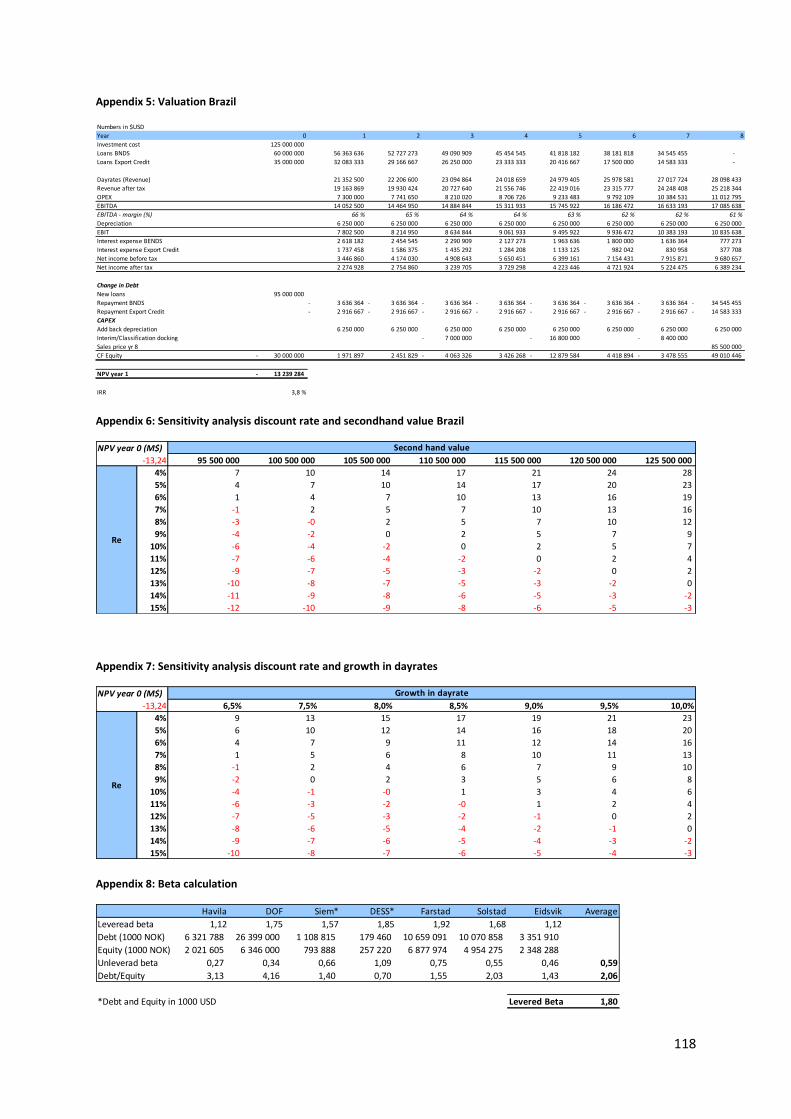
118
Appendix 5: Valuation Brazil
Appendix 6: Sensitivity analysis discount rate and secondhand value Brazil
Appendix 7: Sensitivity analysis discount rate and growth in dayrates
Appendix 8: Beta calculation
Numbers in $USD
Year 0 1 2 3 4 5 6 7 8
Investment cost 125 000 000
Loans BNDS 60 000 000 56 363 636 52 727 273 49 090 909 45 454 545 41 818 182 38 181 818 34 545 455 -
Loans Export Credit 35 000 000 32 083 333 29 166 667 26 250 000 23 333 333 20 416 667 17 500 000 14 583 333 -
Dayrates (Revenue) 21 352 500 22 206 600 23 094 864 24 018 659 24 979 405 25 978 581 27 017 724 28 098 433
Revenue after tax 19 163 869 19 930 424 20 727 640 21 556 746 22 419 016 23 315 777 24 248 408 25 218 344
OPEX 7 300 000 7 741 650 8 210 020 8 706 726 9 233 483 9 792 109 10 384 531 11 012 795
EBITDA 14 052 500 14 464 950 14 884 844 15 311 933 15 745 922 16 186 472 16 633 193 17 085 638
EBITDA - margin (%) 66 % 65 % 64 % 64 % 63 % 62 % 62 % 61 %
Depreciation 6 250 000 6 250 000 6 250 000 6 250 000 6 250 000 6 250 000 6 250 000 6 250 000
EBIT 7 802 500 8 214 950 8 634 844 9 061 933 9 495 922 9 936 472 10 383 193 10 835 638
Interest expense BENDS 2 618 182 2 454 545 2 290 909 2 127 273 1 963 636 1 800 000 1 636 364 777 273
Interest expense Export Credit 1 737 458 1 586 375 1 435 292 1 284 208 1 133 125 982 042 830 958 377 708
Net income before tax 3 446 860 4 174 030 4 908 643 5 650 451 6 399 161 7 154 431 7 915 871 9 680 657
Net income after tax 2 274 928 2 754 860 3 239 705 3 729 298 4 223 446 4 721 924 5 224 475 6 389 234
Change in Debt
New loans 95 000 000
Repayment BNDS 3 636 364- 3 636 364- 3 636 364- 3 636 364- 3 636 364- 3 636 364- 3 636 364- 34 545 455-
Repayment Export Credit 2 916 667- 2 916 667- 2 916 667- 2 916 667- 2 916 667- 2 916 667- 2 916 667- 14 583 333-
CAPEX
Add back depreciation 6 250 000 6 250 000 6 250 000 6 250 000 6 250 000 6 250 000 6 250 000 6 250 000
Interim/Classification docking 7 000 000- 16 800 000- 8 400 000-
Sales price yr 8 85 500 000
CF Equity 30 000 000- 1 971 897 2 451 829 4 063 326- 3 426 268 12 879 584- 4 418 894 3 478 555- 49 010 446
NPV year 1 13 239 284-
IRR 3,8 %
NPV year 0 (M$)
-13,24 95 500 000 100 500 000 105 500 000 110 500 000 115 500 000 120 500 000 125 500 000
4% 7 10 14 17 21 24 28
5% 4 7 10 14 17 20 23
6% 1 4 7 10 13 16 19
7% -1 2 5 7 10 13 16
8% -3 -0 2 5 7 10 12
9% -4 -2 0 2 5 7 9
10% -6 -4 -2 0 2 5 7
11% -7 -6 -4 -2 0 2 4
12% -9 -7 -5 -3 -2 0 2
13% -10 -8 -7 -5 -3 -2 0
14% -11 -9 -8 -6 -5 -3 -2
15% -12 -10 -9 -8 -6 -5 -3
Re
Second hand value
NPV year 0 (M$)
-13,24 6,5% 7,5% 8,0% 8,5% 9,0% 9,5% 10,0%
4% 9 13 15 17 19 21 23
5% 6 10 12 14 16 18 20
6% 4 7 9 11 12 14 16
7% 1 5 6 8 10 11 13
8% -1 2 4 6 7 9 10
9% -2 0 2 3 5 6 8
10% -4 -1 -0 1 3 4 6
11% -6 -3 -2 -0 1 2 4
12% -7 -5 -3 -2 -1 0 2
13% -8 -6 -5 -4 -2 -1 0
14% -9 -7 -6 -5 -4 -3 -2
15% -10 -8 -7 -6 -5 -4 -3
Growth in dayrate
Re
Havila DOF Siem* DESS* Farstad Solstad Eidsvik Average
Leveread beta 1,12 1,75 1,57 1,85 1,92 1,68 1,12
Debt (1000 NOK) 6 321 788 26 399 000 1 108 815 179 460 10 659 091 10 070 858 3 351 910
Equity (1000 NOK) 2 021 605 6 346 000 793 888 257 220 6 877 974 4 954 275 2 348 288
Unleverad beta 0,27 0,34 0,66 1,09 0,75 0,55 0,46 0,59
Debt/Equity 3,13 4,16 1,40 0,70 1,55 2,03 1,43 2,06
*Debt and Equity in 1000 USD Levered Beta 1,80
![OSv - Guest Operating System intermediate version · OSv improved the performance of certain applications (e.g., the slides [10] accompanying the OSv paper [9] reported a 34% throughput](https://static.fdocuments.in/doc/165x107/5fc779f96da10f4f56115496/osv-guest-operating-system-intermediate-version-osv-improved-the-performance-of.jpg)