Comparing methods for mapping global parasite diversity
12
Global Ecol Biogeogr. 2019;00:1–12. wileyonlinelibrary.com/journal/geb | 1 © 2019 John Wiley & Sons Ltd 1 | INTRODUCTION Searching for drivers of spatial variation in biodiversity is a cen- tral aim in ecology and biogeography (e.g., Rhode, 1992; Wiens & Donoghue, 2004). Key to this effort are robust accounts for the distributions of biodiversity, such as global species richness maps. Species richness in space is also a commonly considered variable for defining conservation priorities geographically (Myers, Mittermeier, Mittermeier, Fonseca & Kent, 2000). To date, studies of large scale patterns in terrestrial biodiversity have focused primarily on free Received: 7 September 2018 | Revised: 12 August 2019 | Accepted: 20 August 2019 DOI: 10.1111/geb.13008 MACROECOLOGICAL METHODS Comparing methods for mapping global parasite diversity Paula Pappalardo 1 | Ignacio Morales‐Castilla 2 | Andrew W. Park 1,3 | Shan Huang 4 | John P. Schmidt 1,3 | Patrick R. Stephens 1,3 1 Odum School of Ecology, University of Georgia, Athens, Georgia 2 Department of Life Sciences, Universidad de Alcalá, Alcalá de Henares, Spain 3 Center for the Ecology of Infectious Diseases, University of Georgia, Athens, Georgia 4 Senckenberg Biodiversity and Climate Research Centre (SBiK-F), Frankfurt, Germany Correspondence Paula Pappalardo, Odum School of Ecology, University of Georgia, Athens, GA 30602. Email: [email protected] Present address Paula Pappalardo, Department of Invertebrate Zoology, Smithsonian National Museum of Natural History, Washington, DC 20560, USA Funding information Alexander von Humboldt‐Stiftung; National Science Foundation, Grant/Award Number: DEB 1316223; Universidad de Alcalá; Deutsche Forschungsgemeinschaft, Grant/ Award Number: HU 2748/1‐1 Editor: Greg Jordan Abstract Aim: Parasites are a major component of global ecosystems, yet spatial variation in parasite diversity is poorly known, largely because their occurrence data are limited and thus difficult to interpret. Using a recently compiled database of parasite oc- currences, we compare different models which we use to infer parasite geographic ranges and parasite species richness across the globe. Innovation: To date, most studies exploring spatial patterns of parasite diversity as- sumed, with little validation, that the geographic range of a parasite species can be represented by the collective geographic range of its host species. Our study com- pares this assumption with a suite of other methods to infer parasite distribution from parasite occurrence data (e.g., based on data density, ecoregions and climatic condi- tions). We highlight diversity hotspots identified by the various methods and compare the effects of sampling intensities in different regions, a crucial factor determining observed parasite diversity. Main conclusions: The type of model used to infer parasite distributions affects es- timates of both total species richness and spatial patterns of hotspots of parasite richness. Overall, the models based on reported occurrences share similar areas of high parasite richness that tend to be biased towards areas of high sampling effort. In contrast, the model based on host distributions showed hotspots of parasite di- versity that are biased towards areas of high host species richness. Accounting for sampling effort could only help to reconcile the outcome from the different models in some regions. Further, the non-saturated species accumulation curves even for the best studied regions of the world such as Europe and North America serve as a call for further sampling effort and development of effective analytic tools that can provide robust accounts of global parasite diversity. KEYWORDS biodiversity, cartography, geographic range, infectious disease, mammalian host, mapping, parasite, pathogen, species richness
Transcript of Comparing methods for mapping global parasite diversity

Global Ecol Biogeogr. 2019;00:1–12. wileyonlinelibrary.com/journal/geb | 1© 2019 John Wiley & Sons Ltd
1 | INTRODUC TION
Searching for drivers of spatial variation in biodiversity is a cen-tral aim in ecology and biogeography (e.g., Rhode, 1992; Wiens & Donoghue, 2004). Key to this effort are robust accounts for the
distributions of biodiversity, such as global species richness maps. Species richness in space is also a commonly considered variable for defining conservation priorities geographically (Myers, Mittermeier, Mittermeier, Fonseca & Kent, 2000). To date, studies of large scale patterns in terrestrial biodiversity have focused primarily on free
Received:7September2018 | Revised:12August2019 | Accepted:20August2019DOI: 10.1111/geb.13008
M A C R O E C O L O G I C A L M E T H O D S
Comparing methods for mapping global parasite diversity
Paula Pappalardo1 | Ignacio Morales‐Castilla2 | Andrew W. Park1,3 | Shan Huang4 | John P. Schmidt1,3 | Patrick R. Stephens1,3
1Odum School of Ecology, University of Georgia,Athens,Georgia2Department of Life Sciences, Universidad deAlcalá,AlcaládeHenares,Spain3Center for the Ecology of Infectious Diseases,UniversityofGeorgia,Athens,Georgia4Senckenberg Biodiversity and Climate Research Centre (SBiK-F), Frankfurt, Germany
CorrespondencePaula Pappalardo, Odum School of Ecology, UniversityofGeorgia,Athens,GA30602.Email: [email protected]
Present addressPaula Pappalardo, Department of Invertebrate Zoology, Smithsonian National MuseumofNaturalHistory,Washington,DC20560,USA
Funding informationAlexandervonHumboldt‐Stiftung;NationalScienceFoundation,Grant/AwardNumber:DEB1316223;UniversidaddeAlcalá;Deutsche Forschungsgemeinschaft, Grant/AwardNumber:HU2748/1‐1
Editor: Greg Jordan
AbstractAim: Parasites are a major component of global ecosystems, yet spatial variation in parasite diversity is poorly known, largely because their occurrence data are limited and thus difficult to interpret. Using a recently compiled database of parasite oc-currences, we compare different models which we use to infer parasite geographic ranges and parasite species richness across the globe.Innovation: Todate,moststudiesexploringspatialpatternsofparasitediversityas-sumed, with little validation, that the geographic range of a parasite species can be represented by the collective geographic range of its host species. Our study com-pares this assumption with a suite of other methods to infer parasite distribution from parasite occurrence data (e.g., based on data density, ecoregions and climatic condi-tions). We highlight diversity hotspots identified by the various methods and compare the effects of sampling intensities in different regions, a crucial factor determining observed parasite diversity.Main conclusions: The type of model used to infer parasite distributions affects es-timates of both total species richness and spatial patterns of hotspots of parasite richness. Overall, the models based on reported occurrences share similar areas of high parasite richness that tend to be biased towards areas of high sampling effort. In contrast, the model based on host distributions showed hotspots of parasite di-versitythatarebiasedtowardsareasofhighhostspeciesrichness.Accountingforsampling effort could only help to reconcile the outcome from the different models in some regions. Further, the non-saturated species accumulation curves even for thebeststudiedregionsoftheworldsuchasEuropeandNorthAmericaserveasacall for further sampling effort and development of effective analytic tools that can provide robust accounts of global parasite diversity.
K E Y W O R D S
biodiversity, cartography, geographic range, infectious disease, mammalian host, mapping, parasite, pathogen, species richness
2 | PAPPALARDO et AL.
living organisms, particularly vertebrates (e.g., Ceballos & Ehrlich, 2006;Morales‐Castillaetal.,2011;Ormeetal.,2005)due,inlargepart,totheavailabilityofexpert‐basedrangemaps(Ficetolaetal.,2014; IUCN, 2007). In contrast the biogeography of parasites, a major component of the earth’s biodiversity, has been largely ne-glected even though they can serve critical roles in understanding and predicting future outbreaks and advancing the field of macro-ecologyingeneral(Stephensetal.,2016).
Althoughparasitesareestimatedtomakeupat leasthalfofallexistingbiodiversityglobally(Larsen,Miller,Rhodes,&Wiens,2017;Poulin & Morand, 2004), few empirical studies have investigated large scale patterns of parasite diversity. Our knowledge of parasite diversity, in general, lags far behind that of free-living organisms. Recognition that study effort is the best predictor of the number of knownparasite speciesperhost (Nunn,Altizer, Jones,&Sechrest,2003; Walther, Cotgreave, Gregory, & Clayton, 1995) and of parasite discovery rates (Jorge & Poulin, 2018) implies that the current picture of parasite biodiversity is incomplete and likely biased towards par-asitesofcharismaticmegafauna.Asaresult,thereareveryfewpar-asite species for which accurate range maps are available based on geographicoccurrencedata(e.g.,Africanticks:Cumming,1999),andsophisticated maps of infection probability are typically only avail-able for some parasites of high public health relevance (e.g., Soares Magalhaes, Clements, Patil, Gething, & Brooker, 2011). Urgent ques-tions for global management such as where hotspots of parasite biodiversity exist andhowclosely they correspond tohotspots offree-living animal diversity remain a difficult challenge (but see Dunn, Davies,Harris,&Gavin,2010;Hopkins&Nunn,2007;or Jorge&Poulin, 2018). Investigation is further hindered by strong spatial bi-asesinexistingparasitedata(Carlsonetal.,2017),makingthetaskofgenerating parasite distribution and diversity maps non-trivial.
Thus far, most studies that estimated parasite geographic range assumed that if a host–parasite association is reported, the entire geographic range of the host can be considered the potential area of occurrencefortheparasite(Brierley,Vonhof,Olival,Daszak,&Jones,2016;Han,Kramer,&Drake,2016;Harris&Dunn,2010),amethodwe refer to as “host filling”. This approach can overestimate parasite distribution ranges (e.g., see detailed studies on ticks: Cumming, 1999; fleas: Shenbrot, Krasnov, & Lu, 2007), and thus generates a misleading pictureofglobalparasitediversity.Thismayoccur,forexample,iftheparasite cannot tolerate the whole range of the environmental condi-tions in certain parts of the host range, if intermediate hosts are not present throughout the definitive host range, or if susceptibility varies among host populations. To move towards a better understanding of global patterns of parasite richness, it is necessary to consider alterna-tivewaystogenerateparasitediversityestimateswithinthecontextof the limited occurrence data that are currently available.
One approach would be to lean on the rich body of literature that develops species distribution models based on environmental conditions (i.e., species distribution modelling, SDM; environmen-talnichemodelling,ENM;seeAraújo&Peterson,2012),especiallyincluding climatic as well as biotic factors and human impacts. Yet, attempting to establish distributional patterns using these methods
can present challenges stemming from lack of reliable absence data, inaddition togeographicand taxonomicbiases insampling (Lobo,Jimenez‐Valverde,&Hortal,2010).Acomprehensiveenvironmentalmodelling approach relies on abundant observations that capture most (ifnotall)of the realizedniche toproducemeaningful infer-ences, which is currently unrealistic for the large majority of parasitic taxa.More importantly,becausetheirdistributionsareonlypartlyconditionedbyclimateortheexternalenvironment,butalsodependon the distributions of their hosts, applying ENM methods to map-ping parasite diversity geographically introduces an extra layer ofcomplexityanduncertainty.
Here we compare how the picture of parasite biodiversitychanges when parasite ranges are inferred based on a variety of different distribution assumptions, including methods based on presence-only parasite occurrence data and the host filling method basedonthedistributionofthehostspecies.Analternativemethodrecently used to assess parasite geographic range (Byers, Schmidt, Pappalardo,Haas,&Stephens,2019)assumesthattheextentofoc-currence of a parasite can be all ecoregions in which the parasite has been observed at least once. Ecoregions as biogeographic units have previously been used in a variety of macroecological studies (e.g.,Barboza&Defeo,2015;Dinersteinetal.,2017;Fritz,Bininda‐Emonds, & Purvis, 2009). Other simpler methods such as mapping point occurrences to a grid have proven useful to recover macro-ecologicalpatternsinsometaxonomicgroups(García‐Rosellóetal.,2015) and could also apply to map parasite distributions.
We assess how the use of different methods to estimate the dis-tribution ranges of parasite species influences estimates of spatial patterns of species richness using parasite occurrence data from a recently updated and published version of the Global Mammal Parasite Database (GMPD v.2, Stephens et al., 2017). The GMPD is the most comprehensive global database of georeferenced parasite infection records in wild ungulates, carnivores and primates. We first assessed spatial variation in sampling intensity in the GMPD to choose the best sampled regions in order to more fairly compare the outcome of analyses based on different assumptions about parasite distributions. Based on this, we conducted regional analyses on two selected regions of the world. The geographic range of a parasite species was considered as either: (a) locations of reported occur-rences, (b) area within threshold density contour of occurrences, (c) all ecoregions where occurrences have been reported, (d) areas of suitable climate conditions based on occurrence data, or (e) the col-lective geographic ranges of all reported host species. We show how these assumptions about parasite distribution affect estimates of the spatial pattern of parasite diversity and the location of hotspots of parasite richness.
2 | METHODS
2.1 | Parasite occurrence database
Weextractedparasite occurrencedataprimarily from theGMPDv.2 (Stephens et al., 2017). In this database, parasites are broadly
| 3PAPPALARDO et AL.
defined as disease-causing organisms, including viruses, bacteria, helminths, arthropods and fungi. The database focuses on wild host populations belonging to the three best studied groups of mammals: ungulates (orders: Artiodactyla and Perissodactyla), carnivores(order: Carnivora) and primates (order: Primates). We complemented the GMPD database with occurrence data on helminth parasites fromBrazil(Corrêa,Bueno,Soares,Vieira,&Muniz‐Pereira,2016).
For the purpose of this paper, we restricted the analysis to para-sites of terrestrial hosts, and only included records with geographic coordinates and species identities for both the parasite and the host. We double checked parasite occurrences that were not as-signed an ecoregion and adjusted the geographic coordinates when it was appropriate after consulting the original source for details on the locality. Some parasites occurrence data may not fall within the current host geographic range because: (a) data were collected on hosts outside their native range, (b) host range has shrunk over time, (c) host species (sensu lato) have been split into several species in morerecenttaxonomicschemesand(d)theparasiteoccurrencewasreported at the country level. We downloaded hosts’ geographic ranges from the IUCN Red List shape files database, version 3, in May2017(IUCN,2007;http://www.iucnredlist.org),excludingpoly-gons for extinct populations. When possible, GMPD host namesnot represented in the IUCN database were matched with their synonyms in the IUCN database (details in Supporting Information AppendixS1).Foreachhost,weexcludedparasiteoccurrencesthatdid not occur within 50 km of the IUCN host range.
Our final global dataset included 14,604 georeferenced, hostspecific, parasite occurrences, of a total of 1,511 parasite species (324 arthropods, 136 bacteria, 688 helminths, 223 protozoa, 1prion,17fungus,and122viruses)in326hostspecies.InSupportingInformationAppendixS1weprovidethecodeusedtogeneratethefinal dataset for analyses, details on the distribution of parasite oc-currences (Table S1.1), maps of the raw parasite occurrences from the GMPD and the final set of occurrences used in our study (Figure S1.1).Alldataprocessing,analysisandvisualizationweredoneintheR environment version 3.5.2 (R Core Team, 2018).
While primates are restricted to lower latitudes, both ungulates and carnivores are widely distributed across all major habitats at all latitudes. We combined ungulates and carnivores for all the anal-yses, because the two groups show similar patterns of geographic bias in sampling effort, and trophic links between the two groups appear to enhance parasite sharing (Stephens et al., 2019). We first conducted regional analysis using a subset of parasite species with 10 or more non-overlapping occurrences in two continental regions with high densities of parasite data: the continental US and nearby islands(forungulatesandcarnivores)andAfrica(forprimates).Wethen compared the global maps of parasite diversity focusing only on the host filling and the ecoregion filling methods.
2.2 | Parasite geographic range
Using records of parasite occurrences and host–parasite associa-tions in the GMPD, we applied different models to estimate parasite
geographic ranges in order to generate parasite diversity maps. Broadly, we defined the expected geographic range of a parasitespecies based on one of: (a) the geographic coordinates of the re-ported occurrences, with a buffering scheme (the neighbourhood filling method), (b) the area within a threshold density contour of occurrence reports (the density method), (c) the combination of ecoregions containing at least one occurrence (the ecoregion filling method), (d) areas of suitable climate conditions based on occur-rence data (climatic model method), or (e) the collective geographic ranges of all host species found infected with the parasite (the host filling method). The methods that we used are depicted in Figure 1, and detailed below:
1. The neighbourhood filling method. To infer the geographic range of a parasite species, we assumed that if a parasite species has been found in one locality, it is likely that it is also present within a radius of approximately 100 km (1 degree latitude orlongitude) in the regional analyses or 200 km for the global analyses.
2. The density method. To estimate the likelihood of occurrence, we calculated a two-dimensional density kernel based on the distri-bution of reported localities for each parasite species. We con-sidered density probabilities < .00001 as equivalent to 0. For the remainingdensities(≥.00001)weestimatedthegeographicrangeof the parasite as the area of most probable occurrence, defined as the area with densities above the .5 quantile. We provide an examplewith the rationale for thechoiceofbandwidth for thedensity kernel and quantile threshold to define parasite presence inSupportingInformationAppendixS2andFiguresS2.2–S2.5.
3. The ecoregion filling method. This method assumed that if a para-site has been found at a locality within an ecoregion, the para-site’s extent of occurrence is likely to be the entire ecoregion.Ecoregions are generally defined by similar habitat and low vari-ation in the flora, fauna, and physical environmental conditions (Olson et al., 2001, recently updated by Dinerstein et al., 2017). We downloaded the shape files for the terrestrial ecoregions from https ://ecore gions 2017.appsp ot.com/, and assigned parasite oc-currences to each ecoregion using an equal area projection. The geographic range of a parasite species is thus the collection of all occurring ecoregions.
4. The climatic model method. The focus of this study was not to de-velopacomprehensiveENMapproach(forthereasonsexplainedin the Introduction), but for comparative purposes we fitted a simple climatic model for each parasite species. We only consider parasite species with at least 10 occurrences that do not overlap geographically for each host–parasite association. We included all 19 bioclimatic variables from the WorldClim database (http://www.worldclim.org,Fick&Hijmans,2017)aspotentialpredictorsof parasite distributions. More details can be found in Supporting InformationAppendixS3.
5. Thehostfillingmethod.Thismethodassumedthattheextentofoccurrence of a parasite is the entire composite geographic range of all the host species reported in our final dataset. The geographic

4 | PAPPALARDO et AL.
range of a parasite species was thus the combined range occupied by all of its hosts.
2.3 | Parasite species richness
Using the parasite geographic ranges produced by the different methods, we generated regional and global maps of parasite species richness. For comparison, we mapped parasite diversity with resolu-tionsofa1°×1°gridfortheregionalanalyses(Africaandcontinen-talUSA)anda2°×2°gridfortheglobalanalysis.Foreachgridcell,we estimated total parasite species richness as the number of unique parasite species whose ranges overlap with that cell.
Even for well-studied organisms such as terrestrial mammals, the distribution of sampling effort has been shown to be biased (Meyer, Kreft, Guralnick, & Jetz, 2015). Across all host‐parasiterecords, we also found that occurrence data were distributed unevenly in space, suggesting spatial sampling bias (Figure 2a,b).
Thus, we estimated relative parasite species richness accounting for sampling effort using the least square residuals (i.e., the re-sidual parasite species richness from a generalized least squaremodel based on sampling effort; Lindenfors et al., 2007; Nunn et al., 2003). To measure sampling effort we counted the number of unique citations in our database for each grid cell or ecoregion. In addition, we counted the number of potential host species (hosts species richness), which is likely to influence parasite richness, es-pecially when using the host filling method. When parasite rich-ness or sampling effort measures deviated from normality they were ln-transformed before calculating the residuals. To compare the spatial patterns of areas with high species richness among the different methods, we identified areas in the top 10% quantile of parasite species richness (total or relative).
For carnivores and ungulates, we focused on the continental USA and nearby islands because this is one of the best sampledregions in our data. For primates, we focused the regional analysis in Africa,which contained a high number of parasite occurrences
F I G U R E 1 Aschematicillustrationofthefivemethodswecomparedforestimatingparasitegeographicranges(alldataarehypotheticalin this diagram). From left to right we represent the type of data used (parasite occurrences only, or host–parasite associations), the type of assumption, the simple distribution model, and the final parasite geographic range inferred. The black dots represent point occurrences of a hypothetical parasite species (which are not used in the host filling method) and the colour shades represent distributions of hypothetical ecoregions,climaticconditionsorhostspeciesgeographicrangesfortherespectivemethods.Wedetailallmethodsinthemaintext
N
W
W
W
W W
W
W
W
W
W
W
W
W
N N
N
N N
N
N
N
N
N
N
N
N
Neighbourhood

| 5PAPPALARDO et AL.
and high diversity of primate hosts. Regional analyses only included parasite species with 10 or more occurrences so that the results of the methods of neighbourhood filling, density, ecoregions and host filling were comparable to the climatic model method. We also sum-marizedtheglobalpatternsofparasitediversity.Anexampleofthecode to run theanalyses (for thecontinentalUSA) ispresented inSupportingInformationAppendixS8,andthecorrespondingfunc-tionsareprovidedinSupportingInformationAppendixS9.
To compare the parasite species richness estimated using dif-ferentmethodswe tested for pairwise correlations and extractedprincipal components from the geographic distributions of richness. For the principal component analysis, each raster layer of parasite species richness was converted into a vector, and each vector was column‐boundresultinginamatrixwhosecolumnsrepresentedthemapping method, and whose rows represented a specific 1 grid cell on the map. Rows containing null values (typically non-terrestrial grid cells or cells where one or more of the methods had no informa-tion on species richness) were removed. We used the prcomp func-tion (R Core Team, 2018) to estimate the principal components, and the%varianceexplainedbyeachaxis.
3 | ACCUMUL ATION CURVES
To compare sampling effort across regions and parasite taxa,we derived global and regional species accumulation curves for three well‐studied continental regions: Europe, North AmericaandAfrica.Thesecurvesareanalogoustothosecommonlyusedto study species–area relationships (Connor & McCoy, 1979), and havebeenusedextensivelyinanalysesofspeciesdiversity(Chaoet al., 2014), for example, to extrapolate diversity as a functionof sampling intensity. Because we are dealing with point occur-rence records collected in a non-systematic way and from differ-ent sources, our goal was only to compare the degree of saturation shownbyaccumulationcurvesasaproxyforsamplingcomplete-ness, and not to make predictions of the true parasite species richness. We accumulated the number of parasite species through sampling procedures based on different types of data. Specifically, we randomly sampled an increasing number of localities, ecore-gions or host species, fromoneup to themaximumnumber re-ported within each geographic region, and we repeated each sampling procedure 100 times.
F I G U R E 2 Global maps of parasite occurrences, sampling effort and host species richness for ungulates and carnivores (left panel) and primates (right panel). Sampling effort was quantified by the number of citations for each parasite. Parasite occurrences in: (a) ungulates and carnivores, (b) primates. Sampling effort in: (c) ungulates and carnivores, (d) primates. Species richness for the hosts included in our database was generated from IUCN range maps for: (e) ungulates and carnivores, (f) primates. The parasite occurrences are a subset of the GMPDdatabase(Stephensetal.,2017)withtheadditionofhelminthdatafromCorreaetal.(2016).Herewerepresentonlycleanedparasiteoccurrences within 50 km of IUCN host geographic ranges

6 | PAPPALARDO et AL.
4 | RESULTS
The record of parasite occurrences for ungulates, carnivores and primates is spatially biased; some regions of the world such as NorthAmerica,EuropeandsomepartsofAfricashowthehigh-est densities of records (Figure 2a,b). Most parasite species in our dataset have only been reported from one to a few locations: the median number of occurrences per parasite is 2, the mean is 5.14, and themaximum is 179 (see Supporting Information AppendixS1 for more information). Parasite sampling effort (represented as number of citations) varies dramatically across the world (Figure 2c,d), and is not always associated with host diversity in a region(Figure2e,f).Accumulationcurves(presentedinSupportingInformationAppendixS4)ofparasiterichness forEurope,NorthAmericaandAfrica show regionaldifferencescontingenton thesampling unit considered, but, overall, imply that sampling of parasites is far from saturated even in the regions with more in-formationavailable(SupportingInformationFigureS4.6).Fortheregional analyses using parasites with 10 or more occurrences in thecontinentalUSA(SupportingInformationFigureS4.7)orAfrica(Supporting Information Figure S4.8), the accumulation curves do achieve saturation.
Principal component analyses comparing parasite species rich-ness obtained through different methods indicated the host filling method as most distinct from all other methods, both in the con-tinentalUSAandAfrica(Figure3).Thecorrelationsbetweenpara-site richness estimated with different methods and sampling effort measures are shown in Supporting Information Appendix S5. Asexpected, parasite richness estimateshadmedium to strongposi-tive correlations with measures of sampling effort in most cases (SupportingInformationAppendixS5,FiguresS5.8andS5.9).
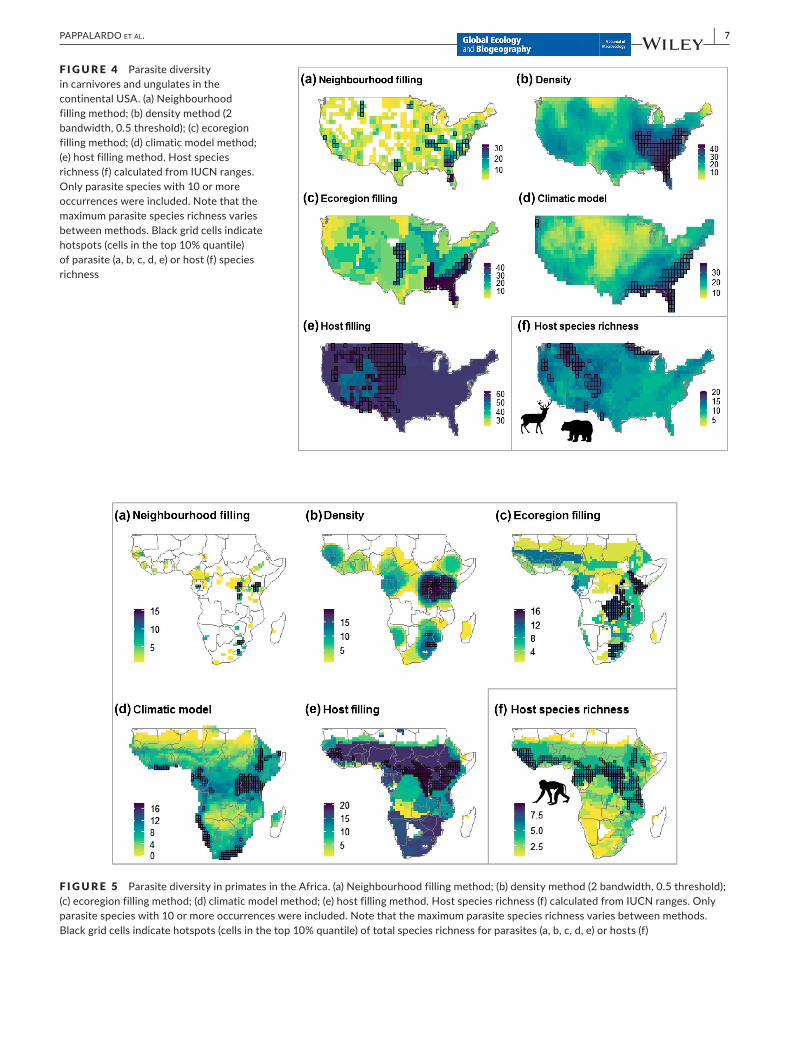
ThemapsshowingtotalparasiterichnessinthecontinentalUSAhighlight important differences in the spatial patterns related to the methods used to infer parasite range (Figure 4). The four meth-ods using parasite occurrence data (neighbourhood filling, density, ecoregion filling and climatic model) generally resulted in hotspots of
diversity (grid cells in the top 10% of diversity) in the south-eastern USA(Figure4a,b,c,d),whilethehostfillingmethodledtohigherspe-ciesrichnessinthewesternUSA(Figure4e).Forcomparison,amapof host species richness is shown in Figure 4f. When sampling effort is taken into account (Supporting InformationAppendix S6, FigureS6.11),eitherasnumberofcitationsorhostspeciesrichness,thereislittle agreement in areas of high relative parasite richness between the host filling method and the methods based on parasite occurrences (withtheexceptionofafewgridcellsinthesouth‐westernUSA).
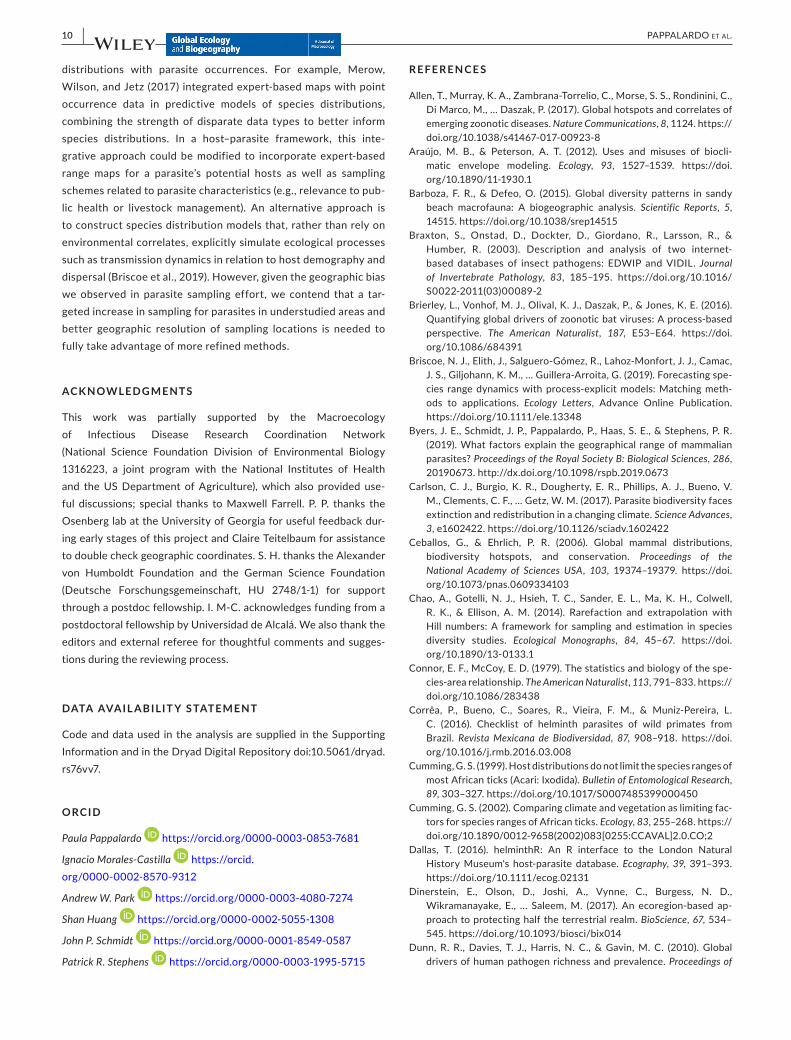
Overall,theparasiterichnessmapsforprimatesinAfricashowedhigher agreement in the location of hotspots among the different methods,atleastincentralAfrica,butonlythefourmethodsbasedon parasite occurrences resulted in hotspots of parasite richness in southernAfrica.Thedistributionofparasiterichnesshotspotsfromthe host filling method (Figure 5e) is largely congruent with that of the host richness hotspots (Figure 5f). When sampling effort is taken into account, there are areas of high relative parasite richness inSouthAfricasharedbetweenallmethods(SupportingInformationAppendixS6,FigureS6.12).
World patterns of parasite richness using the full dataset show higher estimates of total parasite richness when using the host filling method,comparedwiththeecoregionfillingmethod(Figure6).Itisimportant to note that the host filling method draws estimates of parasite diversity even in regions where our database had no par-asite occurrences available (e.g., Australia). For the primates, theecoregion fillingmethodpoints tohotspotsof total (Figure6b)orrelative (Supporting InformationAppendixS6,FigureS6.14)diver-sity that are not detected by the host filling method. For ungulates and carnivores, the host filling method has regions with higher total (Figure 6c) or relative diversity (Supporting InformationAppendixS6, Figure S6.13) only in North America and in Europe, but theecoregionmethodidentifiesareasofhightotal(Figure6a)andrela-tive(SupportingInformationAppendixS6,FigureS6.13)richnessinAfricaandAsia.
Themedian andmaximum parasite richness estimated usingdifferent methods to define parasite geographic range varied by
F I G U R E 3 Principal component analyses comparing parasite species richness obtained with different methods to calculate parasite geographicrangein:(a)thecontinentalUSAforungulatesandcarnivores;and(b)Africaforprimates.Thepercentageofvarianceexplainedbyeachaxisisdisplayedwithinparentheses.Onlyparasitespecieswith10ormoreoccurrenceswereincluded
| 7PAPPALARDO et AL.
F I G U R E 4 Parasite diversity in carnivores and ungulates in the continentalUSA.(a)Neighbourhoodfilling method; (b) density method (2 bandwidth, 0.5 threshold); (c) ecoregion filling method; (d) climatic model method; (e)hostfillingmethod.Hostspeciesrichness (f) calculated from IUCN ranges. Only parasite species with 10 or more occurrences were included. Note that the maximumparasitespeciesrichnessvariesbetween methods. Black grid cells indicate hotspots (cells in the top 10% quantile) of parasite (a, b, c, d, e) or host (f) species richness
F I G U R E 5 ParasitediversityinprimatesintheAfrica.(a)Neighbourhoodfillingmethod;(b)densitymethod(2bandwidth,0.5threshold);(c)ecoregionfillingmethod;(d)climaticmodelmethod;(e)hostfillingmethod.Hostspeciesrichness(f)calculatedfromIUCNranges.Onlyparasitespecieswith10ormoreoccurrenceswereincluded.Notethatthemaximumparasitespeciesrichnessvariesbetweenmethods.Black grid cells indicate hotspots (cells in the top 10% quantile) of total species richness for parasites (a, b, c, d, e) or hosts (f)

8 | PAPPALARDO et AL.
two orders of magnitude. In most cases, the lowest number of parasites was found with the neighbourhood method, followed by the ecoregion filling, density and host filling methods (Supporting Information Appendix S7, Table S7.2). The general pattern ofdistribution of parasite richness was right skewed for most geo-graphic regions andmethods (Supporting Information AppendixS7, Figures S7.15–S7.17).
5 | DISCUSSION
Can we map global patterns of parasite diversity? The majority of studies that have mapped large scale patterns of parasite diversity (Harris&Dunn,2010)orgeneratedspatialpredictionsofthedistri-butionofzoonoticdiseases (Brierleyetal.,2016;Hanetal.,2016;Olival et al., 2017) have used the distributions of the hosts to infer parasite distributions (i.e., the host filling method). This may be the only reasonable approach for estimating parasite species richness when direct information on parasite occurrence localities is highly limited. In this study, we used a recently published database of wild mammal parasites (GMPD v.2, Stephens et al., 2017) to generate maps of parasite species richness directly from parasite occurrence data. This allowed us to compare regional and global maps of para-site richness built by different methods to infer parasite distribu-tions. Our results show that even in well-studied areas, the different methods result in profound differences in species richness maps, not only of the range over which richness varies but also of the spatial variation in richness.
Among themethods we considered, host filling produced themost distinctive patterns of parasite diversity. Even in one of the bestsampledareas,thecontinentalUSA,hostfillingproducedapic-ture of parasite richness that was very different from those produced by the other methods. This discrepancy is concerning, because the
assumptions of the host filling method have not been well supported empiricallyintheliterature.ApreviousstudyofNorthAmericancar-nivores(Harris&Dunn,2010)testedwhetherlargescalepatternsofparasite richness were robust to violations of the assumption of host filling by removing parasite occurrences from their data, according to different scenarios and rebuilding maps of parasite richness. They showedthatthelatitudinalpatterninparasiterichnessexhibitedasimilar shape whether derived from the full dataset or from a re-ducedandgeographicallybiaseddataset.However,parasitespeciesrichness at northern latitudes showed an order of magnitude differ-encebetweenthe fullandgeographicallybiaseddataset (Harris&Dunn,2010:supplementarymaterial).Adense,spatiallyevensam-pling of parasites in widely distributed hosts could help to shed light into the assumptions of the host filling method, but such detailed data are simply not available for most mammalian hosts.
For some well-studied hosts, several studies have reported that parasites are not evenly distributed across the geographic range of their host (Cumming, 2002; Shenbrot et al., 2007; Timi & Poulin, 2003), which could be related to competition among parasites, dis-tribution of intermediate hosts, environmental factors, and other host features such as population density or body size (Cumming,2002;Morandetal.,2000;Shenbrotetal.,2007).Forexample,com-prehensive analysis of flea occurrence data in relation to the distri-bution of their rodent hosts showed that the proportion of the hosts' geographic range that was occupied by fleas was highly variable, ranging from 0.2 to 83.7% (with an average of 30%), and apparent patterns of variation were not driven by sampling effort (Shenbrot et al., 2007). Cumming (1999), using a large database on geographic occurrencesofAfricantickscombinedwithareviewonhostuseandhost distributions, also concluded that host ranges do not predict tick distributions. Further, in some hosts, similarity among parasite communities decreases with distance between host populations (Krasnov, Shenbrot, Mouillot, Khokhlova, & Poulin, 2005; Poulin,
F I G U R E 6 Global maps of total parasite species richness for ungulates and carnivores (left panel) and primates (right panel) calculated with the ecoregion filling (a, b) or host filling (c, d) method to infer parasite geographic range

| 9PAPPALARDO et AL.
2003). As a result, the assumption that parasites occupy the fullextentofhost rangeswill insomecases lead toover‐estimatesofparasite species richness.
On the other hand, parasite richness estimated from parasite distributions based strictly on direct occurrence data will underesti-mate true values if spatial sampling is not sufficiently systematic and comprehensive. This can happen even in very well-studied regions of the world such as Europe, and in organisms such as terrestrial European vertebrates that, unlike parasites, are quite well studied (Hawkins,Rueda,&Rodríguez, 2008). For example, ifwe comparethe geographic information available for parasites with occurrences reported in GBIF for their hosts, we can see a much higher number ofoccurrencesforhosts(SupportingInformationAppendixS11),buta similarly uneven distribution of data (minimum = 1, median = 129, maximum=81,878).Allmethodsbasedonparasiteoccurrencestoinfer parasite range share biases associated with collection data such asgeographicandtaxonomicbias,lackofsystematicsurveysthatin-corporateabsencedata,anddifferences indatamobilization (Lobo et al., 2010; Meyer et al., 2015).
The ecoregion filling method perhaps represents an intermedi-ate set of assumptions about how to make inferences from limited spatial sampling that is unlikely to produce as many false positives as the host filling method, but results in fewer false negatives com-pared to the neighbourhood filling method given the more coarse spatial scale of ecoregions. Because ecoregions likely also represent the environmental conditions that determine species distributions ofboth theparasiteandhostpopulations (Fritzetal.,2009), theycould represent a simpler version of environmental niche models. Amoreconservativeecoregionapproachwouldbetoonlyconsiderthe ecoregion area that overlaps with known host ranges. This would seem most appropriate for well-studied species for which it is likely thatmostnaturalhostshavebeendocumented.Anotherpotentialissue is that a parasite occurrence may be incorrectly assigned to a neighbouring ecoregion when the resolution of the data is low, for example,atthecountrylevel,andthecentroidofthecountryisusedasageoreferencedpoint.Assuch,thismethodshouldnotbeappliedfor parasite databases that only use country as their spatial units (e.g.,theLondonNaturalHistoryMuseum'sHost‐Parasitedatabase,Dallas,2016)andshouldbeusedcautiouslywithdatabasesofmixedresolution such as the GMPD.
The location data associated with the host–parasite associa-tions reported in the GMPD are concentrated on a few areas of the world (Europe,NorthAmerica,partsofAfrica),eventhoughhostsare mammalian carnivores, primates and ungulates, which represent some of the best studied host groups in general. This spatial bias is not unique to the GMPD. Similar spatial bias is found in other para-site databases (Carlson et al., 2017) and in occurrence data of free living species (e.g., amphibians, birds, mammals: Meyer et al., 2015). Important predictors to explain the uneven distribution of occur-rencedata in free living speciesare the shapeand sizeof speciesgeographic ranges, and socio-economic factors that affect fund-ingandinfrastructureforresearch(Meyer,Jetz,Guralnick,Fritz,&Kreft,2016).Thesebiaseslikelyalsoaffectparasiteoccurrencedata.
Someoftheregionswithzerooronlyafewrecordsinourdataarelikelyregionsoftruelowparasiterichness.Forexample,GreenlandandAustraliahaveextremelylowdiversitiesofungulatesandcarni-vores(at least intheIUCNdatabase).However,otherareaswhereavailabledataaresparse,includingnorthernSouthAmerica(forun-gulatesandcarnivores)andcentralAsia(forallthreehostgroups),have relatively high host diversity and environmental conditions that are generally suitable for most modes of parasite transmission. Thus, they likely represent insufficient sampling rather than regions of trulylowparasiterichness.Additionalsampling,particularlyinAsia,isgreatlyneededbothtocharacterizeparasitefaunaingeneralandbetterdefineregionsofhighhumanzoonoticpotential(Allenetal.,2017; Wells et al., 2018). Species accumulation curves (Supporting InformationAppendixS4,FigureS4.6)alsoshowedthateveninwell‐studiedregionssuchasEuropeandNorthAmerica,thereislittleev-idence of an asymptote in parasite richness with increased sampling; many more parasite species likely remain to be discovered.
The data that we used in this study represent the largest and most comprehensive dataset with host–parasite associations cur-rently available on the parasites of wild mammals. Other compila-tionshavebeenpublishedbutaremore limited intheirtaxonomicscope and/or spatial resolution. For example, the LondonNaturalHistoryMuseum'sHost‐ParasiteDatabase (Dallas, 2016) presentshelminthdataonlyatthecountrylevel,whereasBraxtonetal.(2003)present point locality data but focus only on pathogens of insects, andWardeh, Risley,McIntyre, Setzkorn, and Baylis (2015) have abroadtaxonomicscopeofhostsandparasitesbutonlycountry(andsometimes region) resolution. Even using the best available data, it is apparent that large gaps remain in our knowledge of parasite biodi-versity.Non‐traditionalsourcesofdata,suchasexpertopinion,nu-cleotide sequence databases, or social media, have been suggested as sources that could improve the mapping of infectious disease in humansandanimals(Hayetal.,2013;seeWardehetal.,2015fortheuse of nucleotide sequence databases), and we contend that these approaches could also profitably be applied to wild mammals.
Characterizing spatial patterns of parasite diversity can help inunderstanding disease risk among human and non-human hosts by, forexample,identifyingareaswherezoonoticdiseaseandtransmis-sionrisktohumansarehigher(Hanetal.,2016;Pedersen&Davies,2009;Wellsetal.,2018).Alargepercentageofmammalparasitesareassociatedwithzoonoticdiseases(Hanetal.,2016).Carnivoresandungulates, because of their association with livestock (which in turn co‐occurwithhumanpopulations),may serve as reservoirsof zoo-noticparasites(Pedersen,Jones,Nunn,&Altizer,2007;Wiethoelter,Beltrán‐Alcrudo,Kock,&Mor,2015).Conversely,giventhephyloge-netic relatedness of their hosts, primate parasites have a high potential toinfecthumans(Pedersen&Davies,2009).Althoughparasiterich-ness estimated by the host filling method to infer parasite geographic range provides a useful estimate of the upper limit of the potential diversityofknownparasites(Hanetal.,2016),dataonactualparasiteoccurrencesmaybeneededforrealisticassessmentofzoonoticrisk.
Moving forward, the most promising method to map para-site diversity is likely an integrative approach that combines host
10 | PAPPALARDO et AL.
distributions with parasite occurrences. For example, Merow,Wilson,andJetz(2017)integratedexpert‐basedmapswithpointoccurrence data in predictive models of species distributions, combining the strength of disparate data types to better inform species distributions. In a host–parasite framework, this inte-grativeapproachcouldbemodified to incorporateexpert‐basedrange maps for a parasite’s potential hosts as well as sampling schemes related to parasite characteristics (e.g., relevance to pub-lic health or livestock management). An alternative approach isto construct species distribution models that, rather than rely on environmentalcorrelates,explicitlysimulateecologicalprocessessuch as transmission dynamics in relation to host demography and dispersal(Briscoeetal.,2019).However,giventhegeographicbiaswe observed in parasite sampling effort, we contend that a tar-geted increase in sampling for parasites in understudied areas and better geographic resolution of sampling locations is needed to fully take advantage of more refined methods.
ACKNOWLEDG MENTS
This work was partially supported by the Macroecology of Infectious Disease Research Coordination Network (National Science Foundation Division of Environmental Biology 1316223, a joint program with the National Institutes of Healthand theUSDepartment ofAgriculture),which also provided use-ful discussions; special thanks toMaxwell Farrell. P. P. thanks theOsenberg lab at the University of Georgia for useful feedback dur-ing early stages of this project and Claire Teitelbaum for assistance todoublecheckgeographiccoordinates.S.H.thankstheAlexandervon Humboldt Foundation and the German Science Foundation(Deutsche Forschungsgemeinschaft, HU 2748/1‐1) for supportthrough a postdoc fellowship. I. M-C. acknowledges funding from a postdoctoralfellowshipbyUniversidaddeAlcalá.Wealsothanktheeditorsandexternalrefereeforthoughtfulcommentsandsugges-tions during the reviewing process.
DATA AVAIL ABILIT Y S TATEMENT
Code and data used in the analysis are supplied in the Supporting InformationandintheDryadDigitalRepositorydoi:10.5061/dryad.rs76vv7.
ORCID
Paula Pappalardo https://orcid.org/0000‐0003‐0853‐7681
Ignacio Morales‐Castilla https://orcid.org/0000-0002-8570-9312
Andrew W. Park https://orcid.org/0000-0003-4080-7274
Shan Huang https://orcid.org/0000-0002-5055-1308
John P. Schmidt https://orcid.org/0000-0001-8549-0587
Patrick R. Stephens https://orcid.org/0000-0003-1995-5715
R E FE R E N C E S
Allen,T.,Murray,K.A.,Zambrana‐Torrelio,C.,Morse,S.S.,Rondinini,C.,DiMarco,M.,…Daszak,P.(2017).Globalhotspotsandcorrelatesofemergingzoonoticdiseases.Nature Communications, 8, 1124. https :// doi.org/10.1038/s41467‐017‐00923‐8
Araújo, M. B., & Peterson, A. T. (2012). Uses and misuses of biocli-matic envelope modeling. Ecology, 93, 1527–1539. https ://doi.org/10.1890/11-1930.1
Barboza, F. R., &Defeo,O. (2015). Global diversity patterns in sandybeach macrofauna: A biogeographic analysis. Scientific Reports, 5, 14515. https ://doi.org/10.1038/srep1 4515
Braxton, S., Onstad, D., Dockter, D., Giordano, R., Larsson, R., &Humber, R. (2003). Description and analysis of two internet‐based databases of insect pathogens: EDWIP and VIDIL. Journal of Invertebrate Pathology, 83, 185–195. https://doi.org/10.1016/S0022-2011(03)00089-2
Brierley,L.,Vonhof,M.J.,Olival,K.J.,Daszak,P.,&Jones,K.E.(2016).Quantifyingglobaldriversofzoonoticbatviruses:Aprocess‐basedperspective. The American Naturalist, 187, E53–E64. https://doi.org/10.1086/684391
Briscoe,N.J.,Elith,J.,Salguero‐Gómez,R.,Lahoz‐Monfort,J.J.,Camac,J.S.,Giljohann,K.M.,…Guillera‐Arroita,G.(2019).Forecastingspe-cies rangedynamicswithprocess‐explicitmodels:Matchingmeth-ods to applications. Ecology Letters, Advance Online Publication.https ://doi.org/10.1111/ele.13348
Byers,J.E.,Schmidt,J.P.,Pappalardo,P.,Haas,S.E.,&Stephens,P.R.(2019).Whatfactorsexplainthegeographical rangeofmammalianparasites? Proceedings of the Royal Society B: Biological Sciences, 286, 20190673.http://dx.doi.org/10.1098/rspb.2019.0673
Carlson,C. J.,Burgio,K.R.,Dougherty, E.R., Phillips,A. J.,Bueno,V.M.,Clements,C.F.,…Getz,W.M.(2017).Parasitebiodiversityfacesextinctionandredistributioninachangingclimate.Science Advances, 3,e1602422.https://doi.org/10.1126/sciadv.1602422
Ceballos, G., & Ehrlich, P. R. (2006). Global mammal distributions,biodiversity hotspots, and conservation. Proceedings of the National Academy of Sciences USA, 103, 19374–19379. https ://doi.org/10.1073/pnas.0609334103
Chao, A., Gotelli, N. J., Hsieh, T. C., Sander, E. L.,Ma, K. H., Colwell,R. K., & Ellison, A. M. (2014). Rarefaction and extrapolation withHill numbers:A framework for sampling andestimation in speciesdiversity studies. Ecological Monographs, 84, 45–67. https://doi.org/10.1890/13-0133.1
Connor, E. F., McCoy, E. D. (1979). The statistics and biology of the spe-cies-area relationship. The American Naturalist, 113, 791–833. https :// doi.org/10.1086/283438
Corrêa, P., Bueno, C., Soares, R., Vieira, F. M., & Muniz‐Pereira, L.C. (2016). Checklist of helminth parasites of wild primates fromBrazil. Revista Mexicana de Biodiversidad, 87, 908–918. https ://doi.org/10.1016/j.rmb.2016.03.008
Cumming,G.S.(1999).HostdistributionsdonotlimitthespeciesrangesofmostAfricanticks(Acari:Ixodida).Bulletin of Entomological Research, 89, 303–327. https ://doi.org/10.1017/S0007 48539 9000450
Cumming, G. S. (2002). Comparing climate and vegetation as limiting fac-torsforspeciesrangesofAfricanticks.Ecology, 83,255–268.https:// doi.org/10.1890/0012‐9658(2002)083[0255:CCAVAL]2.0.CO;2
Dallas, T. (2016). helminthR: An R interface to the London NaturalHistoryMuseum's host‐parasitedatabase.Ecography, 39, 391–393. https ://doi.org/10.1111/ecog.02131
Dinerstein, E., Olson, D., Joshi, A., Vynne, C., Burgess, N. D.,Wikramanayake, E., … Saleem,M. (2017). An ecoregion‐based ap-proach to protecting half the terrestrial realm. BioScience, 67, 534–545.https://doi.org/10.1093/biosci/bix014
Dunn, R. R.,Davies, T. J.,Harris,N. C., &Gavin,M.C. (2010).Globaldrivers of human pathogen richness and prevalence. Proceedings of

| 11PAPPALARDO et AL.
the Royal Society B: Biological Sciences, 277, 2587–2595. https ://doi.org/10.1098/rspb.2010.0340
Ficetola,G.F.,Rondinini,C.,Bonardi,A.,Katariya,V.,Padoa‐Schioppa,E.,&Angulo,A. (2014). An evaluation of the robustness of globalamphibian range maps. Journal of Biogeography, 41, 211–221. https ://doi.org/10.1111/jbi.12206
Fick,S.E.,&Hijmans,R.J.(2017).WorldClim2:New1kmspatialreso-lution climate surfaces for global land areas. International Journal of Climatology, 37,4302–4315.https://doi.org/10.1002/joc.5086
Fritz,S.A.,Bininda‐Emonds,O.R.P.,&Purvis,A.(2009).Geographicalvariation in predictors of mammalian extinction risk: Big is bad,but only in the tropics. Ecology Letters, 12, 538–549. https ://doi.org/10.1111/j.1461‐0248.2009.01307.x
García‐Roselló, E., Guisande, C., Manjarrés‐Hernández, A., González‐Dacosta, J.,Heine, J.,Pelayo‐Villamil,P.,…Lobo, J.M. (2015).Canwe derive macroecological patterns from primary Global Biodiversity Information Facility data? Global Ecology and Biogeography, 24, 335–347.https://doi.org/10.1111/geb.12260
Han,B.A.,Kramer,A.M.,&Drake,J.M.(2016).Globalpatternsofzoo-notic disease in mammals. Trends in Parasitology, 32,565–577.https://doi.org/10.1016/j.pt.2016.04.007
Harris, N. C., & Dunn, R. R. (2010). Using host associations topredict spatial patterns in the species richness of the para-sites of North American carnivores: Carnivore‐parasite rich-ness across space. Ecology Letters, 13, 1411–1418. https ://doi.org/10.1111/j.1461‐0248.2010.01527.x
Hawkins,B.A.,Rueda,M.,&Rodríguez,M.Á. (2008).Whatdo rangemaps and surveys tell us about diversity patterns? Folia Geobotanica, 43, 345–355. https ://doi.org/10.1007/s12224-008-9007-8
Hay,S. I.,Battle,K.E.,Pigott,D.M.,Smith,D.L.,Moyes,C.L.,Bhatt,S., … Gething, P. W. (2013). Global mapping of infectious disease. Philosophical Transactions of the Royal Society B: Biological Sciences, 368, 20120250. https ://doi.org/10.1098/rstb.2012.0250
Hopkins, M. E., & Nunn, C. L. (2007). A global gap analysis of in-fectious agents in wild primates: Gap analysis of primate par-asites. Diversity and Distributions, 13, 561–572. https://doi.org/10.1111/j.1472‐4642.2007.00364.x
IUCN. (2007). The IUCN red list of threatened species. version 2017‐3. Retrieved from http://www.iucnr edlist.org
Jorge, F., & Poulin, R. (2018). Poor geographical match between the dis-tributions of host diversity and parasite discovery effort. Proceedings of the Royal Society B: Biological Sciences, 285,20180072.http://dx.doi.org/10.1098/rspb.2018.0072
Krasnov, B. R., Shenbrot, G. I., Mouillot, D., Khokhlova, I. S., & Poulin, R. (2005). Spatial variation in species diversity and composition of flea assemblages in small mammalian hosts: Geographical distance or faunal similarity? Journal of Biogeography, 32,633–644.https://doi.org/10.1111/j.1365‐2699.2004.01206.x
Larsen, B. B., Miller, E. C., Rhodes, M. K., & Wiens, J. J. (2017). Inordinate fondness multiplied and redistributed: The number of species on earth and the new pie of life. The Quarterly Review of Biology, 92, 229–265.https://doi.org/10.1086/693564
Lindenfors, P.,Nunn,C. L., Jones, K. E., Cunningham,A. A., Sechrest,W., & Gittleman, J. L. (2007). Parasite species richness in carnivores: Effects of host body mass, latitude, geographical range and popula-tion density. Global Ecology and Biogeography, 16,496–509.https://doi.org/10.1111/j.1466‐8238.2006.00301.x
Lobo, J. M., Jimenez‐Valverde, A., & Hortal, J. (2010). The uncer-tain nature of absences and their importance in species dis-tribution modelling. Ecography, 33, 103–114. https ://doi.org/10.1111/j.1600‐0587.2009.06039.x
Merow,C.,Wilson,A.M.,&Jetz,W.(2017).Integratingoccurrencedataand expert maps for improved species range predictions. Global Ecology and Biogeography, 26, 243–258. https ://doi.org/10.1111/geb.12539
Meyer,C.,Jetz,W.,Guralnick,R.P.,Fritz,S.A.,&Kreft,H.(2016).Rangegeometry and socio-economics dominate species-level biases in occurrence information. Global Ecology and Biogeography, 25, 1181–1193. https ://doi.org/10.1111/geb.12483
Meyer,C.,Kreft,H.,Guralnick,R.,&Jetz,W.(2015).Globalprioritiesforan effective information basis of biodiversity distributions. Nature Communications, 6, 8221. https ://doi.org/10.1038/ncomm s9221
Morales‐Castilla, I., Olalla‐Tárraga, M. Á., Bini, L. M., De Marco, P.,Jr., Hawkins, B. A., & RodríGuez, M. Á. (2011). Niche conserva-tism and species richness patterns of squamate reptiles in east-ern and southernAfrica.Austral Ecology, 36, 550–558. https ://doi.org/10.1111/j.1442‐9993.2010.02186.x
Morand,S.,Cribb,T.H.,Kulbicki,M.,Rigby,M.C.,Chauvet,C.,Dufour,V.,… Sasal, P. (2000). Endoparasite species richness of New Caledonian butterflyfishes:Hostdensityanddietmatter.Parasitology, 121,65–73.https://doi.org/10.1017/S0031182099006058
Myers,N.,Mittermeier,R.A.,Mittermeier,C.G.,daFonseca,G.A.B.,& Kent, J. (2000). Biodiversity hotspots for conservation priorities. Nature, 403, 853–858. https ://doi.org/10.1038/35002501
Nunn,C.L.,Altizer,S.,Jones,K.E.,&Sechrest,W.(2003).Comparativetests of parasite species richness in primates. The American Naturalist, 162,597–614.https://doi.org/10.1086/378721
Olival,K.J.,Hosseini,P.R.,Zambrana‐Torrelio,C.,Ross,N.,Bogich,T.L.,&Daszak,P. (2017).Hostandviral traitspredictzoonoticspilloverfrom mammals. Nature, 546,646–650.
Olson, D. M., Dinerstein, E., Wikramanayake, E. D., Burgess, N. D., Powell, G. V. N., Underwood, E. C., … Kassem, K. R. (2001). Terrestrial ecoregionsoftheworld:Anewmapoflifeonearth.BioScience, 51, 933–938. https://doi.org/10.1641/0006‐3568(2001)051[0933:-TEOTWA]2.0.CO;2
Orme, C. D. L., Davies, R. G., Burgess, M., Eigenbrod, F., Pickup, N., Olson, V.A.,…Owens, I.P.F. (2005).Globalhotspotsofspecies richnessare not congruent with endemism or threat. Nature, 436,1016–1019.https ://doi.org/10.1038/natur e03850
Pedersen, A. B., &Davies, T. J. (2009). Cross‐species pathogen trans-mission and disease emergence in primates. EcoHealth, 6,496–508.https ://doi.org/10.1007/s10393-010-0284-3
Pedersen,A.B.,Jones,K.E.,Nunn,C.L.,&Altizer,S.(2007).Infectiousdiseasesandextinctionrisk inwildmammals.Conservation Biology, 21,1269–1279.https://doi.org/10.1111/j.1523‐1739.2007.00776.x
Poulin, R. (2003). The decay of similarity with geographical distance in parasite communities of vertebrate hosts. Journal of Biogeography, 30,1609–1615.https://doi.org/10.1046/j.1365‐2699.2003.00949.x
Poulin, R., & Morand, S. (2004). Parasite biodiversity. Washington, DC: Smithsonian Institution Press.
R Core Team. (2018). R: A language and environment for statistical comput‐ing.Vienna,Austria:RFoundationforStatisticalComputing.
Rhode, K. (1992). Latitudinal gradients in species diversity: The search for the primary cause. Oikos, 65, 514–527. https ://doi.org/10.2307/3545569
Shenbrot,G.I.,Krasnov,B.R.,&Lu,L.(2007).Geographicalrangesizeandhostspecificityinectoparasites:AcasestudywithAmphipsylla fleas and rodent hosts. Journal of Biogeography, 34, 1679–1690. https:// doi.org/10.1111/j.1365‐2699.2007.01736.x
SoaresMagalhaes,R.J.,Clements,A.C.A.,Patil,A.P.,Gething,P.W.,& Brooker, S. (2011). The applications of model-based geostatistics in helminth epidemiology and control. Advances in Parasitology, 74, 267–296.
Stephens, P. R., Altizer, S., Ezenwa, V. O., Gittleman, J. L., Moan, E.,Han,B.,…Pappalardo,P. (2019).Parasitesharing inwildungulatesand their predators: Effects of phylogeny, range overlap, and tro-phic links. Journal of Animal Ecology, 88, 1017–1028. https ://doi.org/10.1111/1365‐2656.12987
Stephens,P.R.,Altizer,S.,Smith,K.F.,AlonsoAguirre,A.,Brown,J.H.,Budischak,S.A.,…Poulin,R.(2016).Themacroecologyofinfectious
12 | PAPPALARDO et AL.
diseases:Anewperspectiveonglobal‐scaledriversofpathogendis-tributions and impacts. Ecology Letters, 19, 1159–1171. https ://doi.org/10.1111/ele.12644
Stephens, P. R., Pappalardo, P., Huang, S., Byers, J. E., Farrell, M. J.,Gehman, A., … Nunn, C. L. (2017). Global mammal parasite data-base version 2.0. Ecology, 98, 1476–1476.https://doi.org/10.1002/ecy.1799
Timi, J. T., & Poulin, R. (2003). Parasite community structure within and acrosshostpopulationsofamarinepelagicfish:Howrepeatableisit?International Journal for Parasitology, 33,1353–1362.
Walther,B.A.,Cotgreave,P.,Price,R.D.,Gregory,R.D.,&Clayton,D.H.(1995).Samplingeffortandparasitespeciesrichness.Parasitology Today, 11,306–310.https://doi.org/10.1016/0169‐4758(95)80047‐6
Wardeh,M.,Risley,C.,McIntyre,M.K.,Setzkorn,C.,&Baylis,M.(2015).Database of host-pathogen and related species interactions, and their global distribution. Scientific Data, 2, 150049. https ://doi.org/10.1038/sdata.2015.49
Wells,K.,Gibson,D.I.,Clark,N.J.,Ribas,A.,Morand,S.,&McCallum,H.I. (2018). Global spread of helminth parasites at the human-domes-tic animal-wildlife interface. Global Change Biology, 24,3254–3265.https://doi.org/10.1111/gcb.14064
Wiens,J.J.,&Donoghue,M.J.(2004).Historicalbiogeography,ecologyand species richness. Trends in Ecology and Evolution, 19, 639–644.https://doi.org/10.1016/j.tree.2004.09.011
Wiethoelter,A.K.,Beltrán‐Alcrudo,D.,Kock,R.,&Mor, S.M. (2015).Global trends in infectious diseases at the wildlife—livestock inter-face. Proceedings of the National Academy of SciencesUSA, 112,9662–9667.https://doi.org/10.1073/pnas.1422741112
BIOSKE TCH
SUPPORTING INFORMATIONAdditional supporting information may be found online in theSupporting Information section at the end of the article.
How to cite this article: Pappalardo P, Morales-Castilla I, Park AW,HuangS,SchmidtJP,StephensPR.Comparingmethodsfor mapping global parasite diversity. Global Ecol Biogeogr. 2019;00:1–12. https ://doi.org/10.1111/geb.13008
Paula Pappalardo is an ecologist interested in the factors affecting species distributions and biodiversity (https ://paula pappa lardo.weebly.com/). This work was part of the Macroecology of Infectious Disease Research Coordination Network (http://disea semac roeco logy.ecolo gy.uga.edu/), a collaborativeprojectbringingtogetherexpertsinmacroecol-ogy, evolutionary biology, infectious disease ecology, and data science to investigate drivers of the global diversity and distribution patterns in parasitic organisms.