COMPARING ITEM PARAMETER ESTIMATES AND FIT …
12
Jurnal Penelitian dan Evaluasi Pendidikan Volume 24, No 1, June 2020 (39-50) Online: http://journal.uny.ac.id/index.php/jpep ISSN: 2685-7111 (print) This is an open access article under the CC-BY-SA license. 2338-6061 (online) COMPARING ITEM PARAMETER ESTIMATES AND FIT STATISTICS OF THE RASCH MODEL FROM THREE DIFFERENT TRADITIONS Bahrul Hayat 1* , Muhammad Dwirifqi Kharisma Putra 2 , Bambang Suryadi 1 1 Department of Psychology, Universitas Islam Negeri Syarif Hidayatullah Jakarta Jl. Kertamukti No.5, Cireundeu, Ciputat Timur, Kota Tangerang Selatan, Banten 15419, Indonesia 2 Department of Psychology, Universitas Gadjah Mada Jl. Sosio Humaniora, Bulaksumur, Karangmalang, Depok, Sleman, Yogyakarta 55281, Indonesia *Corresponding Author. E-mail: [email protected] ABSTRACT Rasch model is a method that has a long history in its application in the fields of social and behavioral sciences, including educational measurement. Under certain circumstances, Rasch models are known as a special case of Item response theory (IRT), while IRT is equivalent to the Item Factor Analysis (IFA) models as a special case of Structural Equation Models (SEM), although there are other „tradition‟ that consider Rasch measurement models not part of both. In this study, a simulation study was conducted using simulated data to explain how the inter- relationships between the Rasch model as a constraint version of 2-parameter logistic (2-PL) IRT, Rasch model as an item factor analysis were compared with the Rasch measurement model using Mplus, IRTPRO and WINSTEPS program, each of which came from its own 'tradition'. The results of this study indicate that Rasch models and IFA as a special case of SEM are mathematically equal, as well as the Rasch measurement model, but due to different philosophical perspectives, people might vary in their understanding of this concept. Given the findings of this study, it is expected that confusion and misunderstanding between the three can be overcome. Keywords: item factor analysis, item response theory, Rasch measurement model How to cite: Hayat, B., Putra, M., & Suryadi, B. (2020). Comparing item parameter estimates and fit statistics of the Rasch model from three different traditions. Jurnal Penelitian dan Evaluasi Pendidikan, 24(1), 39-50. doi:https://doi.org/10.21831/pep.v24i1. 29871 INTRODUCTION An item response theory (IRT) model contains entities (observable variables and per- son-proficiency variables) and relationships (link functions) around which models are struc- tured and through which probability-based inference is carried out (Mislevy, 2018). There are two traditions in IRT modeling: a data-based tradition and a model-based tradition. In the data- based tradition, different models within the IRT family are explored to find the best fitting model for available data. By contrast, in a model-based tradition, a model with appealing mathematical properties is selected first and test are designed to fit the model (Alberto Maydeu-Olivares & Montaño, 2013). One of the model-based tradition is the Rasch measure- ment model (Rasch, 1960; Wright, 1968). In the field of educational measurement in recent years, there has been an increasing need to use Rasch model as a tool for analyzing assessment data in Indonesia, including large- scale assessment at the national level (i.e., Indonesia National Assessment Program). Since the Rasch model was introduced in Indonesia by the late Bruce H. Choppin in 1975 (Nasoetion et al., 1976), this method has a long history of its use in educational measurement in Indonesia. Some research conducted by Indonesian scholars by applying the Rasch model has been car-
Transcript of COMPARING ITEM PARAMETER ESTIMATES AND FIT …
Jurnal Penelitian dan Evaluasi Pendidikan Volume 24, No 1, June 2020 (39-50)
Online: http://journal.uny.ac.id/index.php/jpep
ISSN: 2685-7111 (print) This is an open access article under the CC-BY-SA license. 2338-6061 (online)
COMPARING ITEM PARAMETER ESTIMATES AND FIT STATISTICS OF THE RASCH MODEL FROM THREE DIFFERENT TRADITIONS
Bahrul Hayat1*, Muhammad Dwirifqi Kharisma Putra2, Bambang Suryadi1 1Department of Psychology, Universitas Islam Negeri Syarif Hidayatullah Jakarta
Jl. Kertamukti No.5, Cireundeu, Ciputat Timur, Kota Tangerang Selatan, Banten 15419, Indonesia 2Department of Psychology, Universitas Gadjah Mada
Jl. Sosio Humaniora, Bulaksumur, Karangmalang, Depok, Sleman, Yogyakarta 55281, Indonesia *Corresponding Author. E-mail: [email protected]
ABSTRACT Rasch model is a method that has a long history in its application in the fields of social and behavioral sciences, including educational measurement. Under certain circumstances, Rasch models are known as a special case of Item response theory (IRT), while IRT is equivalent to the Item Factor Analysis (IFA) models as a special case of Structural Equation Models (SEM), although there are other „tradition‟ that consider Rasch measurement models not part of both. In this study, a simulation study was conducted using simulated data to explain how the inter-relationships between the Rasch model as a constraint version of 2-parameter logistic (2-PL) IRT, Rasch model as an item factor analysis were compared with the Rasch measurement model using Mplus, IRTPRO and WINSTEPS program, each of which came from its own 'tradition'. The results of this study indicate that Rasch models and IFA as a special case of SEM are mathematically equal, as well as the Rasch measurement model, but due to different philosophical perspectives, people might vary in their understanding of this concept. Given the findings of this study, it is expected that confusion and misunderstanding between the three can be overcome. Keywords: item factor analysis, item response theory, Rasch measurement model How to cite: Hayat, B., Putra, M., & Suryadi, B. (2020). Comparing item parameter estimates and fit statistics of the Rasch model from three different traditions. Jurnal Penelitian dan Evaluasi Pendidikan, 24(1), 39-50. doi:https://doi.org/10.21831/pep.v24i1. 29871
INTRODUCTION
An item response theory (IRT) model contains entities (observable variables and per-son-proficiency variables) and relationships (link functions) around which models are struc-tured and through which probability-based inference is carried out (Mislevy, 2018). There are two traditions in IRT modeling: a data-based tradition and a model-based tradition. In the data-based tradition, different models within the IRT family are explored to find the best fitting model for available data. By contrast, in a model-based tradition, a model with appealing mathematical properties is selected first and test are designed to fit the model (Alberto Maydeu-Olivares & Montaño, 2013). One of the model-based tradition is the Rasch measure-ment model (Rasch, 1960; Wright, 1968).
In the field of educational measurement in recent years, there has been an increasing need to use Rasch model as a tool for analyzing assessment data in Indonesia, including large-scale assessment at the national level (i.e., Indonesia National Assessment Program). Since the Rasch model was introduced in Indonesia by the late Bruce H. Choppin in 1975 (Nasoetion et al., 1976), this method has a long history of its use in educational measurement in Indonesia. Some research conducted by Indonesian scholars by applying the Rasch model has been car-
40 – Bahrul Hayat, Muhammad Dwirifqi Kharisma Putra, & Bambang Suryadi
https://doi.org/10.21831/pep.v24i1.29871
Copyright © 2020, Jurnal Penelitian dan Evaluasi Pendidikan, 24(1), 2020 ISSN (print) 2685-7111 | ISSN (online) 2338-6061
ried out in the United States on dissertation by Umar (1987) that use Rasch model as a special case of Structural Equation Models (SEM) which equivalent to item factor analysis, Hayat (1992) who used Rasch measurement model from Wright (1968) version, Bastari (2000) used Rasch model as a 1-parameter logistic (1-PL) IRT model, and the latest one is by Wihardini (2016) that use multidimensional and generalized version of the Rasch model.
In general, the development of latent trait theory (also known as Item Response Theory) has a long history and can be traced from a different „tradition‟. The ETS (Educational Testing Service) version said that Fred Lord was the first person who invented IRT (Carlson & von Davier, 2013), while another view noted that Thurstone was established IRT long before Lord (Bock, 2005), other version focused on the history of the development of Rasch measurement model from Georg Rasch (Wright, 2005). In addition, there is research that finds about IRT and CFA are special cases of SEM and are all the same (Little, 2018; Muthén, 1988; Muthen et al., 1991). Furthermore, there is another opinion that says there are three test theories: Classic-al test theory, Item response theory and Rasch measurement theory (Andrich, 2011), in line with another opinions that say so many IRT literature asserts that 1-PL same as Rasch model, this is misleading. The mathematical equations can look similar, but their motivation is entirely different (Linacre, 2018), which means that the Rasch measurement model is clearly “not a part” of IRT. Of the various opinions here, differences, similarities, and interrelations between these methods should be understood before it is applied.
However, now, the application of Rasch models in Indonesia is still shrouded in con-fusion because of the failure to understand the similarities and differences between the IRT, Rasch measurement models, and Confirmatory Factor Analysis (CFA) as a special case of Structural Equation Modeling (SEM) which can also accommodate categorical data. In order to overcome this problem, an explanation of the similarities and differences between the three „traditions‟ are needed. Thus, the purpose of this study was to explain the similarities and differences between IRT, CFA as a special case of SEM, and Rasch measurement models. The results of this study are expected to provide a clear description and eliminate confusion in understanding the three concepts and their application in research.
The Rasch Model and 1-PL IRT
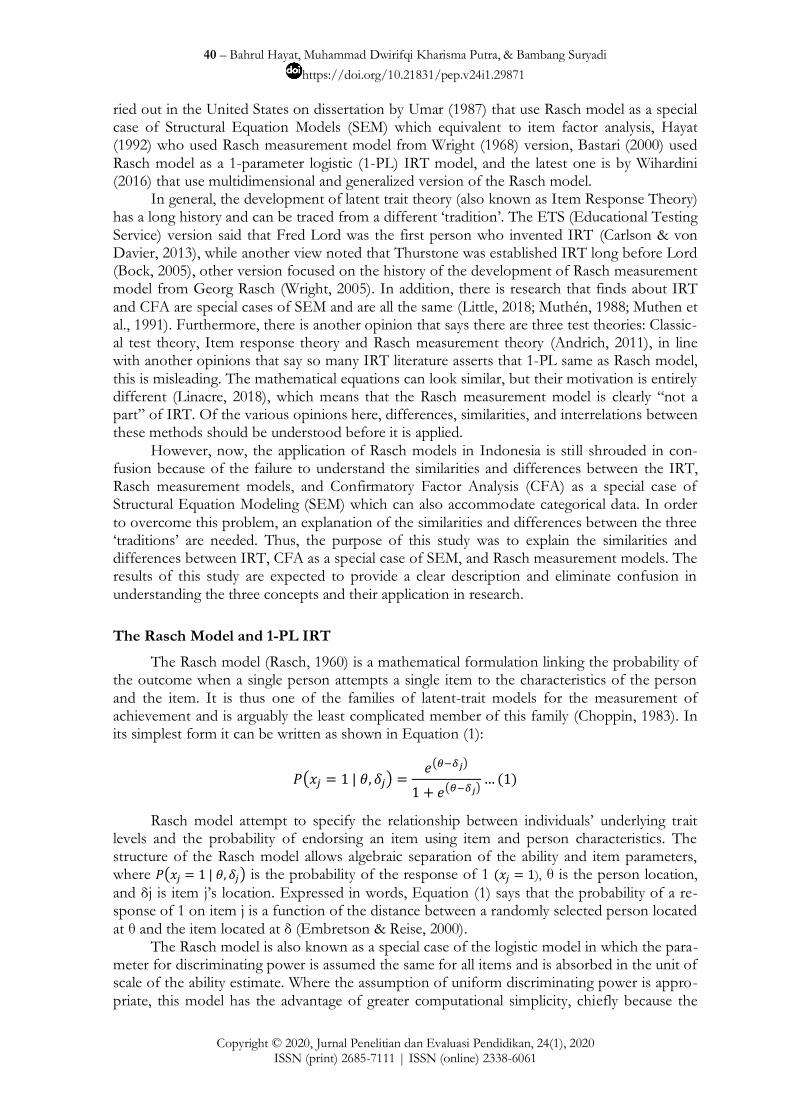
The Rasch model (Rasch, 1960) is a mathematical formulation linking the probability of the outcome when a single person attempts a single item to the characteristics of the person and the item. It is thus one of the families of latent-trait models for the measurement of achievement and is arguably the least complicated member of this family (Choppin, 1983). In its simplest form it can be written as shown in Equation (1):
( ) ( )
( )
Rasch model attempt to specify the relationship between individuals‟ underlying trait levels and the probability of endorsing an item using item and person characteristics. The structure of the Rasch model allows algebraic separation of the ability and item parameters, where ( ) is the probability of the response of 1 ), θ is the person location,
and δj is item j‟s location. Expressed in words, Equation (1) says that the probability of a re-sponse of 1 on item j is a function of the distance between a randomly selected person located at θ and the item located at δ (Embretson & Reise, 2000).
The Rasch model is also known as a special case of the logistic model in which the para-meter for discriminating power is assumed the same for all items and is absorbed in the unit of scale of the ability estimate. Where the assumption of uniform discriminating power is appro-priate, this model has the advantage of greater computational simplicity, chiefly because the
41 – Bahrul Hayat, Muhammad Dwirifqi Kharisma Putra, & Bambang Suryadi
https://doi.org/10.21831/pep.v24i1.29871
Copyright © 2020, Jurnal Penelitian dan Evaluasi Pendidikan, 24(1), 2020 ISSN (print) 2685-7111 | ISSN (online) 2338-6061
test score (number right) is a sufficient statistic for the estimation of latent ability. This con-trasts with Birnbaum's logistic model, where a weighted sum of the dichotomous item scores is the sufficient statistic (Bock & Wood, 1971). The Rasch models has three fundamental as-sumptions: (1) unidimensionality of the latent trait, (2) parallel item characteristic curves (ICCs), and (3) local independence (Mair, 2018).
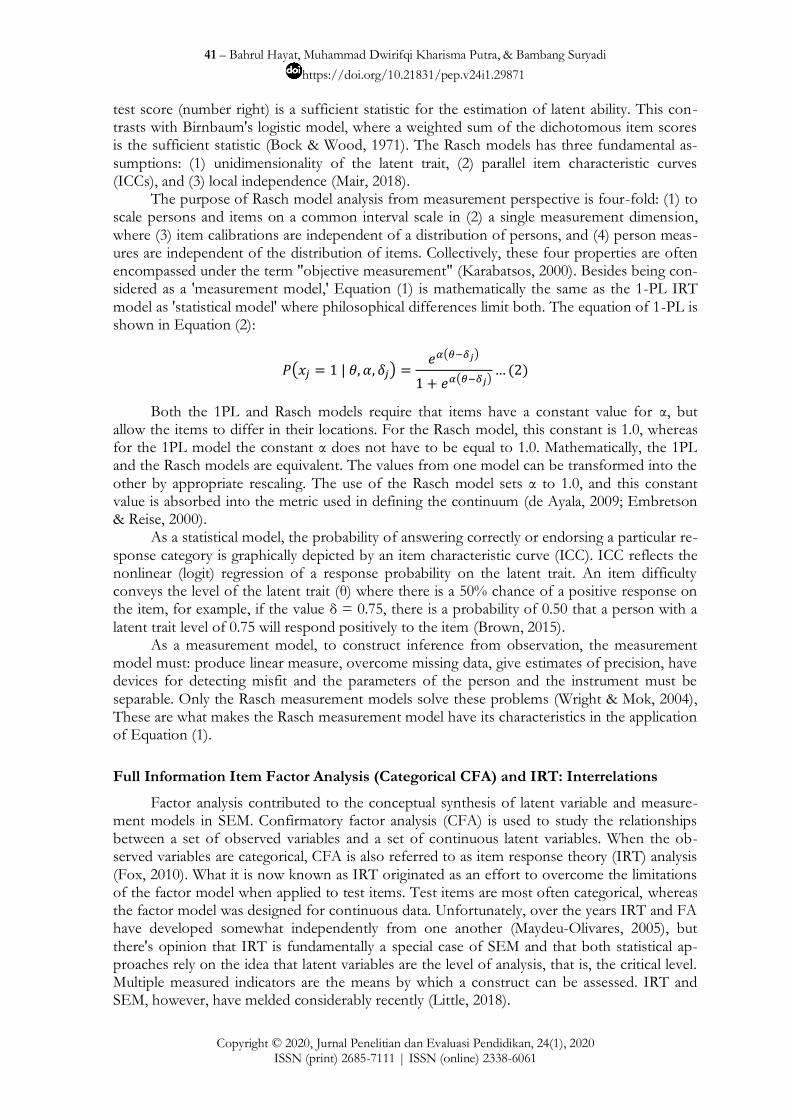
The purpose of Rasch model analysis from measurement perspective is four-fold: (1) to scale persons and items on a common interval scale in (2) a single measurement dimension, where (3) item calibrations are independent of a distribution of persons, and (4) person meas-ures are independent of the distribution of items. Collectively, these four properties are often encompassed under the term "objective measurement" (Karabatsos, 2000). Besides being con-sidered as a 'measurement model,' Equation (1) is mathematically the same as the 1-PL IRT model as 'statistical model' where philosophical differences limit both. The equation of 1-PL is shown in Equation (2):
( ) ( )
( )
Both the 1PL and Rasch models require that items have a constant value for α, but allow the items to differ in their locations. For the Rasch model, this constant is 1.0, whereas for the 1PL model the constant α does not have to be equal to 1.0. Mathematically, the 1PL and the Rasch models are equivalent. The values from one model can be transformed into the other by appropriate rescaling. The use of the Rasch model sets α to 1.0, and this constant value is absorbed into the metric used in defining the continuum (de Ayala, 2009; Embretson & Reise, 2000).
As a statistical model, the probability of answering correctly or endorsing a particular re-sponse category is graphically depicted by an item characteristic curve (ICC). ICC reflects the nonlinear (logit) regression of a response probability on the latent trait. An item difficulty conveys the level of the latent trait (θ) where there is a 50% chance of a positive response on the item, for example, if the value δ = 0.75, there is a probability of 0.50 that a person with a latent trait level of 0.75 will respond positively to the item (Brown, 2015).
As a measurement model, to construct inference from observation, the measurement model must: produce linear measure, overcome missing data, give estimates of precision, have devices for detecting misfit and the parameters of the person and the instrument must be separable. Only the Rasch measurement models solve these problems (Wright & Mok, 2004), These are what makes the Rasch measurement model have its characteristics in the application of Equation (1).
Full Information Item Factor Analysis (Categorical CFA) and IRT: Interrelations
Factor analysis contributed to the conceptual synthesis of latent variable and measure-ment models in SEM. Confirmatory factor analysis (CFA) is used to study the relationships between a set of observed variables and a set of continuous latent variables. When the ob-served variables are categorical, CFA is also referred to as item response theory (IRT) analysis (Fox, 2010). What it is now known as IRT originated as an effort to overcome the limitations of the factor model when applied to test items. Test items are most often categorical, whereas the factor model was designed for continuous data. Unfortunately, over the years IRT and FA have developed somewhat independently from one another (Maydeu-Olivares, 2005), but there's opinion that IRT is fundamentally a special case of SEM and that both statistical ap-proaches rely on the idea that latent variables are the level of analysis, that is, the critical level. Multiple measured indicators are the means by which a construct can be assessed. IRT and SEM, however, have melded considerably recently (Little, 2018).
42 – Bahrul Hayat, Muhammad Dwirifqi Kharisma Putra, & Bambang Suryadi
https://doi.org/10.21831/pep.v24i1.29871
Copyright © 2020, Jurnal Penelitian dan Evaluasi Pendidikan, 24(1), 2020 ISSN (print) 2685-7111 | ISSN (online) 2338-6061
From the factor analysis and Mplus users‟ point of view, popular IRT models, such as one-parameter and two-parameter IRT models, are the measurement modeling part of SEM and are special cases of factor analysis with categorical, ordinal data; thus, those who are main-ly the users of Mplus for factor analysis with categorical, ordinal data might wonder the degree of performance of those IRT model estimation by Mplus. In addition, because Mplus provides several different estimation options, users may be curious about the comparative performance of varying estimation options embedded in Mplus for the estimation of item response theory models. The same curiosity regarding the performance of SEM software for IRT model esti-mation may also exist among the item response theory software users and researchers (Paek et al., 2018).
There are three closely related uses of item response theory (IRT) and factor analysis (FA) models in applied social and behavioral science research. First, the item response theory and factor analysis models are used to understand better the psychometric structure under-lying a set of items. Second, IRT or FA procedures are used to construct tests that meet some targeted criterion regarding reliability, validity, or test length. The third and often most ubi-quitous goal relies directly on the first two and involves using the final IRT or FA model structure to obtain maximally valid and reliable scale scores to be used in subsequent statistical or graphical analysis. Such scores are sometimes referred to as factor scores (Curran et al., 2016). A critical difference between IRT and factor analytic approaches is how the data are treated. While factor analytic methods ex-amine covariances (or relationships) between the individual items, IRT models examine the overall response patterns across all of the items (Embretson & Reise, 2000).
As a consequence of evaluating item response patterns, the parameter estimates ob-tained provide insight into how the items function. This type of information can be particular-ly useful during the process of developing a survey. In addition, factor analytic approaches construct a linear relationship between the factor score and item response. This contrasts the IRT approach, which constructs a nonlinear relationship between latent traits and item re-sponses (Depaoli et al., 2018).
As cited in Cai (2013), the IFA model is based on Thurstone‟s common factor model, as a factor analysis of categorical item-level data. For the i-th person‟s response to the j-th item, a p-factor model is assumed for the underlying response process variate
such that
∑ where the continue to denote the normally distributed latent common fac-
tors with mean zero and unit variance, is the factor loading, and is normally distributed
with mean zero and unique variance ∑
so that
is has unit variance. The
common factors and unique factors are uncorrelated. The observed 0 and 1 response is re-lated to
via a threshold parameter , such that is observed if and
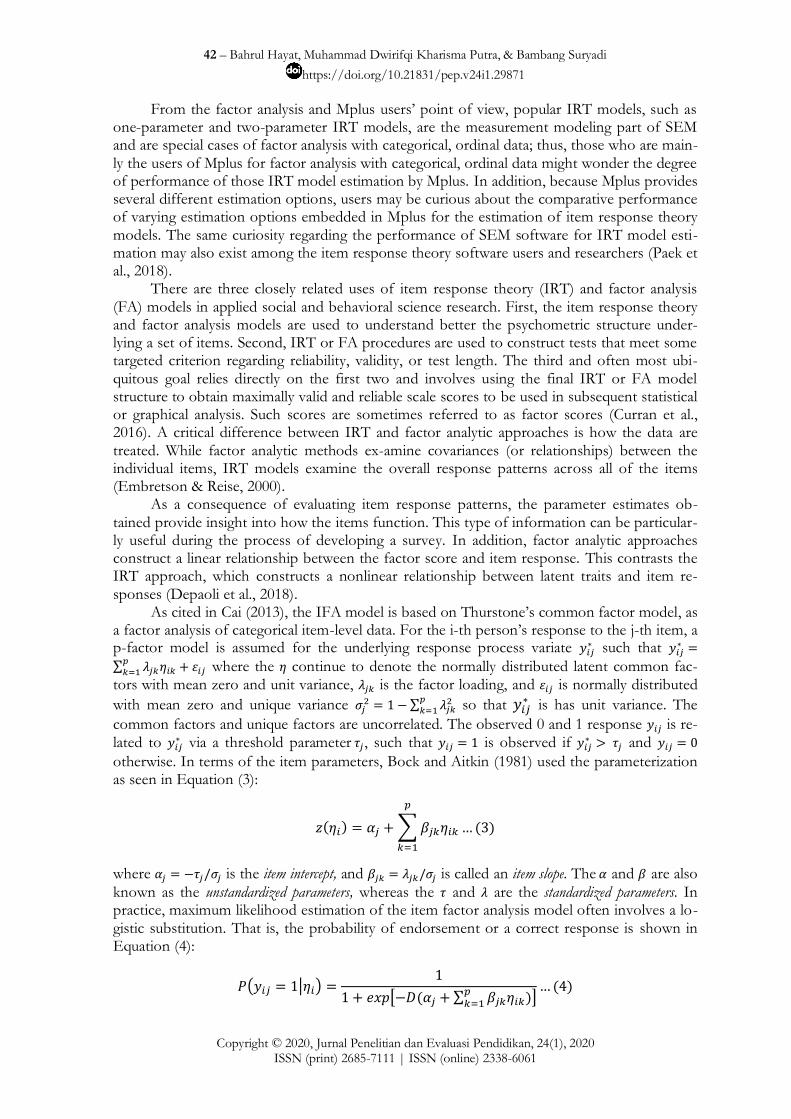
otherwise. In terms of the item parameters, Bock and Aitkin (1981) used the parameterization as seen in Equation (3):
∑
where is the item intercept, and is called an item slope. The and are also
known as the unstandardized parameters, whereas the and are the standardized parameters. In practice, maximum likelihood estimation of the item factor analysis model often involves a lo-gistic substitution. That is, the probability of endorsement or a correct response is shown in Equation (4):
( | )
[ ∑ ]
43 – Bahrul Hayat, Muhammad Dwirifqi Kharisma Putra, & Bambang Suryadi
https://doi.org/10.21831/pep.v24i1.29871
Copyright © 2020, Jurnal Penelitian dan Evaluasi Pendidikan, 24(1), 2020 ISSN (print) 2685-7111 | ISSN (online) 2338-6061
where D is a scaling constant (1.7) such that the logistic function becomes identical in shape to the normal ogive function (Cai, 2013). Item discrimination parameters (a) are analogous to factor loadings in CFA because they represent the relationship between the latent trait and the item responses. Similarly, the item thresholds in CFA correspond to the item difficulty para-meters (b) estimated in IRT. However, by using CFA parameterization, an IRT difficulty para-meter can be directly calculated as shown by Equation (5) (Brown, 2015):
where is the CFA item threshold, and is the CFA factor loading. With this background, the parallels of CFA as a special case of SEM and IRT should become clear.
Equating Coefficients from Dichotomous Rasch Model to 1-PL IRT Model
Bastari (2000) shows that we can equate the coefficients of different forms of the scale using linear transformation. We can directly compare the 1-PL estimates from IRTPRO with those of dichotomous Rasch model from WINSTEPS. Short of just making statements about the linear agreement of estimates across the two metrics, we could not directly compare the estimates from the two different metrics because of differences in the origins and units used. One simple approach is based on using the means and standard deviations of the item loca-tions. In this approach, the transformation coefficient ζ is obtained by taking the ratio of the target to initial metric item location standard deviations (de Ayala, 2009), as presented in Equation (6):
where sδ* is the standard deviation of the item locations on the target metric and sδ is the standard deviation of the item locations on the initial metric. Once ζ is determined, the other transformation coefficient κ is obtained by Equation (7):
where is the mean of the item locations on the target metric and is the mean of the item
locations on the initial metric. Transforming the location estimate for item-j to the target met-ric yields Equation (8):
RESEARCH METHOD
Design and Data Generation
To demonstrate the equivalence of categorical CFA (Item Factor Analysis, IFA) as a special case of SEM, „traditional‟ IRT and also Rasch measurement model, item response data were generated using Monte Carlo (MC) simulation. The MC method involved generating a sampling distribution of a compound statistic by using point estimates of its component statis-tics, along with the asymptotic covariance matrix of these estimates and assumptions about how the component statistics are distributed (Preacher & Selig, 2012). The model used in this simulation study had 20 observed variables with one sample size condition N = 1000 and gen-erated based on 1-PL IRT model using Mplus 8.4. Person and item parameters were generated using informative prior distribution for difficulty parameters using beta~(a=2, b=4) and for
44 – Bahrul Hayat, Muhammad Dwirifqi Kharisma Putra, & Bambang Suryadi
https://doi.org/10.21831/pep.v24i1.29871
Copyright © 2020, Jurnal Penelitian dan Evaluasi Pendidikan, 24(1), 2020 ISSN (print) 2685-7111 | ISSN (online) 2338-6061
person ability using beta~(a=3, b=4). We used 1000 replications and these 1000 datasets were analyzed and compared in a head-to-head comparison of these three „traditions‟.
Analyses
For the purpose of comparison, three software were used to estimate the parameter across 1000 replications: Mplus 8.4 with weighted least square mean and variance adjusted estimator (WLSMV), IRTPRO 4.2 with marginal maximum likelihood estimator (MML), WINSTEPS 4.2.0 using joint maximum likelihood estimator (JMLE). Four parameter types were studied, namely: (a) factor loadings of IFA, (b) threshold of IFA, (c) IRT (Rasch) diffi-culty parameter, and (d) IRT (or Rasch) discrimination parameter. Because the primary con-cern of this study was the similarity and conversion between IFA, IRT and „Rasch measure-ment‟. Differences among individual parameters within a type are presented. Therefore, results were averaged across the individual parameters for the four types of parameters. We also show the transformation from IFA parameter to IRT 1-parameter normal ogive model (1-PNO) and also transforming Rasch model parameter to 1-PL (parameter logistic) IRT.
FINDINGS AND DISCUSSION
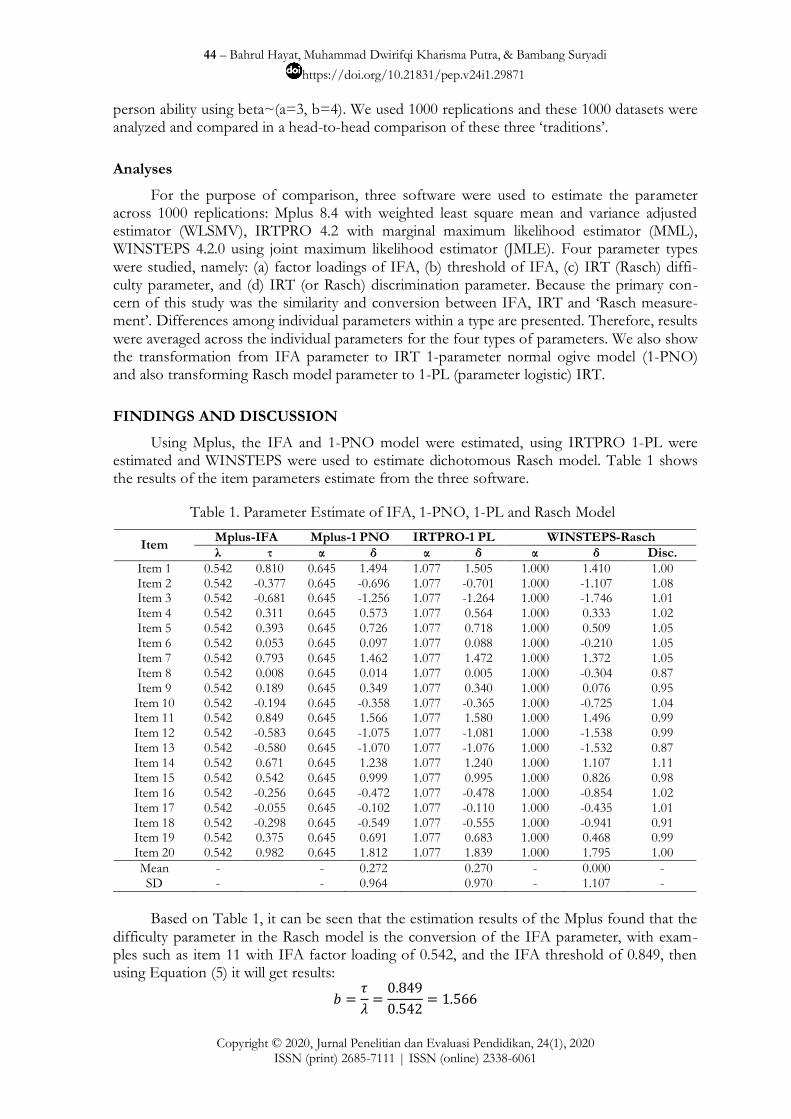
Using Mplus, the IFA and 1-PNO model were estimated, using IRTPRO 1-PL were estimated and WINSTEPS were used to estimate dichotomous Rasch model. Table 1 shows the results of the item parameters estimate from the three software.
Table 1. Parameter Estimate of IFA, 1-PNO, 1-PL and Rasch Model
Item Mplus-IFA Mplus-1 PNO IRTPRO-1 PL WINSTEPS-Rasch
λ τ α δ α δ α δ Disc.
Item 1 0.542 0.810 0.645 1.494 1.077 1.505 1.000 1.410 1.00 Item 2 0.542 -0.377 0.645 -0.696 1.077 -0.701 1.000 -1.107 1.08 Item 3 0.542 -0.681 0.645 -1.256 1.077 -1.264 1.000 -1.746 1.01 Item 4 0.542 0.311 0.645 0.573 1.077 0.564 1.000 0.333 1.02 Item 5 0.542 0.393 0.645 0.726 1.077 0.718 1.000 0.509 1.05 Item 6 0.542 0.053 0.645 0.097 1.077 0.088 1.000 -0.210 1.05 Item 7 0.542 0.793 0.645 1.462 1.077 1.472 1.000 1.372 1.05 Item 8 0.542 0.008 0.645 0.014 1.077 0.005 1.000 -0.304 0.87 Item 9 0.542 0.189 0.645 0.349 1.077 0.340 1.000 0.076 0.95 Item 10 0.542 -0.194 0.645 -0.358 1.077 -0.365 1.000 -0.725 1.04 Item 11 0.542 0.849 0.645 1.566 1.077 1.580 1.000 1.496 0.99 Item 12 0.542 -0.583 0.645 -1.075 1.077 -1.081 1.000 -1.538 0.99 Item 13 0.542 -0.580 0.645 -1.070 1.077 -1.076 1.000 -1.532 0.87 Item 14 0.542 0.671 0.645 1.238 1.077 1.240 1.000 1.107 1.11 Item 15 0.542 0.542 0.645 0.999 1.077 0.995 1.000 0.826 0.98 Item 16 0.542 -0.256 0.645 -0.472 1.077 -0.478 1.000 -0.854 1.02 Item 17 0.542 -0.055 0.645 -0.102 1.077 -0.110 1.000 -0.435 1.01 Item 18 0.542 -0.298 0.645 -0.549 1.077 -0.555 1.000 -0.941 0.91 Item 19 0.542 0.375 0.645 0.691 1.077 0.683 1.000 0.468 0.99 Item 20 0.542 0.982 0.645 1.812 1.077 1.839 1.000 1.795 1.00
Mean - - 0.272 0.270 - 0.000 - SD - - 0.964 0.970 - 1.107 -
Based on Table 1, it can be seen that the estimation results of the Mplus found that the
difficulty parameter in the Rasch model is the conversion of the IFA parameter, with exam-ples such as item 11 with IFA factor loading of 0.542, and the IFA threshold of 0.849, then using Equation (5) it will get results:
45 – Bahrul Hayat, Muhammad Dwirifqi Kharisma Putra, & Bambang Suryadi
https://doi.org/10.21831/pep.v24i1.29871
Copyright © 2020, Jurnal Penelitian dan Evaluasi Pendidikan, 24(1), 2020 ISSN (print) 2685-7111 | ISSN (online) 2338-6061
The same calculation also applies to other items. This indeed has shown that IFA and IRT are the same things. This approach used by various studies that have understood that these two things are the same (Muthén, 1988; Muthen et al., 1991; Takane & de Leeuw, 1987). The results of the conversion of the FA to the IRT can be compared with the parameter esti-mation of the IRTPRO software which is also almost the same with a minimal difference. However, the main difference between FA and IRT is the absence of the term „calibration‟ in FA as commonly found in the application of IRT. This findings in line with some opinions that stated how IRT models are similar to factor analytic models in that they both provide in-formation about dimensionality and model fit (i.e. how well a scoring option reflects the data (Kamata & Bauer, 2008)).
The estimates that are produced by WINSTEPS are different. As we can see in Table 1, there is a „discrimination‟ from WINSTEPS estimation even Rasch models assert that items exhibit the model-specified item discrimination. Empirically, however, item discriminations vary. During the estimation phase of Winsteps, all item discriminations are asserted to be equal, of value 1.0, and to fit the Rasch model. However, empirical item discriminations never are exactly equal, so Winsteps can also report an estimate of those discriminations post-hoc (as a type of fit statistic). The amount of the departure of the discrimination from 1.0 is an indication of the degree to which that item misfits the Rasch model (Linacre, 2018; Masters, 1988).
The differences are twofold, the first difference are the mean of item difficulty is to set equal to 0, the second difference is there are no assumption that the person ability distribution to be a particular parametric form, such as a normal distribution (Paek & Cole, 2020), al-though the estimation results from WINSTEPS can be transformed into 1-PL models with equating coefficients with Equation (6-8). Given that 1-PL and Rasch model SD are 0.970 and 1.107, we apply Equation (6) and we have:
Because the respective initial and target metric means are 0.000 (mean of item difficulty in Rasch model) and 0.270 (1-PL mean of item difficulty), we have that:
As an example, we used item 11 difficulty from the Rasch model ( ) using the WINSTEPS from Table 1. Transforming the difficulty estimates for item 11 to the IRT 1-PL yields:
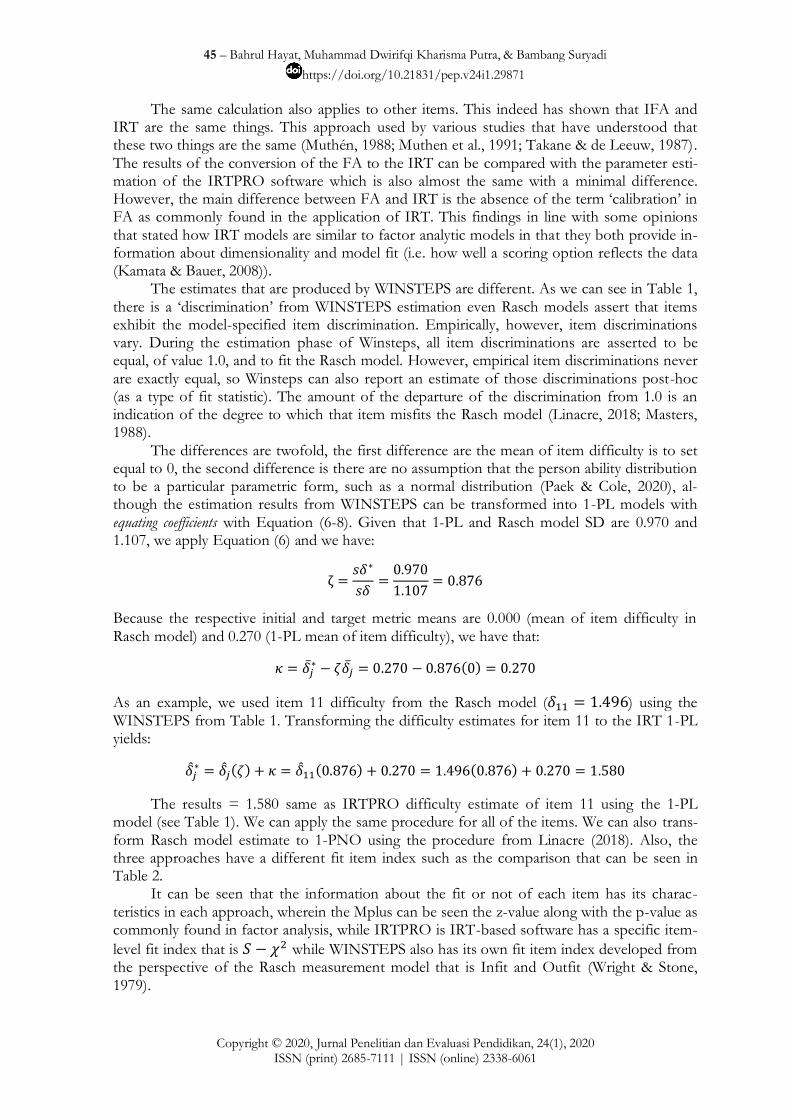
The results = 1.580 same as IRTPRO difficulty estimate of item 11 using the 1-PL model (see Table 1). We can apply the same procedure for all of the items. We can also trans-form Rasch model estimate to 1-PNO using the procedure from Linacre (2018). Also, the three approaches have a different fit item index such as the comparison that can be seen in Table 2.
It can be seen that the information about the fit or not of each item has its charac-teristics in each approach, wherein the Mplus can be seen the z-value along with the p-value as commonly found in factor analysis, while IRTPRO is IRT-based software has a specific item-
level fit index that is while WINSTEPS also has its own fit item index developed from the perspective of the Rasch measurement model that is Infit and Outfit (Wright & Stone, 1979).
46 – Bahrul Hayat, Muhammad Dwirifqi Kharisma Putra, & Bambang Suryadi
https://doi.org/10.21831/pep.v24i1.29871
Copyright © 2020, Jurnal Penelitian dan Evaluasi Pendidikan, 24(1), 2020 ISSN (print) 2685-7111 | ISSN (online) 2338-6061
Table 2. Item Fit Indices of the 1-PNO, 1-PL & Rasch Model for Each Item
Item Mplus IRTPRO WINSTEPS
z-value p-value p-value Infit Outfit PTMEA
Item 1 16.253 0.000 15.017 0.5247 1.00 0.97 0.43 Item 2 -9.055 0.000 9.334 0.8598 0.97 0.92 0.48 Item 3 -14.705 0.000 15.220 0.4373 0.99 0.99 0.43 Item 4 7.493 0.000 21.858 0.1474 0.99 1.00 0.48 Item 5 9.347 0.000 11.851 0.7549 0.98 0.92 0.49 Item 6 1.326 0.185 11.847 0.7551 0.98 0.98 0.49 Item 7 15.959 0.000 15.680 0.4053 0.96 0.89 0.46 Item 8 0.190 0.850 21.905 0.1100 1.05 1.08 0.44 Item 9 4.691 0.000 14.685 0.5491 1.02 1.03 0.46 Item 10 -4.847 0.000 14.833 0.4650 0.98 0.97 0.48 Item 11 16.592 0.000 20.173 0.1649 1.00 1.15 0.42 Item 12 -13.285 0.000 22.811 0.0880 1.02 0.97 0.43 Item 13 -13.137 0.000 24.037 0.0643 1.06 1.21 0.38 Item 14 14.184 0.000 24.906 0.0511 0.92 0.84 0.50 Item 15 12.102 0.000 24.310 0.0599 1.01 1.03 0.45 Item 16 -6.331 0.000 21.516 0.1208 0.99 1.03 0.47 Item 17 -1.390 0.164 16.206 0.3702 0.99 1.04 0.48 Item 18 -7.289 0.000 14.937 0.5306 1.03 1.09 0.43 Item 19 8.864 0.000 18.096 0.3174 1.00 1.01 0.47 Item 20 18.035 0.000 16.725 0.3375 1.00 0.99 0.40
From statistical modeling perspectives, item fit refers to whether an item of a questio-
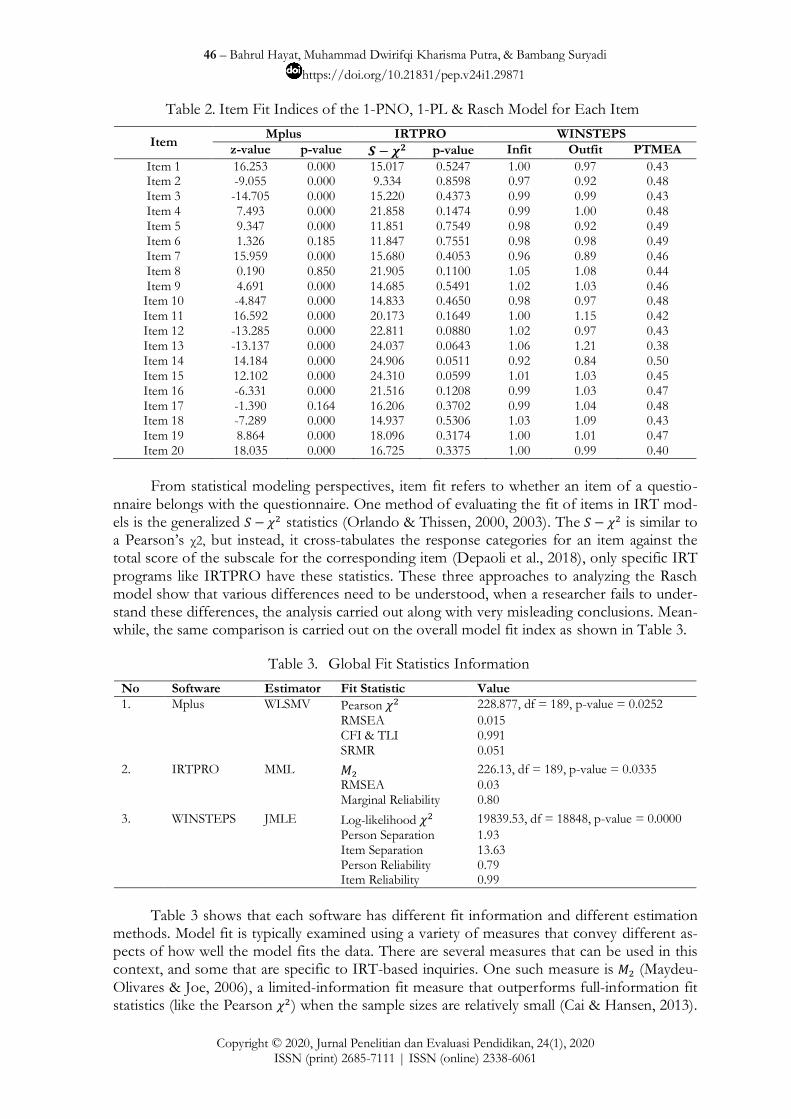
nnaire belongs with the questionnaire. One method of evaluating the fit of items in IRT mod-els is the generalized statistics (Orlando & Thissen, 2000, 2003). The is similar to a Pearson‟s χ2, but instead, it cross-tabulates the response categories for an item against the total score of the subscale for the corresponding item (Depaoli et al., 2018), only specific IRT programs like IRTPRO have these statistics. These three approaches to analyzing the Rasch model show that various differences need to be understood, when a researcher fails to under-stand these differences, the analysis carried out along with very misleading conclusions. Mean-while, the same comparison is carried out on the overall model fit index as shown in Table 3.
Table 3. Global Fit Statistics Information
No Software Estimator Fit Statistic Value
1. Mplus WLSMV Pearson 228.877, df = 189, p-value = 0.0252
RMSEA 0.015 CFI & TLI 0.991 SRMR 0.051
2. IRTPRO MML 226.13, df = 189, p-value = 0.0335
RMSEA 0.03 Marginal Reliability 0.80
3. WINSTEPS JMLE Log-likelihood 19839.53, df = 18848, p-value = 0.0000
Person Separation 1.93 Item Separation 13.63 Person Reliability 0.79 Item Reliability 0.99
Table 3 shows that each software has different fit information and different estimation
methods. Model fit is typically examined using a variety of measures that convey different as-pects of how well the model fits the data. There are several measures that can be used in this context, and some that are specific to IRT-based inquiries. One such measure is (Maydeu-Olivares & Joe, 2006), a limited-information fit measure that outperforms full-information fit statistics (like the Pearson ) when the sample sizes are relatively small (Cai & Hansen, 2013).
47 – Bahrul Hayat, Muhammad Dwirifqi Kharisma Putra, & Bambang Suryadi
https://doi.org/10.21831/pep.v24i1.29871
Copyright © 2020, Jurnal Penelitian dan Evaluasi Pendidikan, 24(1), 2020 ISSN (print) 2685-7111 | ISSN (online) 2338-6061
The indicates an adequately fitting model when the p-value is greater than .05. Another measure is the root mean square error of approximation (RMSEA), indicating an adequately fitting model when the confidence interval covers or is below .05 (MacCallum et al., 1996).
With the same data, Mplus produces nonsignificant Pearson with a significance < 0.05 which means that the model is not fit for the data, IRTPRO shows significant which means it is not fit but the value of RMSEA < 0.05 from Mplus and IRTPRO indicates that the model is fit. Meanwhile, WINSTEPS is different from Mplus and IRTPRO. The data must fit the model and if the data and the model disagree, it is the data that must be changed, not the model (Linacre, 2010). However, WINSTEPS also provides global fit information through
Log-likelihood where the significant results p < 0.05 indicate that the occurrence of a mis-fit on the data has significant effect, this statistics are rarely reported. From these differences we can get an overview of the philosophical differences from the Rasch measurement model, IRT and CFA.
From the IRT‟s perspective, Rasch models are considered a constraint version of the 2-PL model where item discrimination is equal for all items (the values are not always 1), while the Rasch measurement model is a measurement model that fix item discrimination to 1. The fundamental difference that must be understood is that when we use the Rasch model as a 1-PL model, if the model is not fit, we need to modify the model, while from the perspective of the Rasch measurement model, when the data is not fit to the Rasch model, the data are re-moved from analysis, for example people or items that misfit (Linacre, 2010). This conceptual difference should not confuse researchers in Indonesia. Before using this method, the re-searchers suggested to refer to various literature that explains these conceptual differences (e.g., de Ayala, 2009; Embretson & Reise, 2000; Linacre, 2010) so they can minimalize the confusions.
If we try to explain the earliest and latest dissertation of Indonesian scholars in terms of the application of the Rasch models, Under guidance of Bengt O. Muthen, Umar (1987) using Rasch models as a particular case of SEM, this approach can be seen from works on CFA with binary indicators which means the transformation of CFA parameters is carried out into the IRT. Thus, Umar did not use statistics such as Infit and Outfit derived from a different tradition. Under the guidance of Benjamin D. Wright, Hayat (1992) used a Rasch measure-ment model where he developed an item bank using the Rasch measurement model approach. Under the guidance of Ronald K. Hambleton, Bastari (2000), respectively, using IRT derived from Lord (1952) where the Rasch model is a constraint version of the 3-PL model as a statistical model. The last, under the guidance of Mark Wilson, Wihardini (2016) explained the uses of generalized Rasch models when the data is multidimensional. In sum, Umar (1987), Bastari (2000), and Wihardini (2016) used Rasch model from the data-based tradition, and Hayat (1992) used Rasch measurement models from model-based tradition.
CONCLUSION
The results of this study indicate that IRT as a special case from SEM can be proven, where IRT and categorical data factor analysis (item factor analysis) are mathematically equal. Although the Rasch model can be seen as a measurement model and as a statistical model, it remains a unity in which its position as a special case of IRT is not wrong even though the perspective of the Rasch model as a measurement model or model-based tradition also pro-vides benefits especially regarding criterion referencing. Therefore, it is important for re-searchers to understand the philosophical differences that separate the three „traditions‟, which means data-based, model-based tradition or using scale transformation from item factor ana-lysis, including the item fit statistics, the goodness-of-fit index, the fit of data to model or the fit of the model to the data, different estimation methods, and the software produced by these three „traditions‟.
48 – Bahrul Hayat, Muhammad Dwirifqi Kharisma Putra, & Bambang Suryadi
https://doi.org/10.21831/pep.v24i1.29871
Copyright © 2020, Jurnal Penelitian dan Evaluasi Pendidikan, 24(1), 2020 ISSN (print) 2685-7111 | ISSN (online) 2338-6061
REFERENCES
Andrich, D. (2011). Rating scales and Rasch measurement. Expert Review of Pharmacoeconomics & Outcomes Research, 11(5), 571–585. https://doi.org/10.1586/erp.11.59
Bastari, B. (2000). Linking multiple-choice and constructed-response items to a common proficiency scale. Doctoral dissertation. University of Massachusetts, Amherst.
Bock, R. Darrell. (2005). A brief history of Item Theory Response. Educational Measurement: Issues and Practice, 16(4), 21–33. https://doi.org/10.1111/j.1745-3992.1997.tb00605.x
Bock, R. Darrell, & Aitkin, M. (1981). Marginal maximum likelihood estimation of item parameters: Application of an EM algorithm. Psychometrika, 46(4), 443–459. https:// doi.org/10.1007/BF02293801
Bock, R D, & Wood, R. (1971). Test theory. Annual Review of Psychology, 22(1), 193–224. https://doi.org/10.1146/annurev.ps.22.020171.001205
Brown, T. A. (2015). Confirmatory factor analysis for applied research (2nd ed.). Guilford Press.
Cai, L. (2013). Factor analysis of tests and items. In K. F. Geisinger, B. A. Bracken, J. F. Carlson, J.-I. C. Hansen, N. R. Kuncel, S. P. Reise, & M. C. Rodriguez (Eds.), APA handbooks in psychology: APA handbook of testing and assessment in psychology, Vol. 1. Test theory and testing and assessment in industrial and organizational psychology (pp. 85–100). American Psychological Association.
Cai, Li, & Hansen, M. (2013). Limited-information goodness-of-fit testing of hierarchical item factor models. British Journal of Mathematical and Statistical Psychology, 66(2), 245–276. https://doi.org/10.1111/j.2044-8317.2012.02050.x
Carlson, J. E., & von Davier, M. (2013). Item response theory (Research Report 13–28). Educational Testing Service.
Choppin, B. (1983). The Rasch model for item analysis (CSE Report No. 219).
Curran, P. J., Cole, V., Bauer, D. J., Hussong, A. M., & Gottfredson, N. (2016). Improving factor score estimation through the use of bbserved background characteristics. Structural Equation Modeling: A Multidisciplinary Journal, 23(6), 827–844. https://doi.org/ 10.1080/10705511.2016.1220839
de Ayala, R. J. (2009). The theory and practice of Item Response Theory. Guilford Press.
Depaoli, S., Tiemensma, J., & Felt, J. M. (2018). Assessment of health surveys: Fitting a multidimensional graded response model. Psychology, Health & Medicine, 23(sup1), 13–31. https://doi.org/10.1080/13548506.2018.1447136
Embretson, S. E., & Reise, S. P. (2000). Item response theory for psychologists. Lawrence Erlbaum Associates.
Fox, J.-P. (2010). Bayesian item response modeling: Theory and applications. Springer Science+Business Media.
Hayat, B. (1992). A mathematics item bank for Indonesia. Doctoral dissertation. University of Chicago, Chicago, IL.
Kamata, A., & Bauer, D. J. (2008). A note on the relation between factor analytic and item response theory models. Structural Equation Modeling: A Multidisciplinary Journal, 15(1), 136–153. https://doi.org/10.1080/10705510701758406
Karabatsos, G. (2000). A critique of Rasch residual fit statistics. Journal of Applied Measurement, 1(2), 152–176.
49 – Bahrul Hayat, Muhammad Dwirifqi Kharisma Putra, & Bambang Suryadi
https://doi.org/10.21831/pep.v24i1.29871
Copyright © 2020, Jurnal Penelitian dan Evaluasi Pendidikan, 24(1), 2020 ISSN (print) 2685-7111 | ISSN (online) 2338-6061
Linacre, J. M. (2010). Two perspectives on the application of Rasch models. European Journal of Physical and Rehabilitation Medicine, 46(2), 309–310. https://www.minervamedica.it/ en/journals/europa-medicophysica/article.php?cod=R33Y2010N02A0309
Linacre, J. M. (2018). Winsteps® Rasch measurement computer program: User’s guide. Winsteps.com.
Little, T. D. (2018). Core principles of life course health development methodology and analytics. In N. Halfon, C. B. Forrest, R. M. Lerner, & E. M. Faustman (Eds.), Handbook of life course health development (pp. 523–540). Springer Nature.
Lord, F. (1952). A theory of test scores (Psychometric monograph no. 7). Psychometric Corporation. https://www.psychometricsociety.org/sites/main/files/file-attachments/mn07.pdf?157 6607452
MacCallum, R. C., Browne, M. W., & Sugawara, H. M. (1996). Power analysis and determination of sample size for covariance structure modeling. Psychological Methods, 1(2), 130–149. https://doi.org/10.1037/1082-989X.1.2.130
Mair, P. (2018). Modern psychometric with R. Springer International.
Masters, G. N. (1988). Item discrimination: When more is worse. Journal of Educational Measurement, 25(1), 15–29. https://doi.org/10.1111/j.1745-3984.1988.tb00288.x
Maydeu-Olivares, A. (2005). Linear item response theory, nonlinear item response theory, and factor analysis: A unified framework. In A. Maydeu-Olivares & J. J. McArdle (Eds.), Contemporary psychometrics: A festschrift for Roderick P. McDonald (pp. 73–100). Lawrence Erlbaum Associates.
Maydeu-Olivares, Albert, & Joe, H. (2006). Limited information goodness-of-fit testing in multidimensional contingency tables. Psychometrika, 71(4), 713–732. https://doi.org/ 10.1007/s11336-005-1295-9
Maydeu-Olivares, Alberto, & Montaño, R. (2013). How should we assess the fit of Rasch-type models? Approximating the power of goodness-of-fit statistics in categorical data analysis. Psychometrika, 78(1), 116–133. https://doi.org/10.1007/s11336-012-9293-1
Mislevy, R. J. (2018). Sociocognitive foundations of educational measurement. Routledge.
Muthén, B. (1988). Some uses of structural equation modeling in validity studies: Extending IRT to external variables. In H. Wainer & H. Braun (Eds.), Test validity (pp. 213–238). Lawrence Erlbaum Associates.
Muthen, B. O., Kao, C.-F., & Burstein, L. (1991). Instructionally sensitive psychometrics: Application of a new IRT-based detection technique to mathematics achievement test items. Journal of Educational Measurement, 28(1), 1–22. https://doi.org/10.1111/j.1745-3984.1991.tb00340.x
Nasoetion, N., Djalil, A., Musa, I., Soelistyo, S., Choppin, B. H., & Postlethwaithe, T. N. (1976). The development of educational evaluation models in Indonesia. Office of Educational and Cultural Research and Development (BP3K) of the Ministry of Education and Culture.
Orlando, M., & Thissen, D. (2000). Likelihood-based item-fit indices for dichotomous item response theory models. Applied Psychological Measurement, 24(1), 50–64. https://doi.org/ 10.1177/01466216000241003
Orlando, M., & Thissen, D. (2003). Further investigation of the performance of S - X2: An item fit index for use with dichotomous item response theory models. Applied Psychological Measurement, 27(4), 289–298. https://doi.org/10.1177/014662160302700 4004
50 – Bahrul Hayat, Muhammad Dwirifqi Kharisma Putra, & Bambang Suryadi
https://doi.org/10.21831/pep.v24i1.29871
Copyright © 2020, Jurnal Penelitian dan Evaluasi Pendidikan, 24(1), 2020 ISSN (print) 2685-7111 | ISSN (online) 2338-6061
Paek, I., & Cole, K. (2020). Using R for item response theory model applications. Routledge.
Paek, Insu, Cui, M., Öztürk Gübeş, N., & Yang, Y. (2018). Estimation of an IRT model by Mplus for dichotomously scored responses under different estimation methods. Educational and Psychological Measurement, 78(4), 569–588. https://doi.org/10.1177/00131 64417715738
Preacher, K. J., & Selig, J. P. (2012). Advantages of Monte Carlo confidence intervals for indirect effects. Communication Methods and Measures, 6(2), 77–98. https://doi.org/ 10.1080/19312458.2012.679848
Rasch, G. (1960). Probabilistic models for some intelligence and attainment tests. Danish Institute for Educational Research.
Takane, Y., & de Leeuw, J. (1987). On the relationship between item response theory and factor analysis of discretized variables. Psychometrika, 52(3), 393–408. https://doi.org/ 10.1007/BF02294363
Umar, J. (1987). Robustness of the simple linking procedure in item banking using the Rasch model. Doctoral dissertation. University of California, Los Angeles.
Wihardini, D. (2016). An investigation of the relationship of student performance to their opportunity-to-learn in PISA 2012 mathematics: The case of Indonesia. Doctoral dissertation. University of California, Berkeley.
Wright, B. D. (1968). Sample-free test calibration and person measurement. Proceedings of the 1967 Invitational Conference of Testing Problems.
Wright, B. D., & Mok, M. M. C. (2004). An overview of the family of Rasch measurement models. In E. V. Smith & R. M. Smith (Eds.), Introduction to Rasch measurement: Theory, models and applications. JAM Press.
Wright, B. D., & Stone, M. H. (1979). Best test design. Mesa Press.
Wright, Benjamin D. (2005). A history of social science measurement. Educational Measurement: Issues and Practice, 16(4), 33–45. https://doi.org/10.1111/j.1745-3992.1997.tb00606.x