Lesson # 11 Comparing Prices To save money when we shop… We need to compare prices ! !
C O R P O R A T I O N
Research Report
Comparing Insulin Prices in the United States to Other Countries
Results from a Price Index Analysis
Andrew W. Mulcahy, Daniel Schwam, Nathaniel Edenfield

Limited Print and Electronic Distribution Rights
This document and trademark(s) contained herein are protected by law. This representation of RAND intellectual property is provided for noncommercial use only. Unauthorized posting of this publication online is prohibited. Permission is given to duplicate this document for personal use only, as long as it is unaltered and complete. Permission is required from RAND to reproduce, or reuse in another form, any of its research documents for commercial use. For information on reprint and linking permissions, please visit www.rand.org/pubs/permissions.
The RAND Corporation is a research organization that develops solutions to public policy challenges to help make communities throughout the world safer and more secure, healthier and more prosperous. RAND is nonprofit, nonpartisan, and committed to the public interest.
RAND’s publications do not necessarily reflect the opinions of its research clients and sponsors.
www.rand.org
For more information on this publication, visit www.rand.org/t/RRA788-1
Published by the RAND Corporation, Santa Monica, Calif.
© Copyright 2020 RAND Corporation
R® is a registered trademark.

iii
Preface
Insulin prices have increased dramatically over the past decade in the United States. This report presents results from a comparison of international prices for insulins using a price index approach. The report describes the shares of volume and sales for all insulins and different categories of insulin in the United States and 32 comparison Organisation for Economic Co-operation and Development countries. For the market basket of insulins sold in both the United States and comparison countries, it reports ratios of U.S. insulin prices to insulin prices in other countries.
This research was funded by the U.S. Department of Health and Human Services Office of the Assistant Secretary for Planning and Evaluation under Contract Number HHSP233201500038I and carried out within the Payment, Cost, and Coverage Program in RAND Health Care.
RAND Health Care, a division of the RAND Corporation, promotes healthier societies by improving health care systems in the United States and other countries. We do this by providing health care decisionmakers, practitioners, and consumers with actionable, rigorous, objective evidence to support their most complex decisions. For more information, see www.rand.org/health-care, or contact
RAND Health Care Communications 1776 Main Street P.O. Box 2138 Santa Monica, CA 90407-2138 (310) 393-0411, ext. 7775 [email protected]

iv
Contents
Preface ........................................................................................................................................... iiiFigures and Tables ........................................................................................................................... vAcknowledgments ........................................................................................................................ viiAbbreviations .............................................................................................................................. viii1. Background and Analysis ............................................................................................................ 1
Background ............................................................................................................................................... 1Data and Methods ...................................................................................................................................... 1
2. Results ......................................................................................................................................... 5Shares of Volume and Sales ...................................................................................................................... 5Average Prices per Standard Unit ........................................................................................................... 10Price Index Comparisons ........................................................................................................................ 12
3. Summary of Findings ................................................................................................................ 16Appendix. Exhibits ........................................................................................................................ 18References ..................................................................................................................................... 25
v
Figures and Tables
Figures Figure 2.1. Shares of Insulin Volume Versus Shares of Insulin Sales Among 33 OECD
Countries, 2018 ........................................................................................................................ 5Figure 2.2. Insulin Volume Shares, by Insulin Type, Selected Comparisons, 2018 ....................... 6Figure 2.3. Insulin Sales Shares, by Insulin Type, Selected Comparisons, 2018 ........................... 6Figure 2.4. Insulin Volume Shares, by Insulin Timing Category, Selected Comparisons, 2018 .... 7Figure 2.5. Insulin Sales Shares, by Insulin Timing Category, Selected Comparisons, 2018 ........ 8Figure 2.6. Prescription Versus Nonprescription Insulin Volume Shares, by Category, 2018 ....... 9Figure 2.7. Prescription Versus Nonprescription Insulin Sales Shares, by Category, 2018 ........... 9Figure 2.8. Average Price per Standard Unit, by Insulin Type, Selected Comparisons, 2018 ...... 10Figure 2.9. Average Price per Standard Unit, by Insulin Timing Category,
Selected Comparisons, 2018 ................................................................................................. 11Figure 2.10. Price Index Comparison, by Insulin Type, Selected Comparisons, 2018 ................. 12Figure 2.11. Price Index Comparison, by Insulin Timing Category, Selected Comparisons,
2018 ....................................................................................................................................... 13Figure 2.12. Price Index Results Comparison, Presentation Level Versus Molecule Level,
2018 ....................................................................................................................................... 15
Tables Table A.1. Insulin Active-Ingredient Mapping ............................................................................. 18Table A.2. Insulin Volume and Sales Shares, by Insulin Type, 33 Select OECD Countries,
2018 ....................................................................................................................................... 19Table A.3. Average Price per Standard Unit, Overall and by Insulin Type, 33 Select OECD
Countries, 2018 ...................................................................................................................... 20Table A.4. U.S. Prices Relative to Comparison Country Prices in Percentage Points,
Overall and by Insulin Type, 33 Select OECD Countries, 2018 ........................................... 21Table A.5. Share of Insulin Sales and Volume Contributing to Presentation-Level Bilateral
Price Index Comparisons, 2018 ............................................................................................. 22Table A.6. U.S. Prices Relative to Comparison Country Prices in Percentage Points at the
Active-Ingredient Level, Overall and by Insulin Type, 33 Select OECD Countries, 2018 ....................................................................................................................................... 23
Table A.7. Average U.S. Price per Standard Unit for Short-Acting Insulins, by Prescription Status, 2018 ........................................................................................................................... 24

vi
Table A.8. U.S. Prices Relative to Comparison Country Prices in Percentage Points for Prescription Records, Overall and by Insulin Type, 33 Select OECD Countries, 2018 ....... 24

vii
Acknowledgments
We thank Amber Jessup, Kenneth Finegold, and Zeid El-Kilani at the U.S. Department of Health and Human Services, Office of the Assistant Secretary for Planning and Evaluation, for their contributions during the course of our research and the development of this report. We thank Christine Eibner, Christine Buttorff, and Chris Whaley of the RAND Corporation for their suggestions and comments as peer reviewers of a draft of this report.

viii
Abbreviations
ASPE Office of the Assistant Secretary for Planning and Evaluation
I intermediate-acting
L long-acting
NFC new form code
NPH neutral protamine Hagedorn
OECD Organisation for Economic Co-operation and Development
R rapid-acting
RI rapid–intermediate-acting
S short-acting
SI short–intermediate-acting
SU standard unit
USD U.S. dollars

1
1. Background and Analysis
Background Insulin list prices in the United States have increased dramatically over the past decade. For
example, in an analysis of the Center for Medicare & Medicaid Services’ National Average Drug Acquisition Cost data, Cefalu et al. (2018) found that the average U.S. wholesale-acquisition price for rapid-acting, long-acting, and short-acting insulin increased by 15–17 percent per year from 2012 to 2016. They also found that average out-of-pocket costs between 2006 and 2013 for insulin-using Medicare Part D enrollees increased by 10 percent per year. In an analysis of individuals ages 18 to 64 with employer-sponsored health insurance, Fuglesten Biniek and Johnson (2019) found that insulin spending per person doubled between 2012 and 2016, increasing from $1,432 to $2,853 even after accounting for a 50-percent rebate.
The U.S. Department of Health and Human Services Office of the Assistant Secretary for Planning and Evaluation (ASPE) asked the RAND Corporation to compare U.S. and other-country prices for insulins, including for all insulins combined and for different categories of insulins.
Data and Methods
Source Data
ASPE provided us with a list of insulin active ingredients categorized on two dimensions. The first dimension—which we call an insulin type—concerns whether the insulin active ingredient is human or analog (i.e., a variant of human insulin). Analogs of human insulin, such as insulin lispro and insulin detemir, differ from human insulin in terms of uptake and duration of effect and can offer additional health benefits to patients. The second dimension—which we call insulin timing—concerns which of the following timing characteristics accurately describes the insulin’s active ingredient:
1. rapid-acting 2. rapid–intermediate-acting 3. short-acting 4. short–intermediate-acting 5. intermediate-acting 6. long-acting.1
1 In figures and tables, we abbreviate these timing characteristics thus: rapid-acting (R), rapid–intermediate-acting (RI), short-acting (S), short–intermediate-acting (SI), intermediate-acting (I), and long-acting (L).

2
The onset, peak, and duration times of insulins in these timing categories vary. Some patients with diabetes follow a regimen of multiple insulins from different timing categories; for example, a patient may use a bolus rapid-acting insulin around meals and a basal (background) long-acting insulin. In this analysis, we treat insulin type and insulin timing separately. In other words, a single timing category can include both human and analog insulins, and a single type category can include insulins in different timing categories.
In our analysis, we used prescription-drug market data from IQVIA’s MIDAS database.2 The data we examined cover the year 2018 and span 33 Organisation for Economic Co-operation and Development (OECD) countries, including the United States.3 We did not restrict our analysis to prescription drugs, as certain insulins are available over the counter in some countries (including the United States).
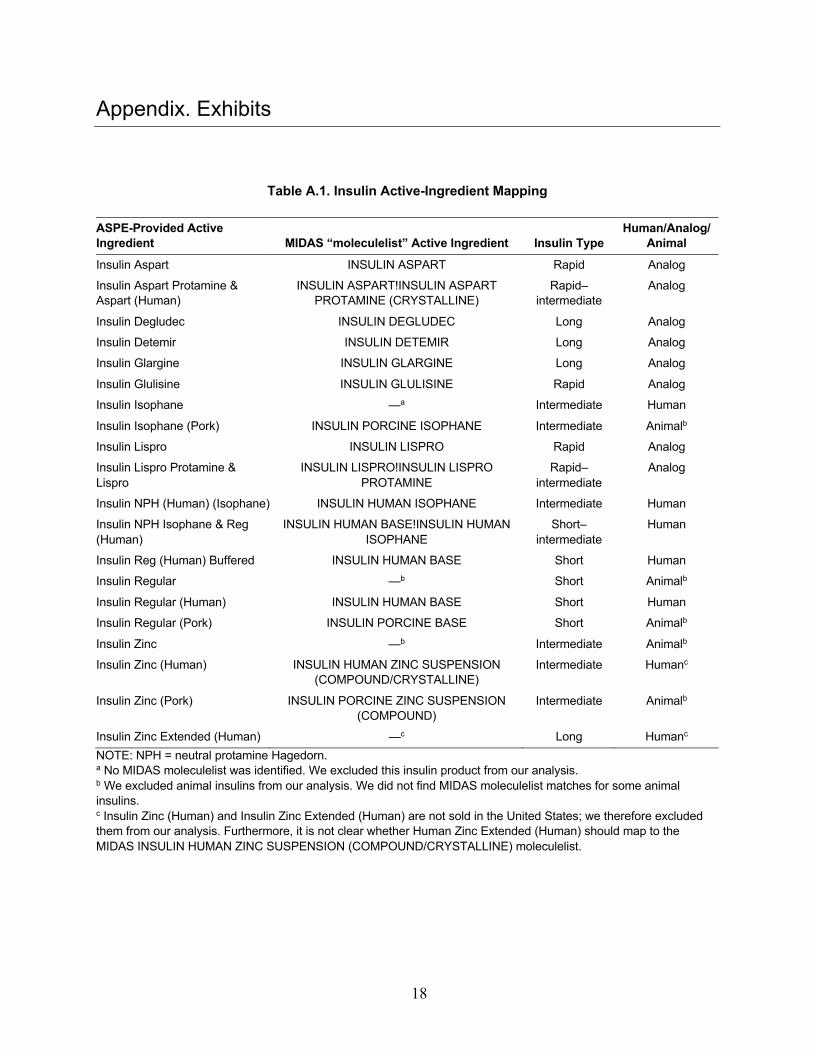
We matched the active ingredients on the ASPE-provided list to MIDAS active ingredients using a mix of string matching and manual crosswalking to resolve spelling differences (see Table A.1). We excluded animal insulin products from our analysis because they accounted for an extremely small share (less than a hundredth of a percent) of both total sales and volume across all countries and because they were not sold in the United States in 2018.
The MIDAS extracts we initially received from ASPE were provided at a very granular level, including different records for individual manufacturers, pack sizes, and other characteristics. We used the fields nfc123 (“new form code”) and intstrength (“international dosage strength”) to collapse the MIDAS extract to the country–active ingredient–form–strength level, which we refer to as the country-presentation level.
Insulin Categories
After we mapped the insulin active ingredients from the ASPE list to our MIDAS extract, we assigned each MIDAS insulin ingredient to either a “human” or “analog” insulin type category and, separately, to one of the six insulin timing categories. We compared prices for all insulins combined and then for different groups of insulins along these two dimensions. As a sensitivity analysis, we compared prices by category, limiting to data from MIDAS on prescription insulin only.
2 For more information, see IQVIA, undated. The run date for the extract we received from ASPE is October 29, 2019. 3 The 33 countries are Australia, Austria, Belgium, Canada, Chile, the Czech Republic, Estonia, Finland, France, Germany, Greece, Hungary, Ireland, Italy, Japan, Korea, Latvia, Lithuania, Luxembourg, Mexico, the Netherlands, New Zealand, Norway, Poland, Portugal, Slovakia, Slovenia, Spain, Sweden, Switzerland, Turkey, the United Kingdom, and the United States. ASPE did not supply MIDAS data for three OECD members: Denmark, Iceland, and Israel.

3
Price Index Methodology
In our price index results, we compared prices in the United States with those of each comparison country, holding an insulin market basket constant at U.S. volume shares by presentation. Separately, we compared prices in the United States relative to a volume-weighted price calculated across all 32 non-U.S. OECD countries combined. We compared prices first for a market basket covering all insulins and then for market baskets containing only those insulins in specific type and timing categories. For each comparison, we report ratios of U.S. prices to comparison country prices (or to prices in all non-U.S. OECD countries combined). Each comparison uses data only from those presentations with sales in both the United States and the comparison country. For example, the comparison of prices in the United States and the United Kingdom uses data only from those presentations of insulin that were sold in both countries.
Considerations Regarding Our Methodology
Our methods and results are subject to several important considerations and limitations. First, the manufacturer prices available in the MIDAS data do not reflect rebates or
other discounts that might have been applied after drugs left the factory; we expect that, in many countries (and particularly in the United States), the net price paid for drugs was lower than the reported manufacturer prices shown in our results tables. The difference between net and manufacturer prices is likely large: Across all drugs, recent studies estimate the difference between retail and net prices at 23 percent (e.g., Roehrig, 2018) and between wholesale and net prices at 28 percent (e.g., IQVIA Institute for Human Data Science, 2019). The average discount between transactional and net prices for insulins might be even greater because of the highly competitive insulin market, in which there can be several broadly substitutable products for most patients. Fuglesten Biniek and Johnson (2019) applied a 50-percent discount from manufacturer to net prices specifically for insulins, but this factor was an assumption used to describe an illustrative example of results at hypothetical net prices. In this analysis, we did not adjust for rebates, due to the lack of available insulin-specific estimates of rebate amounts.
Second, although many insulin products are sold in both the United States and comparison countries, the overlap is not perfect, leading to potentially uneven generalizability across comparisons. Relatedly, even for presentations that are sold in both the United States and comparison countries, there are likely underlying differences in the mix of presentations and distribution channels for individual active ingredients, both between countries and within a country, across insulin categories. These underlying differences might explain some of the differences in average prices.
Finally, at ASPE’s request, we estimated prices using data from all 33 OECD countries for which ASPE had IQVIA MIDAS data, including countries with markets and economic circumstances that are extremely different from those of the United States. An alternative

4
approach could focus on a smaller subset of countries that are more similar to the United States in terms of per capita gross domestic product, population, demographics, or other factors.

5
2. Results
Shares of Volume and Sales The United States accounted for 31.6 percent of insulin volume measured in standard units
and 83.8 percent of sales in U.S. dollars (Figure 2.1). Relative to the other OECD countries in our analysis, the United States is a clear outlier in terms of its share of both volume and (especially) sales.
Figure 2.1. Shares of Insulin Volume Versus Shares of Insulin Sales Among 33 OECD Countries, 2018
SOURCE: Authors’ analysis of IQVIA MIDAS data from an extract provided by ASPE (run date: October 29, 2019). NOTE: Shares were calculated across the 33 OECD countries included in the extract. The percentages in labeled
points are the share of insulin volume followed by the share of insulin sales.
Analog insulins accounted for 91 percent of U.S. volume (Figure 2.2) and 92 percent of U.S. sales (Figure 2.3). In most higher-income countries, analog insulins accounted for more than 80 percent—and, in some cases, nearly 100 percent—of volume and sales. Some lower-income comparison countries, such as Hungary and Poland, had lower shares of volume and sales for analog insulins. (See Table A.2 for full results.)
France(5.5%, 1.3%)
Germany (11.7%, 3.5%)
Italy(4.4%, 1.2%)
Turkey(7.1%, 0.5%)
United Kingdom(6.5%, 1.3%)
United States(31.6%, 83.8%)
0%
10%
20%
30%
40%
50%
60%
70%
80%
90%
0% 5% 10% 15% 20% 25% 30% 35%
Shar
e of
insu
lin sa
les
Share of insulin volume

6
Figure 2.2. Insulin Volume Shares, by Insulin Type, Selected Comparisons, 2018
SOURCE: Authors’ analysis of IQVIA MIDAS data from an extract provided by ASPE (run date: October 29, 2019). NOTES: SU = standard unit. Non-U.S. OECD refers to all 32 non-U.S. OECD comparison countries combined. See
Table A.2 for full results.
Figure 2.3. Insulin Sales Shares, by Insulin Type, Selected Comparisons, 2018
SOURCE: Authors’ analysis of IQVIA MIDAS data from an extract provided by ASPE (run date: October 29, 2019).
NOTE: USD = U.S. dollars. See Table A.2 for full results.
9% 7%17%
4%
29%
8%19% 16%
91% 93%83%
96%
71%
92%81% 84%
0%10%20%30%40%50%60%70%80%90%
100%
U.S. Australia Canada France Germany Japan UK Non-U.S.OECD
Shar
e of
Insu
lin V
olum
e (S
Us)
Human Analog
8% 5% 10% 4%19%
8% 13% 11%
92% 95% 90% 96%81%
92% 87% 89%
0%10%20%30%40%50%60%70%80%90%
100%
U.S. Australia Canada France Germany Japan UK Non-U.S.OECD
Shar
e of
Insu
lin S
ales
(USD
)
Human Analog
7
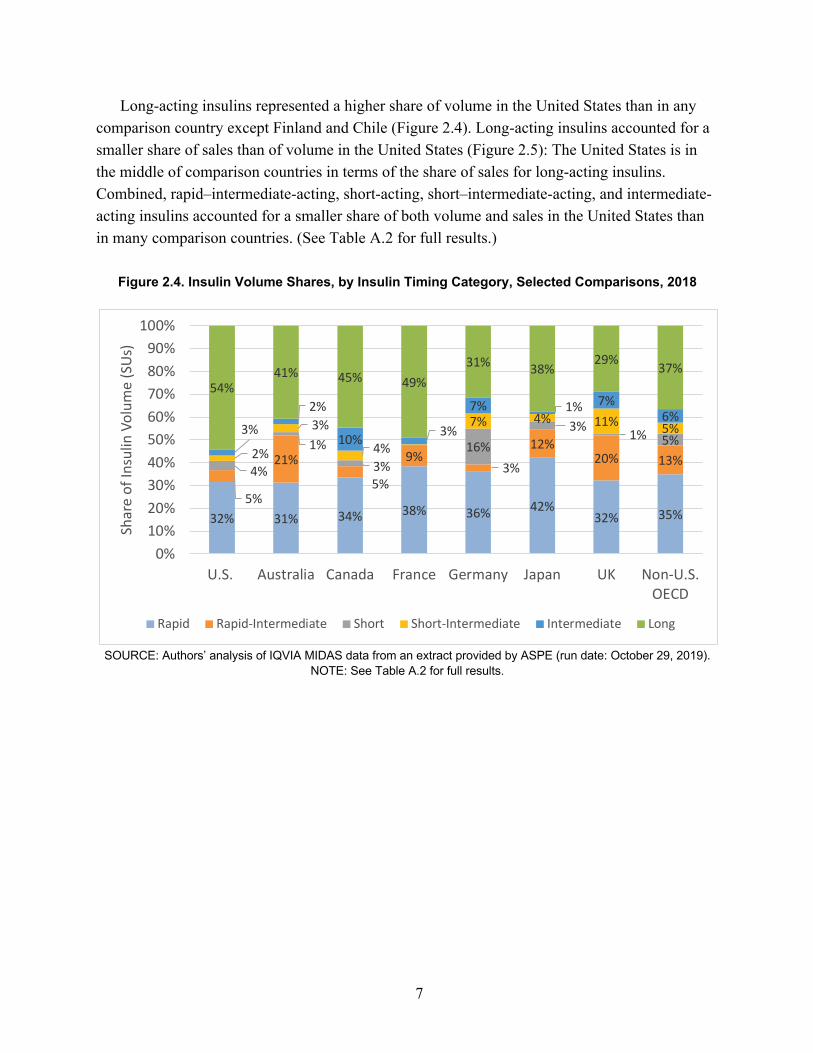
Long-acting insulins represented a higher share of volume in the United States than in any comparison country except Finland and Chile (Figure 2.4). Long-acting insulins accounted for a smaller share of sales than of volume in the United States (Figure 2.5): The United States is in the middle of comparison countries in terms of the share of sales for long-acting insulins. Combined, rapid–intermediate-acting, short-acting, short–intermediate-acting, and intermediate-acting insulins accounted for a smaller share of both volume and sales in the United States than in many comparison countries. (See Table A.2 for full results.)
Figure 2.4. Insulin Volume Shares, by Insulin Timing Category, Selected Comparisons, 2018
SOURCE: Authors’ analysis of IQVIA MIDAS data from an extract provided by ASPE (run date: October 29, 2019).
NOTE: See Table A.2 for full results.
32% 31% 34% 38% 36% 42%32% 35%
5%
21%
5%
9%3%
12%20% 13%
4%
1%3%
16%3% 1% 5%
2%
3%
4%
7% 4% 11% 5%3%
2%
10% 3%
7% 1% 7%6%
54%41% 45% 49%
31% 38%29% 37%
0%10%20%30%40%50%60%70%80%90%
100%
U.S. Australia Canada France Germany Japan UK Non-U.S.OECD
Shar
e of
Insu
lin V
olum
e (S
Us)
Rapid Rapid-Intermediate Short Short-Intermediate Intermediate Long

8
Figure 2.5. Insulin Sales Shares, by Insulin Timing Category, Selected Comparisons, 2018
SOURCE: Authors’ analysis of IQVIA MIDAS data from an extract provided by ASPE (run date: October 29, 2019).
NOTE: See Table A.2 for full results.
We found that nonprescription insulins—which may serve as a way for patients without prescription drug coverage to access insulin at a lower cost—were sold in only two countries in 2018: the United States and Ireland. Figures 2.6 and 2.7, respectively, illustrate the share of insulin volume and sales that were nonprescription (both overall and by category) for the United States and Ireland. Nonprescription insulin accounted for only 6.9 percent of total U.S. insulin volume and 5.3 percent of total U.S. insulin sales. However, the shares of nonprescription insulin volume and sales were higher within individual categories of insulin. More specifically, nonprescription insulins accounted for about 45 percent of short-acting insulin volume in the United States and all of short–intermediate-acting and intermediate-acting volume. Although short-acting insulins are primarily nonprescription in Ireland, these insulins accounted for only 1 percent of total insulin volume and 1.2 percent of total insulin sales.4
4 Short–intermediate-acting and intermediate-acting insulins sold in Ireland are entirely prescription-based.
38%27% 28% 34% 40% 40%
31% 33%
6%17%
4%7%
3%11%
18% 9%4%
1%
2%
1%10% 3%
1%4%
2% 2%
3%
4% 3% 7%3%
2% 2%
6%
2%
5%1%
5%4%
48% 51%59% 56%
38% 41% 38%47%
0%10%20%30%40%50%60%70%80%90%
100%
U.S. Australia Canada France Germany Japan UK Non-U.S.OECD
Shar
e of
Insu
lin S
ales
(USD
)
Rapid Rapid-Intermediate Short Short-Intermediate Intermediate Long

9
Figure 2.6. Prescription Versus Nonprescription Insulin Volume Shares, by Category, 2018
SOURCE: Authors’ analysis of IQVIA MIDAS data from an extract provided by ASPE (run date: October 29, 2019).
Figure 2.7. Prescription Versus Nonprescription Insulin Sales Shares, by Category, 2018
SOURCE: Authors’ analysis of IQVIA MIDAS data from an extract provided by ASPE (run date: October 29, 2019).
6.9%45.1%
100.0% 100.0%
1.0%
75.3%
93.1%
54.9%
99.0%
24.7%
0%10%20%30%40%50%60%70%80%90%
100%
U.S. totalvolume
U.S. S-actingvolume
U.S. SI-actingvolume
U.S. I-actingvolume
Ireland totalvolume
Ireland S-acting
volume
Shar
e of
Insu
lin V
olum
e (S
Us)
Nonprescription Prescription
5.3% 28.0%
100.0% 100.0%
1.2%
86.4%94.7%
72.0%
98.8%
13.6%
0%
10%
20%
30%
40%
50%
60%
70%
80%
90%
100%
U.S. totalsales
U.S. S-actingsales
U.S. SI-actingsales
U.S. I-actingsales
Ireland totalsales
Ireland S-acting sales
Shar
e of
Insu
lin S
ales
(USD
)
Nonprescription Prescription
10
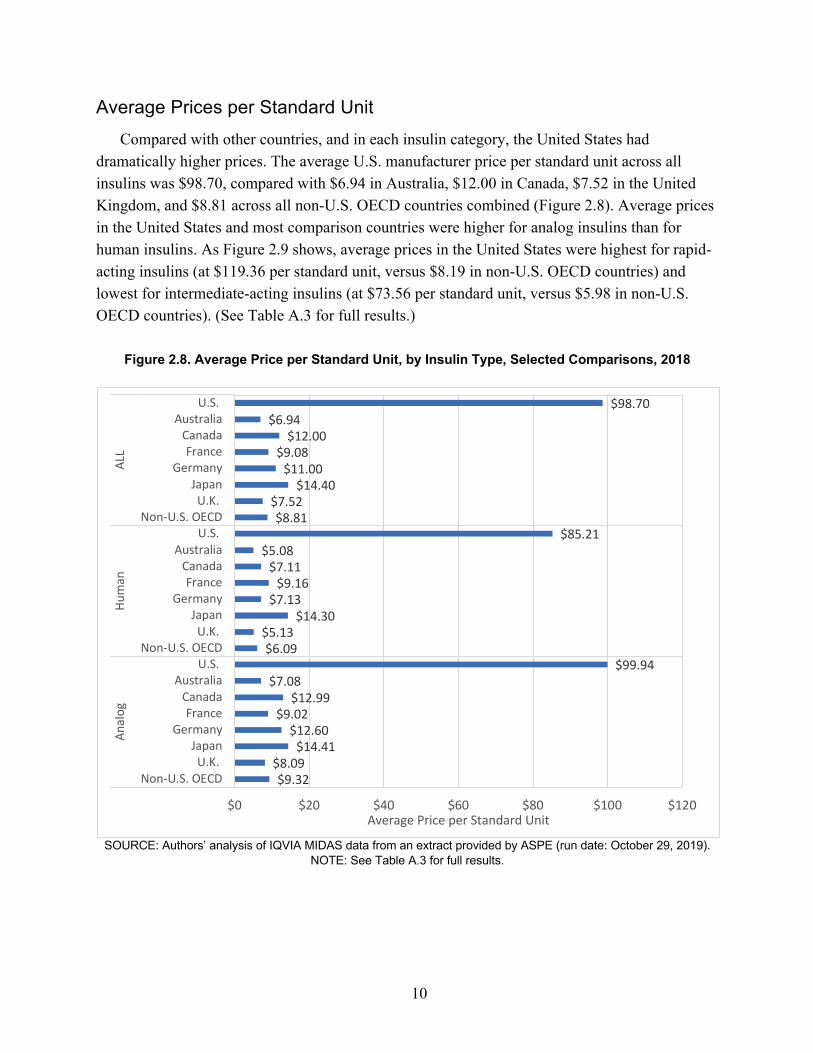
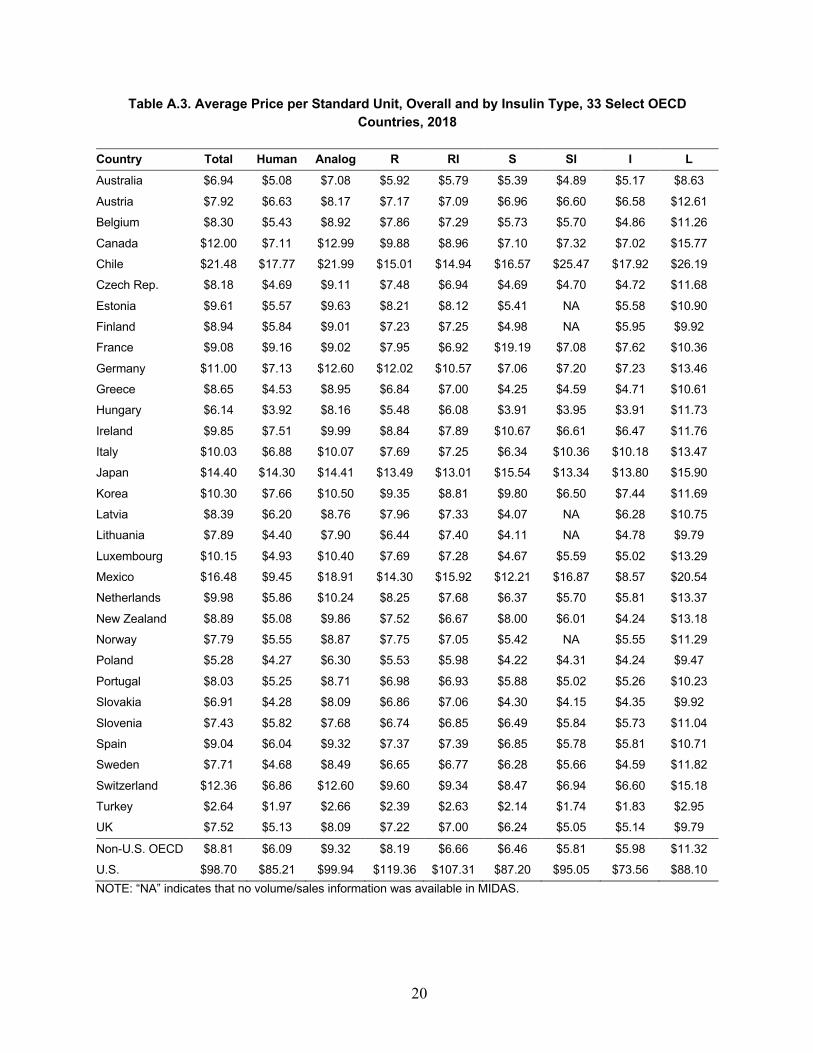
Average Prices per Standard Unit Compared with other countries, and in each insulin category, the United States had
dramatically higher prices. The average U.S. manufacturer price per standard unit across all insulins was $98.70, compared with $6.94 in Australia, $12.00 in Canada, $7.52 in the United Kingdom, and $8.81 across all non-U.S. OECD countries combined (Figure 2.8). Average prices in the United States and most comparison countries were higher for analog insulins than for human insulins. As Figure 2.9 shows, average prices in the United States were highest for rapid-acting insulins (at $119.36 per standard unit, versus $8.19 in non-U.S. OECD countries) and lowest for intermediate-acting insulins (at $73.56 per standard unit, versus $5.98 in non-U.S. OECD countries). (See Table A.3 for full results.)
Figure 2.8. Average Price per Standard Unit, by Insulin Type, Selected Comparisons, 2018
SOURCE: Authors’ analysis of IQVIA MIDAS data from an extract provided by ASPE (run date: October 29, 2019).
NOTE: See Table A.3 for full results.
$9.32$8.09
$14.41$12.60
$9.02$12.99
$7.08$99.94
$6.09$5.13
$14.30$7.13
$9.16$7.11
$5.08$85.21
$8.81$7.52
$14.40$11.00
$9.08$12.00
$6.94$98.70
$0 $20 $40 $60 $80 $100 $120
Non-U.S. OECDU.K.
JapanGermany
FranceCanada
AustraliaU.S.
Non-U.S. OECDU.K.
JapanGermany
FranceCanada
AustraliaU.S.
Non-U.S. OECDU.K.
JapanGermany
FranceCanada
AustraliaU.S.
Anal
ogHu
man
ALL
Average Price per Standard Unit

11
Figure 2.9. Average Price per Standard Unit, by Insulin Timing Category, Selected Comparisons, 2018
SOURCE: Authors’ analysis of IQVIA MIDAS data from an extract provided by ASPE (run date: October 29, 2019).
NOTE: See Table A.3 for full results.
$11.32$9.79
$15.90$13.46
$10.36$15.77
$8.63$88.10
$5.98$5.14
$13.80$7.23$7.62$7.02
$5.17$73.56
$5.81$5.05
$13.34$7.20$7.08$7.32
$4.89$95.05
$6.46$6.24
$15.54$7.06
$19.19$7.10
$5.39$87.20
$6.66$7.00
$13.01$10.57
$6.92$8.96
$5.79$107.31
$8.19$7.22
$13.49$12.02
$7.95$9.88
$5.92 $119.36
$0 $20 $40 $60 $80 $100 $120
Non-U.S. OECDU.K.
JapanGermany
FranceCanada
AustraliaU.S.
Non-U.S. OECDU.K.
JapanGermany
FranceCanada
AustraliaU.S.
Non-U.S. OECDU.K.
JapanGermany
FranceCanada
AustraliaU.S.
Non-U.S. OECDU.K.
JapanGermany
FranceCanada
AustraliaU.S.
Non-U.S. OECDU.K.
JapanGermany
FranceCanada
AustraliaU.S.
Non-U.S. OECDU.K.
JapanGermany
FranceCanada
AustraliaU.S.
Long
-act
ing
Inte
rmed
iate
-act
ing
Shor
t-int
. act
ing
Shor
t-act
ing
Rapi
d-in
t. ac
ting
Rapi
d-ac
ting
Average price per standard unit

12
Price Index Comparisons In our price index results, we compared prices in the United States with those in each
comparison country, holding the market basket constant at U.S. volume shares by presentation. As we noted earlier, these comparisons are necessarily limited to those presentations that are sold both in the United States and in each comparison country. U.S. prices for all insulin types combined ranged from 5.9 to 9.4 times those in the selected countries shown in Figure 2.10, and they were 8.1 times those in all non-U.S. OECD countries combined. As the full results presented in Table A.4 show, across all 32 non-U.S. OECD countries, for all insulin types combined, U.S. prices were closest to those in Chile (with U.S. prices 3.8 times those in Chile) and furthest from those in Turkey (with U.S. prices 27.7 times those in Turkey). U.S. prices were higher for analog insulins than for human insulins in 31 of 32 comparison countries (Hungary was the exception).
Figure 2.10. Price Index Comparison, by Insulin Type, Selected Comparisons, 2018
SOURCE: Authors’ analysis of IQVIA MIDAS data from an extract provided by ASPE (run date: October 29, 2019). NOTE: A value of 100 means that the U.S. price was the same as the other-country price. A higher number means that the U.S. price was higher than the other-country price. The reported magnitudes are differences in percentages between U.S. and other-country prices (e.g., a value of 500 means that U.S. prices were 500 percent of prices in the
comparison country). See Table A.4 for full results.
U.S. prices were dramatically higher than those in comparison countries across different timing categories of insulins (Figure 2.11). In general, U.S. prices were closer to, but still much higher than, prices in other countries for short-acting, intermediate-acting, and long-acting insulins than to prices in other countries for rapid-acting insulins.
810913
613644
869624
969707
684377
518616
498678
805893
589633
837629
937
0 200 400 600 800 1,000 1,200
Non-U.S. OECDU.K.
JapanGermany
FranceCanada
AustraliaNon-U.S. OECD
U.K.Japan
GermanyFrance
CanadaAustralia
Non-U.S. OECDU.K.
JapanGermany
FranceCanada
Australia
Anal
ogHu
man
ALL
U.S. versus comparison country prices for U.S. market basket (>100 = higher U.S. prices)

13
Figure 2.11. Price Index Comparison, by Insulin Timing Category, Selected Comparisons, 2018
SOURCE: Authors’ analysis of IQVIA MIDAS data from an extract provided by ASPE (run date: October 29, 2019). NOTE: A value of 100 means that the U.S. price was the same as the other-country price. A higher number means that the U.S. price was higher than the other-country price. The reported magnitudes are differences in percentages between U.S. and other-country prices (e.g., a value of 500 means that U.S. prices were 500 percent of prices in the
comparison country). See Table A.4 for full results.
657741
522578
686473
728803
709361
400530
672647
697663
4591,104
780643
842752
569252
438306
803380
1,2711,289
690868
1,3231,021
1,5921,054
1,204746
7151,207
9881,379
0 200 400 600 800 1,000 1,200 1,400 1,600 1,800
Non-U.S. OECDU.K.
JapanGermany
FranceCanada
AustraliaNon-U.S. OECD
U.K.Japan
GermanyFrance
CanadaAustralia
Non-U.S. OECDU.K.
JapanGermany
FranceCanada
AustraliaNon-U.S. OECD
U.K.Japan
GermanyFrance
CanadaAustralia
Non-U.S. OECDU.K.
JapanGermany
FranceCanada
AustraliaNon-U.S. OECD
U.K.Japan
GermanyFrance
CanadaAustralia
Long
-act
ing
Inte
rmed
iate
-act
ing
Shor
t-int
. act
ing
Shor
t-act
ing
Rapi
d-in
t. ac
ting
Rapi
d-ac
ting
U.S. versus comparison country prices for U.S. market basket (>100 = higher U.S. prices)

14
We found considerable overlap in the insulin presentations sold in the United States and comparison countries that contributed to the price index calculations. Ninety-six percent of U.S. insulin sales were for presentations sold in at least one comparison country, and 97 percent of sales in the comparison countries combined were for presentations also sold in the United States. (See Table A.5 for full results.) The shares of overlapping volume in terms of standard units were lower but still above 80 percent. Some individual comparison countries—for example, Hungary and Poland—used a mix of insulin presentations that differed from those in the United States, and, as a result, the price index comparison is based on presentations accounting for relatively small shares of U.S. insulin sales and volume (less than 50 percent of sales and volume in some cases).
Between two-thirds and three-quarters of insulin sales and volume in Canada and Germany did not align with presentations available in the United States. This is largely due to differences in the formulations of insulin available in those countries compared with those available in the United States. Specifically, insulins coded as having an NFC of GRA (parenteral retard or long-acting cartridges)—which include insulin glargine, insulin detemir, and insulin human isophane in Canada and Germany—were not available in the United States. In the United States, these same insulins are available only as prefilled pens (coded under an NFC of GRF).
As a way to assess whether the lack of complete overlap in insulin presentations could be driving our results, we also compared price indexes using prices and volumes aggregated at the MIDAS active-ingredient (i.e., molecule, or moleculelist) level rather than presentation level (i.e., for more-granular combinations of active ingredient, form, and dosage strength). We found that U.S. prices were even higher than comparison country prices when price indexes were calculated at the active-ingredient level rather than presentation level (Figure 2.12; see Table A.6 for full results). This suggests that other countries use a less-expensive mix of insulins and have lower prices for each presentation separately.

15
Figure 2.12. Price Index Results Comparison, Presentation Level Versus Molecule Level, 2018
SOURCE: Authors’ analysis of IQVIA MIDAS data from an extract provided by ASPE (run date: October 29, 2019). NOTE: A value of 100 means that the U.S. price was the same as the other-country price. A higher number means that the U.S. price was higher than the other-country price. The reported magnitudes are differences in percentages between U.S. and other-country prices (e.g., a value of 500 means that U.S. prices were 500 percent of prices in the
comparison country).
Table A.7 reports average prices per standard unit for short-acting insulins, and Table A.8 reports price index results where we have restricted the analysis to prescription insulin records only. The resulting price index ratios were very similar to ratios calculated for all records.
1,0091,160
682804
976745
1,315805
893589
633837
629937
0 200 400 600 800 1,000 1,200 1,400
Non-U.S. OECDU.K.
JapanGermany
FranceCanada
AustraliaNon-U.S. OECD
U.K.Japan
GermanyFrance
CanadaAustralia
Mol
ecul
e-le
vel
Pres
enta
tion-
leve
l
U.S. versus comparison country prices for U.S. market basket (>100 = higher U.S. prices)

16
3. Summary of Findings
Manufacturer prices in the United States were considerably higher than those in other countries for all insulins combined and for different types of insulin. When comparing prices for a U.S. market basket of insulins, we found that U.S. manufacturer prices ranged from 3.8 times those in Chile to 27.7 times those in Turkey and 8.1 times those in all non-U.S. OECD countries combined. Although the ratio of U.S. to other-country prices varied depending on the comparison country and insulin category, U.S. prices were always higher and often five to ten times those in other countries. U.S. prices were higher for analog versus human insulins in nearly all comparison countries. U.S. prices were even higher when we used active-ingredient–level data rather than presentation-level data, suggesting that the United States had higher prices at the presentation level and offered a more-expensive mix of insulin presentations.
The overlap between the presentations of insulin sold in the United States and in comparison countries was generally high, although there were differences in market shares across categories of insulin. Given our presentation-level price index approach, our results likely highlight differences in prices rather than differences in the mix of insulins sold in the United States versus other countries.
There are, however, some compositional differences worth noting. The United States was unusual among comparison countries in permitting distribution of several types of insulin over the counter. The availability of over-the-counter insulin in the United States is likely driven by access concerns. Some patients without prescription-drug coverage, with coverage but with high cost-sharing, or without access to prescribers can face barriers to filling insulin prescriptions (Tribble, 2015). At least one U.S. state (Indiana) does not allow the sale of over-the-counter insulin because of safety concerns (Tribble, 2015). Despite the availability of some insulins over the counter in the United States, U.S. manufacturer prices were still much higher than those in comparison countries even in categories in which U.S. distribution is entirely over the counter (and distribution in most other countries is prescription-only, with the exception of Ireland). The average U.S. manufacturer price for over-the-counter short-acting insulins was $54.09, compared with $114.40 for prescription short-acting insulins. Although this difference in U.S. prescription versus over-the-counter prices is large, the U.S. over-the-counter price of $54.09 was several times the price of short-acting insulins in other countries ($6.46) and of the over-the-counter price in Ireland ($12.24).
One key limitation of this analysis is that we used manufacturer prices, not net prices after rebates and other discounts are applied. Given the generally competitive insulin market, rebates in the United States could be substantial. One of our main findings is that insulin prices in the United States are about eight times higher those in non-U.S. OECD countries combined. Even with a 50-percent rebate amount as assumed in one prior study (Fuglesten Biniek and Johnson,

17
2019), our findings suggest that U.S. insulin prices would have been considerably higher (about four times higher) than those in other countries.
18
Appendix. Exhibits
Table A.1. Insulin Active-Ingredient Mapping
ASPE-Provided Active Ingredient MIDAS “moleculelist” Active Ingredient Insulin Type
Human/Analog/ Animal
Insulin Aspart INSULIN ASPART Rapid Analog
Insulin Aspart Protamine & Aspart (Human)
INSULIN ASPART!INSULIN ASPART PROTAMINE (CRYSTALLINE)
Rapid–intermediate
Analog
Insulin Degludec INSULIN DEGLUDEC Long Analog
Insulin Detemir INSULIN DETEMIR Long Analog
Insulin Glargine INSULIN GLARGINE Long Analog
Insulin Glulisine INSULIN GLULISINE Rapid Analog
Insulin Isophane —a Intermediate Human
Insulin Isophane (Pork) INSULIN PORCINE ISOPHANE Intermediate Animalb
Insulin Lispro INSULIN LISPRO Rapid Analog
Insulin Lispro Protamine & Lispro
INSULIN LISPRO!INSULIN LISPRO PROTAMINE
Rapid–intermediate
Analog
Insulin NPH (Human) (Isophane) INSULIN HUMAN ISOPHANE Intermediate Human
Insulin NPH Isophane & Reg (Human)
INSULIN HUMAN BASE!INSULIN HUMAN ISOPHANE
Short–intermediate
Human
Insulin Reg (Human) Buffered INSULIN HUMAN BASE Short Human
Insulin Regular —b Short Animalb
Insulin Regular (Human) INSULIN HUMAN BASE Short Human
Insulin Regular (Pork) INSULIN PORCINE BASE Short Animalb
Insulin Zinc —b Intermediate Animalb
Insulin Zinc (Human) INSULIN HUMAN ZINC SUSPENSION (COMPOUND/CRYSTALLINE)
Intermediate Humanc
Insulin Zinc (Pork) INSULIN PORCINE ZINC SUSPENSION (COMPOUND)
Intermediate Animalb
Insulin Zinc Extended (Human) —c Long Humanc NOTE: NPH = neutral protamine Hagedorn. a No MIDAS moleculelist was identified. We excluded this insulin product from our analysis. b We excluded animal insulins from our analysis. We did not find MIDAS moleculelist matches for some animal insulins. c Insulin Zinc (Human) and Insulin Zinc Extended (Human) are not sold in the United States; we therefore excluded them from our analysis. Furthermore, it is not clear whether Human Zinc Extended (Human) should map to the MIDAS INSULIN HUMAN ZINC SUSPENSION (COMPOUND/CRYSTALLINE) moleculelist.

19
Table A.2. Insulin Volume and Sales Shares, by Insulin Type, 33 Select OECD Countries, 2018
Share of Volume (SUs) Share of Sales (USD) Country Human Analog R RI S SI I L Human Analog R RI S SI I L Australia 7% 93% 31% 21% 1% 3% 2% 41% 5% 95% 27% 17% 1% 2% 2% 51% Austria 16% 84% 37% 31% 2% 3% 11% 16% 14% 86% 33% 28% 2% 3% 9% 25% Belgium 18% 82% 37% 17% 9% 3% 6% 28% 12% 88% 35% 15% 6% 2% 4% 39% Canada 17% 83% 34% 5% 3% 4% 10% 45% 10% 90% 28% 4% 2% 3% 6% 59% Chile 12% 88% 27% 6% 2% 0% 10% 55% 10% 90% 19% 4% 1% 0% 8% 67% Czech Rep. 21% 79% 34% 13% 13% 3% 4% 32% 12% 88% 31% 11% 8% 2% 3% 46% Estonia 1% 99% 39% 8% 0% 0% 1% 53% 0% 100% 33% 6% 0% 0% 0% 60% Finland 3% 97% 31% 1% 0% 0% 2% 65% 2% 98% 25% 1% 0% 0% 2% 72% France 4% 96% 38% 9% 0% 0% 3% 49% 4% 96% 34% 7% 1% 0% 2% 56% Germany 29% 71% 36% 3% 16% 7% 7% 31% 19% 81% 40% 3% 10% 4% 5% 38% Greece 7% 93% 28% 13% 2% 4% 1% 52% 4% 96% 23% 11% 1% 2% 1% 63% Hungary 48% 52% 26% 4% 24% 9% 14% 22% 30% 70% 23% 4% 15% 6% 9% 42% Ireland 6% 94% 43% 11% 1% 3% 1% 41% 4% 96% 39% 9% 1% 2% 1% 48% Italy 1% 99% 55% 3% 1% 0% 0% 41% 1% 99% 42% 2% 1% 0% 0% 55% Japan 8% 92% 42% 12% 3% 4% 1% 38% 8% 92% 40% 11% 3% 3% 1% 41% Korea 7% 93% 20% 23% 1% 1% 4% 51% 5% 95% 18% 19% 1% 1% 3% 58% Latvia 14% 86% 40% 17% 1% 0% 14% 28% 11% 89% 38% 15% 0% 0% 10% 36% Lithuania 0% 100% 30% 36% 0% 0% 0% 33% 0% 100% 25% 34% 0% 0% 0% 41% Luxembourg 4% 96% 38% 11% 2% 1% 1% 47% 2% 98% 29% 8% 1% 0% 0% 61% Mexico 26% 74% 7% 16% 2% 2% 22% 51% 15% 85% 6% 16% 2% 2% 11% 63% Netherlands 6% 94% 41% 15% 1% 1% 5% 38% 3% 97% 34% 11% 0% 0% 3% 51% New Zealand 20% 80% 25% 19% 1% 8% 12% 36% 12% 88% 21% 14% 1% 5% 6% 53% Norway 32% 68% 40% 5% 1% 0% 32% 22% 23% 77% 40% 5% 0% 0% 23% 32% Poland 50% 50% 26% 15% 13% 25% 13% 8% 41% 59% 28% 17% 10% 20% 11% 14% Portugal 20% 80% 16% 21% 2% 6% 12% 43% 13% 87% 14% 18% 2% 4% 8% 55% Slovakia 31% 69% 28% 15% 17% 6% 8% 27% 19% 81% 28% 15% 11% 4% 5% 38% Slovenia 13% 87% 33% 36% 1% 2% 10% 18% 10% 90% 30% 33% 1% 1% 8% 27% Spain 8% 92% 24% 14% 2% 2% 4% 53% 6% 94% 20% 12% 1% 1% 3% 63% Sweden 20% 80% 37% 15% 0% 1% 19% 28% 12% 88% 32% 13% 0% 1% 11% 43% Switzerland 4% 96% 40% 4% 1% 0% 4% 52% 2% 98% 31% 3% 0% 0% 2% 63% Turkey 2% 98% 37% 25% 1% 1% 0% 36% 2% 98% 34% 25% 1% 0% 0% 40% UK 19% 81% 32% 20% 1% 11% 7% 29% 13% 87% 31% 18% 1% 7% 5% 38% Non-U.S. OECD 16% 84% 35% 13% 5% 5% 6% 37% 11% 89% 33% 9% 4% 3% 4% 47% U.S. 9% 91% 32% 5% 4% 2% 3% 54% 8% 92% 38% 6% 4% 2% 2% 48% NOTE: The “Human” and “Analog” columns in each panel sum to 100 percent. The six timing categories in each panel also sum to 100 percent. However, exact sums might not total 100 percent due to rounding.
20
Table A.3. Average Price per Standard Unit, Overall and by Insulin Type, 33 Select OECD Countries, 2018
Country Total Human Analog R RI S SI I L Australia $6.94 $5.08 $7.08 $5.92 $5.79 $5.39 $4.89 $5.17 $8.63
Austria $7.92 $6.63 $8.17 $7.17 $7.09 $6.96 $6.60 $6.58 $12.61
Belgium $8.30 $5.43 $8.92 $7.86 $7.29 $5.73 $5.70 $4.86 $11.26
Canada $12.00 $7.11 $12.99 $9.88 $8.96 $7.10 $7.32 $7.02 $15.77
Chile $21.48 $17.77 $21.99 $15.01 $14.94 $16.57 $25.47 $17.92 $26.19
Czech Rep. $8.18 $4.69 $9.11 $7.48 $6.94 $4.69 $4.70 $4.72 $11.68
Estonia $9.61 $5.57 $9.63 $8.21 $8.12 $5.41 NA $5.58 $10.90
Finland $8.94 $5.84 $9.01 $7.23 $7.25 $4.98 NA $5.95 $9.92
France $9.08 $9.16 $9.02 $7.95 $6.92 $19.19 $7.08 $7.62 $10.36
Germany $11.00 $7.13 $12.60 $12.02 $10.57 $7.06 $7.20 $7.23 $13.46
Greece $8.65 $4.53 $8.95 $6.84 $7.00 $4.25 $4.59 $4.71 $10.61
Hungary $6.14 $3.92 $8.16 $5.48 $6.08 $3.91 $3.95 $3.91 $11.73
Ireland $9.85 $7.51 $9.99 $8.84 $7.89 $10.67 $6.61 $6.47 $11.76
Italy $10.03 $6.88 $10.07 $7.69 $7.25 $6.34 $10.36 $10.18 $13.47
Japan $14.40 $14.30 $14.41 $13.49 $13.01 $15.54 $13.34 $13.80 $15.90
Korea $10.30 $7.66 $10.50 $9.35 $8.81 $9.80 $6.50 $7.44 $11.69
Latvia $8.39 $6.20 $8.76 $7.96 $7.33 $4.07 NA $6.28 $10.75
Lithuania $7.89 $4.40 $7.90 $6.44 $7.40 $4.11 NA $4.78 $9.79
Luxembourg $10.15 $4.93 $10.40 $7.69 $7.28 $4.67 $5.59 $5.02 $13.29
Mexico $16.48 $9.45 $18.91 $14.30 $15.92 $12.21 $16.87 $8.57 $20.54
Netherlands $9.98 $5.86 $10.24 $8.25 $7.68 $6.37 $5.70 $5.81 $13.37
New Zealand $8.89 $5.08 $9.86 $7.52 $6.67 $8.00 $6.01 $4.24 $13.18
Norway $7.79 $5.55 $8.87 $7.75 $7.05 $5.42 NA $5.55 $11.29
Poland $5.28 $4.27 $6.30 $5.53 $5.98 $4.22 $4.31 $4.24 $9.47
Portugal $8.03 $5.25 $8.71 $6.98 $6.93 $5.88 $5.02 $5.26 $10.23
Slovakia $6.91 $4.28 $8.09 $6.86 $7.06 $4.30 $4.15 $4.35 $9.92
Slovenia $7.43 $5.82 $7.68 $6.74 $6.85 $6.49 $5.84 $5.73 $11.04
Spain $9.04 $6.04 $9.32 $7.37 $7.39 $6.85 $5.78 $5.81 $10.71
Sweden $7.71 $4.68 $8.49 $6.65 $6.77 $6.28 $5.66 $4.59 $11.82
Switzerland $12.36 $6.86 $12.60 $9.60 $9.34 $8.47 $6.94 $6.60 $15.18
Turkey $2.64 $1.97 $2.66 $2.39 $2.63 $2.14 $1.74 $1.83 $2.95
UK $7.52 $5.13 $8.09 $7.22 $7.00 $6.24 $5.05 $5.14 $9.79
Non-U.S. OECD $8.81 $6.09 $9.32 $8.19 $6.66 $6.46 $5.81 $5.98 $11.32
U.S. $98.70 $85.21 $99.94 $119.36 $107.31 $87.20 $95.05 $73.56 $88.10 NOTE: “NA” indicates that no volume/sales information was available in MIDAS.

21
Table A.4. U.S. Prices Relative to Comparison Country Prices in Percentage Points, Overall and by Insulin Type, 33 Select OECD Countries, 2018
Country Total Human Analog R RI S SI I L Australia 937 678 969 1,379 1,592 380 842 647 728
Austria 764 560 769 1,021 1,265 467 NA 1,050 590
Belgium 861 579 881 1,122 1,223 501 603 763 680
Canada 629 498 624 988 1,021 803 643 672 473
Chile 386 315 395 571 628 182 401 275 301
Czech Rep. 844 604 853 1,233 1,265 475 1,429 766 638
Estonia 858 631 856 1,141 1,151 NA NA 1,268 732
Finland 938 690 936 1,204 1,262 NA NA 1,170 752
France 837 616 869 1,207 1,323 306 780 530 686
Germany 633 518 644 715 868 438 1,104 400 578
Greece 917 655 930 1,266 1,307 542 909 712 728
Hungary 824 1,831 817 1,449 NA NA NA 1831 679
Ireland 803 596 813 1,044 1,163 442 1,189 680 651
Italy 763 670 763 1,052 1,235 571 985 733 618
Japan 589 377 613 746 690 252 459 361 522
Korea 871 702 874 1,104 1,043 552 1,057 806 726
Latvia 908 675 906 1,312 1,249 NA NA 1,122 724
Lithuania 985 725 982 1,453 1,244 NA NA 1,481 797
Luxembourg 875 554 875 1,117 1,221 NA NA NA 680
Mexico 531 398 531 708 709 347 499 873 423
Netherlands 797 626 796 1,081 1,157 719 NA 1,203 617
New Zealand 616 397 617 1,013 1,269 NA 584 609 457
Norway 958 674 956 1,206 1,317 NA NA 1,268 800
Poland 922 557 951 2,022 NA 401 NA 1,724 780
Portugal 773 617 769 1,296 1,274 NA NA 1,355 650
Slovakia 912 686 901 1,195 1,263 1,072 NA 1,420 718
Slovenia 862 622 876 1,333 1,348 356 1,263 1,227 712
Spain 879 633 890 1,191 1,245 470 984 746 703
Sweden 853 632 857 1,303 1,367 508 NA 1,539 650
Switzerland 659 506 665 868 943 377 NA 650 531
Turkey 2,774 1,634 2,857 3,495 3,496 1,258 NA 1,716 2,315
UK 893 684 913 1,204 1,289 569 663 709 741
Non-U.S. OECD 805 707 810 1,054 1,271 752 697 803 657
U.S. 100 100 100 100 100 100 100 100 100 NOTE: “NA” indicates that there were no matching presentations in MIDAS on which to compare prices.

22
Table A.5. Share of Insulin Sales and Volume Contributing to Presentation-Level Bilateral Price Index Comparisons, 2018
Country Share of U.S. Sales Share of Other-Country Sales Share of U.S. Volume
Share of Other-Country Volume
Australia 85% 89% 90% 88%
Austria 80% 60% 88% 59%
Belgium 79% 81% 87% 75%
Canada 91% 70% 93% 66%
Chile 86% 96% 92% 92%
Czech Rep. 70% 78% 83% 69%
Estonia 66% 100% 79% 99%
Finland 89% 95% 90% 95%
France 85% 97% 89% 97%
Germany 84% 77% 89% 69%
Greece 87% 96% 92% 93%
Hungary 28% 55% 39% 44%
Ireland 93% 99% 96% 99%
Italy 79% 99% 87% 98%
Japan 87% 95% 93% 94%
Korea 87% 99% 92% 98%
Latvia 59% 99% 74% 99%
Lithuania 61% 100% 76% 99%
Luxembourg 77% 60% 84% 69%
Mexico 87% 95% 91% 92%
Netherlands 91% 88% 94% 85%
New Zealand 69% 70% 73% 61%
Norway 89% 97% 90% 96%
Poland 42% 37% 53% 32%
Portugal 52% 78% 62% 71%
Slovakia 79% 73% 88% 64%
Slovenia 68% 93% 82% 92%
Spain 88% 97% 93% 95%
Sweden 92% 95% 94% 94%
Switzerland 83% 85% 90% 83%
Turkey 75% 98% 83% 98%
UK 96% 83% 97% 81%
Non-U.S. OECD 96% 85% 97% 81%

23
Table A.6. U.S. Prices Relative to Comparison Country Prices in Percentage Points at the Active-Ingredient Level, Overall and by Insulin Type, 33 Select OECD Countries, 2018
Country Total Human Analog R RI S SI I L Australia 1,315 1,061 1,291 1,992 1,854 1,619 1,944 1,423 942
Austria 972 822 953 1,612 1,510 1,253 1,440 1,118 698
Belgium 995 875 962 1,377 1,467 1,522 1,666 1,515 725
Canada 745 649 721 1,195 1,204 1,228 1,298 1,047 530
Chile 464 419 466 753 738 526 373 411 347
Czech Rep. 1,011 915 971 1,459 1,549 1,861 2,022 1,559 713
Estonia 1,022 778 1,017 1,457 1,342 NA NA 1,317 803
Finland 1,121 948 1,103 1,604 1,476 1,750 NA 1,236 865
France 976 751 1,013 1,435 1,552 455 1,343 966 796
Germany 804 804 782 972 1,014 1,235 1,321 1,017 662
Greece 1,133 996 1,096 1,599 1,527 2,050 2,069 1,561 855
Hungary 1,133 1,046 1,089 2,122 1,765 2,232 2,404 1,883 762
Ireland 961 799 956 1,277 1,359 818 1,438 1,136 775
Italy 959 836 956 1,536 1,485 1,376 917 722 714
Japan 682 509 691 920 819 561 713 533 569
Korea 949 857 942 1,225 1,215 890 1,462 988 780
Latvia 1,001 946 976 1,278 1,457 2,140 NA 1,171 771
Lithuania 1,223 1,021 1,198 1,778 1,453 2,120 NA 1,538 938
Luxembourg 1,023 892 989 1,477 1,474 1,869 1,700 1,466 762
Mexico 566 503 557 796 767 714 563 858 439
Netherlands 934 900 907 1,323 1,397 1,368 1,667 1,265 704
New Zealand 857 586 829 1,513 1,610 1,090 1,582 1,734 558
Norway 1,066 923 1,048 1,520 1,553 1,610 NA 1,324 817
Poland 1,286 1,065 1,245 2,158 1,798 2,065 2,204 1,734 866
Portugal 1,140 915 1,113 1,733 1,555 1,483 1,892 1,398 811
Slovakia 1,118 951 1,077 1,549 1,512 2,030 2,290 1,693 845
Slovenia 1,121 933 1,102 1,736 1,577 1,344 1,628 1,284 833
Spain 1,058 865 1,038 1,563 1,452 1,274 1,644 1,265 799
Sweden 1,074 934 1,048 1,787 1,574 1,389 1,680 1,601 767
Switzerland 835 752 817 1,187 1,144 1,029 1,370 1,114 638
Turkey 3,627 2,580 3,569 4,941 4,081 4,081 5,457 4,026 2,797
UK 1,160 1,025 1,136 1,619 1,526 1,398 1,884 1,431 898
Non-U.S. OECD 1,009 943 986 1402 1597 1351 1635 1230 771
U.S. 100 100 100 100 100 100 100 100 100 NOTE: “NA” indicates that there were no matching presentations in MIDAS on which to compare prices. “NR” indicates that price comparisons are not reported for SI and I insulins that were available only over the counter in the United States.

24
Table A.7. Average U.S. Price per Standard Unit for Short-Acting Insulins, by Prescription Status, 2018
All Records Prescription Records Nonprescription Records U.S. average price per standard unit $87.20 $114.40 $54.09 Irish average price per standard unit $10.67 $5.87 $12.24
Table A.8. U.S. Prices Relative to Comparison Country Prices in Percentage Points for Prescription Records, Overall and by Insulin Type, 33 Select OECD Countries, 2018
Country Total Human Analog R RI S SI I L Australia 969 714 969 1,379 1,592 NA NR NR 728 Austria 769 555 769 1,021 1,265 NA NR NR 590 Belgium 881 553 881 1,122 1,223 NA NR NR 680 Canada 625 437 624 988 1,021 728 NR NR 473 Chile 395 341 395 571 628 NA NR NR 301 Czech Rep. 853 570 853 1,233 1,265 NA NR NR 638 Estonia 856 610 856 1,141 1,151 NA NR NR 732 Finland 936 672 936 1,204 1,262 NA NR NR 752 France 869 684 869 1,207 1,323 NA NR NR 686 Germany 644 549 644 715 868 NA NR NR 578 Greece 930 626 930 1,266 1,307 NA NR NR 728 Hungary 817 NA 817 1,449 NA NA NR NR 679 Ireland 813 582 813 1,044 1,163 NA NR NR 651 Italy 763 632 763 1,052 1,235 NA NR NR 618 Japan 613 385 613 746 690 NA NR NR 522 Korea 874 643 874 1,104 1,043 NA NR NR 726 Latvia 906 657 906 1,312 1,249 NA NR NR 724 Lithuania 982 700 982 1,453 1,244 NA NR NR 797 Luxembourg 875 554 875 1,117 1,221 NA NR NR 680 Mexico 531 355 531 708 709 NA NR NR 423 Netherlands 796 597 796 1,081 1,157 NA NR NR 617 New Zealand 617 352 617 1,013 1,269 NA NR NR 457 Norway 956 653 956 1,206 1,317 NA NR NR 800 Poland 951 NA 951 2,022 NA NA NR NR 780 Portugal 769 595 769 1,296 1,274 NA NR NR 650 Slovakia 901 588 901 1,195 1,263 NA NR NR 718 Slovenia 876 635 876 1,333 1,348 NA NR NR 712 Spain 890 578 890 1,191 1,245 NA NR NR 703 Sweden 857 625 857 1,303 1,367 NA NR NR 650 Switzerland 665 499 665 868 943 NA NR NR 531 Turkey 2,857 1,678 2,857 3,495 3,496 NA NR NR 2,315 UK 913 700 913 1,204 1,289 NA NR NR 741 Non-U.S. OECD 815 737 810 1,054 1,271 1,598 NR NR 657 U.S. 100 100 100 100 100 NA NR NR 100 NOTE: “NA” indicates that there were no matching presentations in MIDAS on which to compare prices. “NR” indicates that price comparisons are not reported for SI and I insulins that were available only over the counter in the United States.

25
References
Cefalu, William T., Daniel E. Dawes, Gina Gavlak, Dana Goldman, William H. Herman, Karen Van Nuys, Alvin C. Powers, Simeon I. Taylor, and Alan L. Yatvin, on behalf of the Insulin Access and Affordability Working Group, “Insulin Access and Affordability Working Group: Conclusions and Recommendations,” Diabetes Care, Vol. 41, No. 8, August 2018, pp. 1299–1311.
Fuglesten Biniek, Jean, and William Johnson, “Spending on Individuals with Type 1 Diabetes and the Role of Rapidly Increasing Insulin Prices,” Health Care Cost Institute, January 21, 2019. As of September 1, 2020: https://healthcostinstitute.org/diabetes-and-insulin/spending-on-individuals-with-type-1-diabetes-and-the-role-of-rapidly-increasing-insulin-prices
IQVIA, “MIDAS,” webpage, undated. As of September 1, 2020: https://www.iqvia.com/solutions/commercialization/brand-strategy-and-management/market-measurement/midas
IQVIA Institute for Human Data Science, Medicine Use and Spending in the U.S.: A Review of 2018 and Outlook to 2023, Durham, N.C., May 9, 2019.
Roehrig, Charles, The Impact of Prescription Drug Rebates on Health Plans and Consumers, Ann Arbor, Mich.: Altarum Institute, April 2018.
Tribble, Sarah Jane, “You Can Buy Insulin Without a Prescription, but Should You?” Kaiser Health News, December 14, 2015. As of August 20, 2020: https://khn.org/news/you-can-buy-insulin-without-a-prescription-but-should-you/