Comparing Communication Protocols within an Enterprise Network for Carbon Footprint Reduction
16
Network Protocols and Algorithms ISSN 1943-3581 2013, Vol. 5, No. 1 www.macrothink.org/npa 111 Comparing Communication Protocols within an Enterprise Network for Carbon Footprint Reduction Sami J. Habib and Paulvanna N. Marimuthu Kuwait University Computer Engineering Department P. O. Box 5969 Safat 13060 Kuwait [email protected] Received: March 2, 2013 Accepted: March 15, 2013 Published: March 31, 2013 DOI: 10.5296/npa.v5i1.3342 URL: http://dx.doi.org/10.5296/ npa.v5i1.3342 Abstract The enormous growth in enterprise networks such as cloud computing and social networking increase the network traffic, thereby contributing considerably to the total carbon emission within the network. In this paper, we present a comparison study between transport- layer communication protocols relative to carbon footprint within enterprise network. The comparative study focuses on three factors: the transport layer communication protocols (TCP and UDP), the QoS offered by the transmission line, and the data encoding schemes in the physical layer. The QoS of the transmission line and the number of transmissions contribute significantly to the total carbon footprint generated by the enterprise network. The carbon footprint is estimated from the power spectrum of the transmitted packets through Manchester coding. The carbon reduction at the backbone is of prime importance, since the enterprise is often susceptible to heavy transactions at the backbone. We have formulated the carbon footprint reduction within the enterprise as an optimization problem, wherein the given single enterprise is synthesized into suitable clusters by localizing the heavily communicating nodes together. The simulation results demonstrate that a typical single enterprise comprising of 100 nodes with 4 GB generated backbone traffic when both the UDP and TCP utilize high capacity link, produce low and nearly equal volumes of carbon. However, the difference becomes significantly high with the link offering poor QoS, in which, UDP based transmissions produce 14% less carbon than TCP based transmissions. The optimization within the molecular assembly algorithm manages to produce 64.5% reduced annual carbon emission than the initial network.
Transcript of Comparing Communication Protocols within an Enterprise Network for Carbon Footprint Reduction

Network Protocols and Algorithms
ISSN 1943-3581
2013, Vol. 5, No. 1
www.macrothink.org/npa 111
Comparing Communication Protocols within an
Enterprise Network for Carbon Footprint Reduction
Sami J. Habib and Paulvanna N. Marimuthu
Kuwait University
Computer Engineering Department
P. O. Box 5969 Safat 13060 Kuwait
Received: March 2, 2013 Accepted: March 15, 2013 Published: March 31, 2013
DOI: 10.5296/npa.v5i1.3342 URL: http://dx.doi.org/10.5296/ npa.v5i1.3342
Abstract
The enormous growth in enterprise networks such as cloud computing and social
networking increase the network traffic, thereby contributing considerably to the total carbon
emission within the network. In this paper, we present a comparison study between transport-
layer communication protocols relative to carbon footprint within enterprise network. The
comparative study focuses on three factors: the transport layer communication protocols
(TCP and UDP), the QoS offered by the transmission line, and the data encoding schemes in
the physical layer. The QoS of the transmission line and the number of transmissions
contribute significantly to the total carbon footprint generated by the enterprise network. The
carbon footprint is estimated from the power spectrum of the transmitted packets through
Manchester coding. The carbon reduction at the backbone is of prime importance, since the
enterprise is often susceptible to heavy transactions at the backbone. We have formulated the
carbon footprint reduction within the enterprise as an optimization problem, wherein the
given single enterprise is synthesized into suitable clusters by localizing the heavily
communicating nodes together. The simulation results demonstrate that a typical single
enterprise comprising of 100 nodes with 4 GB generated backbone traffic when both the UDP
and TCP utilize high capacity link, produce low and nearly equal volumes of carbon.
However, the difference becomes significantly high with the link offering poor QoS, in which,
UDP based transmissions produce 14% less carbon than TCP based transmissions. The
optimization within the molecular assembly algorithm manages to produce 64.5% reduced
annual carbon emission than the initial network.

Network Protocols and Algorithms
ISSN 1943-3581
2013, Vol. 5, No. 1
www.macrothink.org/npa 112
Keywords: carbon footprint, data encoding, molecular assembly, optimization, TCP and
UDP.
1. Introduction
The communication protocols offering end-to-end services within an enterprise network
(EN) mainly utilize the message format defined by transmission control protocol (TCP) or user
datagram protocol (UDP) [1]. TCP offers connection oriented services with data read as byte
stream, whereas UDP is connectionless with data communicated as datagram. The two
protocols are differed in QoS properties, such as reliability, throughput and power
consumption. Data transmissions under various transmission frame formats differ in their
payload size, which carries the actual data to be transmitted through the physical layer. The
volume of data produced at the backbone of an enterprise greater than the payload size needs
to be segmented to fit into the transmission frame. The length of the payload field is
influenced by the choice of communication protocols and the quality of the transmission link.
The variation in the header field of the transport layer protocols also affects the total volume
of data to be transmitted under a specified transmission frame. In addition, the quality of
service guarantees a certain level of performance; high QoS provides maximum utilization of
the transmission line allowing the segmented packet to carry maximum transmission load of
the selected protocol, thereby reduces the number of transmissions and the carbon emission.
The segmented data packets from network layer are coded into raw bits through the data
encoding techniques during the transmission through physical layer. The data encoding
techniques include simplest polar encoding technique to slightly complex Manchester
encoding. Manchester encoding is widely used in data transmission, as it facilitates low-cost
radio-frequency (RF) transmission of digital data [2]. The data encoding technique computes
the average power consumed in transmitting the specified volume of data by integrating the
corresponding power density spectrum of the transmitted data over a specified frequency
interval.
In an enterprise, the overall energy consumed during the transmission of a data packet can
be estimated by integrating the energy usage from transport layer to physical layer, which
depends on the choice of transmission protocols, the QoS of transmission link and the data
encoding mechanisms employed in raw data transmission. The present issues in greenhouse
gas (GHG) emissions demand the enterprise networks to practice some strategies to cut down
their energy usage and to produce less carbon. In enterprise networks, the backbone network is
often susceptible to heavy traffic and it is inevitable to mitigate carbon at the backbone to offer
green communications. One of the possibilities to achieve green communication within an EN
is through efficient management of resources using optimization algorithms to reduce the
external data traffic. The optimization algorithms normally employ heuristic techniques to
reduce the amount of data generated at the backbone. Conversely, we have selected molecular
assembly (MA), a bio-inspired approach, which exploits the basic principle behind the
assembly of molecules in nature. MA utilizes the local interactions between the molecules to
organize a given disorganized system into a structured assembly [3]. In enterprise network

Network Protocols and Algorithms
ISSN 1943-3581
2013, Vol. 5, No. 1
www.macrothink.org/npa 113
environment, the molecular assembly is redefined with distance, incoming traffic and outgoing
traffic as the forces of attractions for optimizing the backbone traffic.
In this paper, we present a comparative study between the transport layer communication
protocols (TCP and UDP), based on the carbon footprint produced by the data traffic at the
backbone of an enterprise network. The comparative study integrates the carbon footprint
estimated in transmitting the backbone data from transport layer to physical layer and it
considers the overhead introduced by the communication protocols and the QoS of the
transmission line on the payload size of a transmission frame, which influences the number of
packets to be transmitted for the specified traffic volumes. The Manchester data encoding
scheme estimates the power density spectrum corresponds to each transmission and integrates
the spectrum to obtain the equivalent energy consumed in each transmission. Subsequently, it
utilizes energy-carbon conversion factor for estimating the carbon footprint. We formulate the
carbon footprint reduction as an optimization problem, whereby MA is exploited to generate
suitable clusters to reduce carbon emission at the backbone. The simulation of a typical single
enterprise with 100 nodes with heavy backbone traffic of around 4 GB and transmitting data
using high quality transmission link shows only marginal variation (1%) in carbon emission
between UDP and TCP protocols. However, UDP performs better with 14% reduced carbon
footprint than TCP when the transmission line quality is poor. The simulation experiment also
analyzes various scenarios demonstrating multiple traffic patterns and varying QoS, whereby
it is observed that UDP based transmissions within MA yields 64.5% reduced carbon
emission than the initial network.
The paper is organized into 6 sections. Section 1 details the concept behind the proposed
comparative study. Section 2 examines the related work, whereas Section 3 describes the
problem formulation, molecular assembly and carbon footprint computation. Section 4
provides the algorithm to estimate the carbon footprint and Section 5 details the experimental
results. Section 6 concludes the paper.
2. Related Work
We have surveyed various research works for comparing the communication protocols
against their performance while operating under various platforms. With respect to our
knowledge, most of the publications are limited to the study of performance measures of the
communication protocols within transport layer and none of them attempted to integrate the
carbon footprint from transport layer to physical layer. Giannoulis et al. [4] studied the QoS
and power management of the transport layer of the protocol stack, wherein they discussed
the performance of TCP and UDP. Garcia et al. [5] analyzed the Ethernet frame payload size
on IPv4 and IPv6 traffic, taking into consideration about TCP and UDP. Zhang et al. [6]
analyzed the throughput and reliability of communication protocols in pervasive computing
environment. Rind et al. [7] discussed the performance of TCP and UDP protocols over wired
and wireless local area networks and they measured the throughput to evaluate the
performance.

Network Protocols and Algorithms
ISSN 1943-3581
2013, Vol. 5, No. 1
www.macrothink.org/npa 114
The recent growths in information and communication sector add more carbon footprint
to the environment, thereby demanding the development of various strategies to reduce GHG
emissions. Koutitas [8] investigated the telecommunication network and the author proposed
genetic algorithm based optimization technique to design the network with reduced carbon
emissions. Despins et al. [9] discussed the necessity in providing green communications in
information and communication technology (ICT) industries and he briefed the ongoing
efforts in standardizing the methodologies to reduce GHG emissions. In another work, Peng
and Wang [10] proposed an ICT solutions calculation model for CO2 emissions and they
introduced an emission reduction index based on the model.
The self-organizing and the self-repairing behavior of molecules are exploited in the
design of computer networks [11]. The authors described the advantages of autonomic
assembly of molecules and their application in computing. Habib and Marimuthu [12]
presented a molecular assembly based network design tool to integrate the nodes in a given
network into various clusters utilizing distance and traffic as forces of attractions. The authors
claimed that the optimized and clustered network generated using the tool was able to reduce
the backbone traffic. The authors also proposed a capacity planning scheme based on
molecular assembly (MA) to manage CO2 emission at the backbone with distance as the force
of attraction to comply with the standards of fiber-optic and Wi-Fi connectivity [13]. In an
approach to estimate the carbon footprint the authors claimed that redesigning the existing
network topology within Simulated Annealing led to reduction in carbon emission [14][15].
In this paper, we have employed molecular assembly to generate clusters of associated
nodes with outgoing traffic chosen as the force of attraction with an objective function to
reduce carbon footprint. The data transmission is limited by QoS of the transmission line and
the de facto size of the packets corresponding to the transport layer protocols TCP and UDP.
We have executed a number of experiments to explore the feasibility in reducing the CO2
emission at the backbone of EN.
3. Problem Formulation
The carbon footprint of a backbone network within an enterprise is estimated by integrating
the carbon emissions during the data transmission from transport layer to physical layer.
3.1 Ethernet Transmission Frame
We have investigated the carbon footprint emission at the backbone of an enterprise
network by analyzing the transmission of the generated data using TCP and UDP protocols.
The choice of protocol alters the payload size of the packet to be transmitted, thereby affects
the number of transmissions. Ethernet frame discussed in [16] is selected as a reference, since
the local area networks are mostly Ethernet based and they add more traffic in an enterprise.
The maximum size of the transmitted packet using Ethernet frame is chosen as 1518 bytes.
The difference between TCP and UDP is mainly on the header size, which is 20 bytes for
TCP and 8 bytes for UDP as illustrated in Fig. 1. The generated traffic at the backbone is spilt
into varying number of TCP segments and UDP datagram before they are transmitted through

Network Protocols and Algorithms
ISSN 1943-3581
2013, Vol. 5, No. 1
www.macrothink.org/npa 115
the physical layer.
3.2 QoS of the Transmission Line
The efficiency of the transmission line further restricts the size of the packet/datagram to
be transmitted, which is varied from 20% (poor) to 100% (ideal) in the simulations. The total
number of transmissions required for transmitting the generated data at the backbone depends
on the size of the packet, which is given by Equation (1). Hereby, the data to be transmitted is
limited by the QoS of the transmission line. High quality transmission line increases the
length of the payload to be transmitted, thereby reduces the number of transmissions required
to complete the data transfer. Consequently, the carbon footprint associated with the number
of transmission decreases.
ts)tagram (bicket or daze of a paMaximum si
ted (bits)e transmitdata to bsmissioner of tranTotal numb (1)
Figure 1. Ethernet frame format.
3.3 Molecular Forces of Attraction
The initial network is a single clustered network comprised of a set of nodes, N = {n1, n2,
n3, …, nM } distributed in a given 2-dimensional area A, where M represents the total number
of nodes present. The outgoing traffic from each node is considered as the force of attraction
to discover the node assembly, which is defined by the set of Equations (2-4). Equation (2)
indicates that a cluster jG starts empty of nodes and Equation (3) examines all distinct
pairwise nodes within EN to determines whether an outgoing traffic force (OTF) exists
between any two nodes in and jn , where jnintr , describes the traffic flow between in and jn .
The molecular assembly produces a set of k clusters kGGGG ,...,,, 321 after ensuring that two
nodes can be presented within a cluster if the OTF satisfies the threshold (OTF_threshold), as
defined in Equation (4).

Network Protocols and Algorithms
ISSN 1943-3581
2013, Vol. 5, No. 1
www.macrothink.org/npa 116
Initially jG (2)
Nnn ji , and ,ji ),( ji nnOTF 0, jniniff tr (3)
oldOTF_thresh),(|, jijikk nnOTFnnGG (4)
3.4 Molecular Assembly
We have considered an existing single EN comprised of M nodes, whereby most of the
outgoing traffic is routed through the backbone network. The heavy traffic through the
backbone produces more carbon, thus posing threats to the environment. Molecular assembly
(MA) works in similarity with the molecular assembly in nature, which goes over
sequentially to discover various patterns of node assembly with a local interaction selected as
the force of attraction. The MA algorithm illustrated in detail in Fig. 2, generates the
multi-clustered enterprise network after passing through two phases; discovery and assembly.
In discovery phase, the associations between the nodes are discovered with outgoing traffic
selected as the force of attraction and the discovery phase is subdivided into intra-discovery
and extra-discovery. Intra-discovery procedure starts exploring the nodes and it discovers the
node-pair associations to generate the clusters, whereas extra-discovery procedure utilizes the
prior knowledge. It combines the knowledge of present discovery of node assembly with the
previous one to improve the solution. The algorithm ensures the discovery of associations
among the node pairs before proceeding with the next the phase.

Network Protocols and Algorithms
ISSN 1943-3581
2013, Vol. 5, No. 1
www.macrothink.org/npa 117
IIs there
sufficient data
discovered?
Discovery Phase-exploring the
outgoing force of attraction
Read existing EN
Specifications
Start
Assembly Phase
Is the
system completely
assembled with
acceptable carbon
footprint?
Is further
discovery
needed?
Is there
Prior
discovery
knowledge
?
Extra-
discoveryIntra-
discovery
Merge
No
Yes
Generate clusters
Optimize the generated
clusters
Yes
No
No
Yes
Stop
No
Yes
Figure 2. Molecular assembly.
In assembly phase, the associations discovered in previous phase are utilized to generate
the cluster assembly and the cluster assembly is optimized by comparing the carbon footprint
with the prior solutions. The MA algorithm goes repetitively and if necessary, it re-discovers
the associations to produce cluster assembly with less carbon.
3.5 Carbon Footprint Estimation
The volume of carbon released into the atmosphere by the traffic flow at the backbone of
an enterprise network is estimated using the relation between energy and carbon. The
backbone traffic is segmented into packets or datagram suitable for transmission under TCP
or UDP. Each packet or datagram is encoded using Manchester NRZ coding for transmission
through physical layer. The normalized power consumed by the packet/datagram of a defined
size is obtained by integrating the area under the generated power spectral density curve
)( fPw [2] as explained by Equation (5), wherein, the power spectral density )( fPw is defined

Network Protocols and Algorithms
ISSN 1943-3581
2013, Vol. 5, No. 1
www.macrothink.org/npa 118
by Equation (6). Hereby, )( fWT is the Fourier transform of the transmitted current or voltage
waveform )(twT and )( fPw has a unit of W/Hz.
P
dffPw )( (5)
)( fPw T
lim
2)(
T
fWT (6)
With known transmission bit rate of bT
1 , the power spectral density of a Manchester
NRZ signal [2] with unit amplitude and rectangular pulse is given by Equation (7):
)( fPNRZManchester
2sin2
)2sin( 2
2
b
b
bb Tf
Tf
TfT
(7)
The average power consumed by the traffic flow computed using Equations (5) and (7) is
substituted in Equations (8) and (9) to estimate equivalent carbon emission. The energy, E,
consumed per day in transmitting the encoded data is found by Equation (8) and is
represented in unit of watt-hour. Further, the energy E is multiplied by an energy-carbon
conversion factor of 0.184 per unit GHG emission [17] as in Equation (9) to compute
day-to-day GHG emissions, whereby natural gas is considered as the source of electricity.
The energy-carbon conversion factor represents the kilograms carbon-di-oxide equivalent per
unit of fuel consumed.
Energy consumed per day = E = TdffPf
NRZManchester*)(
(8)
Amount of carbon emission per day = 184.0E (9)
3.6 Network Problem Formulation
We have considered the initial enterprise network with a set of M nodes and with known
traffic matrix. The main objective function is to reduce the total carbon emission at the
backbone of the existing enterprise network, which is defined in Equation (10). It is assumed
that the inter-cluster communications are through the backbone. Hereby, jninC
,represents the
amount of carbon emission produced at the backbone by the traffic flow from node in to
node jn present in two different clusters kG and lG and kGGGGG ,...,,, 321 represents the
set of k clusters generated after synthesizing initial network. However, the volume of carbon
emitted from the initial single enterprise is represented as the sum of the carbon produced by
the traffic flow between the nodes in and jn through the backbone, as represented in
Equation (11).

Network Protocols and Algorithms
ISSN 1943-3581
2013, Vol. 5, No. 1
www.macrothink.org/npa 119
,Min
l&kjninlGj&nkGin
jni,nC Nnn ji , and GGGlk , (10)
jnin
jni,ninitial CC, Nnn ji , (11)
In addition to the force constraints related to MA presented in Equations (2) to (4), we
present additional constraints to govern the behavior of the framework in generating clusters
with balanced node distribution. Constraint (12) states that the number of clusters presents at
any time in the network should be bounded by a minimum of 2 to a maximum of M/2, where
M is the total number of nodes in the given network.
1 2
2k
kM
G (12)
Constraint (13) checks the clusters in EN and ensures that each node is bound to a single
cluster, thus avoiding node duplication within the clusters, wherein ji, represents the binding
of node i to cluster j.
Nnk
n ij
jii
1,1
, (13)
Constraint (14) is added to strengthen constraint (13) by guaranteeing that the total
number of nodes present in all the clusters at any time should be equal to M.
MGk
jj
1 (14)
The balanced node distribution is ensured by constraint (15), which restricts the
possibility of grouping most of the nodes within a single cluster, which may result in a worst
possible clustering scenario with 2 nodes grouped in one cluster and the remaining nodes in
the second cluster.
kM
n
mikGj
jii ,...,2,1jfor 2
2
1
,
(15)
4. Procedure for Comparative Study
We have devised a procedure to estimate the carbon footprint from transport layer to
physical layer, which is illustrated in Fig. 3. The procedure starts by reading the backbone
traffic of the existing network and then, it estimates the initial carbon footprint after
packetizing the data satisfying the constraints of the transport layer protocols, the QoS of the
transmission link and also the encoded transmission through the physical layer. The
difference in the header length of TCP and UDP and the efficiency of the transmission line
limit the payload size, thereby alter the number of packets produced for a specified volume of
data. The carbon footprint during the transmission of packets through the physical layer is
computed using the power spectrum of Manchester coding.

Network Protocols and Algorithms
ISSN 1943-3581
2013, Vol. 5, No. 1
www.macrothink.org/npa 120
Figure 3. Comparison of communication protocols.
Later on, the procedure employs bio-inspired molecular assembly technique to integrate
the associated nodes together into a single cluster. The integrated node assembly increases the
local traffic, consequently the backbone traffic reduces. The node assembly generation is
optimized within MA, which is detailed in section 3.2. The carbon emission produced at the
end of each of the iteration is compared with the prior solutions corresponding to the selected
protocol and the cluster assembly with reduced carbon emission is considered to be the best
solution.
5. Results and Discussion
We have carried out ten sets of experiments to illustrate various carbon producing
scenarios in the transmission of backbone data from transport layer to physical layer,
whereby QoS of the transmission link and communication protocols at the transport layer are
varied. The given single enterprise network with 100 nodes, producing different external
traffic volumes of 650 MB, 1 GB and 4 GB is considered as an initial network. The QoS of
the transmission line is varied from 100% to 20%. The Ethernet transmission frame format
Network Protocols and Algorithms
ISSN 1943-3581
2013, Vol. 5, No. 1
www.macrothink.org/npa 121
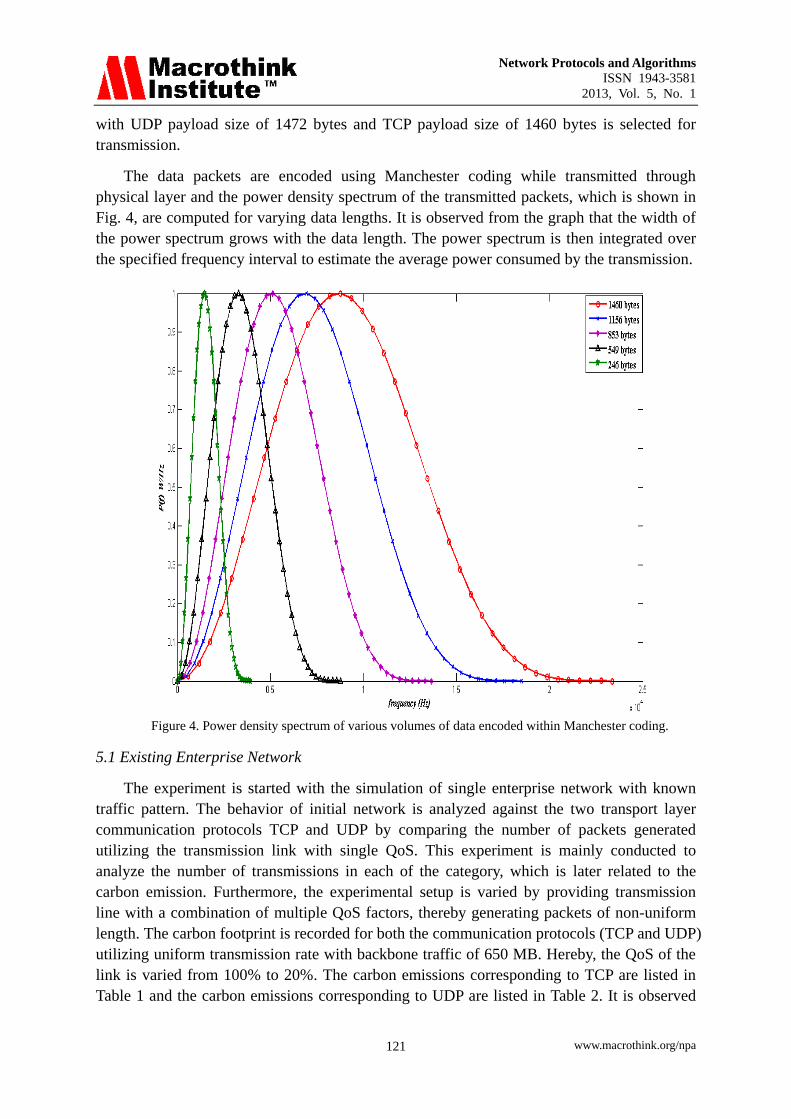
with UDP payload size of 1472 bytes and TCP payload size of 1460 bytes is selected for
transmission.
The data packets are encoded using Manchester coding while transmitted through
physical layer and the power density spectrum of the transmitted packets, which is shown in
Fig. 4, are computed for varying data lengths. It is observed from the graph that the width of
the power spectrum grows with the data length. The power spectrum is then integrated over
the specified frequency interval to estimate the average power consumed by the transmission.
Figure 4. Power density spectrum of various volumes of data encoded within Manchester coding.
5.1 Existing Enterprise Network
The experiment is started with the simulation of single enterprise network with known
traffic pattern. The behavior of initial network is analyzed against the two transport layer
communication protocols TCP and UDP by comparing the number of packets generated
utilizing the transmission link with single QoS. This experiment is mainly conducted to
analyze the number of transmissions in each of the category, which is later related to the
carbon emission. Furthermore, the experimental setup is varied by providing transmission
line with a combination of multiple QoS factors, thereby generating packets of non-uniform
length. The carbon footprint is recorded for both the communication protocols (TCP and UDP)
utilizing uniform transmission rate with backbone traffic of 650 MB. Hereby, the QoS of the
link is varied from 100% to 20%. The carbon emissions corresponding to TCP are listed in
Table 1 and the carbon emissions corresponding to UDP are listed in Table 2. It is observed

Network Protocols and Algorithms
ISSN 1943-3581
2013, Vol. 5, No. 1
www.macrothink.org/npa 122
from the tables that for a transmission link with single QoS, the annual carbon footprint
corresponding to TCP and to UDP are nearly equal. However, the annual carbon emission
increases with decreasing QoS and is resulted from the increase in the number of generated
packets and the number of transmissions.
In Table 1 and Table 2, column 3 details the actual size of the packet transmitted with
TCP and UDP and column 4 describes the number of packets generated, which is found to be
increasing with decreasing QoS. It is observed that the annual carbon footprint increases by
79% as the QoS decreases from 100% to 20%.
Table 1. Annual carbon footprint with TCP as a transport layer protocol.
Table 2. Annual Carbon footprint with UDP as a transport layer protocol.
The traffic pattern of the EN is varied to produce an external traffic of 1 GB at the
backbone and the outcome of the experiment is tabulated in Table 3. From the data in column
3 and column 6, it is concluded that higher quality transmission link with 100% bandwidth
utilization produced less carbon than the link with 20% utilizations. On comparing the total
carbon footprint for backbone traffic of 650 MB with that of 1 GB, it is understood that the
increase in traffic increases the number of transmissions, which increases the carbon
emission.
QoS
Packet
size
(bytes)
TCP-data
Payload
(bytes)
Number of
packets
generated
by TCP
Carbon
footprint
per
packet/year
(kg)
Total
annual
carbon
footprint
(kg)
100 1518 1460 445206 0.1524 67.849
80 1214 1156 562284 0.1498 84.230
60 911 853 762017 0.1353 103.101
40 607 549 1183971 0.1280 151.548
20 304 246 2642276 0.1252 330.813
QoS
Packet
size
(bytes)
UDP-data
Payload
(bytes)
Number of
packets
generated
by UDP
Carbon
footprint per
packet/year
(kg)
Total
annual
carbon
footprint
(kg)
100 1518 1472 441576 0.1529 67.517
80 1214 1168 556507 0.1502 83.587
60 911 865 751446 0.1361 102.272
40 607 561 1158645 0.1298 150.391
20 304 258 2519380 0.1286 323.992

Network Protocols and Algorithms
ISSN 1943-3581
2013, Vol. 5, No. 1
www.macrothink.org/npa 123
Table 3. Carbon footprint of an enterprise with 1 GB backbone traffic.
5.2 Optimization within MA
Second set of experiments are carried out within MA to observe the reduction in carbon
emission at the backbone of EN. Hereby we have increased the outgoing traffic at the
backbone of to 4 GB. By integrating the associated nodes together into suitable clusters, MA
reduces the traffic by 64.5%. The behavior of ideal network with 100% QoS within MA is
plotted against the two communication protocols in Fig. 5. The initial stages of MA produces
a marginal carbon reduction of around 5%, whereby TCP produces slightly higher carbon
than UDP. However, the repeated optimization produces considerable reduction in carbon
footprint by 63%.
Figure 5. Comparison of TCP and UDP against carbon emission under uniform transmission rate.
The experiment is repeated for a transmission link with varying QoS, whereby three
different transmission rates are selected for transmitting the generated data at the backbone.
The generated backbone traffic is segmented into three portions; 50%, 25% and 25%.
Maximum
packet size
(UDP)
(bytes)
Number
of
Packets
C per
year
(kg)
Maximum
packet size
(TCP)
(bytes)
Number
of
packets
C per
year
(kg)
1460 679347 103.87 1472 684931 104.38
1156 856164 128.59 1168 865051 129.58
853 1156069 157.34 865 1172332 158.62
549 1782531 231.37 561 1821493 233.15
246 3875968 498.45 258 4065040 508.94

Network Protocols and Algorithms
ISSN 1943-3581
2013, Vol. 5, No. 1
www.macrothink.org/npa 124
Subsequently, transmission link with 100%, 80% and 20% QoS are utilized in transmitting
the data segments respectively. MA manages to reduce the initial backbone traffic of 4 GB to
1.7 GB by generating suitable clusters. The cumulative sum of the carbon produced in
transmitting the entire packets, considering TCP and UDP are plotted in Fig. 6. It is observed
from Fig. 6 that UDP performs better by consuming 13.7% less carbon than the TCP during
initial stages of MA. Later on, the gap between the two graphs reduces and finally, UDP
based transmission ends with 10% less carbon than TCP based communications.
.
Figure 6. Comparison of TCP and UDP against carbon emission under varying QoS.
6. Conclusion
We have estimated the carbon footprint in transmitting data from transport layer to the
physical layer within an enterprise network. We have compared the estimated carbon
volumes against the two communication protocols TCP and UDP, whereby the comparative
study considers three factors such as the de facto size of the packet associated with the
selected protocol, the quality of the transmission link, and the data encoding schemes. The
power spectrum of the transmitted packet is integrated over a specified frequency interval to
estimate the carbon footprint. Furthermore, the backbone traffic is optimized through
molecular assembly to enable reduced carbon footprint within the enterprise, whereby MA
integrates the associated nodes into suitable clusters to reduce the number of transmissions.
The simulation result for a typical enterprise with 100 nodes generating backbone traffic of
around 4 GB using Ethernet transmission frame shows that the data transmission using UDP
produces a total of 63.26 kg of carbon volumes and using UDP produces a total of 63.03 kg

Network Protocols and Algorithms
ISSN 1943-3581
2013, Vol. 5, No. 1
www.macrothink.org/npa 125
carbon under uniform transmission rate. The difference in carbon footprint between UDP and
TCP based transmissions increases up to 14% for non-uniform transmission rate, whereby
UDP based transmission within MA shows a maximum reduction of 64.5% than the initial
network.
Acknowledgement
This work was supported by Kuwait University, Research Grant No. EO 02/11.
References
[1] L. L. Peterson and B. S. Davie, “Computers Network: A Systems Approach,” Elsevier
Publications, USA, 2005.
[2] Leon W. Couch, II, “Digital and Analog Communication Systems,” Pearson International
Edition, USA, 2007.
[3] Heylighen, F., and Gershenson, C., “When Can We Call a System Self-organizing?” In
the Proceedings of 7th European Conference on Artificial Life, Dortmund, Germany, LNAI
2801, Springer-Verlag, pp. 606-614, 2003. http://dx.doi.org/ 10.1007/978-3-540-39432-7_65
[4] Giannoulis, S., Antonopoulos, C., Topalis, E., Athanasopoulos, A., Prayati, A., and
Koubias, S., “TCP vs. UDP Performance Evaluation for CBR Traffic On Wireless Multihop
Networks,” In the Proceedings of Communication Systems, Networks and Digital Signal
Processing, 19-21 July 2006, Patras, Greece.
[5] Garcia, N.M., Freire, M.M., and Monteiro, P.P., “The Ethernet Frame Payload Size and
Its Effect on IPv4 and IPv6 Traffic,” In the Proceedings of International Conference on
Information Networking, 23-25 January 2008, Busan, Korea, pp.1-5.
http://dx.doi.org/10.1109/ICOIN.2008.4472813
[6] Zhang, W., Hansen, K.M., Fernandes, J., Schu tte, J., and Lardies, F.M., “QoS-Aware
Self-adaptation of Communication Protocols in a Pervasive Service Middleware,” In the
Proceedings of IEEE/ACM International Conference on Green Computing and
Communications, 18-20 December 2010, Hangzhou, China, pp.17-26. http://dx.doi.org/
10.1109/GreenCom-CPSCom.2010.132
[7] Rind, A.R., Shahzad, K., and Qadir, M.A., “Evaluation and comparison of TCP and UDP
over Wired-cum-Wireless LAN,” In the Proceedings of Multitopic Conference, 23-24
December 2006, Islamabad, Pakistan, pp.337-342.
http://dx.doi.org/10.1109/INMIC.2006.358188
[8] Koutitas, G., and Demestichas, P., “A Review of Energy Efficiency in
Telecommunication Networks,” Telecommunication Forum Journal, vol. 2, no. 1, 2010.
[9] Despins, C., Labeau, F., Tho Le Ngoc, Labelle, R., Cheriet, M., Thibeault, C., Gagnon, F.,
Leon-Garcia, A., Cherkaoui, O., St. Arnaud, B., Mcneill, J., Lemieux, Y., and Lemay, M.,
“Leveraging green communications for carbon emission reductions: Techniques, Test beds,
and Emerging Carbon Footprint Standards,” IEEE Communications Magazine, vol.49, no.8,
pp.101-109, August 2011. http://dx.doi.org/ 10.1109/MCOM.2011.5978422

Network Protocols and Algorithms
ISSN 1943-3581
2013, Vol. 5, No. 1
www.macrothink.org/npa 126
[10] Peng, R., and Wang, X., “ICT Solutions Calculation Model for CO2 Emission Reduction
and Prediction on Its Emission Reduction Potential,” In the Proceedings of International
Conference on Management and Service Science, 20-22 September 2009, Beijing, China,
pp.1-5. http://dx.doi.org/10.1109/ICMSS.2009.5301630
[11] Ross Ashby, W., “Principles of Self-Organizing System,” Principles of Self-Organization:
Transactions of the University of Illinois Symposium, 8-9 June 1961, Illinois, USA, pp.
255-278.
[12] Habib, S.J., and Marimuthu, P.N., “Molecular Assembly Tool for Synthesizing Multi-tier
Computer Networks,” In the Proceedings of 23rd IEEE International Conference on Tools
with Artificial Intelligence, 7-9 November 2003, Boca Raton, Florida, USA. (Poster).
http://dx.doi.org/10.1109/ICTAI.2011.141
[13] Habib, S.J., and Marimuthu, P.N., “Capacity Planning for Enterprise Green
Communications,” In the Proceedings of Second International Conference on Green
Communication and Networking, 25-26 October 2012, Gandia, Spain.
[14] Habib, S.J., and Marimuthu, P.N., “Carbon Offsetting through Computer Network
Redesign,” In the Proceedings of International Conference on Information Networking, 1-3
February 2012, Bali, Indonesia. (Poster ) http://dx.doi.org/ 10.1109/ICOIN.2012.6164415
[15] Habib, S.J., and Marimuthu, P.N., and Zaeri, N., “Green Communications through
Network Redesign,” In the Proceedings of First International Conference on Advances in
Computing and Communications, 22-24 July 2011, Kochi, India.
http://dx.doi.org/10.1007/978-3-642-22714-1_36
[16] Ray Horak, “Communications Systems and Networks,” Wiley Publications, USA, 2002.
[17] Carbon Footprint Conversion Factors:
http://archive.defra.gov.uk/environment/business/reporting/pdf/101006-guidelines-ghg-conve
rsion-factors.pdf
Copyright Disclaimer
Copyright reserved by the author(s).
This article is an open-access article distributed under the terms and conditions of the
Creative Commons Attribution license (http://creativecommons.org/licenses/by/3.0/).