Comparing Close Destination and Route-based Similarity ... Close Destination and Route-based...
12
Comparing Close Destination and Route-based Similarity Metrics for the Analysis of Map User Trajectories Ali Tahir 1 , Gavin McArdle 2 , and Michela Bertolotto 1 1 School of Computer Science and Informatics, University College Dublin (UCD) Dublin, Ireland (ali.tahir, michela.bertolotto)@ucd.ie 2 National Centre for Geocomputation, National University of Ireland Maynooth (NUIM) Maynooth, Ireland [email protected] Abstract. Movement is a ubiquitous phenomenon in the physical and virtual world. Analysing movement can reveal interesting trends and patterns. In the Human-Computer Interaction (HCI) domain, eye and mouse movements reveal the interests and intentions of users. By identi- fying common HCI patterns in the spatial domain, profiles containing the spatial interests of users can be generated. These profiles can be used to address the spatial information overload problem through map personal- isation. This paper presents the analysis and findings of a case study of users performing spatial tasks on a campus map. Mouse movement was recorded and analysed as users performed specific spatial tasks. The tasks correspond to the mouse trajectories produced while interacting with the Web map. When multiple users conduct similar and dissimilar spatial tasks, it becomes interesting to observe the behaviour patterns of these users. Clustering and geovisual analysis help to understand large move- ment datasets such as mouse movements. The knowledge gained through this analysis can be used to strengthen map personalisation techniques. In this work, we apply OPTICS clustering algorithm to a set of map user trajectories. We focus on two similarity measures and compare the results obtained with both when applied to particular saptial tasks carried out by multiple users. In particular, we show how route-based similarity, an advanced distance measure, performs better for spatial tasks involving scanning of the map area. 1 Introduction Recently there have been huge advances in spatial technologies. The use of Web maps and positioning technologies are now ubiquitous. The drive to generate spatial content has led to a major information overload problem [1], in which finding timely and relevant spatial information becomes a challenge. This makes it difficult for the users to choose and filter content to match their current needs.
Transcript of Comparing Close Destination and Route-based Similarity ... Close Destination and Route-based...
Comparing Close Destination and Route-basedSimilarity Metrics for the Analysis of Map User
Trajectories
Ali Tahir1, Gavin McArdle2, and Michela Bertolotto1
1 School of Computer Science and Informatics, University College Dublin (UCD)Dublin, Ireland
(ali.tahir, michela.bertolotto)@ucd.ie2 National Centre for Geocomputation, National University of Ireland Maynooth
(NUIM)Maynooth, Ireland
Abstract. Movement is a ubiquitous phenomenon in the physical andvirtual world. Analysing movement can reveal interesting trends andpatterns. In the Human-Computer Interaction (HCI) domain, eye andmouse movements reveal the interests and intentions of users. By identi-fying common HCI patterns in the spatial domain, profiles containing thespatial interests of users can be generated. These profiles can be used toaddress the spatial information overload problem through map personal-isation. This paper presents the analysis and findings of a case study ofusers performing spatial tasks on a campus map. Mouse movement wasrecorded and analysed as users performed specific spatial tasks. The taskscorrespond to the mouse trajectories produced while interacting with theWeb map. When multiple users conduct similar and dissimilar spatialtasks, it becomes interesting to observe the behaviour patterns of theseusers. Clustering and geovisual analysis help to understand large move-ment datasets such as mouse movements. The knowledge gained throughthis analysis can be used to strengthen map personalisation techniques.In this work, we apply OPTICS clustering algorithm to a set of map usertrajectories. We focus on two similarity measures and compare the resultsobtained with both when applied to particular saptial tasks carried outby multiple users. In particular, we show how route-based similarity, anadvanced distance measure, performs better for spatial tasks involvingscanning of the map area.
1 Introduction
Recently there have been huge advances in spatial technologies. The use of Webmaps and positioning technologies are now ubiquitous. The drive to generatespatial content has led to a major information overload problem [1], in whichfinding timely and relevant spatial information becomes a challenge. This makesit difficult for the users to choose and filter content to match their current needs.
Therefore, there is a need to adapt Web map contents into personalised mapsby understanding the user interests. Analysing spatial interaction patterns offersan approach to resolve this.
The research presented in this paper focuses on data generated by HCI ina Web map environment, in particular, the paths generated by users throughcomputer mouse movements. These paths, called trajectories, represent a seriesof mouse cursors locations. Mouse trajectories reflect usage patterns and activi-ties, which help to predict future movements and interests. In order to analyseour trajectory data, we use Visual Analytics (VA) [2], which promotes cognitionand knowledge discovery through data visualisation in a geospatial environmentcombined with analysis tools such as machine learning, data mining and clus-tering.
In our approach, clustering of mouse trajectories (obtained as 2D mousemovements) is an integral component in order to determine the usage patterns.We apply the OPTICS clustering algorithm [3], a density-based clustering ap-proach. Such an algorithm requires a metric upon which to determine similaritybetween trajectories. We compare two similarity metrics, namely close destina-tion and route-based [4], and assess when it is advantageous to use them.
In our previous work [5] we performed a preliminary evaluation based on asmall experiment (involving 12 users) using the close destination measure. Inthis paper we present a larger and more comprehensive user trial in which 27users participated. Each user was asked to perform ten spatial tasks. The to-tal trajectories collected from all users were analysed in order to see commonpatterns with the help of visual analysis and clustering techniques. As we areinterested in identifying types of user, we analysed multiple users over individ-ual tasks using both route-based and close destination simialrity measures toidentify common patterns. Maps of tasks and users are generated to validate theclustering results. The results show that clustering and geovisual analysis is aneffective technique to understand user patterns and behaviours. They also showhow route-based measures perform better for certain types of tasks.
The goal of this paper is to demonstrate the use of a geovisual analysis tool toanalyse user mouse trajectories. In particular, the work assesses the benefits ofdifferent distance measures for clustering such trajectories. The results highlighthow different users approach particular tasks and will provide input into mappersonalisation algorithms to resolve the spatial information overload problem.
The remainder of this article is organised as follows. To provide the back-ground for our work, some related literature is presented in Section 2. The overallapproach which includes a description of the clustering algorithm, distance mea-sures and spatial tasks is described in Section 3. Section 4 presents experimentalresults and the evaluation we have conducted. Finally, Section 5 outlines theconclusions and directions for future work.
2 Related Work
Activity recognition from movement data (in particular, spatial trajectories) ischallenging due to the huge amount of datasets available. Zhu et al. [6] define thisactivity recognition as “the process to extract high-level activity and goal relatedinformation from low-level sensor readings through machine learning and datamining techniques”. The authors represent trajectory-based activity recognitioninto three levels. The first level inputs the location from a sensor (for example,GPS, WiFi, cameras). At the next level, an activity is recognised, such as trans-portation modes. As an example of the final (highest) level, Microsoft GeoLife 3
a Location-based Social Network (LBSN) application, has a transportation de-tection system which categorises a GPS trajectory into various activities (suchas walking, biking, driving and onBus). These transportation modes facilitateactivity recognition. GeoLife aims to provide social connectivity between peopleusing their trajectories.
The advances in location-based positioning technologies such as GPS as wellas the growth of mobile and wireless technologies have enabled movement data,inthe form of spatial trajectories, to be collected. These trajectories can be col-lected in both outdoor and indoor [7] environments and correspond to free [8, 9]and constrained movements [10, 11]. For example, a road network correspondsto a constrained movement, while the movement of an animal can be termedas free movement. Zheng and Zhou [12] provide several movement data exam-ples. They categorise movement of people into active and passive recordings. Forexample, active recording occurs when travellers share their travel routes withtheir friends to strengthen social connectivity which is evident in the context ofLocation-based Social Networks (LBSN) applications. On the other hand, a usercarrying a mobile phone unintentionally generates spatial trajectories. These tra-jectories correspond to a sequence of cell tower IDs. Other categories include themobility of vehicles (which can be used for traffic analysis and resource alloca-tion) and the mobility of animals and natural phenomenons (such as migratorybirds research, hurricanes and tornadoes).
While most researchers focus on physical trajectories, mouse, eye and touchgestures on a computer screen are also forms of movement which generate spe-cific trajectories. When interacting with a spatial application, such as a Webmap, these trajectories can be analysed to examine Human-Computer Interac-tion (HCI), the study of interaction between humans and machines [13]. We areinterested in analysing trajectories generated by HCI in our research, particu-larly in the spatial interaction domain.
Typical activity recognition involves monitoring a single as well as multipleuser activities. Zhu et al. [6] present a detailed account of single and multipleusers activity recognition from trajectory data. The study shows that much workhas been done on single users while less attention has been given to multiple useractivity analysis. Single user activity recognition corresponds to the analysis ofan individual’s user history in order to predict future trends. In general, sin-
3 http://research.microsoft.com/en-us/projects/geolife/
gle user activity can be recognised through supervised methods, unsupervisedmethods and frequent pattern mining approach [6]. Supervised learning methodstypically input trajectory data as well as activity labels. The intention is to usea suitable classification model such as Bayesian networks, Hidden Markov Model(HMM) and decision trees, in order to predict the activity of the trajectory inquestion. These methods attempt to identify activities within a trajectory, for ex-ample, significant places, stop rate, velocity change, etc. Unsupervised methodson the other hand do not take activity labels into account, but instead discoverpatterns directly from the trajectory data [6], for instance, by applying cluster-ing methods. For this reason, in the case of mouse trajectories, unsupervisedmethods are found to be more relevant. To the best of our knowledge, mousetrajectories on a map interface have not been studied in order to understanduser’s intentions and behaviours.
In our previous work, we have applied spatial clustering to mouse trajecto-ries in order to identify usage patterns [5]. The approach successfully identifiedspatial tasks with the help of clustering while some outliers were also detected.As an extension to spatial clustering, we presented clustering based on temporalinformation which considers speed and acceleration at each location in a trajec-tory to describe behaviour [14]. A detailed discussion on clustering algorithmssuitable for trajectories as well several distance measures is presented in [5, 14].The research presented here is an extension to this. We adapt an advanced simi-larity measure (route similarity) [4] and use this as a spatial distance measure inOPTICS clustering. In previous work, we used close destination distance mea-sures to find the similarity between trajectories. This function considers the endpoints of each trajectory while computing the trajectory similarity. Now we com-pare the distance between each point of each trajectories in order to produce anew overall similarity score.
3 Approach
In this section we present our approach. Firstly, we conducted a user trial inwhich users performed several spatial tasks. The trials were conducted in anunsupervised manner, similar to a previous set of trials described in [5]. Theparticipants had to register in order to start the spatial tasks. The Web interface,designed for this purpose, was deemed to be as user friendly as possible as shownin Figure 1. The interface contains different components on a Web page includingthe spatial task description, an input area for answers, a mapping component anda map legend. The geographic area selected was that of the University CollegeDublin (UCD) Belfield Campus.
The 10 spatial tasks presented to users are listed below, while the Web in-terface is shown in Figure 1.
– Task 1: As a new student, you are required to open up a student accountwith the bank located at the campus. Find the bank on the campus map. Onyour way back, you would also like to get some food. Which is the nearestrestaurant to the bank?

Fig. 1. Web interface for experiments
– Task 2: You finish a lecture at the John Henry Newman Building (Arts) andneed to catch a bus to the city centre (all bus stops connect to the city).Find the bus stop most convenient to you on campus. How many bus stopsare there on campus?
– Task 3: Name the building closest to the largest car park on campus.
– Task 4: In order to attend a service at the church located on campus, youneed to find the closest car park to the church. Find your way to this carpark if you are driving from the Stillorgan Road/N11 entrance.
– Task 5: You need to attend a graduation ceremony at UCD. You will bedriving to UCD and enter from the Stillorgan Road/N11 entrance. Locatethe reception and O’Reilly Hall and find the shortest route between the two.
– Task 6: You need to drive to the student bar in the evening. You are requiredto enter the UCD campus from the Wynsward Drive entrance. Follow thepath to find the closest car park to the student bar. How many pubs areshown on the map?
– Task 7: You finish a lecture in Computer Science and Informatics (CSI)building. You need to meet your friend in front of the Health Science Centreand go together to the James Joyce Library (close to the central largest lake- coloured in blue) in order to return a book. Plan the route.
– Task 8: In order to post a letter to your friend, plan the route to cycle fromCharles Institute located at North West of the central lake (coloured in blue)
to Belfield Post Office. Find the nearest bicycle parking stand to the postoffice.
– Task 9: You need to meet your friends at the sports centre building (colouredin green). How would you get to the Glenomena student residence (south eastof the central lake) from the sports centre?
– Task 10: Count the number of roads crossing the UCD boundary (as outlinedby the black line).
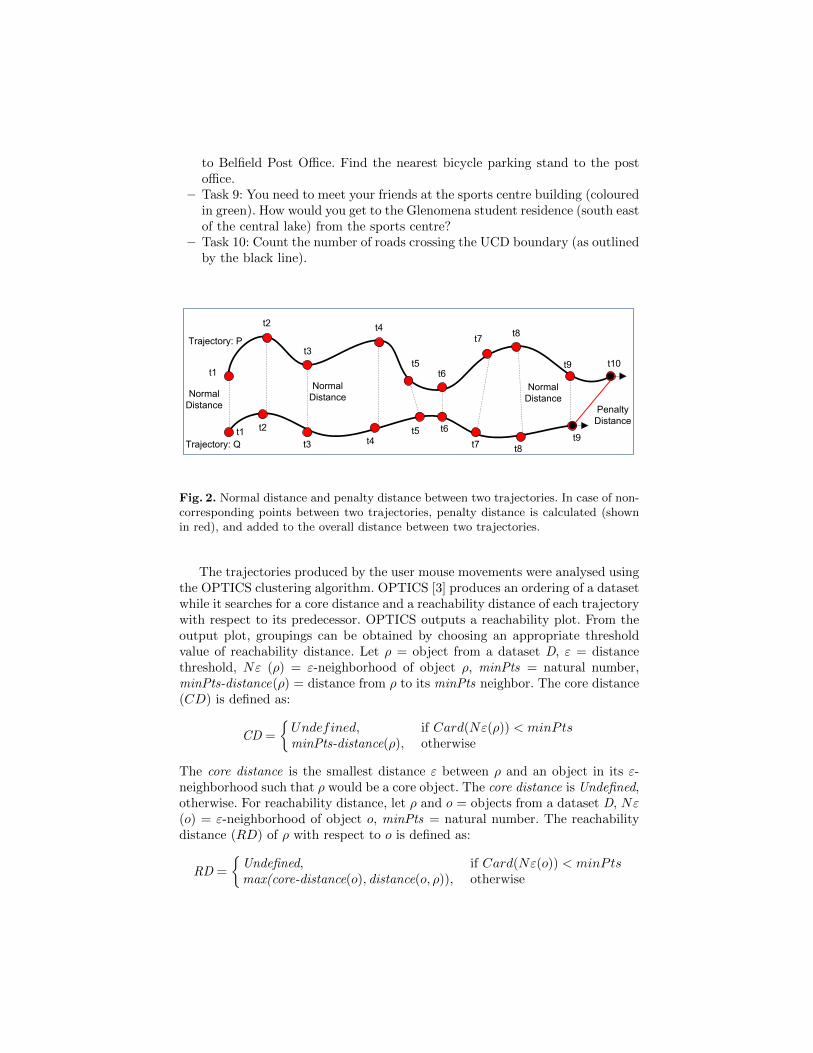
Trajectory: P
Trajectory: Q
Penalty
Distance
Normal
Distance
Normal
Distance
t1
t2
t3
t4
t5t6
t7t8
t9 t10
t9
t8t7
t6t5t4t3
t2t1
Normal
Distance
Fig. 2. Normal distance and penalty distance between two trajectories. In case of non-corresponding points between two trajectories, penalty distance is calculated (shownin red), and added to the overall distance between two trajectories.
The trajectories produced by the user mouse movements were analysed usingthe OPTICS clustering algorithm. OPTICS [3] produces an ordering of a datasetwhile it searches for a core distance and a reachability distance of each trajectorywith respect to its predecessor. OPTICS outputs a reachability plot. From theoutput plot, groupings can be obtained by choosing an appropriate thresholdvalue of reachability distance. Let ρ = object from a dataset D, ε = distancethreshold, Nε (ρ) = ε-neighborhood of object ρ, minPts = natural number,minPts-distance(ρ) = distance from ρ to its minPts neighbor. The core distance(CD) is defined as:
CD =
{Undefined, if Card(Nε(ρ)) < minPtsminPts-distance(ρ), otherwise
The core distance is the smallest distance ε between ρ and an object in its ε-neighborhood such that ρ would be a core object. The core distance is Undefined,otherwise. For reachability distance, let ρ and o = objects from a dataset D, Nε(o) = ε-neighborhood of object o, minPts = natural number. The reachabilitydistance (RD) of ρ with respect to o is defined as:
RD =
{Undefined, if Card(Nε(o)) < minPtsmax(core-distance(o), distance(o, ρ)), otherwise
Thus, the reachability distance of ρ is the smallest distance such that ρ is directlydensity-reachable from a core object o. Otherwise, if o is not a core object, evenat the generating distance ε, the reachability distance of ρ with respect to o isUndefined.
In order to apply this clustering algorithm, an appropriate similarity measureis required. The similarity measure is used with the clustering algorithm alongwith a distance threshold and the minimum number of neighbours required toform a cluster. Route similarity [4] is a complex (computationally expensive)distance measure that computes the geographical distance between two trajec-tories. Moreover, this distance function deals with incomplete trajectories andwith more significant positioning errors. Although mouse trajectories do not havepositioning errors, they are uncertain and hold frequent sequences of movements.This function is also more suited to unequal time intervals between records (thecase of mouse trajectories). The function repeatedly searches for the closestpair of positions in two trajectories. It computes two derivative distances: meandistance between the corresponding positions and a penalty distance for the un-matched positions. The penalty distance is increased if a position is skipped anddecreased if the corresponding position is found. The final distance is the sum oftwo derivative distances. We have opted to use this measure in order to computethe distance between two trajectories. Figure 2 illustrates the concept of normaldistance and the penalty distance between two trajectories. The next sectionpresents results and evaluation we have conducted.
4 Evaluation
In order to demonstrate the effectiveness of route similarity with OPTICS, wecarried out a series of analysis tasks. Although our main interest lies with routesimilarity applied to individual tasks, initially we show the effects of applyingclose destination clustering to all trajectories produced from the user trial as theresults provide an example of a situation where this is not an effective metric.Additionally, the approach highlights how to use and interpret the output fromthe OPTICS algorithm which we also used to compare the route-based and closedestination clustering of trajectories from specific tasks.
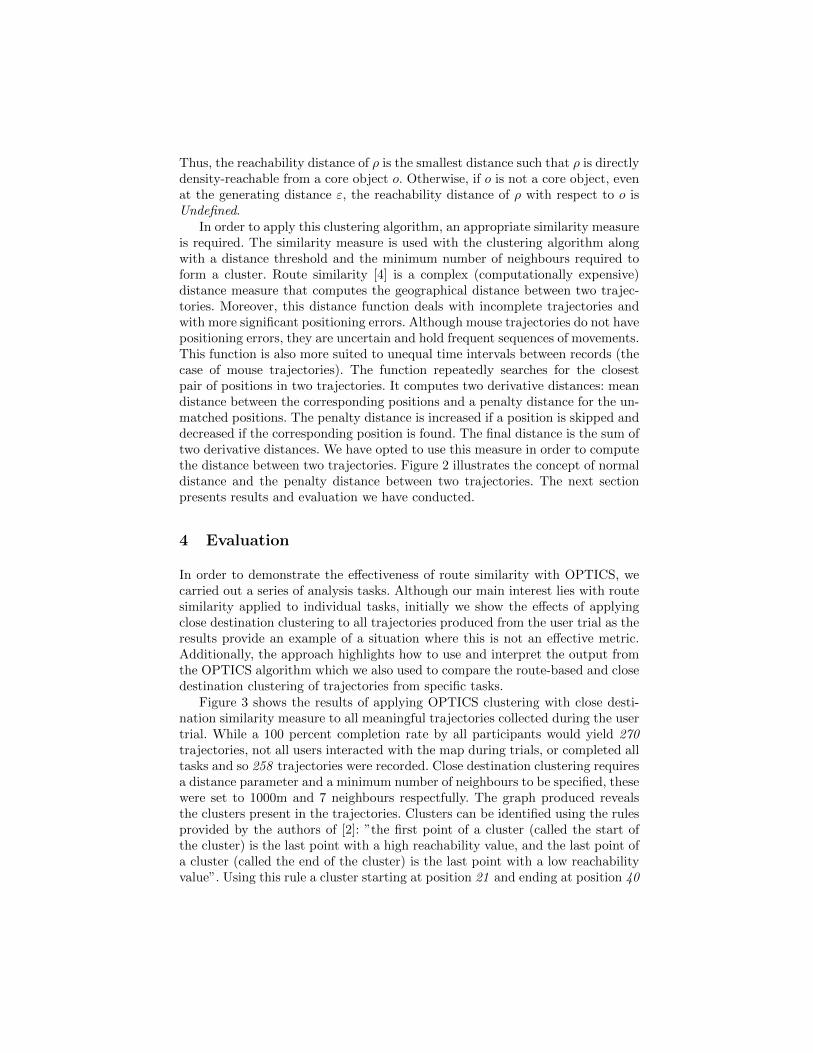
Figure 3 shows the results of applying OPTICS clustering with close desti-nation similarity measure to all meaningful trajectories collected during the usertrial. While a 100 percent completion rate by all participants would yield 270trajectories, not all users interacted with the map during trials, or completed alltasks and so 258 trajectories were recorded. Close destination clustering requiresa distance parameter and a minimum number of neighbours to be specified, thesewere set to 1000m and 7 neighbours respectfully. The graph produced revealsthe clusters present in the trajectories. Clusters can be identified using the rulesprovided by the authors of [2]: ”the first point of a cluster (called the start ofthe cluster) is the last point with a high reachability value, and the last point ofa cluster (called the end of the cluster) is the last point with a low reachabilityvalue”. Using this rule a cluster starting at position 21 and ending at position 40
can be extracted. Similarly, another cluster starting at position 97 and endingat position 113 can be identified.
Fig. 3. Similarity measure: close destination, distance: 1000 meters, neighbours: 7,Trajectories: 258
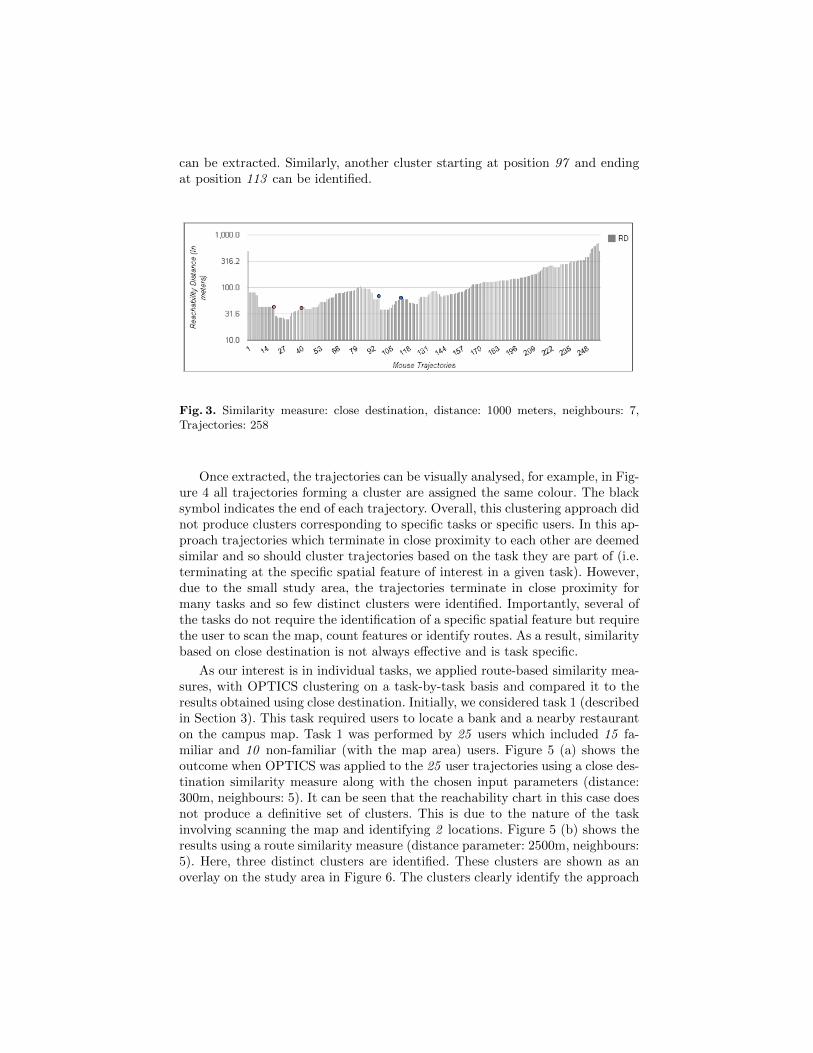
Once extracted, the trajectories can be visually analysed, for example, in Fig-ure 4 all trajectories forming a cluster are assigned the same colour. The blacksymbol indicates the end of each trajectory. Overall, this clustering approach didnot produce clusters corresponding to specific tasks or specific users. In this ap-proach trajectories which terminate in close proximity to each other are deemedsimilar and so should cluster trajectories based on the task they are part of (i.e.terminating at the specific spatial feature of interest in a given task). However,due to the small study area, the trajectories terminate in close proximity formany tasks and so few distinct clusters were identified. Importantly, several ofthe tasks do not require the identification of a specific spatial feature but requirethe user to scan the map, count features or identify routes. As a result, similaritybased on close destination is not always effective and is task specific.
As our interest is in individual tasks, we applied route-based similarity mea-sures, with OPTICS clustering on a task-by-task basis and compared it to theresults obtained using close destination. Initially, we considered task 1 (describedin Section 3). This task required users to locate a bank and a nearby restauranton the campus map. Task 1 was performed by 25 users which included 15 fa-miliar and 10 non-familiar (with the map area) users. Figure 5 (a) shows theoutcome when OPTICS was applied to the 25 user trajectories using a close des-tination similarity measure along with the chosen input parameters (distance:300m, neighbours: 5). It can be seen that the reachability chart in this case doesnot produce a definitive set of clusters. This is due to the nature of the taskinvolving scanning the map and identifying 2 locations. Figure 5 (b) shows theresults using a route similarity measure (distance parameter: 2500m, neighbours:5). Here, three distinct clusters are identified. These clusters are shown as anoverlay on the study area in Figure 6. The clusters clearly identify the approach

Fig. 4. (a) Cluster showing 22 trajectories starting from location 21 and ending at 40.(b) Cluster showing 22 trajectories starting from location 97 and ending at 113
users took to complete the tasks and can be broadly broken down into users whowere familiar and unfamiliar with the campus.
a) b)
Fig. 5. Task 1- a) Similarity measure: close destination, distance: 300 meters, neigh-bors: 5, trajectories: all b) Similarity measure: route similarity, distance: 2500 meters,neighbors: 5, Trajectories: all
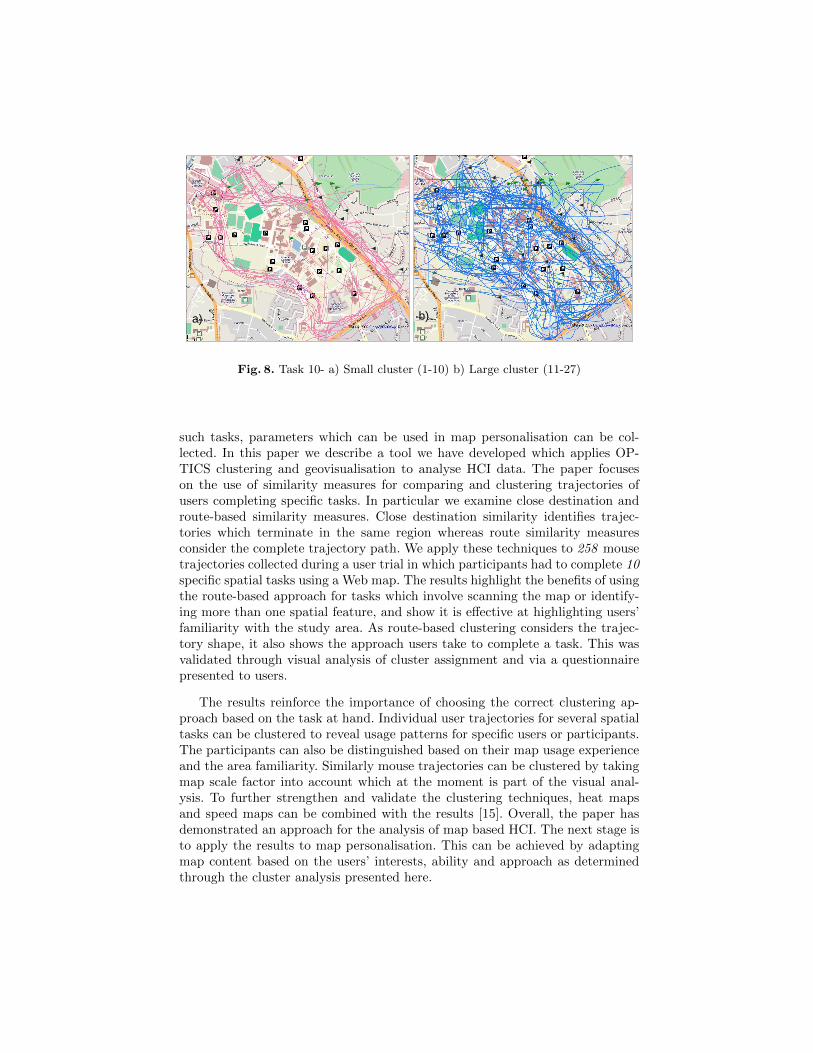
To further demonstrate the effectiveness of using a route similarity metric wealso analyse the results for task 10. In task 10, users were required to count thenumber of roads entering the UCD campus. This is an example of a situationin which close destination similarity is not effective because users are free tostart and end their trajectories at arbitrary locations. This task involves scan-ning the map to identify roads crossing the campus boundary. This task wasperformed by all 27 users. Both close destination and route similarity measureswere used in conjunction with OPTICS and the results are shown in Figure 7.The parameters used were a distance of 2500m and 5 neighbours. The close des-tination metric did not identify a distinct set of clusters whereas route similarityclearly identified two predominant groups of trajectories. These two clusters canbe visually analysed in Figure 8. The first cluster (Figure 8 (a)) is found to be
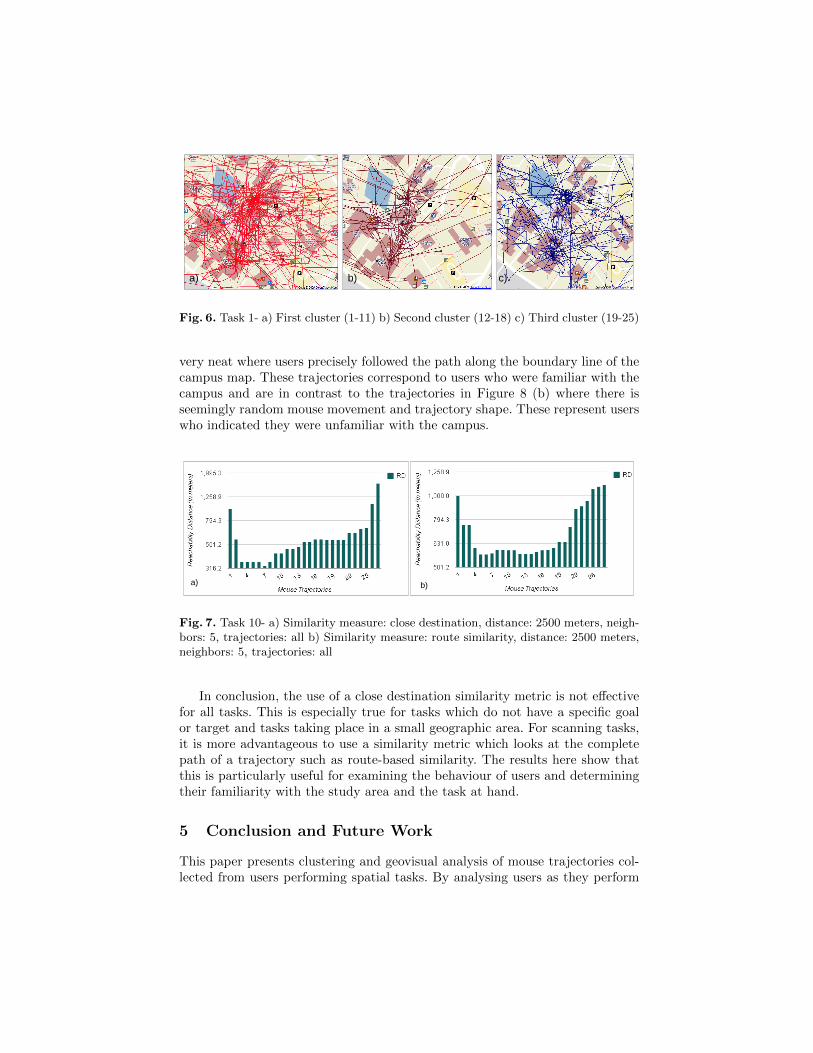
a) b) c)
Fig. 6. Task 1- a) First cluster (1-11) b) Second cluster (12-18) c) Third cluster (19-25)
very neat where users precisely followed the path along the boundary line of thecampus map. These trajectories correspond to users who were familiar with thecampus and are in contrast to the trajectories in Figure 8 (b) where there isseemingly random mouse movement and trajectory shape. These represent userswho indicated they were unfamiliar with the campus.
a) b)
Fig. 7. Task 10- a) Similarity measure: close destination, distance: 2500 meters, neigh-bors: 5, trajectories: all b) Similarity measure: route similarity, distance: 2500 meters,neighbors: 5, trajectories: all
In conclusion, the use of a close destination similarity metric is not effectivefor all tasks. This is especially true for tasks which do not have a specific goalor target and tasks taking place in a small geographic area. For scanning tasks,it is more advantageous to use a similarity metric which looks at the completepath of a trajectory such as route-based similarity. The results here show thatthis is particularly useful for examining the behaviour of users and determiningtheir familiarity with the study area and the task at hand.
5 Conclusion and Future Work
This paper presents clustering and geovisual analysis of mouse trajectories col-lected from users performing spatial tasks. By analysing users as they perform
a) b)
Fig. 8. Task 10- a) Small cluster (1-10) b) Large cluster (11-27)
such tasks, parameters which can be used in map personalisation can be col-lected. In this paper we describe a tool we have developed which applies OP-TICS clustering and geovisualisation to analyse HCI data. The paper focuseson the use of similarity measures for comparing and clustering trajectories ofusers completing specific tasks. In particular we examine close destination androute-based similarity measures. Close destination similarity identifies trajec-tories which terminate in the same region whereas route similarity measuresconsider the complete trajectory path. We apply these techniques to 258 mousetrajectories collected during a user trial in which participants had to complete 10specific spatial tasks using a Web map. The results highlight the benefits of usingthe route-based approach for tasks which involve scanning the map or identify-ing more than one spatial feature, and show it is effective at highlighting users’familiarity with the study area. As route-based clustering considers the trajec-tory shape, it also shows the approach users take to complete a task. This wasvalidated through visual analysis of cluster assignment and via a questionnairepresented to users.
The results reinforce the importance of choosing the correct clustering ap-proach based on the task at hand. Individual user trajectories for several spatialtasks can be clustered to reveal usage patterns for specific users or participants.The participants can also be distinguished based on their map usage experienceand the area familiarity. Similarly mouse trajectories can be clustered by takingmap scale factor into account which at the moment is part of the visual anal-ysis. To further strengthen and validate the clustering techniques, heat mapsand speed maps can be combined with the results [15]. Overall, the paper hasdemonstrated an approach for the analysis of map based HCI. The next stage isto apply the results to map personalisation. This can be achieved by adaptingmap content based on the users’ interests, ability and approach as determinedthrough the cluster analysis presented here.
Acknowledgements
Research presented in this paper was funded by a Strategic Research Clustergrant (07/SRC/I1168) by Science Foundation Ireland under the National Devel-opment Plan. The authors gratefully acknowledge this support.
References
[1] Yang, Y., Claramunt, C.: A hybrid approach for spatial web personalization. Weband Wireless Geographical Information Systems (2005) 206–221
[2] Thomas, J., Cook, K.: A visual analytics agenda. Computer Graphics and Ap-plications, IEEE 26 (2006) 10–13
[3] Ankerst, M., Breunig, M.M., Kriegel, H.P., Sander, J.: OPTICS: Ordering Pointsto Identify the Clustering Structure. SIGMOD Rec. 28 (1999) 49–60
[4] Andrienko, G., Andrienko, N., Wrobel, S.: Visual analytics tools for analysisof movement data. SIGKDD Explorations Newsletter - Special Issue on VisualAnalytics 9 (2007) 38–46
[5] Tahir, A., McArdle, G., Bertolotto, M.: Identifying specific spatial tasks throughclustering and geovisual analysis. In: Geoinformatics (GEOINFORMATICS),2012 20th International Conference on, IEEE (2012) 1–6
[6] Zhu, Y., Zheng, V.W., Yang, Q.: Activity recognition from trajectory data. InZheng, Y., Zhou, X., eds.: Computing with Spatial Trajectories. Springer-VerlagNew York Inc (2011) 180
[7] Jensen, C., Lu, H., Yang, B.: Indexing the trajectories of moving objects insymbolic indoor space. Advances in Spatial and Temporal Databases (2009) 208–227
[8] Guting, R., Bohlen, M., Erwig, M., Jensen, C., Lorentzos, N., Schneider, M.,Vazirgiannis, M.: A foundation for representing and querying moving objects.ACM Transactions on Database Systems (TODS) 25 (2000) 1–42
[9] Forlizzi, L., Guting, R., Nardelli, E., Schneider, M.: A data model and datastructures for moving objects databases. Volume 29. ACM (2000)
[10] Guting, H., de Almeida, T., Ding, Z.: Modeling and querying moving objects innetworks. The VLDB Journal, The International Journal on Very Large DataBases 15 (2006) 165–190
[11] Speicvcys, L., Jensen, C., Kligys, A.: Computational data modeling for network-constrained moving objects. In: Proceedings of the 11th ACM international Sym-posium on Advances in Geographic Information Systems, ACM (2003) 118–125
[12] Zheng, Y., Zhou, X.: Computing with Spatial Trajectories. Springer-Verlag NewYork Inc (2011)
[13] Dix, A., Finlay, J., Abowd, G.: Human-Computer interaction. Prentice Hall(2004)
[14] McArdle, G., Tahir, A., Bertolotto, M.: Spatio-temporal clustering of movementdata: An application to trajectories generated by human-computer interaction.ISPRS Annals of Photogrammetry, Remote Sensing and Spatial Information Sci-ences I-2 (2012) 147–152
[15] Tahir, A., McArdle, G., Bertolotto, M.: A geovisual analytics approach for mousemovement analysis. International Journal of Data Mining, Modeling and Manage-ment. Special Issue on Spatial Information Mining, Modeling and Management(2012) In press.