Comparing Calorie Expenditure and Rating of Perceived ...
57
Eastern Washington University EWU Digital Commons EWU Masters esis Collection Student Research and Creative Works 2014 Comparing Calorie Expenditure and Rating of Perceived Exertion between the Curve and a Motorized Treadmill Nicholas Robertson Eastern Washington University Follow this and additional works at: hp://dc.ewu.edu/theses is esis is brought to you for free and open access by the Student Research and Creative Works at EWU Digital Commons. It has been accepted for inclusion in EWU Masters esis Collection by an authorized administrator of EWU Digital Commons. For more information, please contact [email protected]. Recommended Citation Robertson, Nicholas, "Comparing Calorie Expenditure and Rating of Perceived Exertion between the Curve and a Motorized Treadmill" (2014). EWU Masters esis Collection. 268. hp://dc.ewu.edu/theses/268
Transcript of Comparing Calorie Expenditure and Rating of Perceived ...

Eastern Washington UniversityEWU Digital Commons
EWU Masters Thesis Collection Student Research and Creative Works
2014
Comparing Calorie Expenditure and Rating ofPerceived Exertion between the Curve and aMotorized TreadmillNicholas RobertsonEastern Washington University
Follow this and additional works at: http://dc.ewu.edu/theses
This Thesis is brought to you for free and open access by the Student Research and Creative Works at EWU Digital Commons. It has been accepted forinclusion in EWU Masters Thesis Collection by an authorized administrator of EWU Digital Commons. For more information, please [email protected].
Recommended CitationRobertson, Nicholas, "Comparing Calorie Expenditure and Rating of Perceived Exertion between the Curve and a MotorizedTreadmill" (2014). EWU Masters Thesis Collection. 268.http://dc.ewu.edu/theses/268

COMPARING CALORIE EXPENDITURE AND RATING OF PERCEIVED
EXERTION BETWEEN THE CURVE AND A MOTORIZED TREADMILL
A Thesis
Presented To
Eastern Washington University
Cheney, Washington
In Partial Fulfillment of the Requirements
for the Degree
Masters of Science Physical Education
By
Nicholas B. Robertson
Summer 2013

ii
THESIS OF NICHOLAS B. ROBERTSON APPROVED BY
__________________________________________________________DATE________
WENDY REPOVICH, GRADUATE COMMITTEE CHAIR
__________________________________________________________DATE________
CHRISTI BREWER, GRADUATE STUDY COMMITTEE

iii
MASTERS THESIS
In presenting this thesis in partial fulfillment of the requirements for a master’s degree at
Eastern Washington University, I agree that that JFK Library shall make copies freely
available for inspection. I further agree that copying of this project in whole or in part is
allowable only for scholarly purposes. It is understood however, that any copying or
publication of this thesis for commercial purposes, or for financial gain, shall not be
allowed without my written permission.
Signature
Date

iv
ACKNOWLEDGEMENTS
I would first like to thank Dr. Wendy Repovich. Her knowledge, advice, and
encouragement helped me complete this thesis and prepare for my future. I’m grateful
that she always made time in her busy schedule to help me however she could.
I would also like to express my sincere appreciation for my family, co-workers,
and fellow graduate students for their continual love and support. I would especially like
to thank my wife and son who have supported me through everything and consistently
believe in my success.

v
ABSTRACT
The purpose of this study was to determine if any difference in Calorie
expenditure and rating of perceived exertion (RPE) exists when walking on the Curve or
a motorized treadmill. Recruitment of participants was done through recruitment flyers
placed on campus. After indicating interest, participants’ eligibility was determined by
the PAR-Q and being unfamiliar with walking on the Curve. Twelve participants
volunteered for the study (five males, seven females). The mean age of participants was
22.58 years ± 2.31 and mean weight was 76.96kg ± 16.19. On testing days, each
participant was fitted with a polar heart rate monitor and the K4 b2 metabolic gas
analyzer (K4). The order of tests was randomly assigned. The warm up consisted of
walking at 3 MPH until steady state heart rate was reached which took approximately
three minutes. The actual test consisted of walking at 3 MPH for 10 minutes on each
treadmill. Oxygen consumption was collected on a breath-by-breath basis by the K4.
Calorie expenditure was reported using the formula of one liter of Oxygen consumed
equals five Calories. Calorie expenditure was then totaled over 10 minutes. RPE was
obtained during the last minute of each exercise bout. To determine whether there was a
significant difference in Calorie expenditure and RPE while walking under the two
conditions, two paired samples t-tests were performed. Alpha level was set at p ≤ .05.
The results of the t-tests showed a significant increase in Calorie expenditure (t = 17.73, p
< .0001) and RPE (t = 5.45, p = 0.0002) while participants walked on the Curve. This
study confirmed the Curve advertisement that someone walking on the Curve will burn
more Calories than someone walking on a treadmill at the same speed.

vi
TABLE OF CONTENTS
Abstract .......................................................................................................... v
Introduction .................................................................................................... 1
Purpose of the Study .......................................................................... 4
Null Hypothesis ................................................................................. 4
Delimitations ...................................................................................... 4
Assumptions ....................................................................................... 5
Operational Definitions ...................................................................... 5
Significance of the Study ................................................................... 5
Review of Literature ...................................................................................... 6
Evolutionary Perspective of Physical Activity .................................. 6
Rising Epidemic of Obesity ............................................................... 7
Physical Activity, Health, and Obesity .............................................. 9
Physical Inactivity .............................................................................. 10
Caloric Balance and Exercise ............................................................ 11
Weight Loss Exercise Recommendations .......................................... 12
Exercise Machines ............................................................................. 12
Metabolic Responses ......................................................................... 15
Gaps and Claims ................................................................................ 16
Summary ............................................................................................ 16
Methods.......................................................................................................... 18
Participants ......................................................................................... 18
Equipment .......................................................................................... 18
Procedures .......................................................................................... 19
Statistical Analyses ............................................................................ 21

vii
Summary ............................................................................................ 21
Results ............................................................................................................ 22
Participants ......................................................................................... 22
Data Analysis ..................................................................................... 22
Parametric Statistics ........................................................................... 23
Summary ............................................................................................ 24
Discussion ...................................................................................................... 25
Overview ............................................................................................ 25
Discussion .......................................................................................... 26
Recommendations .............................................................................. 28
Overall Contributions and Summary ................................................. 29
Appendices ..................................................................................................... 39
Appendix A- Recruitment Flyer ........................................................ 39
Appendix B - Par-Q ........................................................................... 40
Appendix C- Borg RPE 6-20 Scale ................................................... 41
Appendix D- Informed Consent......................................................... 43
Appendix E- Calibrations .................................................................. 45

viii
TABLES AND FIGURES
Table 1 Participants Physical Characteristics ................................................ 22
Table 2 Descriptive Statistics......................................................................... 23
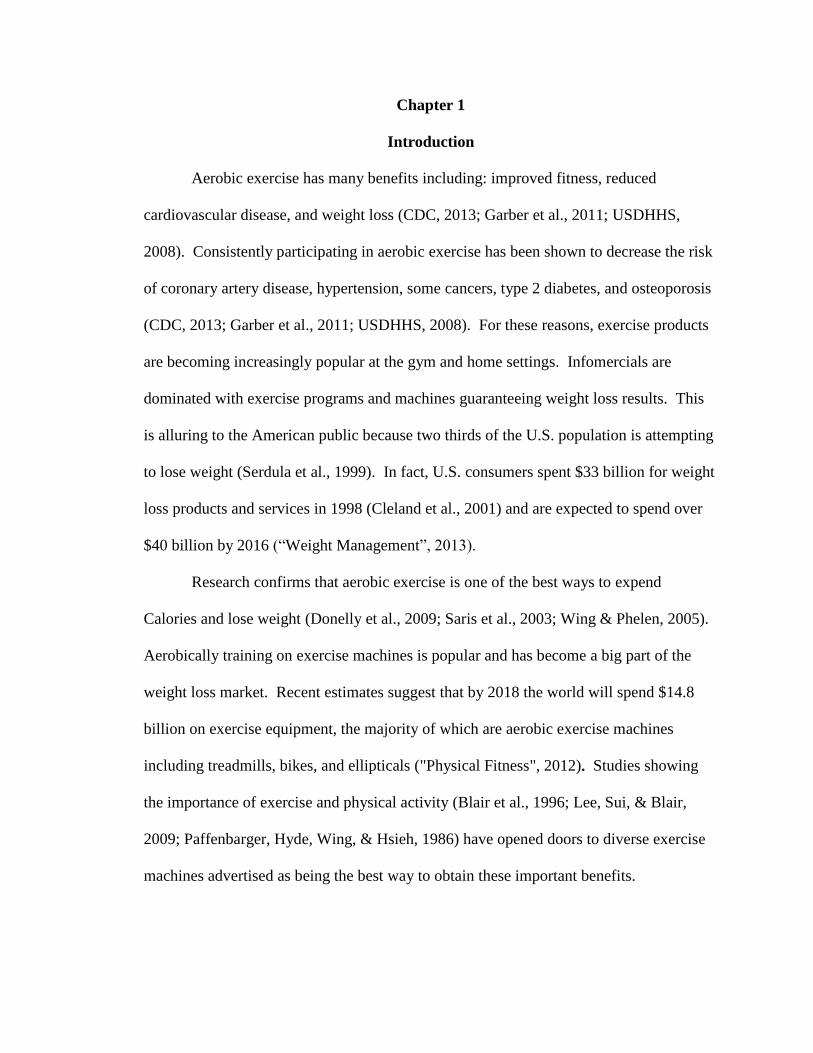
Chapter 1
Introduction
Aerobic exercise has many benefits including: improved fitness, reduced
cardiovascular disease, and weight loss (CDC, 2013; Garber et al., 2011; USDHHS,
2008). Consistently participating in aerobic exercise has been shown to decrease the risk
of coronary artery disease, hypertension, some cancers, type 2 diabetes, and osteoporosis
(CDC, 2013; Garber et al., 2011; USDHHS, 2008). For these reasons, exercise products
are becoming increasingly popular at the gym and home settings. Infomercials are
dominated with exercise programs and machines guaranteeing weight loss results. This
is alluring to the American public because two thirds of the U.S. population is attempting
to lose weight (Serdula et al., 1999). In fact, U.S. consumers spent $33 billion for weight
loss products and services in 1998 (Cleland et al., 2001) and are expected to spend over
$40 billion by 2016 (“Weight Management”, 2013).
Research confirms that aerobic exercise is one of the best ways to expend
Calories and lose weight (Donelly et al., 2009; Saris et al., 2003; Wing & Phelen, 2005).
Aerobically training on exercise machines is popular and has become a big part of the
weight loss market. Recent estimates suggest that by 2018 the world will spend $14.8
billion on exercise equipment, the majority of which are aerobic exercise machines
including treadmills, bikes, and ellipticals ("Physical Fitness", 2012). Studies showing
the importance of exercise and physical activity (Blair et al., 1996; Lee, Sui, & Blair,
2009; Paffenbarger, Hyde, Wing, & Hsieh, 1986) have opened doors to diverse exercise
machines advertised as being the best way to obtain these important benefits.

2
With the variety of aerobic exercise machines available, people are left to decide
which machine best fits their needs. Machines differ in a variety of ways including
impact forces, (Lee et al., 2008; Porcari, Foster, & Schneider, 2000) limb kinematics,
(Lee et al., 2008) difficulty, (Zeni, Hoffman, & Clifford, 1996) and Caloric expenditure
(Zeni et al., 1996). A digital display of Caloric expenditure may persuade participants to
use machines that display the most Calories expended in a given period of time. This can
be problematic because exercise machines tend to overestimate actual Caloric
expenditure, especially at lower intensity exercises like walking because of the formulas
built into the machine (Clay, 2001; Swain, 2009).
Advertising a machine that is able to burn the most Calories in the shortest time
attracts attention because the number one barrier to exercise is time (Booth, Bauman,
Owen, & Christopher, 1997; Reichert, Barros, Domingues, & Hallal, 2007; Salmon,
Owen, Crawford, Bauman, & Sallis, 2003). According to multiple surveys, the most
popular form of exercise is walking (Ham, Kruge, & Tudor-Locke, 2009; Yusuf et al.,
1996). Since time is the number one barrier to exercise, and walking is the most popular
form of exercise, it is important to find which aerobic exercise machine is able to expend
the most Calories while walking in addition to determining if walking on that machine is
significantly harder than walking on the other.
Compared to cycle ergometers, rowers, ellipticals, and stair steppers, studies show
that exercising on a treadmill requires the most energy at a given rating of perceived
exertion (RPE) (Clay, 2001; Zeni et al., 1996). As new equipment is created, the
developers regularly advertise the equipment as burning more Calories than a
conventional treadmill when speed and time are kept constant. The Curve (Woodway) is

3
one of these machines. Claiming to burn more Calories than a conventional treadmill is
important because treadmills are the most popular exercise machine ("History of
Treadmills", 2013; “Treadmills”, 2013).
The Curve is a non-motorized treadmill and is unique as a treadmill because of
the slight radius of the surface. A picture of the Curve is shown in the studies recruitment
flyer (Appendix A). There is no motor to drive the belt so users must use their own
musculature to pull the belt backwards. Due to the curved running surface, users move
towards the front of the Curve to speed up and towards the back of the Curve to slow
down. It is advertised to burn up to 30% more Calories than a conventional treadmill. At
present, it appears there has only been one study conducted that Woodway is using to
support this statement. The study cited is an unpublished poster presentation where
actual Caloric expenditure is not presented and exact methodology is not discussed
(Snyder et al., 2011). While a poster may have been peer reviewed before presentation,
the review is usually only of an abstract. This is another concern that the research has not
been peer reviewed and published. Published research has been conducted on observed
differences of non-motorized treadmills compared to motorized treadmills, but research
has focused on differences in VO2max, (Moore, Lewthwaite, Dagett, & Davies, 1984; Lee
et al., 2008) time to exhaustion, (De Witt, Lee, Wilson, & Hagan, 2009) and
biomechanical differences (Lee et al., 2008). Sound research has not been conducted
comparing the Calorie expenditure between non-motorized and motorized treadmills at a
constant submaximal walking speed.
4
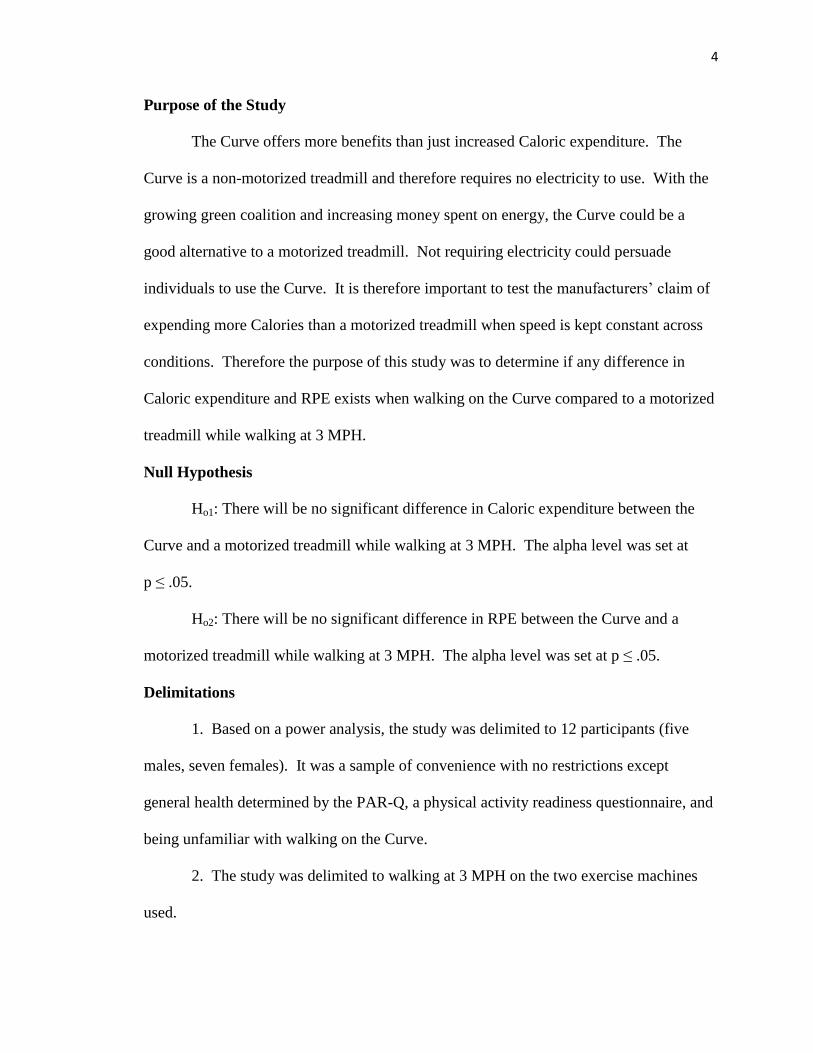
Purpose of the Study
The Curve offers more benefits than just increased Caloric expenditure. The
Curve is a non-motorized treadmill and therefore requires no electricity to use. With the
growing green coalition and increasing money spent on energy, the Curve could be a
good alternative to a motorized treadmill. Not requiring electricity could persuade
individuals to use the Curve. It is therefore important to test the manufacturers’ claim of
expending more Calories than a motorized treadmill when speed is kept constant across
conditions. Therefore the purpose of this study was to determine if any difference in
Caloric expenditure and RPE exists when walking on the Curve compared to a motorized
treadmill while walking at 3 MPH.
Null Hypothesis
Ho1: There will be no significant difference in Caloric expenditure between the
Curve and a motorized treadmill while walking at 3 MPH. The alpha level was set at
p ≤ .05.
Ho2: There will be no significant difference in RPE between the Curve and a
motorized treadmill while walking at 3 MPH. The alpha level was set at p ≤ .05.
Delimitations
1. Based on a power analysis, the study was delimited to 12 participants (five
males, seven females). It was a sample of convenience with no restrictions except
general health determined by the PAR-Q, a physical activity readiness questionnaire, and
being unfamiliar with walking on the Curve.
2. The study was delimited to walking at 3 MPH on the two exercise machines
used.

5
Assumptions
1. Participants understood the training given to use the RPE scale and answered
RPE questions honestly and to the best of their ability.
2. Participants were not aware of the advertising that someone working on the
Curve will be expending more Calories than an equivalent speed on a motorized treadmill
which could bias their reported RPE values.
3. Since the K4 was calibrated in the lab but the test was conducted in the fitness
center it is assumed the different environment in the fitness center did not impact the K4
readings.
Operational Definitions
Caloric expenditure: The volume of oxygen consumed (VO2) was measured using
the K4b2 (K4) metabolic gas analyzer (COSMED, Rome, Italy).
Rating of Perceived Exertion (RPE): The RPE scale is a psychophysiological
scale measuring the degree of effort, strain, and/or fatigue. The 6-20 scale (Borg, 1998)
was used.
Significance of the Study
With the rising variety of exercise machines, the increasing obese population, and
a lack of time to exercise, individuals are looking for a way to burn the most Calories in
the shortest amount of time. For this reason, companies advertise their products as
burning the most Calories in the shortest time. Some of the research backing these claims
is unpublished and not peer-reviewed. It was therefore beneficial to conduct an
accessible study comparing Caloric expenditure and RPE differences between the Curve
and a motorized treadmill.

6
Summary
Individuals attempting to lose weight efficiently and attempting to stay healthy
have opened up a competitive exercise and weight loss market valued at billions of
dollars. Companies are trying to tap into this market by advertising their exercise
products as burning the most Calories in the shortest time. These claims are often not
peer-reviewed, published, or accessible. The purpose of this study was determining if
any difference in Caloric expenditure and RPE existed while walking at 3 MPH between
the Curve and a motorized treadmill. In this chapter, hypotheses were declared,
delimitations presented, operational definitions listed, and assumptions stated.

Chapter 2
Review of Literature
The purpose of this study was to determine if any difference in Caloric
expenditure and RPE exists when walking on the Curve compared to a motorized
treadmill while walking at 3 MPH. This chapter addresses the evolutionary perspective
of physical activity, the rising epidemic of obesity, physical activity, physical inactivity,
the importance of Caloric balance, and Caloric expenditure through aerobic activity.
Included in this chapter is an evaluation of aerobic exercise machines and information
regarding the two specific machines utilized to complete this study.
Evolutionary Perspective of Physical Activity
From an evolutionary perspective, human movement patterns were not established
by training in a gym, but by natural selection (Cordain, Gotshall, Eaton, & Eaton, 1998).
Prior to the 20th
century, human movement patterns were heavily influenced by necessary
survival techniques (Cordain et al., 1998). These activities included hunting, gathering,
running after wounded prey, building shelters, and escaping from predators (Cordain et
al., 1998; Eaton & Eaton, 2003). In the modern affluent world, mechanization has
reduced much of the physical labor required for daily living (Cordain et al., 1998; Eaton
& Eaton, 2003). From an evolutionist’s perspective, changing behavioral factors while
maintaining the human genome has important pathophysiological implications (Eaton &
Eaton, 2003).
Evolutionary theorists, geneticists, biologists, ecologists, and anthropologists
agree that the human genome has changed minimally over the past 50,000 years (Cordain
et al., 1998; Eaton & Eaton, 2003). For nearly all human experience, energy intake and
energy expenditure have been strongly linked, but economic success and the industrial

8
revolution disrupted this link (Eaton & Eaton, 2003; Saris et al., 2003). An estimate of
ancestral humans’ Caloric expenditure through physical activity was 1000 Calories a day
(Eaton & Eaton 2003). Modern sedentary adults expend 300 Calories a day through
physical activity, which is a 700 Calorie difference in physical activity energy
expenditure. This could be one of the reasons the U.S. has an increasing number of obese
adults.
Rising Epidemic of Obesity
Uncontrolled weight gain has become a nationwide epidemic for citizens of the
U.S. The percent of obese U.S. adults has increased from 12.8% in the 1960s to 22.5% in
the 1990s (Flegal, Carroll, Kuczmarski, & Johnson, 1998). Obesity rates in U.S. adults
have continued to rise, with the Centers for Disease Control and Prevention (CDC)
reporting 35.7% of U.S. adults were obese in 2009-2010. The dramatic increase in obese
adults from the 1960s is problematic because of the associated increased risk of chronic
disease and medical costs. According to the CDC (2013), obesity-related conditions
include heart disease, stroke, type 2 diabetes and certain types of cancer, and these cost
$147 billion in medical expenses in 2008. Due to high medical costs and susceptibility to
chronic disease, being able to prevent obesity on a personal and global scale is becoming
increasingly important.
There are small genetic differences that increase the susceptibility of certain
individuals to becoming obese (Wadden & Stunkard, 2004). However, the rapid
increases in the obese population cannot be explained by biology alone. There are
environmental and behavioral factors that also contribute to obesity, including increased
9
energy intake and decreased energy expenditure (McArdle, Katch, & Kath, 2009;
Wadden & Stunkard, 2004).
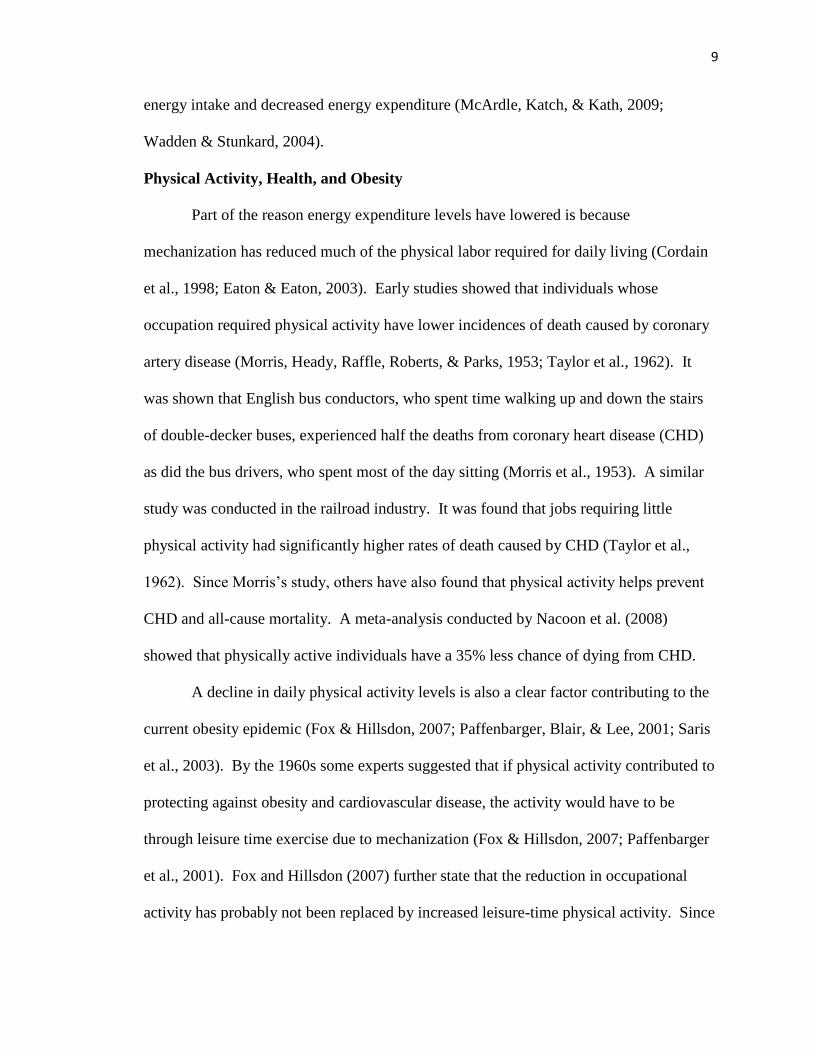
Physical Activity, Health, and Obesity
Part of the reason energy expenditure levels have lowered is because
mechanization has reduced much of the physical labor required for daily living (Cordain
et al., 1998; Eaton & Eaton, 2003). Early studies showed that individuals whose
occupation required physical activity have lower incidences of death caused by coronary
artery disease (Morris, Heady, Raffle, Roberts, & Parks, 1953; Taylor et al., 1962). It
was shown that English bus conductors, who spent time walking up and down the stairs
of double-decker buses, experienced half the deaths from coronary heart disease (CHD)
as did the bus drivers, who spent most of the day sitting (Morris et al., 1953). A similar
study was conducted in the railroad industry. It was found that jobs requiring little
physical activity had significantly higher rates of death caused by CHD (Taylor et al.,
1962). Since Morris’s study, others have also found that physical activity helps prevent
CHD and all-cause mortality. A meta-analysis conducted by Nacoon et al. (2008)
showed that physically active individuals have a 35% less chance of dying from CHD.
A decline in daily physical activity levels is also a clear factor contributing to the
current obesity epidemic (Fox & Hillsdon, 2007; Paffenbarger, Blair, & Lee, 2001; Saris
et al., 2003). By the 1960s some experts suggested that if physical activity contributed to
protecting against obesity and cardiovascular disease, the activity would have to be
through leisure time exercise due to mechanization (Fox & Hillsdon, 2007; Paffenbarger
et al., 2001). Fox and Hillsdon (2007) further state that the reduction in occupational
activity has probably not been replaced by increased leisure-time physical activity. Since

10
occupations are requiring less physical activity, it is becoming increasingly important for
adults to participate in leisure time exercise to protect against disease and prevent weight
gain (Fox & Hillsdon, 2007; Nacoon et al., 2008 Paffenbarger et al., 2001).
Physical activity guidelines. Organizations, including the American College of
Sports Medicine (ACSM), the CDC, and The American Heart Association (AHA) have
reviewed the literature and prescribed physical activity recommendations to protect
against chronic health conditions. These recommendations are meant to be purposeful
exercise, outside the activities of daily living. It was concluded that adults should
participate in at least 150 minutes a week of moderate-intensity physical activity or 75
minutes of vigorous physical activity (CDC, 2013; Garber et al., 2011; USDHHS, 2008).
This exercise can even take place in 10 minute intervals. Following these
recommendations has been shown to lessen the chance of having CHD by 20% and
protect against type 2 diabetes (CDC, 2013; Garber et al., 2011; USDHHS, 2008).
Physical Inactivity
In recent years, research on physical inactivity or sedentariness has become
distinct from physical activity (Fox & Hillson, 2007; Hamilton et al., 2008; Patel et al.,
2010). Much of the research has focused on how long people sit, including activities like
watching television, using a computer, or playing video games. These physically inactive
activities are associated with obesity, (Hamilton, Hamilton, & Zderic, 2007; Hu, Li,
Colditz, Willett & Manson, 2001; Jakes et al., 2003) metabolic syndrome, (Ford, Kohl,
Mokdad, & Aiani, 2005) and type 2 diabetes, (Hamilton et al., 2007; Hu et al., 2001) all
of which contribute to cardiovascular disease. Further research has found that increased
sitting time is associated with elevated risks of all-cause mortality, independent of

11
individuals meeting daily exercise recommendations previously mentioned (Katmarzyk,
Church, Craig, & Bouchard, 2009; Patel et al., 2010). Both studies had large sample
sizes and used questionnaires to evaluate participants’ sitting time and physical activity.
Patel (2010) found that women sitting for more than six hours a day in leisure pursuits
had a 40% higher all-cause death rate than women who sat less than three hours a day,
independent of the amount of physical activity. Katmarzyk et al. (2009) used a
qualitative measure of time spent sitting (almost none of the time, one fourth of the time,
half of the time, three fourths of the time, almost all of the time). It was found that more
sitting time was directly associated with higher all-cause death rates independent of
meeting physical activity standards.
The research on physical activity and physical inactivity indicates that for humans
to combat preventable chronic diseases like cardiovascular disease, diabetes, and obesity,
one must spend more time moving and less time sitting (Katmarzyk et al., 2009; Patel et
al., 2010). Whether that activity takes place at work or leisure time is still up to debate;
however, not increasing leisure time physical activity while sedentary time increases
creates problems for achieving caloric balance.
Caloric Balance and Exercise.
Caloric balance is achieved when Calories ingested equals Calories expended.
Exercising increases Caloric expenditure because physical movement requires energy and
therefore expends Calories (McArdle et al., 2009). The total amount of energy expended
is partially dependent on the amount of muscle mass producing bodily movements and
the intensity, duration, and frequency of muscle contractions (Caspersen, Powell, &
Christenson, 1985). Energy output from active muscles involved in sprint running or

12
swimming exceeds resting levels by 120 times (McArdle et al., 2009). The scientific
community agrees that physical activity requires energy and therefore aids in achieving
Caloric balance. The amount of exercise required to prevent weight gain or lose excess
weight is difficult to define because of differing body size and nutritional diets.
Weight Loss Exercise Recommendations
The National Weight Control Registry (NWCR) is a registry of over 3,000
individuals who have maintained a minimum 30 pound weight loss for at least one year
(“The National Weight Control Registry”, 2013). Ninety percent of the registry reports
regular exercise as a critical component in maintaining weight loss. The NWCR
members report burning 2682 Calories weekly. Saris et al. (2003) reports this as the
equivalent of walking 4 miles per day. Klem, Wing, McGuire, Seagle, and Hill (1997)
estimated that some NWCR members expend the amount of energy equivalent to walking
28 miles a week. Both of these estimates are closely related to ACSM recommendations,
which suggest that an energy expenditure of over 2000 Calories a week may be necessary
to maintain weight loss (Donnelly et al., 2009). These three weight loss maintenance
recommendations require much more energy expenditure than previously stated
recommendations for improving overall health. Since Caloric expenditure through
physical activity is important for health, and walking is one of the most popular forms of
exercise (Ham, Kruge, & Tudor-Locke, 2009; Yusuf et al., 1996) it’s important to know
if walking on one type of exercise machine differs from another.
Exercise Machines
The U.S. population’s interest in weight loss products and services is high.
Infomercials are dominated with exercise programs and machines guaranteeing weight

13
loss results. In fact, U.S. consumers spent $38 billion for weight loss products and
services in 2013 (“Weight Management”, 2013). Recent estimates show that by 2018 the
world will spend $14.8 billion on exercise equipment, the majority of which are aerobic
exercise machines including treadmills, bikes, and ellipticals ("Physical Fitness", 2012).
Many aerobic exercise machines advertise burning the most Calories in the shortest time;
therefore it would be beneficial to know if these claims are true. Studies have shown that
motorized treadmills allow for the greatest Caloric expenditure when RPE is kept
constant across conditions (Zeni et al., 1996; Clay, 2001). The machines that were
compared include cycles, rowers, stair steppers, and ellipticals. Reviewed here will be
two weight bearing exercise machines. The machines reviewed will be a motorized
treadmill and the Curve.
Treadmill description. The treadmill’s first use was not for aerobic activity. In
1875 a treadmill was created to transfer the energy of moving animals to devices such as
butter churns, spinning wheels, or water pumps ("Treadmill History", 2013). Humans
began using treadmills as a mode of aerobic exercise in the 1960s. Since that time,
treadmills have grown in popularity and sophistication. Treadmills allow users to walk,
jog, and even run at a variety of speeds they choose. As technology improved, designers
began creating treadmills able to simulate walking or running up or down hill by
manipulating incline. These improvements in technology have led to the modern
treadmill where users can now pick a predesigned workout programmed into the
machine. These designed programs increase/decrease speed and incline at specified
times throughout the exercise routine. Due to treadmills versatility and mode of Caloric

14
expenditure, they have become one of the most widely used pieces of aerobic exercise
equipment (Treadmill History”, 2013).
Non-motorized treadmill description. Motorized and non-motorized treadmills
allow participants the convenience of training aerobically on a machine while staying in
one place. Non-motorized treadmills have no motor and rely on the user’s energy to
move the belt (Lee et al., 2008). Non-motorized treadmills are usually less expensive,
more portable, and offer a variety of places to exercise because electrical power is not
needed to operate the machine (De Witt et al., 2009; "Treadmill History", 2013). The
Curve is a unique non-motorized treadmill because the running surface is not flat, but is
at a slight radius. It was originally designed for athletes to be used anaerobic interval
training. Due to total manual operation and curved design, participants are able to
instantly adjust their pace with a few explosive steps. To accelerate, the participants start
running up the incline; and to decelerate, participants allow themselves to drift back on
the machine. On a motorized treadmill the speed is controlled by the machine not the
person so if an athlete is trying to do high intensity intervals they must jump to the edges
when the interval is done because the belt is still moving. The Curve also has a digital
screen that displays an estimated Calorie expenditure. The Curve is programmed to use
the ACSM running Metabolic Equation for relative VO2 (ml/kg/min) which is converted
to absolute VO2 (l/min) and finally to Calories (1 l/min = 5 Calories). The formula is
VO2 (ml/kg/min) = .2(speed) + .9(speed) (% grade) + 3.5. The Calorie display uses this
formula for a 180 pound male running at a 6% incline. This formula could overestimate
or underestimate Calorie expenditure depending on the person’s weight.
15
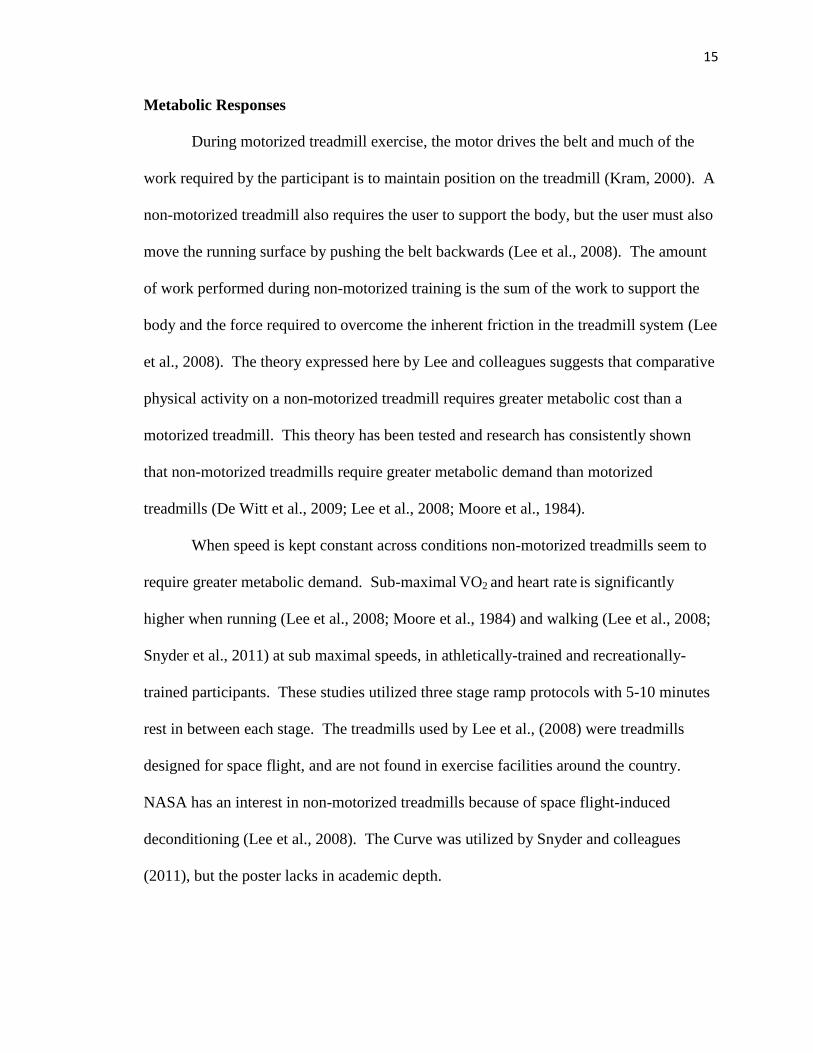
Metabolic Responses
During motorized treadmill exercise, the motor drives the belt and much of the
work required by the participant is to maintain position on the treadmill (Kram, 2000). A
non-motorized treadmill also requires the user to support the body, but the user must also
move the running surface by pushing the belt backwards (Lee et al., 2008). The amount
of work performed during non-motorized training is the sum of the work to support the
body and the force required to overcome the inherent friction in the treadmill system (Lee
et al., 2008). The theory expressed here by Lee and colleagues suggests that comparative
physical activity on a non-motorized treadmill requires greater metabolic cost than a
motorized treadmill. This theory has been tested and research has consistently shown
that non-motorized treadmills require greater metabolic demand than motorized
treadmills (De Witt et al., 2009; Lee et al., 2008; Moore et al., 1984).
When speed is kept constant across conditions non-motorized treadmills seem to
require greater metabolic demand. Sub-maximal VO2 and heart rate is significantly
higher when running (Lee et al., 2008; Moore et al., 1984) and walking (Lee et al., 2008;
Snyder et al., 2011) at sub maximal speeds, in athletically-trained and recreationally-
trained participants. These studies utilized three stage ramp protocols with 5-10 minutes
rest in between each stage. The treadmills used by Lee et al., (2008) were treadmills
designed for space flight, and are not found in exercise facilities around the country.
NASA has an interest in non-motorized treadmills because of space flight-induced
deconditioning (Lee et al., 2008). The Curve was utilized by Snyder and colleagues
(2011), but the poster lacks in academic depth.

16
Gaps and Claims
The Curve is advertised as allowing participants to expend 30% more Calories
while walking than a conventional treadmill when speed is kept constant across
conditions. This claim is backed by insufficient evidence. The study cited is an
unpublished non peer reviewed poster presentation where actual Caloric expenditure is
not presented (Snyder et al., 2011). The poster lacks in sharing exact statistical methods
used to show that the Curve expends 30% more Calories. There is also no discussion of
the methods used to accurately measure RPE. The Curve might burn 30% more Calories
but be perceived to be significantly more difficult. Published research has been
conducted on observed differences of non-motorized treadmills compared to motorized
treadmills, but research has focused on differences in VO2max (Moore et al., 1984; Lee et
al., 2008) time to exhaustion (De Witt et al., 2009) biomechanical differences, (Lee et al.,
2008) and did not utilize the Curve. Sound research has not been conducted comparing
Caloric expenditure at submaximal walking speeds between the Curve and a motorized
treadmill.
Summary
From an evolutionist’s perspective, changing behavioral factors while maintaining
the human genome has important pathophysiological implications, including unhealthy
weight gain. The rising epidemic of obesity is caused by many factors, two of them
being increased Caloric intake and decreased Caloric expenditure. It is currently believed
by the scientific community that increasing physical activity increases metabolic cost and
promotes health. Aerobic exercise machines are becoming increasingly popular and
specific machines are advertised as burning the most Calories in the shortest amount of

17
time. Some of the research to back these claims is inaccessible or not explained
thoroughly. It was therefore beneficial to conduct a study comparing which type of
treadmill burns the most calories, and which required the greatest perceived exertion.
This chapter reviewed the current literature on physical activity, energy expenditure, and
comparisons between motorized and non-motorized treadmills.

Chapter 3
Methods
Introduction
The purpose of this study was to determine if any difference in Caloric
expenditure and RPE exists when walking at 3 MPH on the Curve compared to a
motorized treadmill. This chapter includes a description of the methods that were utilized
to complete the study, which includes the selection of participants, equipment,
procedures, data collection, and statistical design.
Participants
A power analysis using G-Power (Faul, Erdfelder, Land, & Buchner, 2007)
demonstrated at least 10 participants were needed to be able to reject the null hypothesis
with an alpha level of p ≤ .05. Effect size was calculated using means and standard
deviations from previous studies comparing energy expenditure between motorized and
non-motorized treadmills (Lee et al., 2008; Snyder et al., 2011). Once effect size was
calculated, effect size (.91), alpha (.05), and power (.8) were entered into G-Power to
produce 10 participants. Twelve participants volunteered for the current study.
Individuals were at least 18 years old who were free of health problems determined by
the PAR-Q (Appendix B). Participants were recreationally active and unfamiliar with
walking on the Curve.
Equipment
The equipment used in this study included: the Curve (WOODWAY USA,
Waukesha, WI), and a T7xe Treadmill (Matrix, Cottage Grove, WI). Caloric expenditure
was determined and read from the K4b2 (K4) metabolic gas

19
analyzer (COSMED, Rome, Italy). The K4 measured oxygen consumption on a breath-
by-breath basis and determined the volume of oxygen consumed per minute. It then
converts liters of oxygen consumed into Calories. The ACSM formula states that one
liter of consumed oxygen equals five Calories (ACSM, 2012). RPE was measured using
the Borg 6-20 Rating of Perceived Exertion scale (Appendix C) (Borg, 1998). Heart rate
was measured using a Polar heart rate monitor (Polar, Lake Success, NY).
Procedures
Prior to data collection, the Institutional Review Board for Human Subjects at
Eastern Washington University approved the research. Once approval was granted,
recruiting flyers (Appendix A) were placed in the University Recreation Center on
campus. Once at least 10 people at least 18 years of age volunteered, a group meeting
was held to describe the study. Each volunteer completed the PAR-Q. If they answered
no to all questions, informed consent forms were distributed (Appendix D). After the
explanation, questions were answered and each candidate was given at least 48 hours to
decide whether they wanted to participate in the study. Once participants turned in an
informed consent a familiarization and two data collection sessions were scheduled. The
sessions were 24-48 hours apart and during the same time of day.
During the familiarization session, participants practiced maintaining 3 MPH on
the Curve, shown the K4, and given the standard instructions (Appendix B) in the use of
the 6-20 Borg RPE scale (Borg, 1998). Maintaining correct speed was defined as staying
within 2.8 and 3.2 MPH. Demonstration of the K4 equipment shown and explained to
the participants included fitting the mask and showing how the analyzer is carried on the
participants’ chest with straps. Since a mask was placed on all participants, instructions
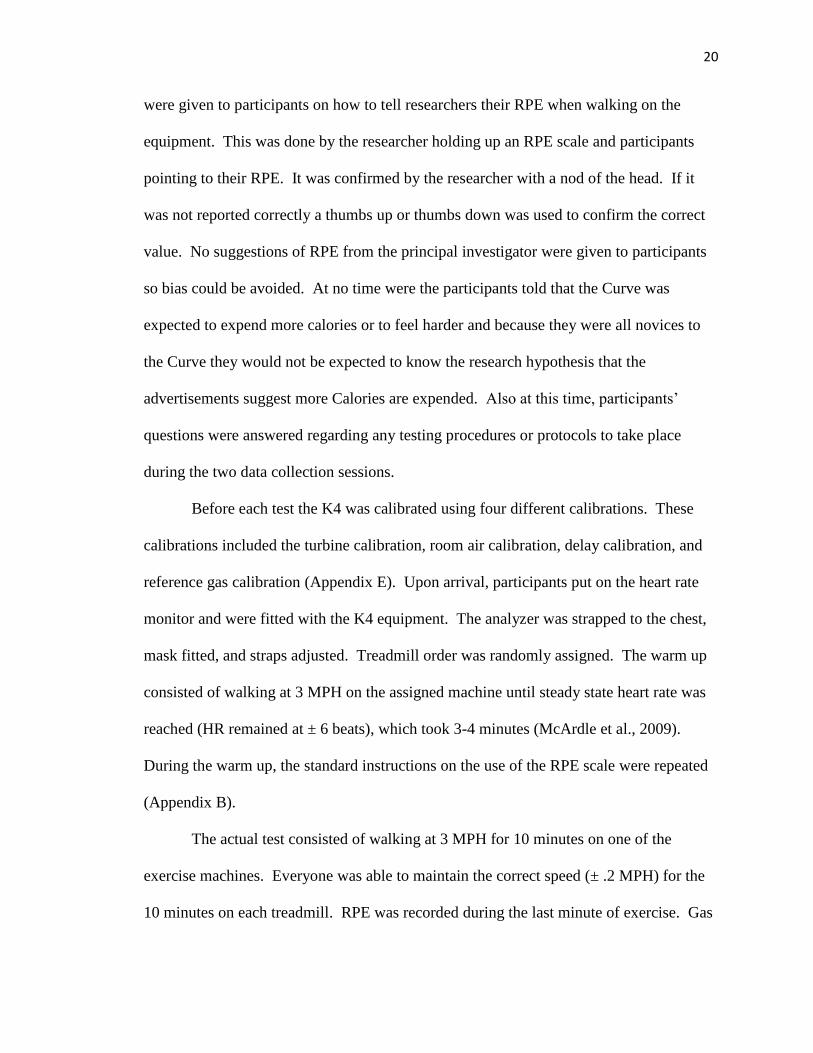
20
were given to participants on how to tell researchers their RPE when walking on the
equipment. This was done by the researcher holding up an RPE scale and participants
pointing to their RPE. It was confirmed by the researcher with a nod of the head. If it
was not reported correctly a thumbs up or thumbs down was used to confirm the correct
value. No suggestions of RPE from the principal investigator were given to participants
so bias could be avoided. At no time were the participants told that the Curve was
expected to expend more calories or to feel harder and because they were all novices to
the Curve they would not be expected to know the research hypothesis that the
advertisements suggest more Calories are expended. Also at this time, participants’
questions were answered regarding any testing procedures or protocols to take place
during the two data collection sessions.
Before each test the K4 was calibrated using four different calibrations. These
calibrations included the turbine calibration, room air calibration, delay calibration, and
reference gas calibration (Appendix E). Upon arrival, participants put on the heart rate
monitor and were fitted with the K4 equipment. The analyzer was strapped to the chest,
mask fitted, and straps adjusted. Treadmill order was randomly assigned. The warm up
consisted of walking at 3 MPH on the assigned machine until steady state heart rate was
reached (HR remained at ± 6 beats), which took 3-4 minutes (McArdle et al., 2009).
During the warm up, the standard instructions on the use of the RPE scale were repeated
(Appendix B).
The actual test consisted of walking at 3 MPH for 10 minutes on one of the
exercise machines. Everyone was able to maintain the correct speed (± .2 MPH) for the
10 minutes on each treadmill. RPE was recorded during the last minute of exercise. Gas

21
exchange was measured on a breath-by-breath basis by the K4. Once the tests were
completed, the K4 was returned to the lab and the data downloaded. Data collection was
continuous including the warm up, so the warm up Calories expended were subtracted
from the total expenditure over the 10 minutes test. Total Calorie expenditure was then
recorded for each participant’s 10 minute exercise bout. Relative VO2 (ml/kg/min) and
heart rate were also collected by the K4. Heart rate and relative VO2 data were also
recorded to assure the work was at steady state for the 10 minutes. This testing protocol
was then repeated for the other exercise machine on the next scheduled testing day.
Statistical Analysis
Data were entered into Microsoft Excel and transferred into SPSS version 21.0 for
analysis. Descriptive statistics were determined on the dependent variables, heart rate,
and relative VO2. To determine whether there was a significant difference in Calorie
expenditure and RPE while walking under the two conditions, two paired samples t-tests
were performed. The Alpha level was set at p ≤.05.
Summary
This chapter included a description of the methods used to complete this study.
Included in this chapter was the selection of participants, equipment utilized, procedures,
and statistical design.

Chapter 4
Results
Introduction
The purpose of this study was to determine if any difference in Caloric
expenditure and RPE exists when walking at 3 MPH on the Curve compared to a
motorized treadmill. This chapter includes the physical characteristics of participants,
statistical analysis of Calorie expenditure differences, and statistical analysis of RPE
differences.
Participants
All participants were students attending Eastern Washington University. Table 1
provides information regarding the mean and standard deviations for all physical
characteristics of the 12 volunteers (five males, seven females) participating in the study.
Weight ranged from 54-107kg, age ranged from 19-26 years, and height ranged from
163-188cm.
Table 1
Participant Physical Characteristics
n Weight
(kg)
Age
(years)
Height
(cm)
Mean SD Mean SD Mean SD
12 76.96 16.19 22.58 2.31 172.72 8.94
Data Analysis
Descriptive statistics were determined on both dependent variables, heart rate, and
relative VO2 for each exercise modality and are reported in Table 2. To evaluate

23
normality of data, the Shapiro-Wilk test was used in conjunction with an evaluation of
skewness and kurtosis. All data was determined to be normally distributed (p > .05) for
skewness and kurtosis with no values exceeding + 1.97. These values were determined
by dividing the statistic by the standard error. The Shapiro-Wilk test showed all data was
normally distributed (p > .05). The mean Calorie expenditure of participants walking on
the Curve was 44% more than the treadmill. The Curve is advertised as burning up to
30% more Calories than a motorized treadmill (Snyder et al., 2011). The mean heart rate
of participants walking on the Curve was 22% more beats per minute than while walking
on the motorized treadmill. The relative VO2 (ml/kg/min) of participants walking on the
Curve was 41% more than when walking on the motorized treadmill.
Table 2
Descriptive Statistics
Variable Curve Treadmill
Mean SD Mean SD
Calorie Expenditure
For 10 Minutes 77.80 9.37 54.01 9.04
RPE 10.33 1.44 8.92 .90
Heart Rate
(beats per minute) 123.95 11.43 101.33 8.82
VO2 (ml/kg/min) 20.34 3.56 14.41 2.69
Parametric Statistics
Two separate paired samples t-tests were used to determine if there were
significant differences in Calorie expenditure and RPE between the two conditions.
When comparing Calorie expenditure between walking on the Curve and treadmill, the

24
paired samples t-test showed that the null hypothesis was rejected (t =17.73, p < .0001).
When comparing RPE between walking on the Curve and treadmill, the paired samples
t-test showed that the null hypothesis was also rejected (t = 5.45, p = .0002). The results
of this study suggest that walking on the Curve at 3 MPH expends significantly more
Calories and is perceived to be significantly more difficult than walking on a motorized
treadmill.
Summary
This chapter included the physical characteristic of participants, a statistical
analysis of Calorie expenditure differences, and a statistical analysis of RPE differences
in participants initially unfamiliar with the Curve.

Chapter 5
Discussion
Introduction
The purpose of this study was to determine if any difference in Caloric
expenditure and RPE exists when walking on the Curve compared to a motorized
treadmill while walking at 3 MPH. This chapter provides a summary of the procedures
used in the study, a discussion of the results, their comparisons to other studies, and
recommendations for future research.
Overview
Previous research has shown, and Woodway advertises the Curve as expending
30% more Calories than a treadmill when speed is kept constant (Synder et al., 2011).
The two hypotheses for this study were (a) there would be no significant difference in
Calorie expenditure between the Curve and a motorized treadmill while walking at 3
MPH, and (b) there would be no significant difference in RPE between the Curve and a
motorized treadmill while walking at 3 MPH. Both of the null hypotheses were rejected.
Participants were volunteers from Eastern Washington University between the
ages of 19-26 and screened for health problems by the use of the PAR-Q. Volunteers
were only able to participate in the study if they answered no to all questions and were
unfamiliar with walking on the Curve. Prior to any data collection, participants engaged
in a familiarization session in which they were made familiar with the equipment used in
the study and the procedures to be carried out. During data collection sessions,
participants walked at 3 MPH for 10 minutes and Calorie expenditure was collected on a
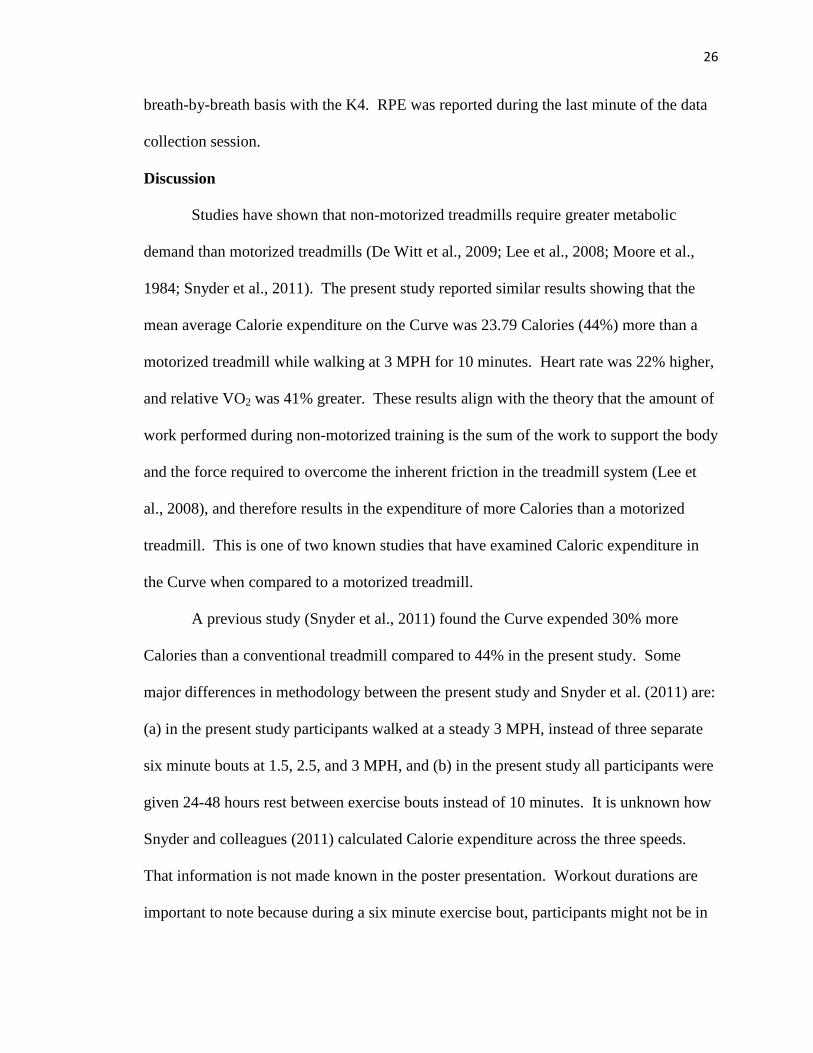
26
breath-by-breath basis with the K4. RPE was reported during the last minute of the data
collection session.
Discussion
Studies have shown that non-motorized treadmills require greater metabolic
demand than motorized treadmills (De Witt et al., 2009; Lee et al., 2008; Moore et al.,
1984; Snyder et al., 2011). The present study reported similar results showing that the
mean average Calorie expenditure on the Curve was 23.79 Calories (44%) more than a
motorized treadmill while walking at 3 MPH for 10 minutes. Heart rate was 22% higher,
and relative VO2 was 41% greater. These results align with the theory that the amount of
work performed during non-motorized training is the sum of the work to support the body
and the force required to overcome the inherent friction in the treadmill system (Lee et
al., 2008), and therefore results in the expenditure of more Calories than a motorized
treadmill. This is one of two known studies that have examined Caloric expenditure in
the Curve when compared to a motorized treadmill.
A previous study (Snyder et al., 2011) found the Curve expended 30% more
Calories than a conventional treadmill compared to 44% in the present study. Some
major differences in methodology between the present study and Snyder et al. (2011) are:
(a) in the present study participants walked at a steady 3 MPH, instead of three separate
six minute bouts at 1.5, 2.5, and 3 MPH, and (b) in the present study all participants were
given 24-48 hours rest between exercise bouts instead of 10 minutes. It is unknown how
Snyder and colleagues (2011) calculated Calorie expenditure across the three speeds.
That information is not made known in the poster presentation. Workout durations are
important to note because during a six minute exercise bout, participants might not be in

27
steady state exercise for very long. It is unclear whether participants in the Snyder et al.,
(2011) study were at steady state exercise for 6 minutes because warm up procedures are
not discussed in the poster presentation. Research has shown that reaching steady state
exercise can take longer than four minutes when exercise intensity is great enough
(McArdle et al., 2009). In the present study all participants were able to maintain steady
state on both treadmills for the entire 10 minutes. Snyder et al., mentions that exercise
speed was too great for some participants to walk at 3.5 MPH and had to resort to
jogging. Having all exercise bouts on the same day could have also affected Calorie
expenditure because of fatigue (McArdle et al., 2009).
One other condition that could have caused differing results in the present study
when compared to Snyder et al., (2011) is the familiarity participants had with the
exercise machines. In the present study, participants were required to be novices with the
Curve and only had one familiarization session on it. It is unclear what type of
familiarity Snyder and colleague’s (2011) participants had on the Curve. It was just
stated that all participants had experience on both the Curve and the motorized treadmill.
Studies have indicated that being unfamiliar with an exercise machine’s movement
pattern could increase the amount of Calories needed to repeatedly complete that motion
compared to familiarity with a machines movement pattern (“How Many Calorie”, 1999).
If participants in the present study were less familiar with the Curve than participants in
Snyder and colleagues work, it could account for the greater Calorie expenditure that was
observed.
The 6-20 Borg Rating of Perceived Exertion Scale was used in the present study
to measure RPE. In this study participants reported a mean average RPE of 1.44 units
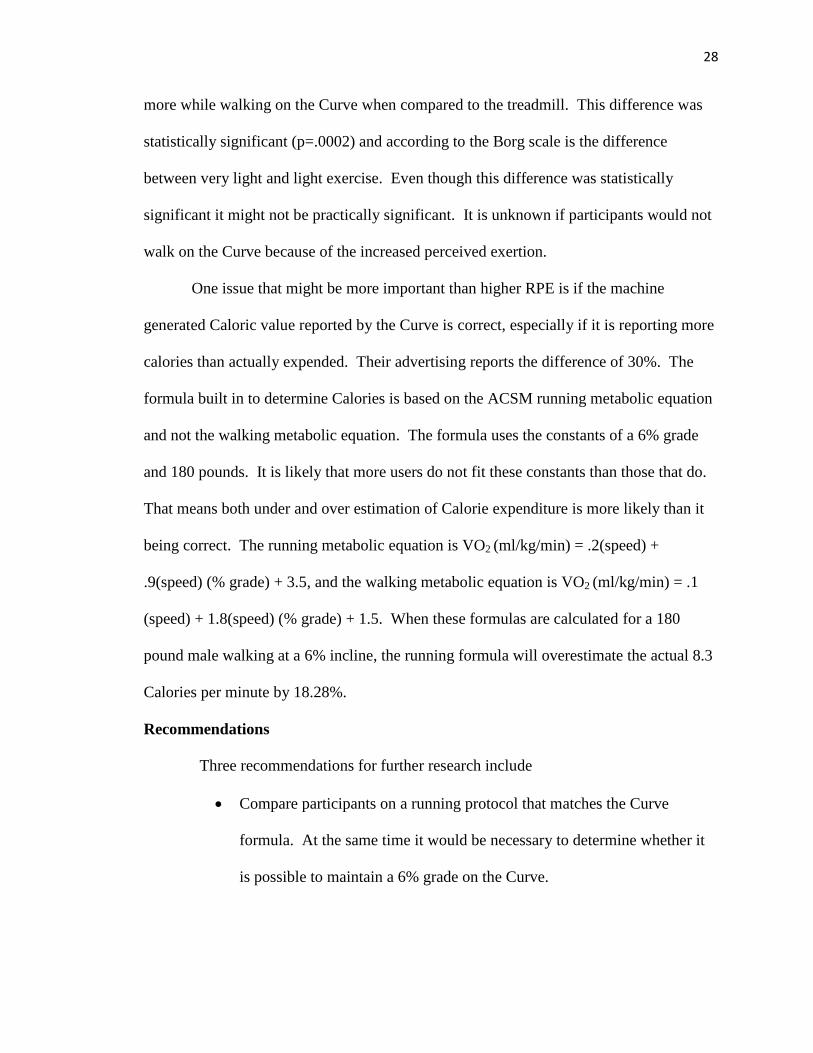
28
more while walking on the Curve when compared to the treadmill. This difference was
statistically significant (p=.0002) and according to the Borg scale is the difference
between very light and light exercise. Even though this difference was statistically
significant it might not be practically significant. It is unknown if participants would not
walk on the Curve because of the increased perceived exertion.
One issue that might be more important than higher RPE is if the machine
generated Caloric value reported by the Curve is correct, especially if it is reporting more
calories than actually expended. Their advertising reports the difference of 30%. The
formula built in to determine Calories is based on the ACSM running metabolic equation
and not the walking metabolic equation. The formula uses the constants of a 6% grade
and 180 pounds. It is likely that more users do not fit these constants than those that do.
That means both under and over estimation of Calorie expenditure is more likely than it
being correct. The running metabolic equation is VO2 (ml/kg/min) = .2(speed) +
.9(speed) (% grade) + 3.5, and the walking metabolic equation is VO2 (ml/kg/min) = .1
(speed) + 1.8(speed) (% grade) + 1.5. When these formulas are calculated for a 180
pound male walking at a 6% incline, the running formula will overestimate the actual 8.3
Calories per minute by 18.28%.
Recommendations
Three recommendations for further research include
Compare participants on a running protocol that matches the Curve
formula. At the same time it would be necessary to determine whether it
is possible to maintain a 6% grade on the Curve.

29
Compare experienced and inexperienced Curve participants and/or a
training study to determine whether experience and familiarity decreases
the metabolic cost and RPE.
The last recommendation would be to have better control of the
environment being used in the study. Since the study took place in a
public fitness center, the environment was different with each testing
procedure. This included different music, television shows, patrons, and
distractions, which could have stressed participants differently. Forsman
and Linbald (1983) showed that mental stress can raise heart rate by 12.4
beats per minute and systolic blood pressure by 11.8mm Hg, both of
which can affect energy expenditure (McArdle et al., 2009).
Overall Contribution and Summary
The present findings agree with previous studies that non-motorized treadmill
exercise requires greater metabolic demand than motorized exercise at sub-maximal
levels (De Witt et al., 2009; Lee et al., 2008; Moore et al., 1984). Some variables
measured in these studies included heart rate, VO2, and RPE. The present study also
agrees with Snyder and colleagues (2011) that the Curve requires greater metabolic
demand than a motorized treadmill. The present study focused on Calorie expenditure,
which is important to the U.S. population because two thirds of the U.S. population is
attempting to lose weight. The finding that the Curve expended 44% more Calories than
a motorized treadmill can help people decide which exercise machine to use. The Curve
can be a useful tool for people short on time who are trying to meet physical activity
recommendations to lessen the chance of having CHD and type 2 diabetes (CDC, 2013;

30
Garber et al., 2011; USDHHS, 2008), or trying to follow weight loss recommendations
by expending 2000 Calories a week (Donelly et al., 2009; Klem et al., 1997). This
chapter included an overview of the study, a discussion drawn from the results,
recommendations for future research, and the overall contribution of the study.

31
References
Blair, S. N., Kampert, J. B., Kohl, H. W., Barlow, C. E., Macera, C. A., Paffenbarger, R.
S., & Gibbons, L. W. (1996). Influences of cardiorespiratory fitness and other
precursors on cardiovascular disease and all-cause mortality in men and women.
JAMA the Journal of the American Medical Association, 276(3), 205-210.
Booth, M. L., Bauman, A., Owen, N., & Gore, C. J. (1997). Physical activity preferences,
preferred sources of assistance, and perceived barriers to increased activity among
physically inactive Australians. Preventive Medicine, 26(1), 131-137.
Borg, G. (1998). Borg’s Perceived Exertion and Pain Scales. Champaign, IL: Human
Kinetics.
Caspersen, C. J., Powell, K. E., & Christenson, G. M. (1985). Physical activity, exercise,
and physical fitness: Definitions and distinctions for health-related research. Public
Health Reports, 100(2), 126.
Centers for Disease Control and Prevention. (2013). Physical Activity. Retrieved from
http://www.cdc.gov/physicalactivity
Clay, D. E. (2000). Comparing kilocalorie expenditure between a stair-stepper, a
treadmill, and an elliptical trainer. Eastern Washington University, WA.
Cleland, R., Graybill, D. C., Hubbard, V., Khan, L. K., Stern, J. S., Wadden, T. A.,
Daynard, M. (2001). Commercial weight loss products and programs: What
consumers stand to gain and lose? A public conference on the information
consumers need to evaluate weight loss products and programs. Critical Reviews in
Food Science and Nutrition, 41(1), 45-70.

32
Cordain, L., Gotshall, R., Boyd Eaton, S., & Boyd Eaton, S. (1998). Physical activity,
energy expenditure and fitness: An evolutionary perspective. International Journal
of Sports Medicine, 19, 328-335.
Dewitt, J. K., Lee, S. M., Wilson, C. A., & Hagan, R. D. (2009). Determinants of time to
fatigue during nonmotorized treadmill exercise. Journal of Strength & Conditioning
Research, 23(3), 883-890.
Donnelly, J. E., Blair, S. N., Jakicic, J. M., Manore, M. M., Rankin, J. W., & Smith, B. K.
(2009). American College of Sports Medicine position stand. Appropriate physical
activity intervention strategies for weight loss and prevention of weight regain for
adults. Medicine & Science in Sports & Exercise, 41(2), 459-471.
Eaton, S. B., & Eaton, S. B. (2003). An evolutionary perspective on human physical
activity: Implications for health. Comparative Biochemistry and Physiology-Part A:
Molecular & Integrative Physiology, 136(1), 153-159.
Faul, F., Erdfelder, E., Lang, A., & Buchner, A. (2007). G* power 3: A flexible statistical
power analysis program for the social, behavioral, and biomedical sciences.
Behavior Research Methods, 39(2), 175-191.
Flegal, K. M., Carroll, M. D., Kuczmarski, R. J., & Johnson, C. L. (1998). Overweight
and obesity in the United States: Prevalence and trends, 1960-1994. International
Journal of Obesity and Related Metabolic Disorders, 22(1), 39.
Ford, E. S., Kohl, H. W., Mokdad, A. H., & Ajani, U. A. (2005). Sedentary behavior,
physical activity, and the metabolic syndrome among US adults. Obesity Research,
13(3), 608-614.

33
Forsman, L., & Lindblad, L. E. (1983). Effect of mental stress on baroreceptor-mediated
changes in blood pressure and heart rate and on plasma catecholamines and
subjective responses in healthy men and women. Psychosomatic Medicine, 45(5),
435-445.
Fox, K. R., & Hillsdon, M. (2007). Physical activity and obesity. Obesity Reviews, 8(s1),
115-121.
Garber, C., Blissmer, B., Deschenes, M., Franklin, B., Lamonte, M., Lee, I., Swain, D.
(2011). American College of Sports Medicine position stand. quantity and quality of
exercise for developing and maintaining cardiorespiratory, musculoskeletal, and
neuromotor fitness in apparently healthy adults: Guidance for prescribing exercise.
Medicine & Science in Sports & Exercise, 43(7), 1334.
Ham, S. A., Kruger, J., & Tudor-Locke, C. (2009). Participation by US adults in sports,
exercise, and recreational physical activities. Journal of Physical Activity & Health,
6(1), 6-14.
Hamilton, M. T., Healy, G. N., Dunstan, D. W., Zderic, T. W., & Owen, N. (2008). Too
little exercise and too much sitting: Inactivity physiology and the need for new
recommendations on sedentary behavior. Current Cardiovascular Risk Reports, 2(4),
292-298.
History of treadmills. (2013). Retrieved from
http://www.indepthinfo.com/treadmills/history-of-treadmills.php
How many calories did you burn? (1999). Tufts University Health & Nutrition Letter,
17(3), 1.

34
Hu, F. B., Li, T. Y., Colditz, G. A., Willett, W. C., & Manson, J. E. (2003). Television
watching and other sedentary behaviors in relation to risk of obesity and type 2
diabetes mellitus in women. JAMA the Journal of the American Medical Association,
289(14), 1785-1791.
Jakes, R., Day, N., Khaw, K., Luben, R., Oakes, S., Welch, A., Wareham, N. (2003).
Television viewing and low participation in vigorous recreation are independently
associated with obesity and markers of cardiovascular disease risk: EPIC-Norfolk
population-based study. European Journal of Clinical Nutrition, 57(9), 1089-1096.
Katzmarzyk, P. T., Church, T. S., Craig, C. L., & Bouchard, C. (2009). Sitting time and
mortality from all causes, cardiovascular disease, and cancer. Medicine & Science in
Sports & Exercise, 41(5), 998-1005.
Klem, M. L., Wing, R. R., McGuire, M. T., Seagle, H. M., & Hill, J. O. (1997). A
descriptive study of individuals successful at long-term maintenance of substantial
weight loss. The American Journal of Clinical Nutrition, 66(2), 239-246.
Kram, R. (2000). Muscular force or work: What determines the metabolic energy cost of
running? Exercise & Sport Sciences Reviews, 28(3), 138-143
Lee, S., DeWitt, J. K., Smith, C., Laughlin, M. S., Loehr, J. A., Norcross, J., & Hagan, R.
D. (2008). Physiologic responses and biomechanical aspects of motorized and
nonmotorized treadmill exercise: A ground-based evaluation of treadmills for use on
the International Space Station. NASA Technical Paper, NASA/TP2006213734.
Washington, DC, National Aeronautics and Space administration.

35
Lee, D. C. (2009). Does physical activity ameliorate the health hazards of obesity?
British Journal of Sports Medicine, 43(1), 49-51.
McArdle, W. D., Katch, F. I., & Katch, V. L. (2009). Exercise Physiology: Nutrition,
Energy, and Human Performance Lippincott Williams & Wilkins.
Moore, M., Lewthwaite, J., Daggett, A., & Davies, B. (1984). Metabolic responses to
running on the motorized and nonmotorized treadmills (les reponses metaboliques a
la course sur tapis roulant motorise et non motorise). Journal of Sports Sciences,
2(3), 206-207
Morris, J. N., Kagan, A., Pattison, D. C., Gardner, M. J., & Raffle, P. A. B. (1966).
Incidence and prediction of ischaemic heart-disease in London busmen. The
Lancet, 288(7463), 553-559..
Nocon, M., Hiemann, T., Müller-Riemenschneider, F., Thalau, F., Roll, S., & Willich, S.
N. (2008). Association of physical activity with all-cause and cardiovascular
mortality: A systematic review and meta-analysis. European Journal of
Cardiovascular Prevention & Rehabilitation, 15(3), 239-246.
Paffenbarger Jr, R. S., Hyde, R., Wing, A. L., & Hsieh, C. (1986). Physical activity, all-
cause mortality, and longevity of college alumni. New England Journal of Medicine,
314(10), 605-613.
Paffenbarger, R. S., Blair, S. N., & Lee, I. (2001). A history of physical activity,
cardiovascular health and longevity: The scientific contributions of Jeremy N.
Morris. International Journal of Epidemiology, 30(5), 1184-1192.

36
Patel, A. V., Bernstein, L., Deka, A., Feigelson, H. S., Campbell, P. T., Gapstur, S. M.,
Thun, M. J. (2010). Leisure time spent sitting in relation to total mortality in a
prospective cohort of US adults. American Journal of Epidemiology, 172(4), 419-
429.
Physical fitness equipment: a global strategic business report. (2012, November).
Retrieved from http://www.companiesandmarkets.com/Market/Leisure/Market-
Research/Physical-Fitness-Equipment-A-Global-Strategic-Business-
Report/RPT610320
Porcari, J., Foster, C., & Schneider, P. (2000). Exercise response to elliptical trainers
New research shows effectiveness of elliptical-motion trainers. Fitness Management,
50-53.
Reichert, F. F., Barros, A. J., Domingues, M. R., & Hallal, P. C. (2007). The role of
perceived personal barriers to engagement in leisure-time physical activity.
American Journal of Public Health, 97(3), 515.
Salmon, J., Owen, N., Crawford, D., Bauman, A., & Sallis, J. F. (2003). Physical activity
and sedentary behavior: A population-based study of barriers, enjoyment, and
preference. Health Psychology, 22(2), 178-188. doi:10.1037/0278-6133.22.2.178
Saris, W. H. M., Blair, S. N., van Baak, M. A., Eaton, S. B., Davies, P. S. W., Di Pietro,
L., Wyatt, H. (2003). How much physical activity is enough to prevent unhealthy
weight gain? Outcome of the IASO 1st stock conference and consensus statement.
Obesity Reviews, 4(2)

37
Serdula, M. K., Mokdad, A. H., Williamson, D. F., Galuska, D. A., Mendlein, J. M., &
Heath, G. W. (1999). Prevalence of attempting weight loss and strategies for
controlling weight. JAMA the Journal of the American Medical Association, 282(14),
1353-1358.
Snyder, A., Myatt, C., Weiland, N., & Bednarek, J. (2011). Energy expenditure while
walking on a non-motorized treadmill. The Journal of Strength & Conditioning
Research, 25, S109.
Swain, D. P. (2009). Assessing the advertised claims. ACSM's Health & Fitness Journal,
13(5), 8-11.
Taylor, H. L., Klepetar, E., Keys, A., Parlin, W., Blackburn, H., & Puchner, T. (1962).
Death rates among physically active and sedentary employees of the railroad
industry. American Journal of Public Health and the Nations Health, 52(10), 1697-
1707.
The National Weight Control Registry. (2013). Retrieved from
http://www.nwcr.ws/Research/default.htm
Treadmills. (2013). Consumer Reports. Retrieved from
http://www.consumerreports.org/cro/treadmills.htm
United States Department of Health and Human Services. (2008). 2008 Physical Activity
Guidelines for Americans. Be active, healthy, and happy. US Government Printing
Office. 21-28
Wadden, T. A., & Stunkard, A. J. (Eds.). (2004). Handbook of Obesity Treatment.
Guilford Press.

38
Weight management market will top $40 Billion by 2016. (2013). Retrieved from
http://www.packagedfacts.com/about/release.asp?id=3158
Wing, R. R., & Phelan, S. (2005). Long-term weight loss maintenance. The American
Journal of Clinical Nutrition, 82(1), 222S-225S.
Yusuf, H. R., Croft, J. B., Giles, W. H., Anda, R. F., Casper, M. L., Caspersen, C. J., &
Jones, D. A. (1996). Leisure-time physical activity among older adults: United States,
1990. Archives of Internal Medicine, 156(12), 1321.
Zeni, A. I., Hoffman, M. D., & Clifford, P. S. (1995). Energy expenditure with indoor
exercise machines. JAMA the Journal of the American Medical Association, 275(18),
1424

39
Appendix A: Recruitment Flyer

40
Appendix B: Par-Q

41
Appendix C: Borg 6-20 Scale and Instructions

42
Borg's RPE Scale Instructions
While exercising we want you to rate your perception of exertion, i.e., how
heavy and strenuous the exercise feels to you. The perception of exertion
depends mainly on the strain and fatigue in your muscles and on your
feeling of breathlessness or aches in the chest.
Look at this rating scale; we want you to use this scale from 6 to 20,
where 6 means ''no exertion at air' and 20 means "maximal exertion."
9 corresponds to "very light" exercise. For a normal, healthy
person it is like walking slowly at his or her own pace for some
minutes.
13 on the scale is "somewhat hard" exercise, but it still feels OK to
continue.
17 "very hard" is very strenuous. A healthy person can still go on,
but he or she really has to push him- or herself. It feels very
heavy, and the person is very tired.
19 on the scale is an extremely strenuous exercise level. For most
people this is the most strenuous exercise they have ever
experienced.
Try to appraise your feeling of exertion as honestly as possible, without
thinking about what the actual physical load is. Don't underestimate it, but
don't overestimate it either. It's your own feeling of effort and exertion
that's important, not how it compares to other people's. What other people
think is not important either. Look at the scale and the expressions and then
give a number. Any questions?

43
Appendix D: Informed Consent

44

45
Appendix E: Calibration

46

47
48
VITA
Author: Nicholas B. Robertson
Place of Birth: Columbia, South Carolina
Undergraduate Schools Attended: Brigham Young University-Idaho
Degrees Awarded: Bachelor of Science, 2012, Brigham Young University-Idaho
Honors and Awards: Graduate Assistantship, Physical Education Health and Recreation
Department, 2012-2014