ComparativeAnalysis of TVET Sector in Pakistanskillingpakistan.org/files/1/Comparative Analysis of...
60
ComparativeAnalysis of TVET Sector in Pakistan Published by
Transcript of ComparativeAnalysis of TVET Sector in Pakistanskillingpakistan.org/files/1/Comparative Analysis of...

ComparativeAnalysis ofTVET Sector in Pakistan
Published by

National Vocational & Technical Training Commission (NAVTTC)5th Floor, Evacuee Trust ComplexSector F-5/1, IslamabadTel: +92 51 904404Fax: +92 51 904404Email: [email protected]
Author:Sayed Asghar Shah, Data Analyst, NSIS Cell, TVET Reform Support Programme Mansoor Zaib Khan, Labour Market Analyst, NSIS Cell, TVET Reform Support Programme
Layout and Design:Niaz Muhammad, Graphic Designer, TVET Reform Support Programme
Printed by:
February, 2017
This document has been produced with the technical assistance of TVET Reform Support Programme, which is funded by the European Union, the Embassy of the Kingdom of the Netherlands, Federal Republic of Germany and the Royal Norwegian Embassy. The Programme has been commissioned by the German Federal Ministry for Economic Cooperation and Development (BMZ) and is being implemented by the Deutsche Gesellschaft für Internationale Zusammenarbeit (GIZ) GmbH in close collaboration with National Vocational and Technical Training Commission as well as provincial technical and vocational training authorities and private sector organizations. The views expressed in this publication are those of author and do not necessarily representative of the position of the GIZ and NAVTTC.

Comparative Analysis of TVET Sector in Pakistan

TABLE OF COnTEnTs
Acronyms used
Executive Director Message 4
Executive Summary 5
Introduction 7
Background 15
General Information & Basic facilities 18
Enrollment & Analysis 29
Conclusion & Recommendations 37
Annex 1: Statistical Tables 38
Annex -II : Questionnaires 57

ACROnyms UsED
AJK Azad Jammu & Kashmir
BTE Board of Technical Education
CDS Comprehensive Development Strategy
DAE Diploma in Associate Engineer
DBA Diploma in Business Administration
DFID United Kingdom Department for International Development
DIT Diploma in Information Technology
EGS Economic Growth Strategy
ESD Education for Sustainable Development
FATA Federally Administrated Tribal Area
GB Gilgit Baltistan
ICT Islamabad Capital Territory
ILO International labour Organization
JICA Japan International Cooperation Agency
NAVTTC National Vocational and Technical Training Commission
NSIS National Skills Information System
NVQF National Vocational Qualification Framework
P&D Planning & Development
RAC Refrigeration and Air conditioning
S&C Skills Standards & Curricula
SDC Skill Development Council
SDG Sustainable Development Goals
TTB Trade Testing Board
TVET Technical & Vocational Education & Training
UAE United Arab Emirates
UNICEF United Nations International Children's Emergency Fund
UNDF United nation Development Fund
UNDP United nation Development Program
UNESCO United Nations Educational, Scientific and Cultural Organization
UNIDO United Nations Industrial Development Organization
UPS Uninterruptible Power Supply
4 Comparative Analysis of TVET Sector in Pakistan
ExECUTivE sUmmARy
Pakistan is amongst resource rich countries that needs coordinated and coherent policy ac-tions to harness the potential in the industries, particularly in the technical and specialized fields. A significant skill gap is faced which is widening day by day despite blossomed growth of the Technical and Vocational Education and Training (TVET) by the successive political gov-ernments in Pakistan. Such a widening gap is significantly contributing towards rising unem-ployment in various sectors of the economy. Mismatch of demand and supply in the industry sector is attributed to the non-availability of the potential workers and shortage of the required skill and training.
In Pakistan, TVET sector has immense potential to address both challenges such as closing skills gaps and reducing unemployment. Nonetheless, TVET suffers from the negative percep-tion of policy and decision makers that it is inferior to the general academic education which resulted in decline in supply of skilled labor force. Such growing perception leaves detrimental impacts on overall TVET sector that is considered as low quality and yielding low returns lim-iting investment for skill development. Such dimming prospects, TVET schools increasingly suffer from inferior infrastructure as against traditional education channels and limited funds for teacher training, curriculum upgrades, and the equipment needed for skill development.
This study is a mix of desk review and sample based survey providing key information and critical analysis of TVET sector in Pakistan. Currently, the proportion of (15-29) year popu-lation is around 28% with Male 51% and female 49% at annual growth rate of 1.8%. This provides huge youth bulge whose potential can be harnessed by utilizing in formal education system and TVET sector.
First section reports that 3581 (technical: 934 & vocational: 2,647) public & private TVET institutions are found in Pakistan with annual supply of skilled labour force of 314,176 (DAE: 81,836 & Trade certificate: 232,340) to labour market. This is pertinent to mention that the number of private vocational TVET institutions is much higher than the public owned institu-tions. However, the contribution of private institutions is only 11% in technical skills whereas the share of vocational trade in skilled workforce is around 55%. As per the statistics, 58% TVET institution buildings were found satisfactory while only 10% were ranked as not satis-factory.
The internet facility is essential for TVET institutions for the purpose of online library reposi-tory, low cost institutional reporting, managing Provincial TVETA’s M&E system and other

5Comparative Analysis of TVET Sector in Pakistan
technology initiatives. The survey statistics demonstrates that majority of TVET institutions (99.3%) have internet access in Punjab, followed by Islamabad 90.5%, Khyber Pakhtunkhwa (KP) 76.3%, Sindh 31.8%, Baluchistan 24.5%, Azad Jammu and Kashmir (AJK) 31.8%, Feder-ally Administrative Tribal Area (FATA) 30.3%, and Gilgit Baltistan (GB) 12.3% being the lowest internet access region. The presence of first aid kit is important in TVET institutions for provi-sion of on-spot emergency relief to faculty and students. This is less encouraging as majority of the TVET institutions have functional first-aid kit. Punjab tops with 46% followed by Sindh 19.7%, FATA 11.4%, AJK 10.6%, Islamabad 6.9%, and non-existent in Baluchistan institutes. Almost 95% of TVET institutes does not have access to drinking water facility within its cam-puses and deals shortage by generating electricity through generators.
The diagnostics of this critical study will facilitate the policy makers at the federal and pro-vincial level, training institutions and other TVET stakeholders in the formulation of evident based decisions resulting in designing and implementation of need based training system to bridge skill gaps in the country.

6 Comparative Analysis of TVET Sector in Pakistan
inTRODUCTiOnCHAPTER
1The developed and developing countries have recognized the benefits of having a skilled workforce for ensuring sustainable economic development. These countries are successfully competing in international labour market and consequently achieving social and economic benefits from investments made heavily in the skill development sector.
In the context of Pakistan, it is believed that the current TVET system, technical educa-tion standards, curriculum and teacher training materials does not match with the growing demand of national and international jobs. It is a stylized fact that a number of private TVET institutions as not under the direct control of provincial TEVTA is much higher than the public sector institutions. Such a high concentration of private sector does not follow any minimum academic standards that results in imbalances owing to the increased supply of skilled work-force in the labour market.
It is a general perception that the existing curriculum offered in the TVET institutions does not correspond to the job market demand of the national and international market, due to which majority of the skilled workforce remains unemployed and the employer often reports skill deficiencies.
BACkground
The TVET institute is a key element of any policy initiative that aims to improve socio-eco-nomic conditions, creates jobs and alleviates poverty. The Government of Pakistan recognizes the importance of the TVET sector in terms of skill development. It intends to overcome a number of challenges in the sector, such as ensuring quality, access equity and relevance of current TVET practices. The ensuring of all TVET graduates adequately prepared for the job market in line with labour market demands requires shift from a supply-driven to a demand-oriented TVET system. It also requires an active role of the business community in designing, developing, managing and evaluating TVET activities.
Pakistan’s population is growing at a rapid pace. At the moment, the workforce is growing faster than the economy leading to unemployment, particularly in case of young people. The TVET sector’s capacity to deliver needed training services is insufficient to provide this ever growing workforce with professional skills. There are approximately 315,000 places available in the formal TVET sector for estimated 950,000 new labour market entrants each year. Less than
7Comparative Analysis of TVET Sector in Pakistan
6% of young people have acquired technical skill through the TVET system, and only 2.5% of them have received on-the-job training. This means that the competence level of the Pakistani workforce is too low to contribute adequately to enterprise productivity and competitiveness. It also means that Pakistan is not fully unleashing its potential youth for sustained supply of skilled labor force to the market. .
Recognizing the critical role of skill development in achieving sustained economic and social progress, the government is committed to reforming its TVET system as outlined in the National Skills Strategy (NSS) 2009-2013. The implementation of the NSS is a joint effort of public and private actors and stakeholders at national, provincial/regional and local levels. It is coordinated by the National Vocational and Technical Training Commission (NAVTTC) at the federal, and Technical and Vocational Training Authorities (TEVTAs) at the provincial levels.
Several development partners such as United Nations Educational Scientific and Culture Or-ganization (UNICEF), United Nations Development Fund (UNDF), United Nations Industrial Development Organization (UNIDO), World Bank (WB), British Council, United Kingdom De-partment for International Development (DFID) and Japan International Cooperation Agency (JICA) support the reform process through different interventions.
In April 2011, the five-year TVET Reform Support Programme was launched to assist the Government of Pakistan in the NSS implementation. The programme is jointly funded by the European Union, the Kingdom of the Netherlands and the Federal Republic of Germany. The Deutsche Gesellschaftfür Internationale Zusammenarbeit GmbH (GIZ) implements the Pro-gramme in partnership with NAVTTC and in close cooperation with TEVTA’s and other TVET stakeholders including the private sector.
nATionAl SkillS informATion SySTEm (nSiS)
The NAVTTC developed a policy document titled ‘Skilling Pakistan: National Skills Strategy 2009 – 2013’. The strategy’s fundamental aim is to reform the TVET system. The NSS envi-sions provision of relevant skill for industrial and economic development, improvement of access, equity and employability and assurance of quality through an integrated approach.
The National and overseas employment demands are shifting towards the higher skill catego-ries. It is imperative for the vast labour force to move up the skill-ladder through advanced training programmes and higher education to cater to emerging international requirements, both in high skill services and high technology industrial production. It is crucial to invest heavily in high quality secondary and tertiary education and TVET sector to transform economy more resilient and competitive in global market.
As new policies and systems are to be developed to implement the NSS and respond to the rapidly changing environment, there is an urgent need to rely on readily available information that can influence the decision–making process.

8 Comparative Analysis of TVET Sector in Pakistan
The timely and relevant skill/labour market information is thus increasingly important be-cause the countries of the region move to increase their productivity and competitiveness and continuously monitor the social and economic impact of globalization. With the establishment of NSIS, the government will be able to take stock of their capacity to produce and use skill information in decision-making process at national, provincial and district levels. The sys-tem will help formulate policies to adjust the demand and supply of skill according to the job requirement and tackle the unwieldy unemployment issue.
The NSIS should be ‘one single source’ of all information available on labour market. The in-formation will be available across institutions, industry, disciplines, duration /timelines, trade, skill etc. The NSIS will support decision-making by providing research oriented reliable and credible information to all stakeholders.
Ensuring reliable information to every citizen has been an important and long-standing policy mandate of the government departments. The sourcing, calibrating, processing and presenting information on real time basis has been a challenge despite sustained efforts due to fragmented data gathering, inaccuracy of data gathered and lack of comprehensive deliv-ery model. It is imperative to integrate information to provide a single source and a common window for all TVET-related information to the different stakeholders. The major stakeholders would be policy makers, planners, employers, training institutions and trainee/students.
oBjECTiVE of nSiS• Todevelop/provideareliableNationalSkillsInformationSystemforworkforcedevelop-
ment in employable skill- Skills Information System- Establish data collection system (supply and demand)- Supply and Market Demand Management- Supply and Market Demand Analysis
• Toprovidetimelyandaccurateinformationondemandandsupplyanalysis,toTVETplanners, training institutions, industry, academia, students and public in general;- Information Dissemination System- Establish interactive platform/network for TVET stakeholders- Align TVET plans, policies, programmes with NSIS
• Toestablishandfacilitatecareer/vocationalguidanceandplacementservicesforTVETgraduates and potential employers;- Establish Career/Vocational Guidance Service- Establish Job Placement Service- Provide information on skill available and skill required
9Comparative Analysis of TVET Sector in Pakistan
TVET PoliCy & inSTiTuTionAl EnVironmEnT
Historical perspective of the today’s mostly known TVET provides an evolving look on the basis of which the concept has been termed with various names in order to better elaborate its associated fundamentals. One can find various interchangeably-used names in the avail-able literature, which mainly include TVET, Occupational Education, Career and Technical Education, Vocational Education, Industrial Education, Technical Education etc. At the second International Congress on Technical and Vocational Education held in the Republic of Korea in 1999; UNESCO and ILO in consultation with their respective member states and partner agencies, jointly agreed upon using the term TVET in future in order to unify all the fields. The definition of TVET thus adopted at the Korean Congress1 is “those aspects of the educational process involving, in addition to general education, the study of technologies and related sci-ences, and the acquisition of practical skill, attitudes, understanding and knowledge relating to occupants in various sectors of economic and social life” (UNESCO, 1999).
The TVET’s evolution, as portrayed by Benavot (1983), can be linked back to technological changes necessitated by the industrial revolution. The industrialization process introduced mechanization, which urged greatly for specialized workforce capable of meeting the demands of the economic shift. This in turn demanded for capacitating institutions as well as human resources to meet the unmet market demand, which later on exposed its true potential for economic growth and poverty alleviation. This can be termed as the main aim of interventions made in the sphere of technical education and vocational training.
Thus TVET is gaining its importance throughout the world. There has been discussion to add TVET to the UNESCO ‘Education for All’ (EFA) and ‘Education for Sustainable Development’ (ESD) initiatives. The strengthening and upgrading TVET is also regarded as important for achieving the Sustainable Development Goals (SDGs).
rElEVAnT inTErnATionAl ConVEnTionS
Keeping in view the importance of the intervention in terms of its potential contribution in alleviating poverty and improving social inclusion, the international community has ratified several conventions to which Pakistan is a signatory. ILO, being central to the theme, advocates and reports on these conventions primarily referred as the core labour standards.
These conventions provide guiding principles to cater to the labour issues as well as to keep binding on the member states to comply with core labour standards. This makes the men-tion of these conventions of particular importance in order to keep the TVET sphere more informed and well-articulated as the requirement of embedding the TVET’s designing, plan-ning and implementation stages with the principle outlined in these conventions is a growing concern.
1 Editorial: The future of technical and vocational education
10 Comparative Analysis of TVET Sector in Pakistan
TVET inSTiTuTionAl EnVironmEnT in PAkiSTAn
In 1947, Pakistan had a very low industrial base, which is only 4% of the total economy. The country started to industrialize in the 1950s and progress in this respect was very notable in the 1960s. The TVET systems were expanded and strengthened to sustain the growth of the manufacturing sector. This initial momentum, however, could not be maintained due to dearth of resources as well as diminishing policy commitment by successive governments towards the TVET sector. The sector thus gradually lost its way to meet the needs of the emerging job markets (GIZ 2011).2
With the renewed focus in recent years, TVET is gaining momentum despite its infancy. The available strand of literature reveals that the policy fronts both at national and provincial levels provide a well-defined cover exhibiting the government’s commitment required for setting up a robust structure for flourishing the TVET sector.
In Pakistan, TVET has been re-structured at federal level by establishing a NAVTTC, while Technical Education & Vocational Training Authorities (TVETAs) were established at pro-vincial levels. These are being run under certain Acts and policies providing legal cover and strategic direction. The TVET is being dealt by associating it with the education at secondary as well as at higher levels, which in turn produces semi-skilled, skilled and highly-skilled hu-man resource. There are a number of administrative agencies responsible for looking after the TVET’s affair at various levels. The respective provincial education departments administer the affairs concerning vocational institutes whereas the labour departments are responsible for technical training and apprenticeship centres. The TVET institutional system at the national and provincial levels is briefly described below (GIZ 2011)3.
At the federal level, the Ministry of Professional and Technical Training has been established and empowered to lead role in the TVET business and head the NAVTTC and the National Training Bureau (NTB). At the provincial level, TEVTA was formed through an Ordinance (No XXIV of 1999) promulgated by Governor of the Punjab which has now been replaced by TEV-TA ACT (ACT X of 2010) Punjab. In Khyber Pakhtunkhwa (KP), TEVTA KP was established under the TEVTA Act no xxx111 of 2015 on March, 2015, whereas the Directorate General Technical Education and Manpower Training was declared as the Secretariat of TEVTA, KP. In Sindh, TVETA Bill was passed by the provincial assembly on 29th March, 2010 and was declared as an Act on 14th April, 2010.
For the provincial level implementation of the above legislations/acts, the authorities such as the TEVTAs, and the Skill Development Councils (SDCs) are entrusted as autonomous bodies with planning and executing training programmes as well as carrying out tasks such as revi-
2 Labour market information - A situational analysis of Pakistan submitted to GiZ TvET Reform support Programme by Jan de voogd, mD and Prof. Dr. muhammad iqbal Qureshi (2011).
3 As above.

11Comparative Analysis of TVET Sector in Pakistan
sion/development of curriculum, and training of trainers. In addition, the Directorates of Techni-cal Education (DTE), Provincial Directorates of Manpower Training along with other agencies run their own vocational training programmes in the public sector. The National Training Board and the associated Trade Testing Boards are responsible for their own examinations and issuance of skill training certificates.
Thus as whole, the TVET sector is undergoing a restructuring process to position itself as a demand-driven training sector in line with the prevalent training system elsewhere in the world (NISTD 2009)4. It also aims, as expressed in the NSS 2009-2013, to introduce competency-based training to ensure that its training programmes are addressing the requirements of local and foreign employers.
STATuS of lABour forCE And EmPloymEnT in PAkiSTAn
The latest Labour Force Survey 2008-09 suggests that the labour force in Pakistan is estimated at 53.72 million, out of which 50.79 million persons are employed, about 35 million in rural areas, while 2.93 million persons are unemployed, thus resulting in an unemployment rate of 5.5%. The gender gap has been narrowed considerably over the years. Male unemployment has increased in the last two decades whereas female unemployment has decreased.
The NSS 2009-2013 by NAVTTC citing the Medium Term Development Framework 2005-2010 indicates that the country has an annual demand of nearly 950,000 skilled workers. This target presents a huge gap as the enrolment across above 1,500 TVET institutions was reported about 350,000. This case is presenting an interesting story as a big shortfall in the required number of skilled workers. The federal and provincial governments through NAVTTC and TEVTAs there-fore; face a huge challenge to meet the growing demand of skilled workers for the country‘s economic development and export human resource elsewhere in the labour deficient countries.
Another challenge is the lack of emphasis on inclusiveness of the poor, female youth and disa-bled and their acquisition as skilled workers. Unfortunately, some traditional skills as integral part of rural society are not well respected in our society, for instance barber, carpenter, masonry, smith, pottery, etc. who are considered as low class in our social system. These skills are aban-doned by the people while TVET sector does not offer formal training programme. However, this perception is positively changing now with the passage of time.
The poor people are excluded from the formal training system, as well as in the informal sector. They are marginalized out of training connections as training flourishes from social and com-munity connections.5 Thus, they remain likely to be uneducated, having greater difficulties in accessing formal skills training due to entry requirements related to qualifications and fees.
4 Research study on Technical and vocational Education in Pakistan at secondary Level national institute of science and Technical Education in collaboration with UnEsCO, islamabad (2009)
5 'is skills Training a Good investment for the Poor? Evidence from Pakistan' by shehryarJanjua (2011) from the mahboubul Hag Human Development Centre

12 Comparative Analysis of TVET Sector in Pakistan
As a whole, in addition to policy instruments, there is a dire need of ensuring procedural measures that would ensure an effective implementation of the policies in line with the supply and demand requirements for achieving the overall associated objectives. There is also a need to establish the importance of quality and access of TVET services in a gender sensitive and pro-poor manner for achieving its associated objectives of employability, poverty reduction and economic growth.
STATuS of TVET inSTiTuTES in PAkiSTAn
A larger labour force is good for the rapid economic growth of the country provided it is used in the productive employment. It demands a mixture of quality skilled workers, tradesmen, technicians, technologists, engineers, researchers and development scientists. Without good education system and need-based TVET institutions/course curricula, quality skilled labour force for productive employment would not grow resulting into continued rise in youth un-employment and/or un-skilled workers. It becomes difficult for them to emerge out of poverty and fall into ant-social and/or state activities.
In Pakistan, presently there are over 3,581 public & private TVET institutions with an enroll-ment of 314,188 students working in the country and providing technical skill to the labour force. These include technology colleges, polytechnic institutes and mono-technic institutes, whereas commerce education for business sector is provided in over 200 commercial training institutes. In addition, vocational institutes also operate throughout the country. The authentic facts on private TVET enrollment and graduation are not available but according to NISTD study, there are more than 1,000 private institutes throughout the country that are engaged in providing TVET. Now it is being planned to produce one million skilled labour per year(NISTD 2009).6
The different duration of courses in various technical and vocational fields is being offered across the country, ranging from three-month certificate course to three year diploma of asso-ciate engineering (DAE). All these diverse approaches serve the purpose of employment, self-employment, and further improvement in education. The NISTD study has found that except three-year diploma of Associate Engineering Programmes, all other options are not up to the mark. As far as vocational training is concerned, various experiments in the country have not yielded positive results due to which most reform proposals invite controversy (NISTD 2009).7
The curricula of TVET focus remains on the acquisition of employable skills. Keeping in view of enhancing the skills-level of the work force, there is a need to revitalize, modernize and har-
6 Research study on Technical and vocational Education in Pakistan at secondary Level national institute of science and Technical Education in collaboration with UnEsCO, islamabad (2009).
7 Research study on Technical and vocational Education in Pakistan at secondary Level national institute of science and Technical Education in collaboration with UnEsCO, islamabad (2009).
Composite Welfare indices of Khyber Pakhtunkhwa (2011) CDs & EGs KP

13Comparative Analysis of TVET Sector in Pakistan
monize TVET in the specialized institution of technical education, as well as integrate it with the general school education (UNESCO 2009). Furthermore, Skill Development Programmes for the skilled workers trained through informal sources (Ustad-Shagird) would be needed to enhance their skill and improve attitude towards the work in their areas.
The CDS, Khyber Pakhtunkhwa, a seven year development plan (2010-2017), and the EGS, beef up the commitment of government to invest Rs. 16,800 million in the development and improvement of technical and vocational education. The strategy emphasizes to create institu-tion mapping and identification of the population’s future need in the area of technical and vocational education. The provincial government policy documents emphasize on improving quality of technical education, introducing new trades, technology and courses to respond to the training need and market-oriented subject at institution level.
The strategies also lay emphasis upon the establishment of new technical and vocational institutions and provision of equipment and other missing facilities at the existing training institutions.
14 Comparative Analysis of TVET Sector in Pakistan
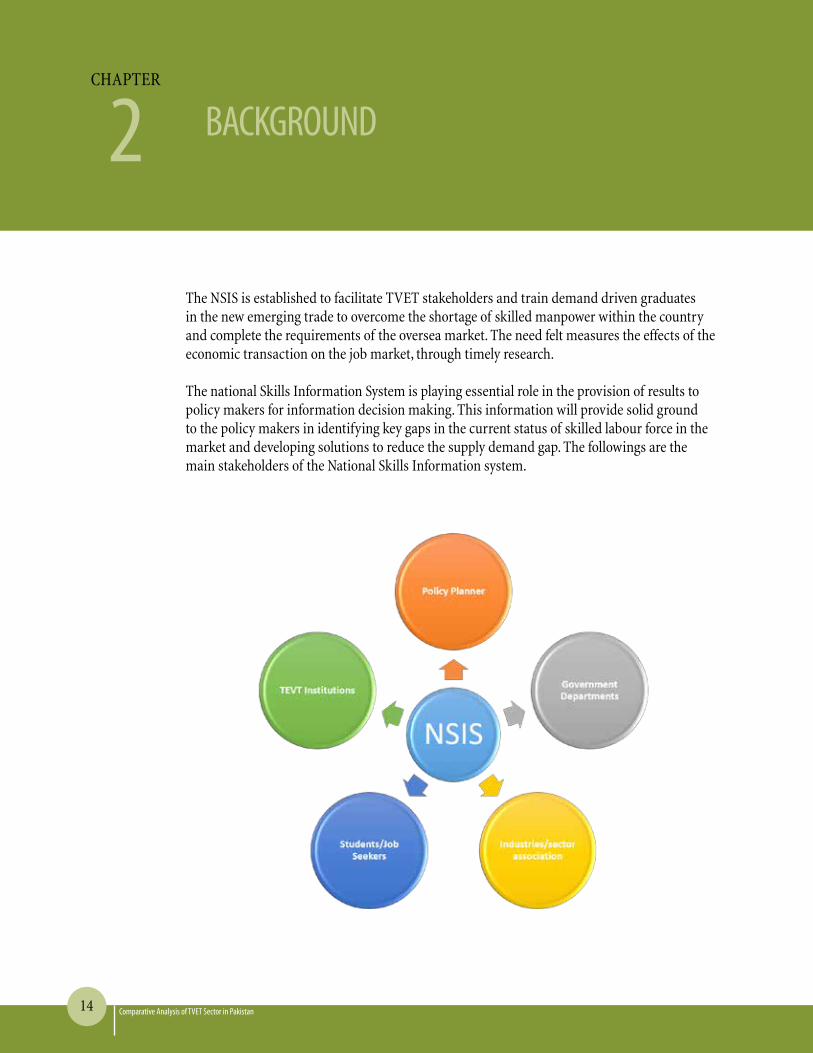
The NSIS is established to facilitate TVET stakeholders and train demand driven graduates in the new emerging trade to overcome the shortage of skilled manpower within the country and complete the requirements of the oversea market. The need felt measures the effects of the economic transaction on the job market, through timely research.
The national Skills Information System is playing essential role in the provision of results to policy makers for information decision making. This information will provide solid ground to the policy makers in identifying key gaps in the current status of skilled labour force in the market and developing solutions to reduce the supply demand gap. The followings are the main stakeholders of the National Skills Information system.
BACKGROUnDCHAPTER
2
15Comparative Analysis of TVET Sector in Pakistan
Each stakeholder in the system is involved at different points to fulfill the essential objective to up-skill the vast labour force across the entire sector with a view to providing employment on sustained basis. The skill development cycle consists of the following steps. The NSIS cell aims to ensure timely data flown from the TVET institutions to provincial TVETA and national da-tabase. On the basis of which, the activity is designed in two phases. In phase-1, manual data would be collected from TVET institution and the train the institution for web based applica-tion. In phase-2, the demand side data would be collected.
TArgET PoPulATion
The target population for the data collection exercise is all the public and private TVET (Tech-nical & vocational) institutions across the country.
oBjECTiVE
The following are the sub-objectives.a. To know about gap between demand and supply of skilled and semi-skilled workforce.b. To provide statistical information to develop the national occupational skills standard.c. To facilitate the TVET to utilize the NSIS data & statistics in planning and decision mak-
ing.d. To calculate the public & private sector contribution in development of skilled human
capital
mEThodology
There are two approaches for quantitative data collection from TVET institutions, one is manual through enumerators and second is through web based application. Initially, it was decided to use the manual approach in the beginning and train the TVET institution staff on e-questionnaire for future annual data collection. On the basis of decision of TWG, each TVETA is requested to nominate the TVETA’s staff for data collection. The master trainers are trained on questionnaire and future web based approach while in some places, the enumera-tors are also used to collect data from private TVET institution.
Two days workshop was conducted for reviewing the NSIS supply and demand side data col-lection questionnaires. The revised questionnaire was again presented in the 7th TWG meet-ing and got final approval for data collection. In this way, data was collected from the TVET institutions in Pakistan.
For the purpose of data collection and capacity building of the TVET institutions on e-questionnaire, 96 master trainers were deputed from the staff of provincial TEVTA. In case of Baluchistan, the master trainers were trained, but collection was kept pending due to several causes as a result of which the available material was utilized in the analysis. In AJK, the nomi-nation was received very late, on the basis of which private enumerators were hired to collect

16 Comparative Analysis of TVET Sector in Pakistan
data from all public and private TVET institutions. Islamabad faced a lot of problem regarding data collection as the organization like provincial TVETA did not exist, although data was col-lected due to enumerators. In future, data would be collected through e-questionnaire, which is available on NSIS website (www.skillingpakistan.org). In case of lack of internet access, the questionnaires available on NSIS website would be downloaded and processed in manual data feeding.
17Comparative Analysis of TVET Sector in Pakistan
GEnERAL inFORmATiOn & BAsiC FACiLiTiEs
CHAPTER
3Building CondiTion
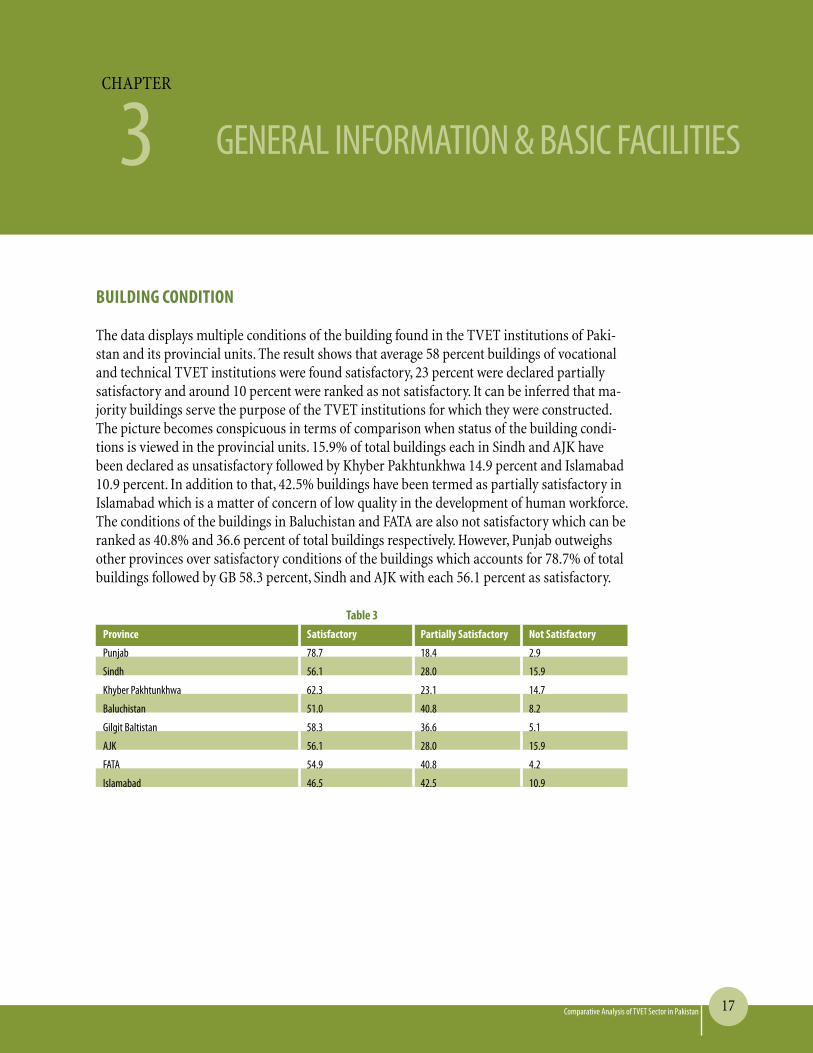
The data displays multiple conditions of the building found in the TVET institutions of Paki-stan and its provincial units. The result shows that average 58 percent buildings of vocational and technical TVET institutions were found satisfactory, 23 percent were declared partially satisfactory and around 10 percent were ranked as not satisfactory. It can be inferred that ma-jority buildings serve the purpose of the TVET institutions for which they were constructed. The picture becomes conspicuous in terms of comparison when status of the building condi-tions is viewed in the provincial units. 15.9% of total buildings each in Sindh and AJK have been declared as unsatisfactory followed by Khyber Pakhtunkhwa 14.9 percent and Islamabad 10.9 percent. In addition to that, 42.5% buildings have been termed as partially satisfactory in Islamabad which is a matter of concern of low quality in the development of human workforce. The conditions of the buildings in Baluchistan and FATA are also not satisfactory which can be ranked as 40.8% and 36.6 percent of total buildings respectively. However, Punjab outweighs other provinces over satisfactory conditions of the buildings which accounts for 78.7% of total buildings followed by GB 58.3 percent, Sindh and AJK with each 56.1 percent as satisfactory.
Table 3Province Satisfactory Partially Satisfactory not Satisfactory
Punjab 78.7 18.4 2.9
sindh 56.1 28.0 15.9
Khyber Pakhtunkhwa 62.3 23.1 14.7
Baluchistan 51.0 40.8 8.2
Gilgit Baltistan 58.3 36.6 5.1
AJK 56.1 28.0 15.9
FATA 54.9 40.8 4.2
islamabad 46.5 42.5 10.9
18 Comparative Analysis of TVET Sector in Pakistan
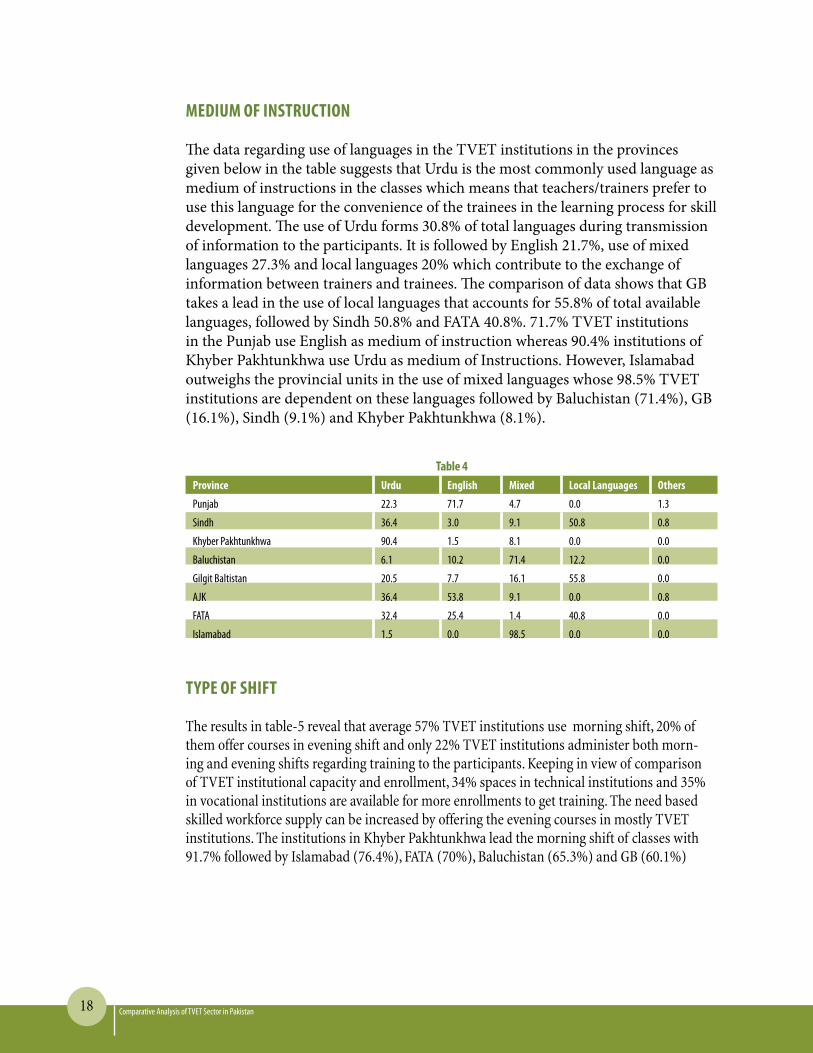
mEdium of inSTruCTion
The data regarding use of languages in the TVET institutions in the provinces given below in the table suggests that Urdu is the most commonly used language as medium of instructions in the classes which means that teachers/trainers prefer to use this language for the convenience of the trainees in the learning process for skill development. The use of Urdu forms 30.8% of total languages during transmission of information to the participants. It is followed by English 21.7%, use of mixed languages 27.3% and local languages 20% which contribute to the exchange of information between trainers and trainees. The comparison of data shows that GB takes a lead in the use of local languages that accounts for 55.8% of total available languages, followed by Sindh 50.8% and FATA 40.8%. 71.7% TVET institutions in the Punjab use English as medium of instruction whereas 90.4% institutions of Khyber Pakhtunkhwa use Urdu as medium of Instructions. However, Islamabad outweighs the provincial units in the use of mixed languages whose 98.5% TVET institutions are dependent on these languages followed by Baluchistan (71.4%), GB (16.1%), Sindh (9.1%) and Khyber Pakhtunkhwa (8.1%).
Table 4Province urdu English mixed local languages others
Punjab 22.3 71.7 4.7 0.0 1.3
sindh 36.4 3.0 9.1 50.8 0.8
Khyber Pakhtunkhwa 90.4 1.5 8.1 0.0 0.0
Baluchistan 6.1 10.2 71.4 12.2 0.0
Gilgit Baltistan 20.5 7.7 16.1 55.8 0.0
AJK 36.4 53.8 9.1 0.0 0.8
FATA 32.4 25.4 1.4 40.8 0.0
islamabad 1.5 0.0 98.5 0.0 0.0
TyPE of ShifT
The results in table-5 reveal that average 57% TVET institutions use morning shift, 20% of them offer courses in evening shift and only 22% TVET institutions administer both morn-ing and evening shifts regarding training to the participants. Keeping in view of comparison of TVET institutional capacity and enrollment, 34% spaces in technical institutions and 35% in vocational institutions are available for more enrollments to get training. The need based skilled workforce supply can be increased by offering the evening courses in mostly TVET institutions. The institutions in Khyber Pakhtunkhwa lead the morning shift of classes with 91.7% followed by Islamabad (76.4%), FATA (70%), Baluchistan (65.3%) and GB (60.1%)

19Comparative Analysis of TVET Sector in Pakistan
which indicates the interest of the institutions for training in the morning session. The status of the remaining provinces in terms of morning courses offered is not so high which means that they divided their shifting programmes based on rising demand of people for the skill development purpose. The 50% institutions in Sindh province are engaged in offering even-ing courses followed by GB (31.5%) whereas 76.6% institutions in Punjab take lead in offering mixed courses in comparison with other provinces.
Table 5Province morning Evening Both
Punjab 22.2 1.2 76.6
sindh 33.3 50.0 16.7
Khyber Pakhtunkhwa 91.7 0.3 8.0
Baluchistan 65.3 4.1 30.6
Gilgit Baltistan 60.1 31.5 0.3
AJK 33.3 50 16.7
FATA 70.4 23.9 5.6
islamabad 76.4 2.9 20.7
drinking WATEr fACiliTy
The data in the graph below manifests availability of drinking water facility in TVET institutions in Pakistan and its federating units. The interpretation of data shows that the institutions in Islamabad have 100% access to drinking water facility which reflects proper development of human skill through training. It is followed by Punjab with 99.7% drinking water facility for its institutions, Khyber Pakhtunkhwa having 79% drinking water facility for the institutions and Baluchistan institutions have 81.6% drinking water facility. The TVET institutions in FATA have 97.1% drinking water facility followed by Sindh and AJK with each 97% drinking water facility respectively. The encouraging results in terms of drinking water facility in the TVET institutions provide congenial environment for both trainers and trainees in teaching and learning process aimed at bridging gap between demand and supply of skilled labor force.

20 Comparative Analysis of TVET Sector in Pakistan
figure 1
0102030405060708090
10099.7 97
79.7 81.6
96 97 97.1 100
STATuS of drinking WATEr
On the basis of gathered data, it has been evaluated that drinking water remains available in 80% TVET situations whereas drinking water is available sometimes in 17% institutions and only 2% institutions are devoid of drinking water facility where opportunity of human skill development is bleak. Moreover, always availability of drinking water is found in the institu-tions in all the federating units. Furthermore, sometime availability of drinking water is almost found in the institutions of the provincial units with highest in GB (59.6%) and lowest in Punjab (1.2%). However, the proportion of not available drinking water is high in Baluchistan with 8.1% followed by FATA with only 2.9% while institutions of the remaining provinces show negligible proportion under this category.
Table 6Province Always available Sometime available not available others
Punjab 96.2 1.2 0.1 0.0
sindh 86.0 11.6 1.6 0.8
Khyber Pakhtunkhwa 93.3 6.7 0.0 0.0
Baluchistan 86.5 5.4 8.1 0.0
Gilgit Baltistan 40.4 59.6 0.0 0.0
AJK 86 11.6 1.6 0.8
FATA 54.4 42.6 2.9 0.0
islamabad 100.0 0.0 0.0 0.0
21Comparative Analysis of TVET Sector in Pakistan
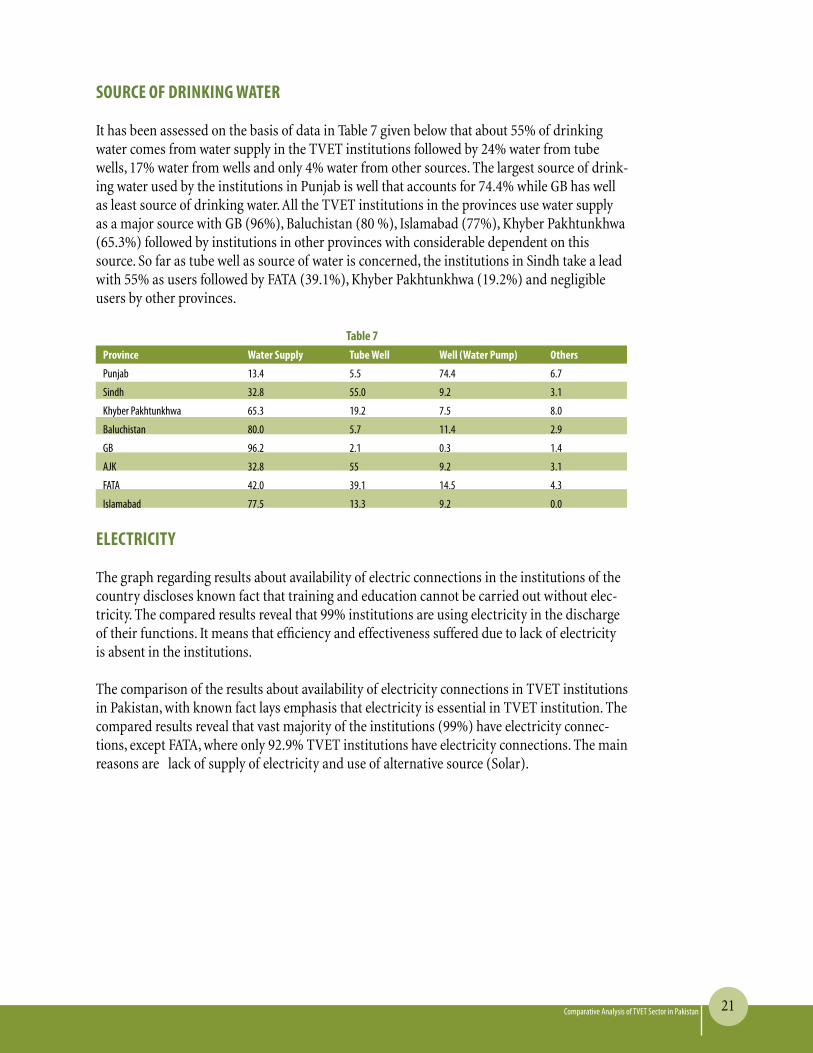
SourCE of drinking WATEr
It has been assessed on the basis of data in Table 7 given below that about 55% of drinking water comes from water supply in the TVET institutions followed by 24% water from tube wells, 17% water from wells and only 4% water from other sources. The largest source of drink-ing water used by the institutions in Punjab is well that accounts for 74.4% while GB has well as least source of drinking water. All the TVET institutions in the provinces use water supply as a major source with GB (96%), Baluchistan (80 %), Islamabad (77%), Khyber Pakhtunkhwa (65.3%) followed by institutions in other provinces with considerable dependent on this source. So far as tube well as source of water is concerned, the institutions in Sindh take a lead with 55% as users followed by FATA (39.1%), Khyber Pakhtunkhwa (19.2%) and negligible users by other provinces.
Table 7Province Water Supply Tube Well Well (Water Pump) others
Punjab 13.4 5.5 74.4 6.7
sindh 32.8 55.0 9.2 3.1
Khyber Pakhtunkhwa 65.3 19.2 7.5 8.0
Baluchistan 80.0 5.7 11.4 2.9
GB 96.2 2.1 0.3 1.4
AJK 32.8 55 9.2 3.1
FATA 42.0 39.1 14.5 4.3
islamabad 77.5 13.3 9.2 0.0
ElECTriCiTy
The graph regarding results about availability of electric connections in the institutions of the country discloses known fact that training and education cannot be carried out without elec-tricity. The compared results reveal that 99% institutions are using electricity in the discharge of their functions. It means that efficiency and effectiveness suffered due to lack of electricity is absent in the institutions.
The comparison of the results about availability of electricity connections in TVET institutions in Pakistan, with known fact lays emphasis that electricity is essential in TVET institution. The compared results reveal that vast majority of the institutions (99%) have electricity connec-tions, except FATA, where only 92.9% TVET institutions have electricity connections. The main reasons are lack of supply of electricity and use of alternative source (Solar).

22 Comparative Analysis of TVET Sector in Pakistan
figure 2
0102030405060708090
10099.7 97
79.7 81.6
96 97 97.1 100
BACkuP SourCE of ElECTriCiTy
The data in the graph indicates level of availability of backup source of electricity in the TVET institutions of different provinces in Pakistan. The backup source of electricity is essential in the wake of emergency when power outage occurs repeatedly. As per statistics, the institu-tions in Punjab have maintained around 71.8% backup source of electricity, followed by FATA 36.8%, Baluchistan 22.4%, Khyber Pakhtunkhwa 20.6%, Sindh and AJK with each 17.4%, Islamabad 14.7% and GB 12.2%. The Islamabad and GB are far behind in keeping up backup source of electricity as a result of which efficiency remains low in comparison with other prov-inces due to this factor.
figure 3
01020304050607080 71.8
17.4 20.6 22.4
12.217.4
36.8
14.7

23Comparative Analysis of TVET Sector in Pakistan
TyPE of BACkuP SourCE of ElECTriCiTy
The tabulated data statement pertaining to types of backup source of electricity in Table 8 be-low has been assessed and found that majority TVET institutions are using UPS which account for 47% of total backup source of electricity available with them. The use of UPS is followed by adopting other types such as generators 43%, and solar 8% as backup source of electricity. The province wise data in terms of kind of backup source of electricity indicates that majority of the institutions is using UPS (94.6%) in the Punjab which is sufficient for official use in the public sector. In Sindh, the use of generators is the highest 86.4% while Khyber Pakhtunkhwa has use of UPS (50%), generator (30.8%), solar (17.3%) and 1.8% of institutions using more than one backup source of electricity. In Baluchistan, use of UPS is the highest (50%), genera-tor (30%) and solar (20%) as backup source of electricity. 100% of 12.2% institutions in GB as backup source are using UPS only without relying on other sources. In AJK, majority of the institutions (17.4% of total) are using UPS only for official use. The FATA institutions have also the use of backup sources of electricity such as UPS (24%), generator (56%) and solar (20%). In Islamabad, the electricity supply is comparatively better with only 14.7 % used as backup source including UPS (41.5%), generator (56%), solar (20%). The efforts must be directed to strengthen the backup source of electricity in the TVET institutions of Islamabad and its provinces to avoid any breakdown in the emergency situation.
Table 8Province uPS generator Solar others more than i source
Punjab 94.6 3.2 1.8 0.0 0.4
sindh 9.1 86.4 0.0 0.0 4.5
Khyber Pakhtunkhwa 50.0 30.8 17.3 0.0 1.9
Baluchistan 50.0 30.0 20.0 0.0 0.0
Gilgit Baltistan 100.0 0.0 0.0 0.0 0.0
AJK 9.1 86.4 0.0 0.0 4.5
FATA 24.0 56.0 20.0 0.0 0.0
islamabad 41.5 51.2 7.3 0.0 0.0
hoSTEl fACiliTy
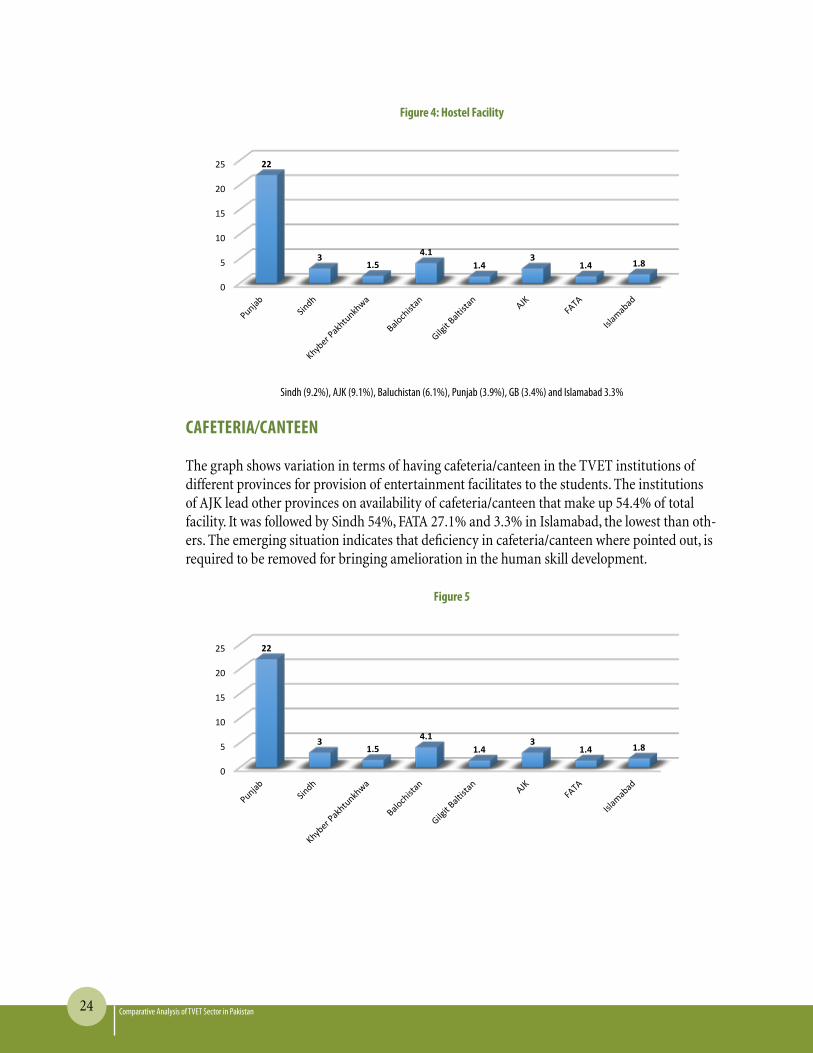
The fact shown in the graph in figure 4 point outs about the hostel facility in the country that FATA surpasses other provinces on the availability of hostel facility (14.3%) in the TVET insti-tutions for the students which mean that the students belonging to other areas don’t face any residential problems. It was followed by Sindh (9.2%), AJK (9.1%), Baluchistan (6.1%), Punjab (3.9%), GB (3.4%) and Islamabad 3.3%. The institutions in Islamabad are on the bottom list with respect to the availability of hostel facility whose declining situation urges the adminis-tration to improve the hostel facility for providing convenience to the students in the process of learning.
24 Comparative Analysis of TVET Sector in Pakistan
figure 4: hostel facility
0
5
10
15
20
25 22
31.5
4.11.4
31.4 1.8
sindh (9.2%), AJK (9.1%), Baluchistan (6.1%), Punjab (3.9%), GB (3.4%) and islamabad 3.3%
CAfETEriA/CAnTEEn
The graph shows variation in terms of having cafeteria/canteen in the TVET institutions of different provinces for provision of entertainment facilitates to the students. The institutions of AJK lead other provinces on availability of cafeteria/canteen that make up 54.4% of total facility. It was followed by Sindh 54%, FATA 27.1% and 3.3% in Islamabad, the lowest than oth-ers. The emerging situation indicates that deficiency in cafeteria/canteen where pointed out, is required to be removed for bringing amelioration in the human skill development.
figure 5
0
5
10
15
20
25 22
31.5
4.11.4
31.4 1.8
25Comparative Analysis of TVET Sector in Pakistan
TrAnSPorT fACiliTy
The transport facility arranged by the institutions for the students plays key role in the im-provement of efficiency in the education and training by reducing time and psychological stress of reaching late. The data presented in the graph below reflects the availability of trans-port facility in the TVET institutions of the country. The transport facility is the basic need of the students enrolled in the institutions which is required to be met on emergency basis. The data shows that 22% of the institutions in Punjab avail transport facility for the students as well teachers, followed by Sindh 3%. Only 1.4% institutions in both FATA and GB use the trans-port facility which means that less availability of transport facility is adversely affecting the efficiency of the students who encounter transport problems if the transport is not arranged by the TVET institutions.
ToilET fACiliTy
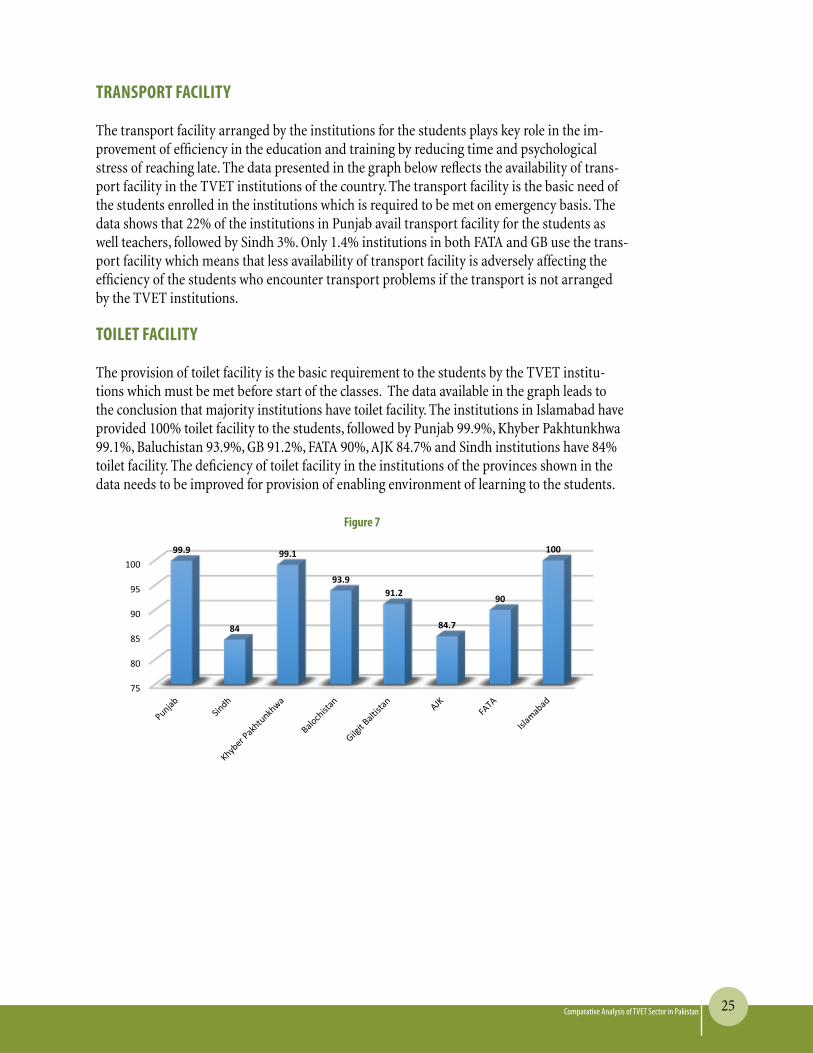
The provision of toilet facility is the basic requirement to the students by the TVET institu-tions which must be met before start of the classes. The data available in the graph leads to the conclusion that majority institutions have toilet facility. The institutions in Islamabad have provided 100% toilet facility to the students, followed by Punjab 99.9%, Khyber Pakhtunkhwa 99.1%, Baluchistan 93.9%, GB 91.2%, FATA 90%, AJK 84.7% and Sindh institutions have 84% toilet facility. The deficiency of toilet facility in the institutions of the provinces shown in the data needs to be improved for provision of enabling environment of learning to the students.
figure 7
75
80
85
90
95
10099.9
84
99.1
93.991.2
84.7
90
100
26 Comparative Analysis of TVET Sector in Pakistan
inTErnET fACiliTy
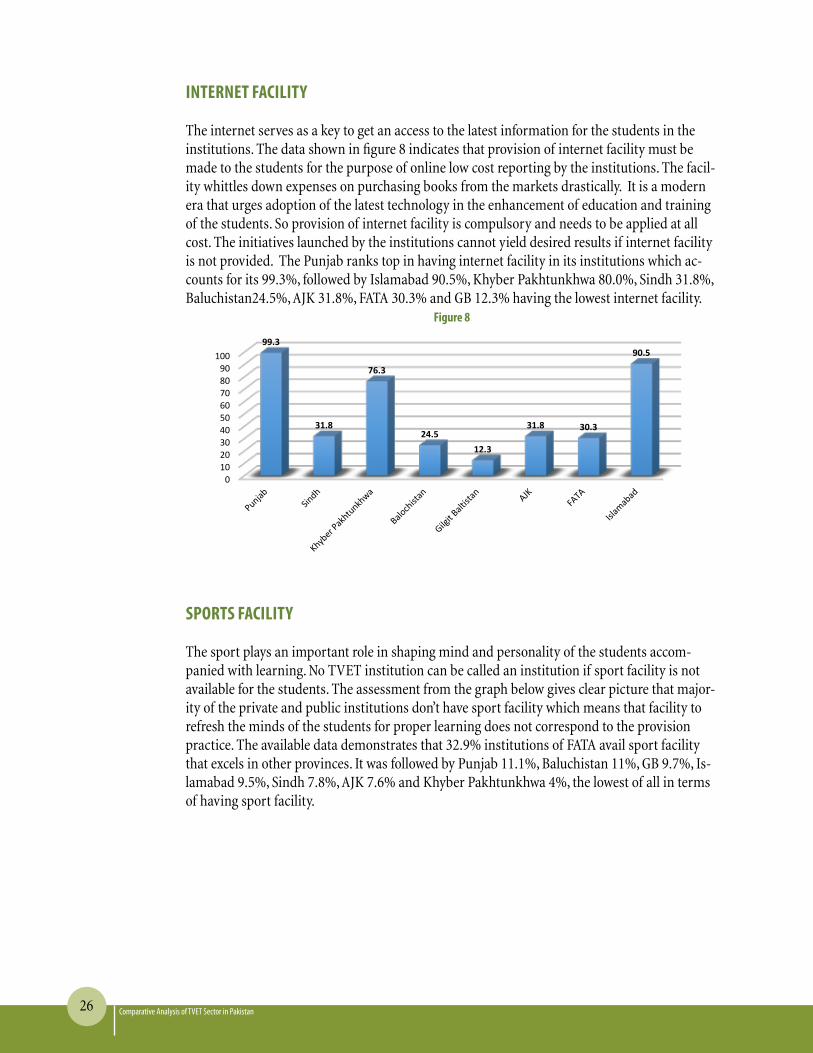
The internet serves as a key to get an access to the latest information for the students in the institutions. The data shown in figure 8 indicates that provision of internet facility must be made to the students for the purpose of online low cost reporting by the institutions. The facil-ity whittles down expenses on purchasing books from the markets drastically. It is a modern era that urges adoption of the latest technology in the enhancement of education and training of the students. So provision of internet facility is compulsory and needs to be applied at all cost. The initiatives launched by the institutions cannot yield desired results if internet facility is not provided. The Punjab ranks top in having internet facility in its institutions which ac-counts for its 99.3%, followed by Islamabad 90.5%, Khyber Pakhtunkhwa 80.0%, Sindh 31.8%, Baluchistan24.5%, AJK 31.8%, FATA 30.3% and GB 12.3% having the lowest internet facility.
figure 8
0102030405060708090
10099.3
31.8
76.3
24.512.3
31.8 30.3
90.5
SPorTS fACiliTy
The sport plays an important role in shaping mind and personality of the students accom-panied with learning. No TVET institution can be called an institution if sport facility is not available for the students. The assessment from the graph below gives clear picture that major-ity of the private and public institutions don’t have sport facility which means that facility to refresh the minds of the students for proper learning does not correspond to the provision practice. The available data demonstrates that 32.9% institutions of FATA avail sport facility that excels in other provinces. It was followed by Punjab 11.1%, Baluchistan 11%, GB 9.7%, Is-lamabad 9.5%, Sindh 7.8%, AJK 7.6% and Khyber Pakhtunkhwa 4%, the lowest of all in terms of having sport facility.

27Comparative Analysis of TVET Sector in Pakistan
figure 9
0
5
10
15
20
25
30
35
11.17.8
4
11 9.77.6
32.9
9.5
liBrAry fACiliTy
The library serves as a source of materials for the students required in the development of skill to deal with the problems. It necessitates the provision of library in the TVET institutions as guide for the students. The data in the graph manifest non-availability of library in the institu-tions that needs to be resolved for proper development of human skill. The provision of library facility in the institution of Islamabad is the highest with 37.1%, followed by FATA 31.4%, the lowest in Khyber Pakhtunkhwa.
figure 10
05
10152025303540
9.1 7.65.2
10.27.3
19.7
31.4
37.1

28 Comparative Analysis of TVET Sector in Pakistan
firST Aid kiT
The first aid kit works in the emergency situation when incidence occurs in the workshop dur-ing working by the students. Its provision in the workshops of the TVET institutions is manda-tory as the students are always at risk during training that might lead to the injuries. The data in the graph points out that Punjab is the only province where 46% of the institutions have first aid kit in dealing with the emergency matters. The proportion of this facility is dismally low in the institutions of other provinces, which is reflected by Sindh 19.7%, FATA 11.4%, AJK 10.6%, Islamabad 6.9%, and Baluchistan 0%.
figure 11
05
101520253035404550 46
19.7
2.2 06
10.6 11.46.9

29Comparative Analysis of TVET Sector in Pakistan
STATiSTiCS of VoCATionAl inSTiTuTES (AVErAgES)
The data presented in Table 9 suggests that total capacity of the vocational institutions (private & public) assessed was 314,706 students against yearly enrolment of 232,340 students. The gap between existing capacity and demand comes to be 82,366 students which can only be abridged through enhancing the capacity of institutions of Pakistan for producing required skilled labour force. This hiatus is unlikely to happen due to supply of skilled workforce on tra-ditional pattern. The analytical look at the provincial data indicates that the dropout in all the provinces is normal except 27% in FATA and 10% in GB of total enrolled students. The dropout in the remaining provincial units and Islamabad is minimal which can be reduced to zero by increasing the efficiency of the institutions. The student teacher ratio is low against defined criteria in all the public institutions of the provincial units except Khyber Pakhtunkhwa (49:1 ratio) followed by Sindh (45:1).
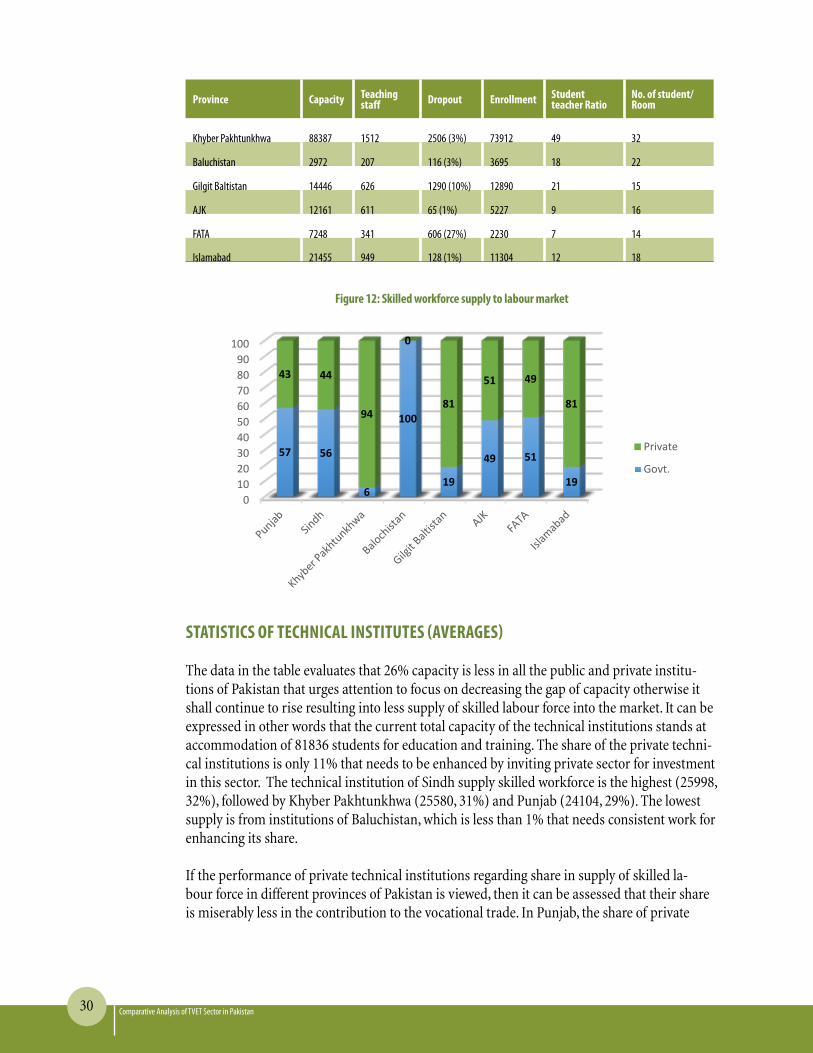
However, the private institutions have high ratio which reflect improved efficiency in pro-ducing skilled labor force. The vocational institutions of the Punjab take lead in producing around 85,790 (Public institution around 57%) skilled workforce to labour market, Khyber Pakhtunkhwa skilled workforce supply is 73,912 (Public institution share only 6%), Sindh skilled workforce supply is 37,292 (share of public institution 56%), GB supply 12,890 (Public institution share around 19%). In Baluchistan, NSIS cell only covers the public institutions, which gives supply to the labour market around 3,695. In AJK, the share of public vocational institutions in skilled workforce supply is 49% followed by FATA 51% and Islamabad 19% respectively. So far as number of the students per room is concerned, the institutions in Sindh accommodate 39 students in one room which is the highest of all. It was followed by Khyber Pakhtunkhwa having 32 students per room whereas the institutions in FATA have the least number of students per room which is equal to 14 students per room.
Table 9
Province Capacity Teaching staff dropout Enrollment Student
teacher rationo. of student/room
Pakistan 314706 13330 9153 (4%) 232340 17 21
Punjab 118587 8248 3099 (4%) 85790 10 15
sindh 49450 836 1343 (4%) 37292 45 39
EnROLLmEnT & AnALysisCHAPTER
4
30 Comparative Analysis of TVET Sector in Pakistan
Province Capacity Teaching staff dropout Enrollment Student
teacher rationo. of student/room
Khyber Pakhtunkhwa 88387 1512 2506 (3%) 73912 49 32
Baluchistan 2972 207 116 (3%) 3695 18 22
Gilgit Baltistan 14446 626 1290 (10%) 12890 21 15
AJK 12161 611 65 (1%) 5227 9 16
FATA 7248 341 606 (27%) 2230 7 14
islamabad 21455 949 128 (1%) 11304 12 18
figure 12: Skilled workforce supply to labour market
0102030405060708090
100
57 56
6
100
19
49 51
19
43 44
94
0
81
51 49
81
Private
Govt.
STATiSTiCS of TEChniCAl inSTiTuTES (AVErAgES)
The data in the table evaluates that 26% capacity is less in all the public and private institu-tions of Pakistan that urges attention to focus on decreasing the gap of capacity otherwise it shall continue to rise resulting into less supply of skilled labour force into the market. It can be expressed in other words that the current total capacity of the technical institutions stands at accommodation of 81836 students for education and training. The share of the private techni-cal institutions is only 11% that needs to be enhanced by inviting private sector for investment in this sector. The technical institution of Sindh supply skilled workforce is the highest (25998, 32%), followed by Khyber Pakhtunkhwa (25580, 31%) and Punjab (24104, 29%). The lowest supply is from institutions of Baluchistan, which is less than 1% that needs consistent work for enhancing its share.
If the performance of private technical institutions regarding share in supply of skilled la-bour force in different provinces of Pakistan is viewed, then it can be assessed that their share is miserably less in the contribution to the vocational trade. In Punjab, the share of private

31Comparative Analysis of TVET Sector in Pakistan
institutions is the highest with 18%, followed by Khyber Pakhtunkhwa 14% and Sindh 9%. The lowest student teacher ratio is found in Baluchistan (2:1), highest in Sindh (47:1), followed by Punjab (30:1) and Khyber Pakhtunkhwa, (29:1). The highest dropout is observed in Balu-chistan (10%), followed by AJK with 8% of total dropout. The concrete measures are needed for bringing reforms in the technical institutions towards bridging gaps developed in key perfor-mance indicators over the years which can guarantee in the supply of required skilled labour force to the emerging demand of the market.
Table 10
Province Capacity Teaching staff dropout EnrollmentStudent teacher ratio
no. od student/room
Pakistan 110184 2984 2665 (3%) 81836 27 32
Punjab 51250 796 1775 (7%) 24104 30 65
Sindh 20800 556 536 (2%) 25998 47 41
khyber Pakhtunkhwa 25580 870 422 (5%) 25580 29 35
Baluchistan 560 96 18 (10%) 187 2 5
gilgit Baltistan 1949 88 60 (3%) 1786 20 25
Ajk 6290 126 146 (8%) 1927 15 27
fATA 765 52 19 (3%) 600 12 39
islamabad 2990 400 111 (7%) 1654 4 15
figure 13: Teacher to Student ratio
0102030405060708090
100
82 91 86100 100 100 100 100
18 9 140 0 0 0 0
Private
Govt.
ProVinCiAl diSTriBuTion of TEChniCAl & VoCATionAl inSTiTuTionS
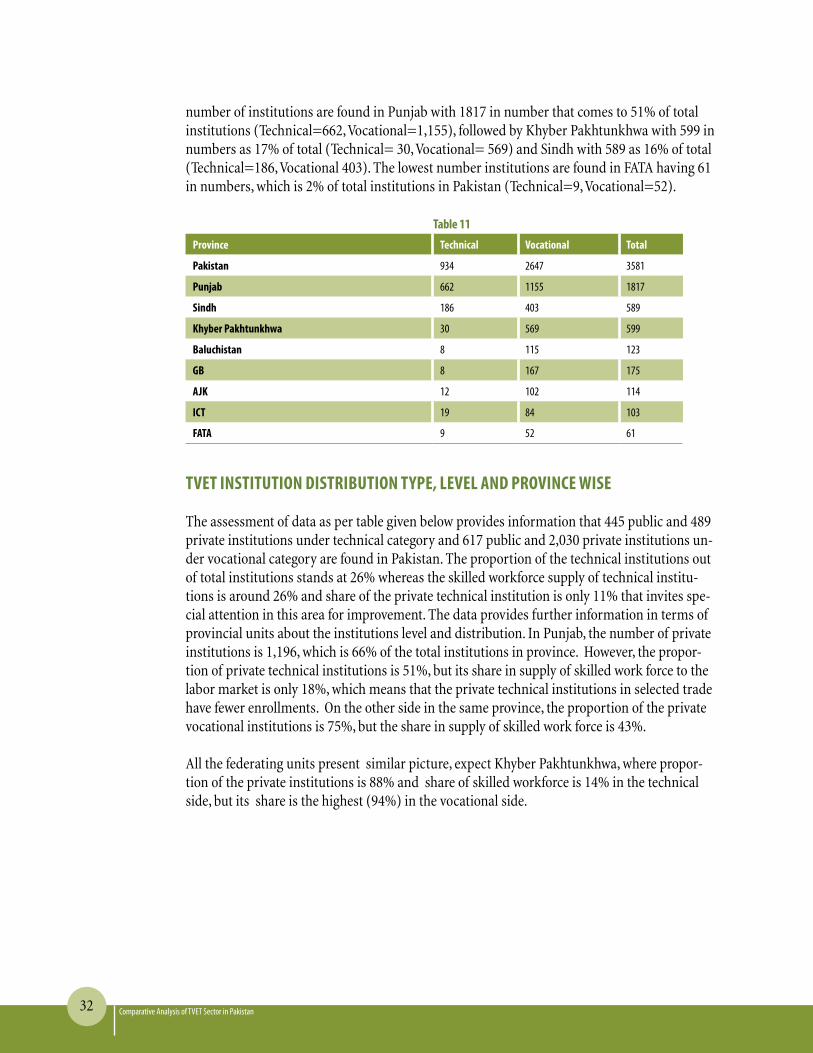
The data given in the Table 11 indicates about the status of all the public private institutions in Pakistan and its provinces. As per gathered statistics, there are 3,581 institutions working in Pakistan out of which 934 are technical and 2,647 are vocational institutions. The highest
32 Comparative Analysis of TVET Sector in Pakistan
number of institutions are found in Punjab with 1817 in number that comes to 51% of total institutions (Technical=662, Vocational=1,155), followed by Khyber Pakhtunkhwa with 599 in numbers as 17% of total (Technical= 30, Vocational= 569) and Sindh with 589 as 16% of total (Technical=186, Vocational 403). The lowest number institutions are found in FATA having 61 in numbers, which is 2% of total institutions in Pakistan (Technical=9, Vocational=52).
Table 11
Province Technical Vocational Total
Pakistan 934 2647 3581
Punjab 662 1155 1817
Sindh 186 403 589
khyber Pakhtunkhwa 30 569 599
Baluchistan 8 115 123
gB 8 167 175
Ajk 12 102 114
iCT 19 84 103
fATA 9 52 61
TVET inSTiTuTion diSTriBuTion TyPE, lEVEl And ProVinCE WiSE
The assessment of data as per table given below provides information that 445 public and 489 private institutions under technical category and 617 public and 2,030 private institutions un-der vocational category are found in Pakistan. The proportion of the technical institutions out of total institutions stands at 26% whereas the skilled workforce supply of technical institu-tions is around 26% and share of the private technical institution is only 11% that invites spe-cial attention in this area for improvement. The data provides further information in terms of provincial units about the institutions level and distribution. In Punjab, the number of private institutions is 1,196, which is 66% of the total institutions in province. However, the propor-tion of private technical institutions is 51%, but its share in supply of skilled work force to the labor market is only 18%, which means that the private technical institutions in selected trade have fewer enrollments. On the other side in the same province, the proportion of the private vocational institutions is 75%, but the share in supply of skilled work force is 43%.
All the federating units present similar picture, expect Khyber Pakhtunkhwa, where propor-tion of the private institutions is 88% and share of skilled workforce is 14% in the technical side, but its share is the highest (94%) in the vocational side.

33Comparative Analysis of TVET Sector in Pakistan
Table 12
ProvinceTechnical Vocational
g.TotalPublic Private Public Private
Pakistan 445 489 617 2030 3581
Punjab 337 325 283 872 1817
sindh 65 121 127 276 589
Khyber Pakhtunkhwa 26 4 44 525 599
Baluchistan 2 10 34 81 127
GB 1 7 25 142 175
AJK 4 4 44 58 110iCT 3 16 34 50 103
FATA 7 2 26 26 61
gEndEr WiSE diSTriBuTion of TVET inSTiTuTionS
The evaluation of data in Table 13 shows information about gender distribution of the in-stitutions. On the average, 40% male specific institutions, 42% female institutions and 18% (Majority private institutions) for both genders are found in the country. Likewise in Punjab, the proportion of male institutions is 36&, female institutions 44% and co-education 20%. In Sindh, the proportion of male institutions is 32% followed by female 36% and 32 institutions for both gender. In Khyber Pakhtunkhwa, the proportion of male institutions is 71%, female 24% and 5% institutions for both gender. In Baluchistan, the proportion of male institutions is 42% followed by female 47% and 11% for both genders. The suggestion can be made that institutions providing co-education must be increased in terms of enhancing their share in the development of human skill for provision of skill labour force to the market.
Table 13Province male female Co-education Total
Pakistan 1443 1497 644 3581
Punjab 662 793 362 1817
Sindh 190 210 189 589
khyber Pakhtunkhwa 426 141 32 599
Baluchistan 53 60 14 127
gB 28 121 26 175
Ajk 35 67 8 110
iCT 27 66 13 103
fATA 22 39 0 61
34 Comparative Analysis of TVET Sector in Pakistan
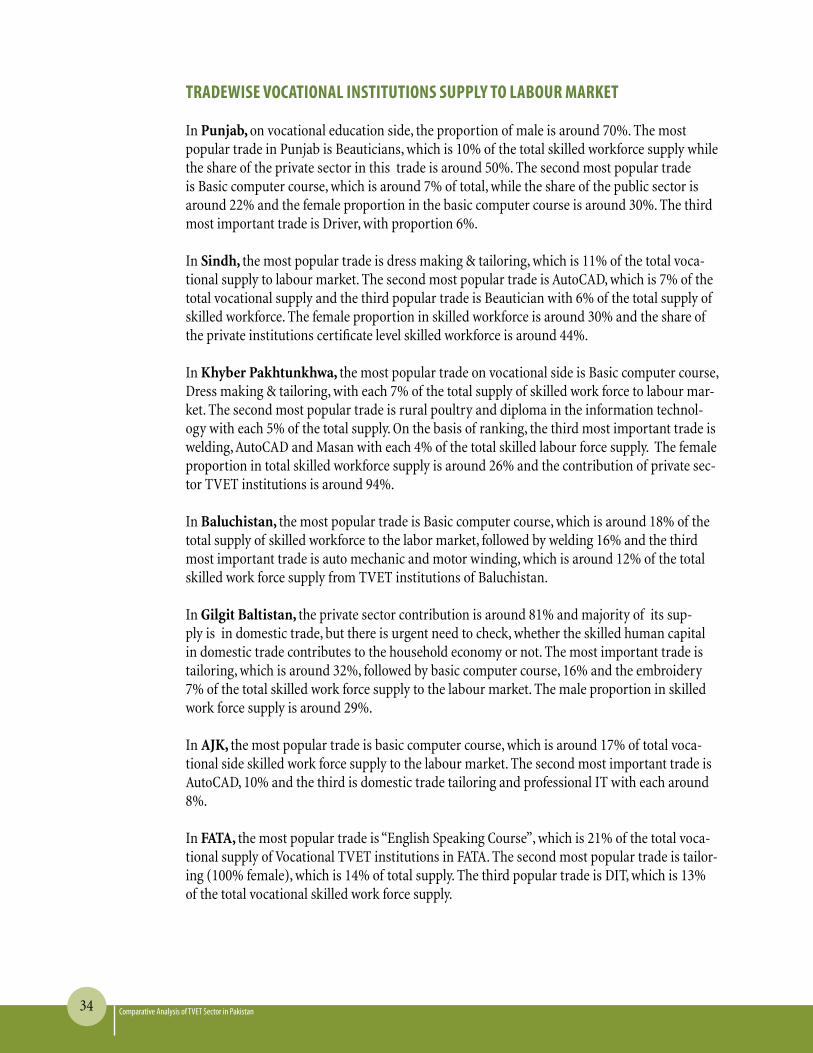
TrAdEWiSE VoCATionAl inSTiTuTionS SuPPly To lABour mArkET
In Punjab, on vocational education side, the proportion of male is around 70%. The most popular trade in Punjab is Beauticians, which is 10% of the total skilled workforce supply while the share of the private sector in this trade is around 50%. The second most popular trade is Basic computer course, which is around 7% of total, while the share of the public sector is around 22% and the female proportion in the basic computer course is around 30%. The third most important trade is Driver, with proportion 6%.
In Sindh, the most popular trade is dress making & tailoring, which is 11% of the total voca-tional supply to labour market. The second most popular trade is AutoCAD, which is 7% of the total vocational supply and the third popular trade is Beautician with 6% of the total supply of skilled workforce. The female proportion in skilled workforce is around 30% and the share of the private institutions certificate level skilled workforce is around 44%.
In Khyber Pakhtunkhwa, the most popular trade on vocational side is Basic computer course, Dress making & tailoring, with each 7% of the total supply of skilled work force to labour mar-ket. The second most popular trade is rural poultry and diploma in the information technol-ogy with each 5% of the total supply. On the basis of ranking, the third most important trade is welding, AutoCAD and Masan with each 4% of the total skilled labour force supply. The female proportion in total skilled workforce supply is around 26% and the contribution of private sec-tor TVET institutions is around 94%.
In Baluchistan, the most popular trade is Basic computer course, which is around 18% of the total supply of skilled workforce to the labor market, followed by welding 16% and the third most important trade is auto mechanic and motor winding, which is around 12% of the total skilled work force supply from TVET institutions of Baluchistan.
In Gilgit Baltistan, the private sector contribution is around 81% and majority of its sup-ply is in domestic trade, but there is urgent need to check, whether the skilled human capital in domestic trade contributes to the household economy or not. The most important trade is tailoring, which is around 32%, followed by basic computer course, 16% and the embroidery 7% of the total skilled work force supply to the labour market. The male proportion in skilled work force supply is around 29%.
In AJK, the most popular trade is basic computer course, which is around 17% of total voca-tional side skilled work force supply to the labour market. The second most important trade is AutoCAD, 10% and the third is domestic trade tailoring and professional IT with each around 8%.
In FATA, the most popular trade is “English Speaking Course”, which is 21% of the total voca-tional supply of Vocational TVET institutions in FATA. The second most popular trade is tailor-ing (100% female), which is 14% of total supply. The third popular trade is DIT, which is 13% of the total vocational skilled work force supply.

35Comparative Analysis of TVET Sector in Pakistan
In Islamabad, the Capital of Pakistan, the most popular trade is Beautician, which is around 15% of the total skilled work force supply to the labour market from its vocational institutions. The second most popular trade is basic computer 14% and the third popular trade is tailoring and dress making. The contribution of the private vocational institutions in skilled work force supply is around 81% and female proportion is around 45%.
TrAdE WiSE TEChniCAl inSTiTuTion SuPPly To lABour mArkET
The technical institutions include the colleges of technologies, polytechnics and mono-technic institutions, where the Diploma of Associate Engineer (DAE) is awarded by the concerned Board of technical Education (BTE). The total annual supply of technical institutions in differ-ent disciplines is around 81834, in which the share of public institutions is 89%.
In Punjab, the most popular trade is Electrical technology, which is around 20% of the total skilled workforce supply to labour market. The second most popular trade is mechanical and civil technology, with each 19% and the third popular technology is chemical 8% of total sup-ply in DAE courses to labour market. The private technical institutions share is around 18% and the gender ratio is 1:20 (1 female: 20 male) whereas the most popular technologies in female are computer, Food Processing and Fashion designing.
In Sindh, the total annual supply in technical education is around 25998 (32% of total) to the labour market. The most favorite trade is civil technology, which is around 27% while the sec-ond most popular technology is electrical (22%) and the third is mechanical technology 18% of the total supply of technical institutions to labour market. The gender ratio in the supply of skilled workforce in technology is 1:16 (1 female: 16 male) while the contribution of public sector institutions is around 9%.
In Khyber Pakhtunkhwa, the total annual supply in technical trade is around 18486 (23%) to labour market, but the share of public technical institutions is around 86%. The gender ratio in the supply of skilled workforce in technical trade is 1:33 (1 female: 33 male). The most popular trade on technical side is civil technology with 35%. The second popular technology is electri-cal 29% and the third is mechanical technology with 12% of the total technical annual supply of the technical institutions in the province. .
In Baluchistan, the lowest enrollment in technical institutions is observed and its share in supply of 81834 graduates in different technology is only 0.2%, while the share of population (15-29) year is 3.8%. The popular trade is electronics with 31%, followed by Electrical technol-ogy with 26% and the third popular technology is computer & Information technology.
The share of Gilgit Baltistan (GB) in the annual supply of 81834 graduates in different trade is 2.4%; the female proportion is “0” in the supply of skilled workforce in technical trade. The most popular trade is civil technology, which is around 66%, followed by the second most popular trade electrical technology with 28% and the third, Computer and information tech-nology with 5%. The supply of skilled workforce is squeezed to the limited technology, but the demand of the local economy is not addressed.

36 Comparative Analysis of TVET Sector in Pakistan
The share of Azad Jammu Kashmir (AJK) in the annual supply of the TVET graduates in technical field is 2.2% and the supply of technical workforce is squeezed to only “3” kind of technologies, which are civil, electrical and electronics. The gender ratio in technical supply of skilled workforce is 1:100 (1 female against 100 males).
The share of FATA in the annual supply of skilled workforce in the field of DAE is only 0.7%, while the share of population (15-29 year) is 2.2%. It means that intervention is needed to increase the supply of the skilled workforce from FATA. In FATA like other small provincial units (GB & AJK), the supply of skilled workforce in technical education is squeezed to fewer technologies.
The share of the Islamabad in the annual supply of skilled workforce in technical trade is around 2.0%, but the proportion of population (15-29) year is around 0.9%. The most popular technology is civil, which is 33% of the total supply from its technical institutions. The second most popular technology is mechanical (23%) and the third is electronics (15%). The gender ratio in skilled workforce supply is around 1:13 (1 female against 13 males).
37Comparative Analysis of TVET Sector in Pakistan
1. All the Boards of Technical Education (BTE) and Trade Testing boards (TTB), should be linked with national database for the purpose of planning, research and employability of the TVET graduates.
2. Web based linkage of the National database and provincial TVETA’s is essential to reduce skilled workforce supply and demand gaps.
3. The performance of the high proportion private TVET institutions is not satisfactory as compared to public TVET institutions, which indicate to take some necessary steps to improve the standard of training.
4. There should be controlling authority for the private TVET institutions or to ensure the reporting line between the provincial TVETA’s to create skilled workforce supply and demand balance.
5. TVET stakeholders and the policy makers in the short term should collect and analyze data about labor market needs; set the vision, goals and targets for the TVET system; initi-ate design of occupational standards, curricula, and student qualification requirements, with involvement of employers and other social partners.
6. All the TVET stakeholders’ policy makers, training providing institutions, employers, ministry of Overseas Pakistanis, Overseas Employment Corporation, Bureau of Emigra-tion and Overseas Employment and job seekers should use the same platform to reduce the gaps between skilled supply and demand of skilled labor force.
7. Sector wise digital classification would be addressed to prepare uniform list of vocational and technical education to reduce the variations.
8. All the provincial TEVTA’s need to establish job placement offices in each industrial zone to link the job seekers, training providers with employment promotors and need to ad-dress the labour market demand.
9. The economic transection effects should be addressed prior to its negative impact on labour market, for this purpose, each TEVTA’s needs to establish LMIS Cell.
COnCLUsiOn & RECOmmEnDATiOnsCHAPTER
5
38 Comparative Analysis of TVET Sector in Pakistan
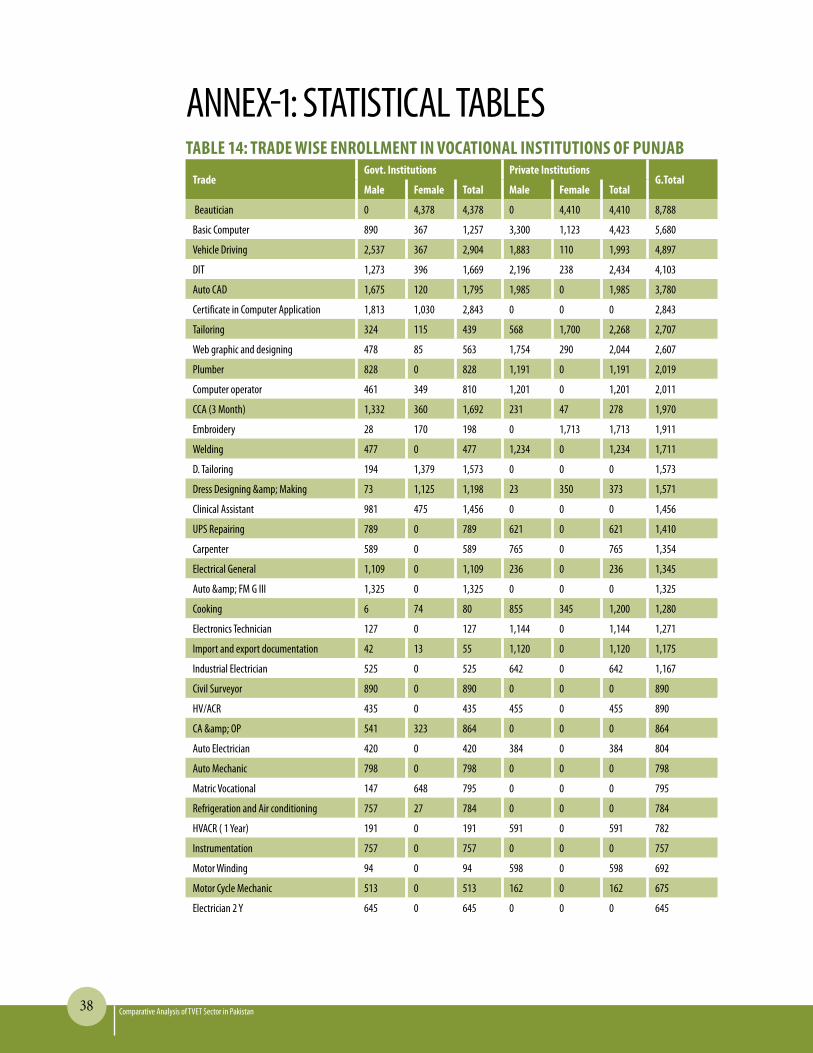
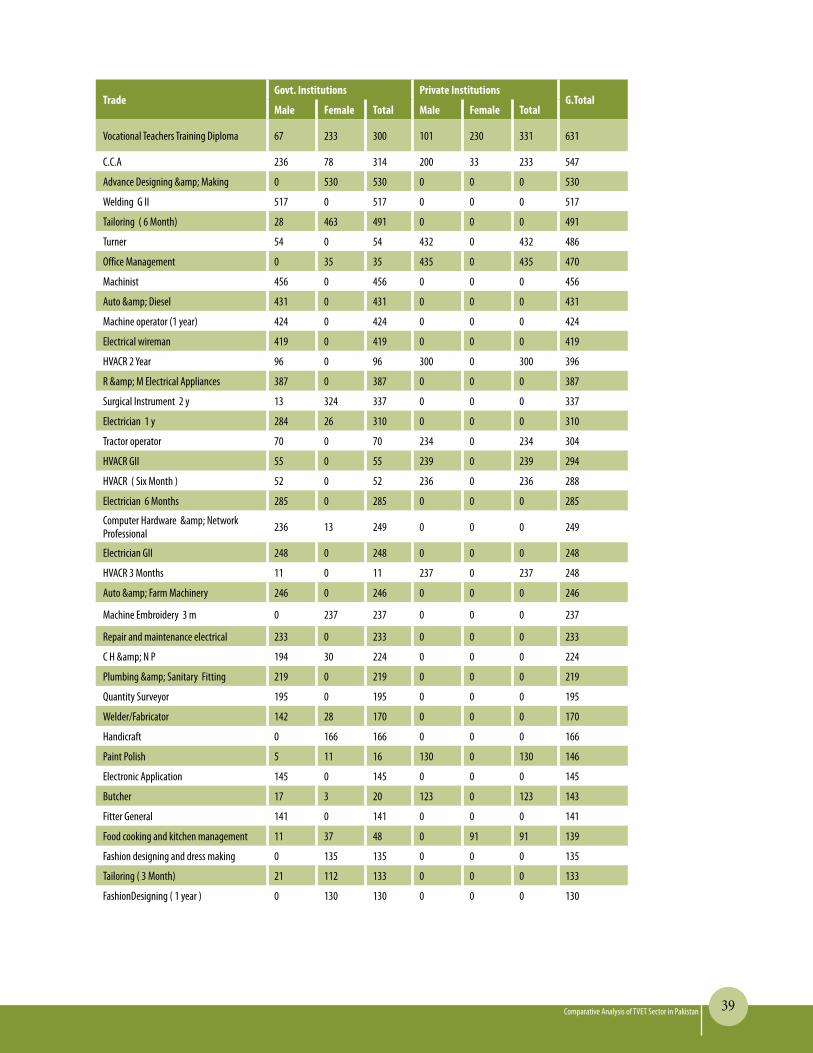
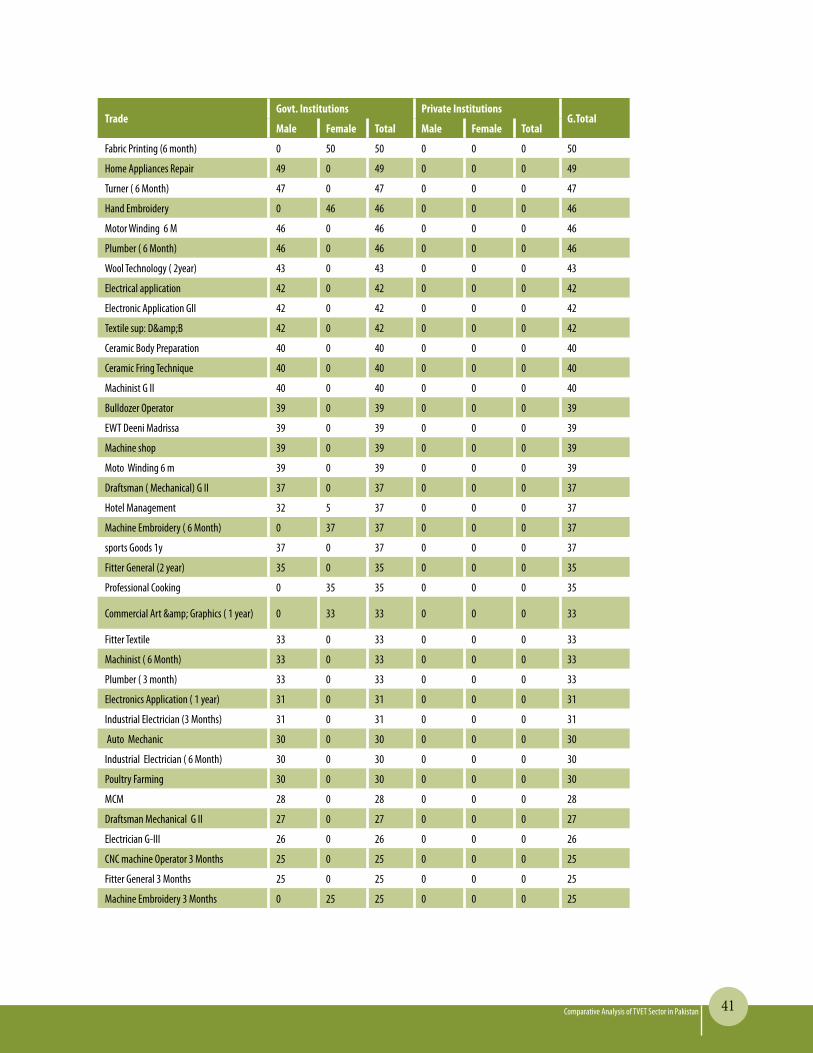
AnnEx-1: sTATisTiCAL TABLEs TABlE 14: TrAdE WiSE EnrollmEnT in VoCATionAl inSTiTuTionS of PunjAB
Tradegovt. institutions Private institutions
g.Totalmale female Total male female Total
Beautician 0 4,378 4,378 0 4,410 4,410 8,788
Basic Computer 890 367 1,257 3,300 1,123 4,423 5,680
vehicle Driving 2,537 367 2,904 1,883 110 1,993 4,897
DiT 1,273 396 1,669 2,196 238 2,434 4,103
Auto CAD 1,675 120 1,795 1,985 0 1,985 3,780
Certificate in Computer Application 1,813 1,030 2,843 0 0 0 2,843
Tailoring 324 115 439 568 1,700 2,268 2,707
Web graphic and designing 478 85 563 1,754 290 2,044 2,607
Plumber 828 0 828 1,191 0 1,191 2,019
Computer operator 461 349 810 1,201 0 1,201 2,011
CCA (3 month) 1,332 360 1,692 231 47 278 1,970
Embroidery 28 170 198 0 1,713 1,713 1,911
Welding 477 0 477 1,234 0 1,234 1,711
D. Tailoring 194 1,379 1,573 0 0 0 1,573
Dress Designing & making 73 1,125 1,198 23 350 373 1,571
Clinical Assistant 981 475 1,456 0 0 0 1,456
UPs Repairing 789 0 789 621 0 621 1,410
Carpenter 589 0 589 765 0 765 1,354
Electrical General 1,109 0 1,109 236 0 236 1,345
Auto & Fm G iii 1,325 0 1,325 0 0 0 1,325
Cooking 6 74 80 855 345 1,200 1,280
Electronics Technician 127 0 127 1,144 0 1,144 1,271
import and export documentation 42 13 55 1,120 0 1,120 1,175
industrial Electrician 525 0 525 642 0 642 1,167
Civil surveyor 890 0 890 0 0 0 890
Hv/ACR 435 0 435 455 0 455 890
CA & OP 541 323 864 0 0 0 864
Auto Electrician 420 0 420 384 0 384 804
Auto mechanic 798 0 798 0 0 0 798
matric vocational 147 648 795 0 0 0 795
Refrigeration and Air conditioning 757 27 784 0 0 0 784
HvACR ( 1 year) 191 0 191 591 0 591 782
instrumentation 757 0 757 0 0 0 757
motor Winding 94 0 94 598 0 598 692
motor Cycle mechanic 513 0 513 162 0 162 675
Electrician 2 y 645 0 645 0 0 0 645
39Comparative Analysis of TVET Sector in Pakistan
Tradegovt. institutions Private institutions
g.Totalmale female Total male female Total
vocational Teachers Training Diploma 67 233 300 101 230 331 631
C.C.A 236 78 314 200 33 233 547
Advance Designing & making 0 530 530 0 0 0 530
Welding G ii 517 0 517 0 0 0 517
Tailoring ( 6 month) 28 463 491 0 0 0 491
Turner 54 0 54 432 0 432 486
Office management 0 35 35 435 0 435 470
machinist 456 0 456 0 0 0 456
Auto & Diesel 431 0 431 0 0 0 431
machine operator (1 year) 424 0 424 0 0 0 424
Electrical wireman 419 0 419 0 0 0 419
HvACR 2 year 96 0 96 300 0 300 396
R & m Electrical Appliances 387 0 387 0 0 0 387
surgical instrument 2 y 13 324 337 0 0 0 337
Electrician 1 y 284 26 310 0 0 0 310
Tractor operator 70 0 70 234 0 234 304
HvACR Gii 55 0 55 239 0 239 294
HvACR ( six month ) 52 0 52 236 0 236 288
Electrician 6 months 285 0 285 0 0 0 285
Computer Hardware & network Professional 236 13 249 0 0 0 249
Electrician Gii 248 0 248 0 0 0 248
HvACR 3 months 11 0 11 237 0 237 248
Auto & Farm machinery 246 0 246 0 0 0 246
machine Embroidery 3 m 0 237 237 0 0 0 237
Repair and maintenance electrical 233 0 233 0 0 0 233
C H & n P 194 30 224 0 0 0 224
Plumbing & sanitary Fitting 219 0 219 0 0 0 219
Quantity surveyor 195 0 195 0 0 0 195
Welder/Fabricator 142 28 170 0 0 0 170
Handicraft 0 166 166 0 0 0 166
Paint Polish 5 11 16 130 0 130 146
Electronic Application 145 0 145 0 0 0 145
Butcher 17 3 20 123 0 123 143
Fitter General 141 0 141 0 0 0 141
Food cooking and kitchen management 11 37 48 0 91 91 139
Fashion designing and dress making 0 135 135 0 0 0 135
Tailoring ( 3 month) 21 112 133 0 0 0 133
FashionDesigning ( 1 year ) 0 130 130 0 0 0 130

40 Comparative Analysis of TVET Sector in Pakistan
Tradegovt. institutions Private institutions
g.Totalmale female Total male female Total
Agricultural field assistant 118 0 118 0 0 0 118
industrial stitching 43 73 116 0 0 0 116
Tailoring 1 year 77 38 115 0 0 0 115
Draftsman Civil ( 1 year) 113 0 113 0 0 0 113
ADDm 0 106 106 0 0 0 106
Auto & Farm machinery G-ii 106 0 106 0 0 0 106
City & Guild Advance 106 0 106 0 0 0 106
Foundry & Pattern making 104 0 104 0 0 0 104
mechanical 104 0 104 0 0 0 104
Kashigari 40 60 100 0 0 0 100
Electronics ( 2 year) 99 0 99 0 0 0 99
Draftsman mechanical 98 0 98 0 0 0 98
machinist G iii 97 0 97 0 0 0 97
motor winding (One year ) 74 15 89 0 0 0 89
Halal Butcher 65 20 85 0 0 0 85
industrial garment stitching 17 65 82 0 0 0 82
Tractor Operator 6 m 81 0 81 0 0 0 81
Welder Arc. & Gas 78 0 78 0 0 0 78
Auto Farm machinery 77 0 77 0 0 0 77
welder 2 y 77 0 77 0 0 0 77
Fitter General G ii 75 0 75 0 0 0 75
Basic Dress Design 0 19 19 0 55 55 74
veterinary Assistant 73 0 73 0 0 0 73
Welder 6 months 71 0 71 0 0 0 71
D.Com 69 69 0 0 0 69
mobile phone repairing 68 0 68 0 0 0 68
Hair & skin Care ( one year) 0 67 67 0 0 0 67
machinist ( 24 m) 67 0 67 0 0 0 67
Tractor and diesel mechanic 65 0 65 0 0 0 65
met & Welding 64 0 64 0 0 0 64
Draftsman Civil ( 24 m) 62 0 62 0 0 0 62
Draftsman ( Civil ) G-ii 61 0 61 0 0 0 61
Textile Fitter 61 0 61 0 0 0 61
Draftsman ( Civil ) G-iii 60 0 60 0 0 0 60
Computer Textile Designing 42 17 59 0 0 0 59
welder 1 year 59 0 59 0 0 0 59
maudling& modeling 56 0 56 0 0 0 56
Plumber ( one year ) 52 0 52 0 0 0 52
Textile Weaving 52 0 52 0 0 0 52
41Comparative Analysis of TVET Sector in Pakistan
Tradegovt. institutions Private institutions
g.Totalmale female Total male female Total
Fabric Printing (6 month) 0 50 50 0 0 0 50
Home Appliances Repair 49 0 49 0 0 0 49
Turner ( 6 month) 47 0 47 0 0 0 47
Hand Embroidery 0 46 46 0 0 0 46
motor Winding 6 m 46 0 46 0 0 0 46
Plumber ( 6 month) 46 0 46 0 0 0 46
Wool Technology ( 2year) 43 0 43 0 0 0 43
Electrical application 42 0 42 0 0 0 42
Electronic Application Gii 42 0 42 0 0 0 42
Textile sup: D&B 42 0 42 0 0 0 42
Ceramic Body Preparation 40 0 40 0 0 0 40
Ceramic Fring Technique 40 0 40 0 0 0 40
machinist G ii 40 0 40 0 0 0 40
Bulldozer Operator 39 0 39 0 0 0 39
EWT Deeni madrissa 39 0 39 0 0 0 39
machine shop 39 0 39 0 0 0 39
moto Winding 6 m 39 0 39 0 0 0 39
Draftsman ( mechanical) G ii 37 0 37 0 0 0 37
Hotel management 32 5 37 0 0 0 37
machine Embroidery ( 6 month) 0 37 37 0 0 0 37
sports Goods 1y 37 0 37 0 0 0 37
Fitter General (2 year) 35 0 35 0 0 0 35
Professional Cooking 0 35 35 0 0 0 35
Commercial Art & Graphics ( 1 year) 0 33 33 0 0 0 33
Fitter Textile 33 0 33 0 0 0 33
machinist ( 6 month) 33 0 33 0 0 0 33
Plumber ( 3 month) 33 0 33 0 0 0 33
Electronics Application ( 1 year) 31 0 31 0 0 0 31
industrial Electrician (3 months) 31 0 31 0 0 0 31
Auto mechanic 30 0 30 0 0 0 30
industrial Electrician ( 6 month) 30 0 30 0 0 0 30
Poultry Farming 30 0 30 0 0 0 30
mCm 28 0 28 0 0 0 28
Draftsman mechanical G ii 27 0 27 0 0 0 27
Electrician G-iii 26 0 26 0 0 0 26
CnC machine Operator 3 months 25 0 25 0 0 0 25
Fitter General 3 months 25 0 25 0 0 0 25
machine Embroidery 3 months 0 25 25 0 0 0 25

42 Comparative Analysis of TVET Sector in Pakistan
Tradegovt. institutions Private institutions
g.Totalmale female Total male female Total
machinist s/C 24 0 24 0 0 0 24
Civil Draftsman 23 0 23 0 0 0 23
Hair & skin Care 0 23 23 0 0 0 23
Plastic blow and injection molding 22 0 22 0 0 0 22
Fabric Printing 0 21 21 0 0 0 21
industrial Electronics G-iii 21 0 21 0 0 0 21
Draftsman mechanical 2 years 20 0 20 0 0 0 20
Fitter General ( G ii Level) 20 0 20 0 0 0 20
Turner 1 year 18 0 18 0 0 0 18
Basic measurement 16 0 16 0 0 0 16
Basic safety Precautions 15 0 15 0 0 0 15
Glazing & Decoration 3 months 0 15 15 0 0 0 15
industrial Electronics 15 0 15 0 0 0 15
Welding (3 months) 15 0 15 0 0 0 15
CDm ( 1 y ) 0 14 14 0 0 0 14
Kitchen Gardening 0 13 13 0 0 0 13
Plumber G ii 12 0 12 0 0 0 12
Hair& skin Care (3 month) 0 11 11 0 0 0 11
Tractor mechanic Giii 11 0 11 0 0 0 11
spray Painting ( 6 month) 10 0 10 0 0 0 10
Textile sup: spinning 10 0 10 0 0 0 10
Draftsman mechanical G-iii 9 0 9 0 0 0 9
Welding G ii 9 0 9 0 0 0 9
Draftsman mechanical 8 0 8 0 0 0 8
spoken & Business English 0 8 8 0 0 0 8
Welding ( six month) morning 8 0 8 0 0 0 8
Polishing & Finishing 7 0 7 0 0 0 7
Fabric Printing (3 month) 0 2 2 0 0 0 2
Total 34,013 15,279 49,292 25,806 10,735 36,541 85,833
TABlE 15: TrAdE WiSE EnrollmEnT in VoCATionAl inSTiTuTionS of Sindh
Tradegovt. institutions Private institutions
g.TotalBoys girls Total Boys girls Total
AutoCAD 1,278 235 1,513 878 102 980 2,493
Beautician 0 865 865 6 1,489 1,495 2,360
Basic Computer 0 0 0 1,378 876 2,254 2,254
Tailoring and Dress making 123 1,263 1,386 395 2,165 2,560 3,946
Fashion Designing 0 582 582 340 178 518 1,100
Professional iT 0 0 0 785 296 1,081 1,081

43Comparative Analysis of TVET Sector in Pakistan
Tradegovt. institutions Private institutions
g.TotalBoys girls Total Boys girls Total
Electrician 844 0 844 205 0 205 1,049
Computer Application & Programming 567 34 601 317 120 437 1,038
Ref: / AC 789 0 789 157 0 157 946
Welding 756 0 756 170 0 170 926
Advance Diploma information Technology 132 48 180 531 212 743 923
Garments making 0 0 0 247 659 906 906
Computer networking 347 122 469 392 33 425 894
DiT 0 0 0 390 348 738 738
RTv Electronics 720 0 720 0 0 0 720
Civil Drafting 442 0 442 275 0 275 717
Plumbing 511 0 511 204 0 204 715
Office Administration 236 383 619 38 35 73 692
Oracle DBA 456 233 689 0 0 0 689
machinist 453 0 453 218 0 218 671
Computer Operator 456 144 600 52 0 52 652
Office Automation 533 114 647 0 0 0 647
montessori Training 0 73 73 210 362 572 645
Electronics 471 0 471 164 0 164 635
Dress making & Designing 0 632 632 0 0 0 632
Computer Language 0 0 0 455 145 600 600
Auto mechanic 485 0 485 107 0 107 592
Accounting & Auditing 367 178 545 0 545
Computer Hardware 225 11 236 244 0 244 480
Wood Working 456 0 456 0 0 0 456
Carpentry 433 0 433 0 0 0 433
Hand & machine Embroidery 0 392 392 0 0 0 392
machine Embroidery/ Hand Embroidery & tailoring 0 125 125 0 265 265 390
Technical school Certificate (TsC-i) 143 231 374 0 0 0 374
Knitting 0 349 349 0 0 0 349
machine Embroidery 336 336 0 0 0 336
General Electrician 309 0 309 0 0 0 309
General Fitter 274 0 274 0 0 0 274
Cutting special/Cutting sewing normal 0 262 262 0 0 0 262
Turner 259 0 259 0 0 0 259
Business Administration (DBA) 125 32 157 65 30 95 252
B.ED 0 0 0 171 76 247 247
Tractor mechanic 246 0 246 0 0 0 246
stitching & sewing 0 233 233 0 0 0 233

44 Comparative Analysis of TVET Sector in Pakistan
Tradegovt. institutions Private institutions
g.TotalBoys girls Total Boys girls Total
industrial Electronics 219 0 219 0 0 0 219
Graphic Designer 0 0 0 132 78 210 210
i.P.C 202 0 202 0 0 0 202
Cabinet making 173 0 173 0 0 0 173
steganography 157 157 0 0 0 157
Arch & interior 0 155 155 0 0 0 155
Wiremen 0 0 0 155 0 155 155
mechanical Drafting 133 0 133 0 0 0 133
General machinist 125 0 125 0 0 0 125
m/ shop Group 117 0 117 0 0 0 117
Auto Electrician 0 0 0 99 0 99 99
motor winding 0 0 0 79 0 79 79
secretarial skill 0 69 69 0 0 0 69
drawing & Arts 0 0 0 29 33 62 62
Glass work 0 0 0 45 0 45 45
Business iT 0 0 0 28 11 39 39
Lab Technician 0 0 0 25 13 38 38
Printing & Graphics Art 38 0 38 0 0 0 38
Typing 0 0 0 38 0 38 38
DOm 0 21 21 0 0 0 21
mobile Repairing 20 0 20 0 0 0 20
Total 13,620 7,122 20,742 9,024 7,526 16,550 37,292
TABlE 16: TrAdE WiSE EnrollmEnT in VoCATionAl inSTiTuTionS of khyBEr PAkhTunkhWA
Tradegovt. institutions Private institutions
g. TotalBoys girls Total Boys girls Total
Basic Computer 103 18 121 4,423 422 4,845 4,966
Tailoring & Dress making 218 143 361 2,278 2,271 4,549 4,910
Rural Poultry 0 0 0 456 3,088 3,544 3,544
DiT 211 23 234 3,045 179 3,224 3,458
Welding 55 0 55 3,101 0 3,101 3,156
AutoCAD 0 0 0 2,901 0 2,901 2,901
mason 0 0 0 2,819 0 2,819 2,819
Leather Work 0 43 43 2,567 106 2,673 2,716
Fabric Painting 0 51 51 2,234 279 2,513 2,564
machine Embroidery 12 122 134 11 2,219 2,230 2,364
Lathering & Cutting 0 89 89 2,245 0 2,245 2,334
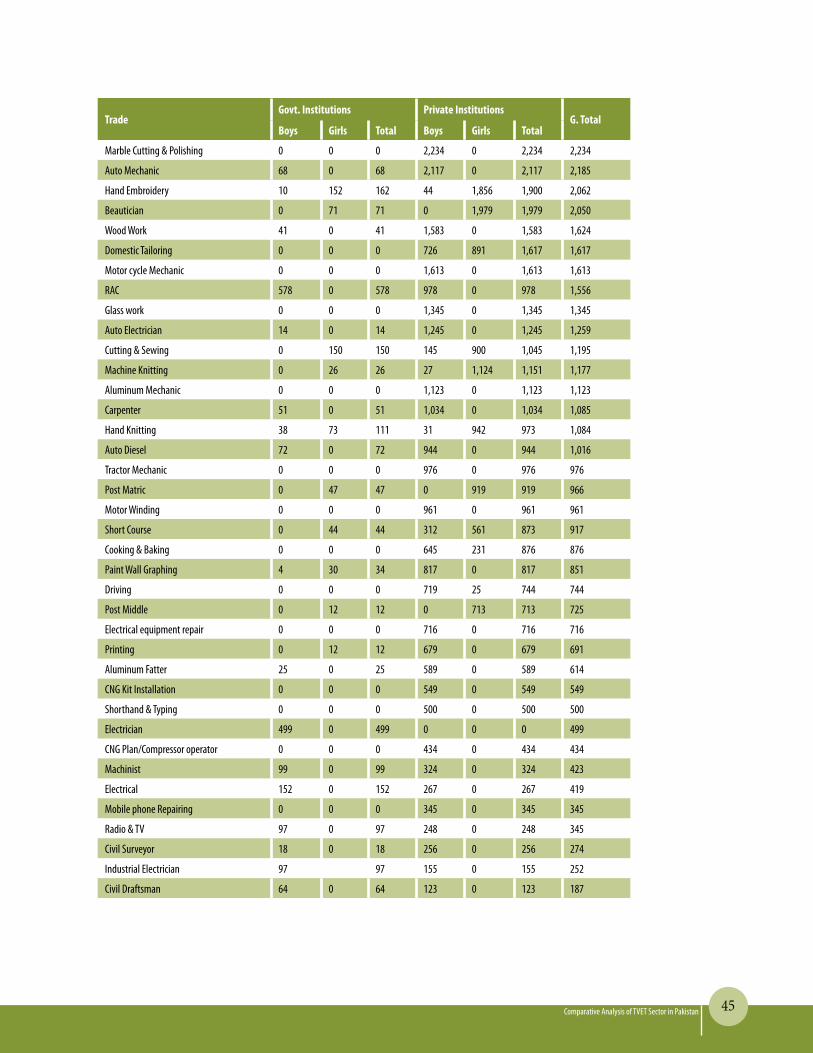
45Comparative Analysis of TVET Sector in Pakistan
Tradegovt. institutions Private institutions
g. TotalBoys girls Total Boys girls Total
marble Cutting & Polishing 0 0 0 2,234 0 2,234 2,234
Auto mechanic 68 0 68 2,117 0 2,117 2,185
Hand Embroidery 10 152 162 44 1,856 1,900 2,062
Beautician 0 71 71 0 1,979 1,979 2,050
Wood Work 41 0 41 1,583 0 1,583 1,624
Domestic Tailoring 0 0 0 726 891 1,617 1,617
motor cycle mechanic 0 0 0 1,613 0 1,613 1,613
RAC 578 0 578 978 0 978 1,556
Glass work 0 0 0 1,345 0 1,345 1,345
Auto Electrician 14 0 14 1,245 0 1,245 1,259
Cutting & sewing 0 150 150 145 900 1,045 1,195
machine Knitting 0 26 26 27 1,124 1,151 1,177
Aluminum mechanic 0 0 0 1,123 0 1,123 1,123
Carpenter 51 0 51 1,034 0 1,034 1,085
Hand Knitting 38 73 111 31 942 973 1,084
Auto Diesel 72 0 72 944 0 944 1,016
Tractor mechanic 0 0 0 976 0 976 976
Post matric 0 47 47 0 919 919 966
motor Winding 0 0 0 961 0 961 961
short Course 0 44 44 312 561 873 917
Cooking & Baking 0 0 0 645 231 876 876
Paint Wall Graphing 4 30 34 817 0 817 851
Driving 0 0 0 719 25 744 744
Post middle 0 12 12 0 713 713 725
Electrical equipment repair 0 0 0 716 0 716 716
Printing 0 12 12 679 0 679 691
Aluminum Fatter 25 0 25 589 0 589 614
CnG Kit installation 0 0 0 549 0 549 549
shorthand & Typing 0 0 0 500 0 500 500
Electrician 499 0 499 0 0 0 499
CnG Plan/Compressor operator 0 0 0 434 0 434 434
machinist 99 0 99 324 0 324 423
Electrical 152 0 152 267 0 267 419
mobile phone Repairing 0 0 0 345 0 345 345
Radio & Tv 97 0 97 248 0 248 345
Civil surveyor 18 0 18 256 0 256 274
industrial Electrician 97 97 155 0 155 252
Civil Draftsman 64 0 64 123 0 123 187
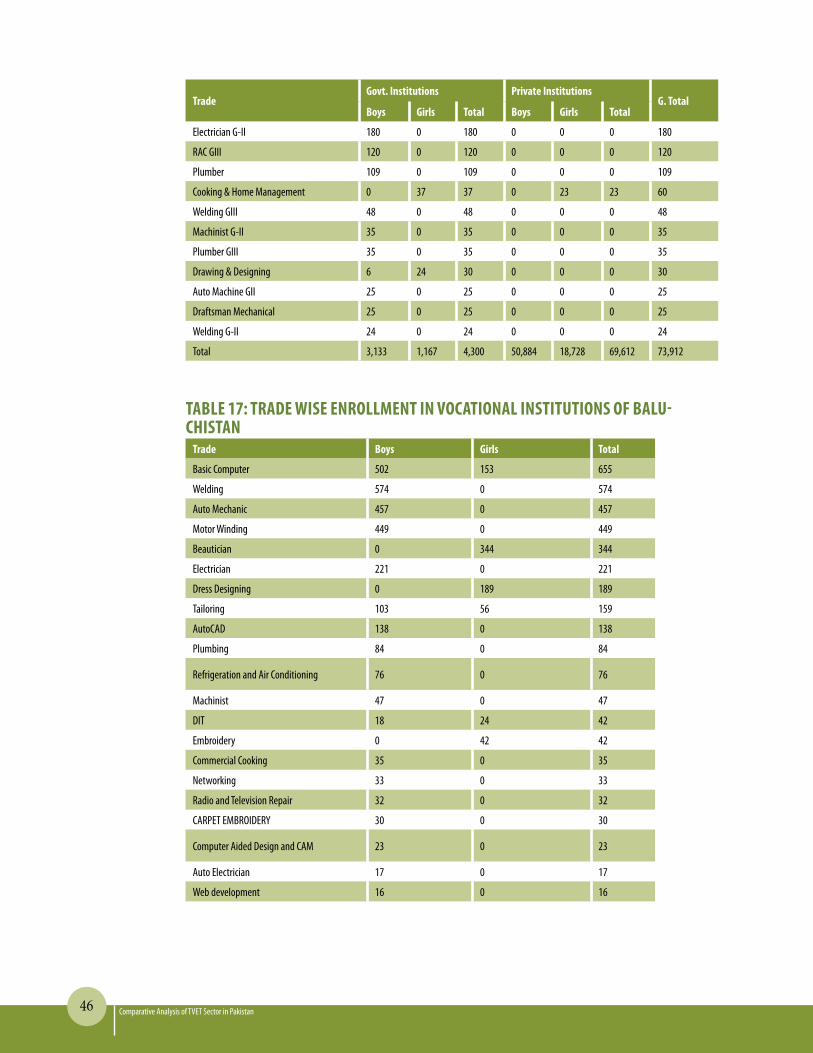
46 Comparative Analysis of TVET Sector in Pakistan
Tradegovt. institutions Private institutions
g. TotalBoys girls Total Boys girls Total
Electrician G-ii 180 0 180 0 0 0 180
RAC Giii 120 0 120 0 0 0 120
Plumber 109 0 109 0 0 0 109
Cooking & Home management 0 37 37 0 23 23 60
Welding Giii 48 0 48 0 0 0 48
machinist G-ii 35 0 35 0 0 0 35
Plumber Giii 35 0 35 0 0 0 35
Drawing & Designing 6 24 30 0 0 0 30
Auto machine Gii 25 0 25 0 0 0 25
Draftsman mechanical 25 0 25 0 0 0 25
Welding G-ii 24 0 24 0 0 0 24
Total 3,133 1,167 4,300 50,884 18,728 69,612 73,912
TABlE 17: TrAdE WiSE EnrollmEnT in VoCATionAl inSTiTuTionS of BAlu-ChiSTAn
Trade Boys girls Total
Basic Computer 502 153 655
Welding 574 0 574
Auto mechanic 457 0 457
motor Winding 449 0 449
Beautician 0 344 344
Electrician 221 0 221
Dress Designing 0 189 189
Tailoring 103 56 159
AutoCAD 138 0 138
Plumbing 84 0 84
Refrigeration and Air Conditioning 76 0 76
machinist 47 0 47
DiT 18 24 42
Embroidery 0 42 42
Commercial Cooking 35 0 35
networking 33 0 33
Radio and Television Repair 32 0 32
CARPET EmBROiDERy 30 0 30
Computer Aided Design and CAm 23 0 23
Auto Electrician 17 0 17
Web development 16 0 16

47Comparative Analysis of TVET Sector in Pakistan
Trade Boys girls Total
Civil Draftsman 14 0 14
secretarial 0 14 14
maintenance mechanic 4 0 4
Total 2,873 822 3,695
TABlE 18: TrAdE WiSE EnrollmEnT in VoCATionAl inSTiTuTionS of gilgiT BAl-TiSTAn
Tradegovt. institutes Private institutes
g. TotalBoys girls Total Boys girls Total
Tailoring, sewing 216 539 755 612 2,778 3,390 4,145
Basic Computer Course 984 12 996 578 459 1,037 2,033
Cutting, Drafting,Embroidery,Knitting 0 73 73 9 770 779 852
sewing , Knitting & Cutting 80 215 295 0 326 326 621
Beautician 0 0 0 0 489 489 489
English Language 0 0 0 210 270 480 480
Embroidery 0 0 0 0 455 455 455
Handicraft 0 0 0 0 434 434 434
Decoration & Designing 0 0 0 26 254 280 280
Hand Embroidery,Tailoring 0 156 156 0 119 119 275
Handicraft 0 15 15 0 235 235 250
knitting & Cutting 0 0 0 0 232 232 232
Hand Craft 0 0 0 0 215 215 215
Wood spinning 0 25 25 103 57 160 185
Bag ,Purse making 0 0 0 0 120 120 120
AutoCAD 0 0 0 112 0 112 112
E-marketing 20 10 30 40 30 70 100
Adult Literacy 0 0 0 40 48 88 88
Hand Knitting 0 0 0 0 84 84 84
students of Class v to viii 0 0 0 80 0 80 80
Traditional Cap making 0 0 0 54 26 80 80
Drafting, Cutting,Tailoring,Hand Embroidery, Hand Knitting 0 0 0 0 70 70 70
Radio mechanic 18 0 18 49 0 49 67
sewing/Handicraft 0 0 0 0 60 60 60Computer Hardware & software Courses 0 0 0 31 24 55 55
Dress Designing 0 0 0 0 55 55 55
wood Craft 0 0 0 52 0 52 52
Baskets making 0 0 0 6 45 51 51
Weaving shawl 0 0 0 3 48 51 51
Building Electrician 0 0 0 46 0 46 46

48 Comparative Analysis of TVET Sector in Pakistan
Tradegovt. institutes Private institutes
g. TotalBoys girls Total Boys girls Total
italian Dhow 0 42 42 0 3 3 45
shorthand 0 0 0 45 0 45 45
Over Lock &Peeko 0 0 0 0 40 40 40
Plumbing 0 0 0 38 0 38 38
Typing short Hand 16 0 16 20 0 20 36
E-Publishing 0 0 0 15 18 33 33
UPs 0 0 0 32 0 32 32
Cloth sewing 0 0 0 0 30 30 30
Electrician 15 0 15 15 0 15 30
Curtin making 0 0 0 0 26 26 26
ZariTela Embroidery 0 0 0 0 26 26 26
Arts of Painting 0 0 0 14 11 25 25
Technical iT 0 0 0 10 15 25 25
sharma 0 0 0 0 24 24 24
Dying 0 0 0 0 21 21 21
Gems Cutting 20 0 20 5 18 0 20
mobile Repairing 0 0 0 20 0 20 20
Fruit Processing 5 14 19 0 0 0 19
solar installation 0 0 0 19 0 19 19
Cross stitching 0 0 0 0 18 18 18
Cultural Heritage 0 0 0 0 15 15 15
Hunza Embroidery 0 0 0 0 14 14 14
Koresha 0 0 0 0 13 13 13
Press Designing 0 0 0 0 13 13 13
Language C++ 0 0 0 12 0 12 12
Threat netting 0 0 0 0 11 11 11
Pattu Weaving 0 0 0 2 18 20 20
Rug Weaving 0 0 0 0 10 10 10
Technical Education 0 0 0 0 10 10 10
Web Developing 0 0 0 10 0 10 10
Polishing 0 0 0 6 3 9 9
CharaBafi 0 0 0 3 5 8 8
machin Cutting 0 0 0 0 6 6 6
software 0 0 0 4 2 6 6
Photography 0 0 0 0 5 5 5
spinning 0 0 0 1 4 5 5
Lattice making 0 0 0 4 0 4 4
scissor Cutting 0 0 0 0 4 4 4
Carving 0 0 0 3 0 3 3
G-Total 1,374 1,101 2,475 2,329 8,086 10,415 12,890
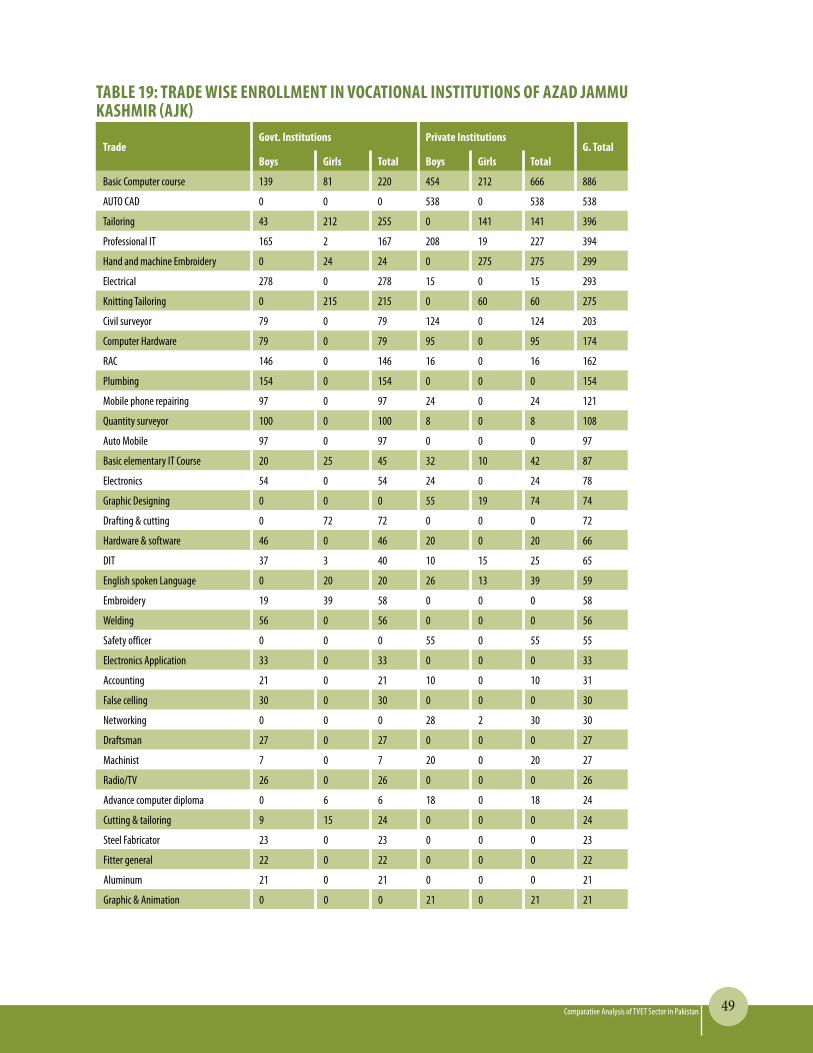
49Comparative Analysis of TVET Sector in Pakistan
TABlE 19: TrAdE WiSE EnrollmEnT in VoCATionAl inSTiTuTionS of AzAd jAmmu kAShmir (Ajk)
Tradegovt. institutions Private institutions
g. TotalBoys girls Total Boys girls Total
Basic Computer course 139 81 220 454 212 666 886
AUTO CAD 0 0 0 538 0 538 538
Tailoring 43 212 255 0 141 141 396
Professional iT 165 2 167 208 19 227 394
Hand and machine Embroidery 0 24 24 0 275 275 299
Electrical 278 0 278 15 0 15 293
Knitting Tailoring 0 215 215 0 60 60 275
Civil surveyor 79 0 79 124 0 124 203
Computer Hardware 79 0 79 95 0 95 174
RAC 146 0 146 16 0 16 162
Plumbing 154 0 154 0 0 0 154
mobile phone repairing 97 0 97 24 0 24 121
Quantity surveyor 100 0 100 8 0 8 108
Auto mobile 97 0 97 0 0 0 97
Basic elementary iT Course 20 25 45 32 10 42 87
Electronics 54 0 54 24 0 24 78
Graphic Designing 0 0 0 55 19 74 74
Drafting & cutting 0 72 72 0 0 0 72
Hardware & software 46 0 46 20 0 20 66
DiT 37 3 40 10 15 25 65
English spoken Language 0 20 20 26 13 39 59
Embroidery 19 39 58 0 0 0 58
Welding 56 0 56 0 0 0 56
safety officer 0 0 0 55 0 55 55
Electronics Application 33 0 33 0 0 0 33
Accounting 21 0 21 10 0 10 31
False celling 30 0 30 0 0 0 30
networking 0 0 0 28 2 30 30
Draftsman 27 0 27 0 0 0 27
machinist 7 0 7 20 0 20 27
Radio/Tv 26 0 26 0 0 0 26
Advance computer diploma 0 6 6 18 0 18 24
Cutting & tailoring 9 15 24 0 0 0 24
steel Fabricator 23 0 23 0 0 0 23
Fitter general 22 0 22 0 0 0 22
Aluminum 21 0 21 0 0 0 21
Graphic & Animation 0 0 0 21 0 21 21
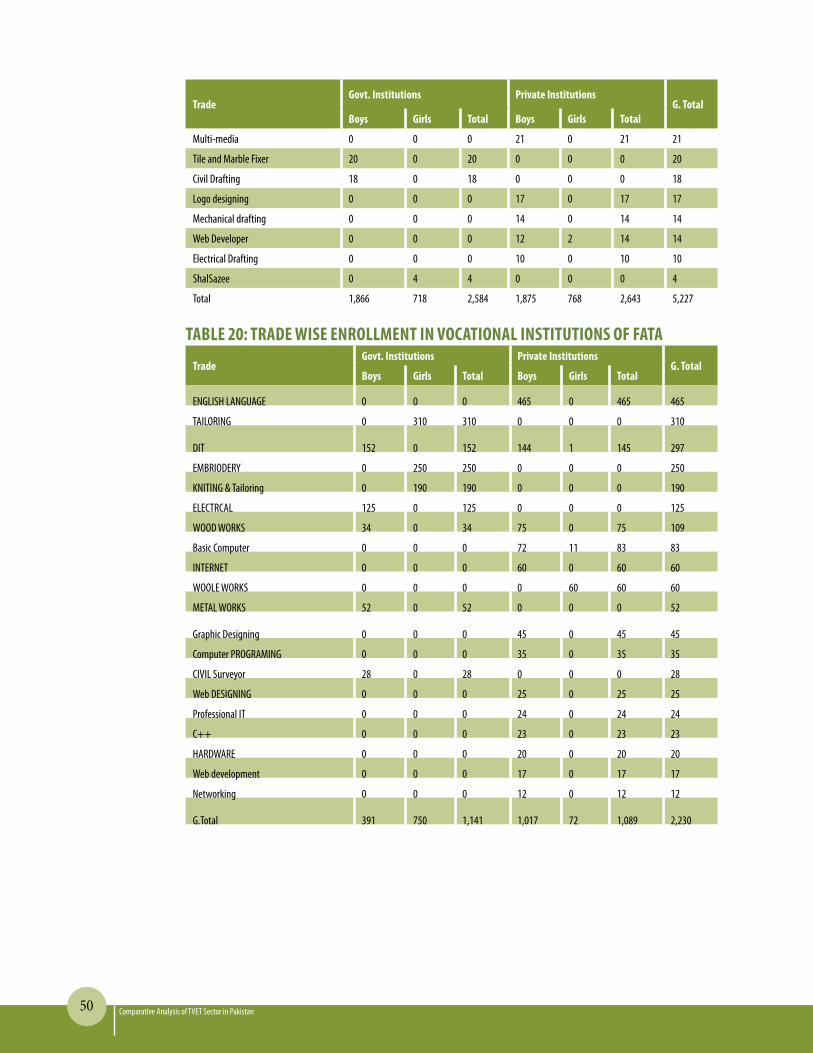
50 Comparative Analysis of TVET Sector in Pakistan
Tradegovt. institutions Private institutions
g. TotalBoys girls Total Boys girls Total
multi-media 0 0 0 21 0 21 21
Tile and marble Fixer 20 0 20 0 0 0 20
Civil Drafting 18 0 18 0 0 0 18
Logo designing 0 0 0 17 0 17 17
mechanical drafting 0 0 0 14 0 14 14
Web Developer 0 0 0 12 2 14 14
Electrical Drafting 0 0 0 10 0 10 10
shalsazee 0 4 4 0 0 0 4
Total 1,866 718 2,584 1,875 768 2,643 5,227
TABlE 20: TrAdE WiSE EnrollmEnT in VoCATionAl inSTiTuTionS of fATA
Tradegovt. institutions Private institutions
g. TotalBoys girls Total Boys girls Total
EnGLisH LAnGUAGE 0 0 0 465 0 465 465
TAiLORinG 0 310 310 0 0 0 310
DiT 152 0 152 144 1 145 297
EmBRiODERy 0 250 250 0 0 0 250
KniTinG & Tailoring 0 190 190 0 0 0 190
ELECTRCAL 125 0 125 0 0 0 125
WOOD WORKs 34 0 34 75 0 75 109
Basic Computer 0 0 0 72 11 83 83
inTERnET 0 0 0 60 0 60 60
WOOLE WORKs 0 0 0 0 60 60 60
mETAL WORKs 52 0 52 0 0 0 52
Graphic Designing 0 0 0 45 0 45 45
Computer PROGRAminG 0 0 0 35 0 35 35
CiviL surveyor 28 0 28 0 0 0 28
Web DEsiGninG 0 0 0 25 0 25 25
Professional iT 0 0 0 24 0 24 24
C++ 0 0 0 23 0 23 23
HARDWARE 0 0 0 20 0 20 20
Web development 0 0 0 17 0 17 17
networking 0 0 0 12 0 12 12
G.Total 391 750 1,141 1,017 72 1,089 2,230

51Comparative Analysis of TVET Sector in Pakistan
TABlE 21: TrAdE WiSE EnrollmEnT in VoCATionAl inSTiTuTionS of iSlAmABAd
Tradegovt. institutions Private institutions
g. TotalBoys girls Total Boys girls Total
Beautician 0 0 0 46 1,622 1,668 1,668
Basic Computer 184 125 309 769 465 1,234 1,543
Tailoring, dress making 0 0 0 113 1,138 1,251 1,251
AutoCAD 78 0 78 502 71 573 651
Professional iT 0 0 0 464 127 591 591
Quantity surveyor 313 0 313 150 0 150 463
Dressing designing & tailoring 0 0 0 65 393 458 458
Web development 0 0 0 258 42 300 300
net working 0 0 0 277 2 279 279
hand Embroidery 0 125 125 0 140 140 265
Graphic Designing 0 0 0 211 34 245 245
Art & Painting 0 0 0 170 60 230 230
RAC 84 0 84 101 0 101 185
Electrician 112 0 112 53 0 53 165
Embroidery 0 152 152 0 0 0 152
Auto Diesel 0 0 0 150 0 150 150
Driving 0 0 0 123 21 144 144
English speaking 0 0 0 80 63 143 143
Civil surveyor 49 10 59 56 27 83 142
Computer language 0 0 0 93 46 139 139
Plumber 22 0 22 101 0 101 123
Operator heavy machinery 80 0 80 23 0 23 103
Computer iT course 40 25 65 25 0 25 90
Radio mechanic 86 0 86 0 0 0 86
DiT 0 0 0 36 46 82 82
Auto mechanic 50 0 50 25 0 25 75
surveyor 50 0 50 22 0 22 72
Building electrician 33 0 33 38 0 38 71
Welder 18 0 18 45 0 45 63
mobile Repairing 0 0 0 62 0 62 62
Animation 0 0 0 60 1 61 61
Typing 0 0 0 35 23 58 58
short hand 0 0 0 55 0 55 55
Wood work 0 0 0 55 0 55 55
Fashion and Textile designing 0 0 0 7 47 54 54
Leather Goods making 0 0 0 50 0 50 50
Auto Electrician 48 0 48 0 0 0 48
CCTv Camera Technician 45 0 45 0 0 0 45

52 Comparative Analysis of TVET Sector in Pakistan
Tradegovt. institutions Private institutions
g. TotalBoys girls Total Boys girls Total
Cycle mechanic 0 0 0 0 45 45 45
Gpon/Fith advance optical Fiber technol-ogy 45 0 45 0 0 0 45
DDm 0 0 0 0 42 42 42
special education skills 0 0 0 30 12 42 42
machine Embroidery 0 0 0 20 21 41 41
Civil Draftsman 40 0 40 0 0 0 40
mobile Phone& set repair 40 0 40 0 0 0 40
mechanic ii Engine 36 0 36 0 0 0 36
CD man 30 5 35 0 0 0 35
Optical Fiber cable Jointing & Transmis-sion system 35 0 35 0 0 0 35
safety Officer 0 0 0 35 0 35 35
Computer Office Automation 0 0 0 0 34 34 34
Cutting & tailoring 0 0 0 0 32 32 32
Office management 0 0 0 0 29 29 29
Lab Technician material 27 0 27 0 0 0 27
Advance web development 0 0 0 14 12 26 26
Desktop Publishing 0 0 0 20 5 25 25
Dispenser 20 5 25 0 0 0 25
mechanic ii 25 0 25 0 0 0 25
multimedia Designing 0 0 0 12 12 24 24
Picture animation 0 0 0 24 0 24 24
UPs 0 0 0 23 0 23 23
montessori Teaching 0 0 0 0 20 20 20
Total station 20 0 20 0 0 0 20
Computer software 19 0 19 0 0 0 19
Emergency medical Assistant 0 17 17 0 0 0 17
Electronic Application 14 0 14 0 0 0 14
motion Graphics 0 0 0 12 2 14 14
Cardiac Technician 8 2 10 0 0 0 10
medical Technical assistant 5 5 10 0 0 0 10
Hardware and networking 0 0 0 9 0 9 9
Cad modeling 0 0 0 6 2 8 8
Renal Dialysis technician 4 4 8 0 0 0 8
sanitary inspector 6 2 8 0 0 0 8
Total 1,666 477 2,143 4,525 4,636 9,161 11,304

53Comparative Analysis of TVET Sector in Pakistan
TABlE 22: TEChnology WiSE EnrollmEnT in TEChniCAl inSTiTuTionS of PunjAB
maleGovt. institutions Private institutions
G.TotalBoys Girls Total Boys Girls Total
DAE Electrical 4,371 0 4,371 432 0 432 4,803
DAE mechanical 4,327 0 4,327 334 0 334 4,661
DAE Civil 3,967 0 3,967 671 3 674 4,641
DAE Chemical 1,664 0 1,664 210 0 210 1,874
DAE ( Electronics) 1,031 61 1,092 419 43 462 1,554
Computer information Technology 472 2 474 567 171 738 1,212
DAE Food Processing & Preservation 597 0 597 123 234 357 954
DAE Auto & Farm machinery Technology 915 0 915 0 0 0 915
Computer information Technology 333 0 333 347 128 475 808
Auto mechanical 365 0 365 64 0 64 429
DAE Textile Waving 291 0 291 120 0 120 411
Fashion Designing 0 20 20 110 276 386 406
mechatronic 373 0 373 0 0 0 373
Auto & Farm 343 0 343 0 0 0 343
Dress Designing & making 0 239 239 0 0 0 239
DAE Agriculture science 138 0 138 0 0 0 138
DAE Petroleum 84 0 84 0 0 0 84
B. Tech. mechanical 80 0 80 0 0 0 80
DAE Textile spinning 72 0 72 0 0 0 72
Petro Chemical 62 0 62 0 0 0 62
B. Tech. Auto mobile & Farm machinery 45 0 45 0 0 0 45
Total 19,530 322 19,852 3,397 855 4,252 24,104
TABlE 23: TEChnology WiSE EnrollmEnT in TEChniCAl inSTiTuTionS of Sindh
Tradegovt. institutions Private institutions
g.TotalBoys girls Total Boys girls Total
DAE Civil 6,754 24 6,778 134 2 136 6,914
DAE Electrical 5,319 153 5,472 326 9 335 5,807
DAE mechanical 4,761 0 4,761 0 0 0 4,761
DAE C.i.T 1,879 395 2,274 317 177 494 2,768
DAE Electronics 1,336 202 1,538 313 46 359 1,897
B.Tech mechanical 167 0 167 336 0 336 503
DAE Chemical 333 0 333 89 0 89 422
DAE Garments Technology 43 255 298 0 0 0 298
DAE Auto & Diesel 286 0 286 0 0 0 286
DAE Petroleum 255 0 255 0 0 0 255

54 Comparative Analysis of TVET Sector in Pakistan
Tradegovt. institutions Private institutions
g.TotalBoys girls Total Boys girls Total
B.Tech Civil 227 0 227 0 0 0 227
DAE Textile Dyeing & Printing (TDP) 175 50 225 0 0 0 225
Bio-medical 130 82 212 0 0 0 212
B.Tech Electrical 208 0 208 0 0 0 208
DAE Architecture 114 86 200 0 0 0 200
DAE Telecom 35 0 35 123 4 127 162
DAE Food Preservation 124 33 157 0 0 0 157
DAE RAC 0 0 0 116 0 116 116
B.Tech (Hons) Electrical 99 0 99 0 0 0 99
DAE Apparel marketing & merchandizing 0 0 0 52 25 77 77
B.Tech (Hons) mechanical 73 0 73 0 0 0 73
B.Tech (Hons) Civil 58 0 58 0 0 0 58
DAE meteorology 0 0 0 55 0 55 55
DAE mining 47 0 47 0 0 0 47
DAE Bio medical 0 0 0 25 18 43 43
Textile management& marketing 0 0 0 22 19 41 41
DAE Fashion Design & management 0 0 0 15 18 33 33
DAE instruments & Process control 0 0 0 30 0 30 30
DAE Animation 0 0 0 18 6 24 24
Total 22,423 1,280 23,703 1,971 324 2,295 25,998
TABlE 24: TEChnology WiSE EnrollmEnT in TEChniCAl inSTiTuTionS of khyBEr PAkhTunkhWA
Trade
govt. institutions Private institutions
g. Total
Boys girls Total Boys girls Total
DAE Civil 5,844 0 5,844 589 36 625 6,469
DAE Electrical 4,718 74 4,792 480 78 558 5,350
DAE mechanical 2,309 0 2,309 0 0 0 2,309
DAE Electronics 568 0 568 297 63 360 928
CiT 39 0 39 478 179 657 696
B. Tech Electrical 391 20 411 0 0 0 411
DAE Computer Hardware 345 39 384 0 0 0 384
DAE Architectural 197 0 197 139 28 167 364
DAE Telecom 320 0 320 173 16 189 509
DAE Chemical 275 0 275 0 0 0 275
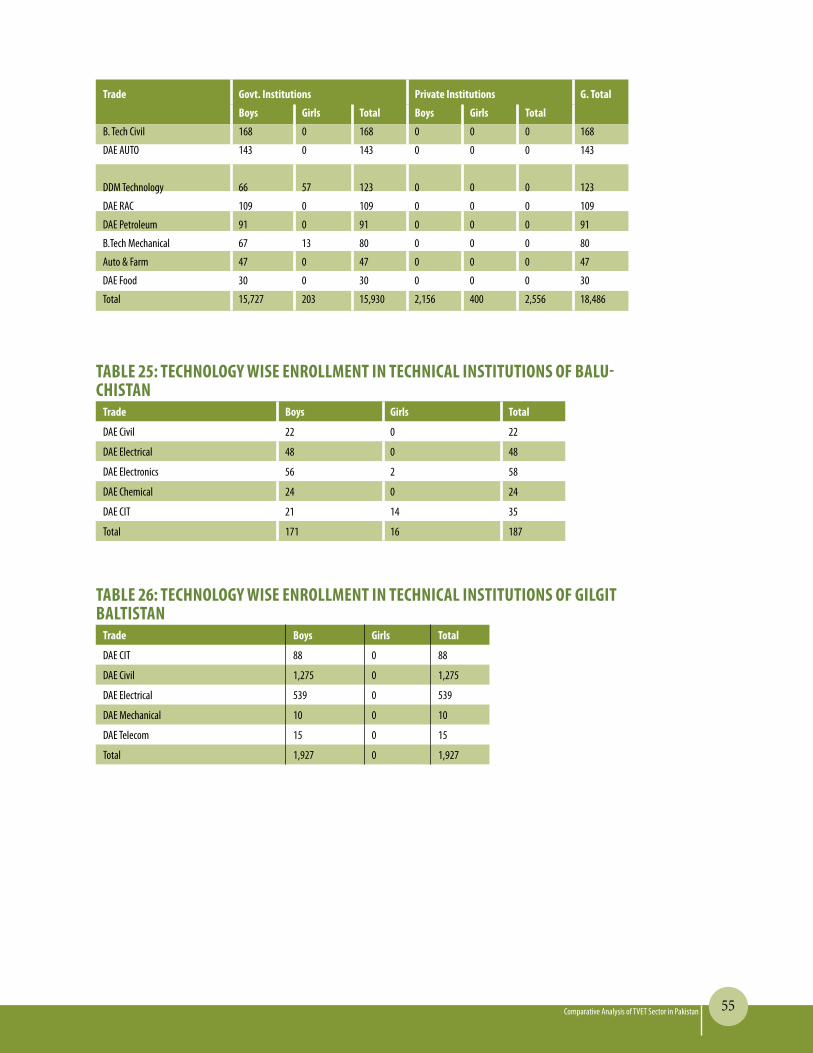
55Comparative Analysis of TVET Sector in Pakistan
Trade govt. institutions Private institutions g. Total
Boys girls Total Boys girls Total
B. Tech Civil 168 0 168 0 0 0 168
DAE AUTO 143 0 143 0 0 0 143
DDm Technology 66 57 123 0 0 0 123
DAE RAC 109 0 109 0 0 0 109
DAE Petroleum 91 0 91 0 0 0 91
B.Tech mechanical 67 13 80 0 0 0 80
Auto & Farm 47 0 47 0 0 0 47
DAE Food 30 0 30 0 0 0 30
Total 15,727 203 15,930 2,156 400 2,556 18,486
TABlE 25: TEChnology WiSE EnrollmEnT in TEChniCAl inSTiTuTionS of BAlu-ChiSTAn
Trade Boys girls Total
DAE Civil 22 0 22
DAE Electrical 48 0 48
DAE Electronics 56 2 58
DAE Chemical 24 0 24
DAE CiT 21 14 35
Total 171 16 187
TABlE 26: TEChnology WiSE EnrollmEnT in TEChniCAl inSTiTuTionS of gilgiT BAlTiSTAn
Trade Boys girls Total
DAE CiT 88 0 88
DAE Civil 1,275 0 1,275
DAE Electrical 539 0 539
DAE mechanical 10 0 10
DAE Telecom 15 0 15
Total 1,927 0 1,927
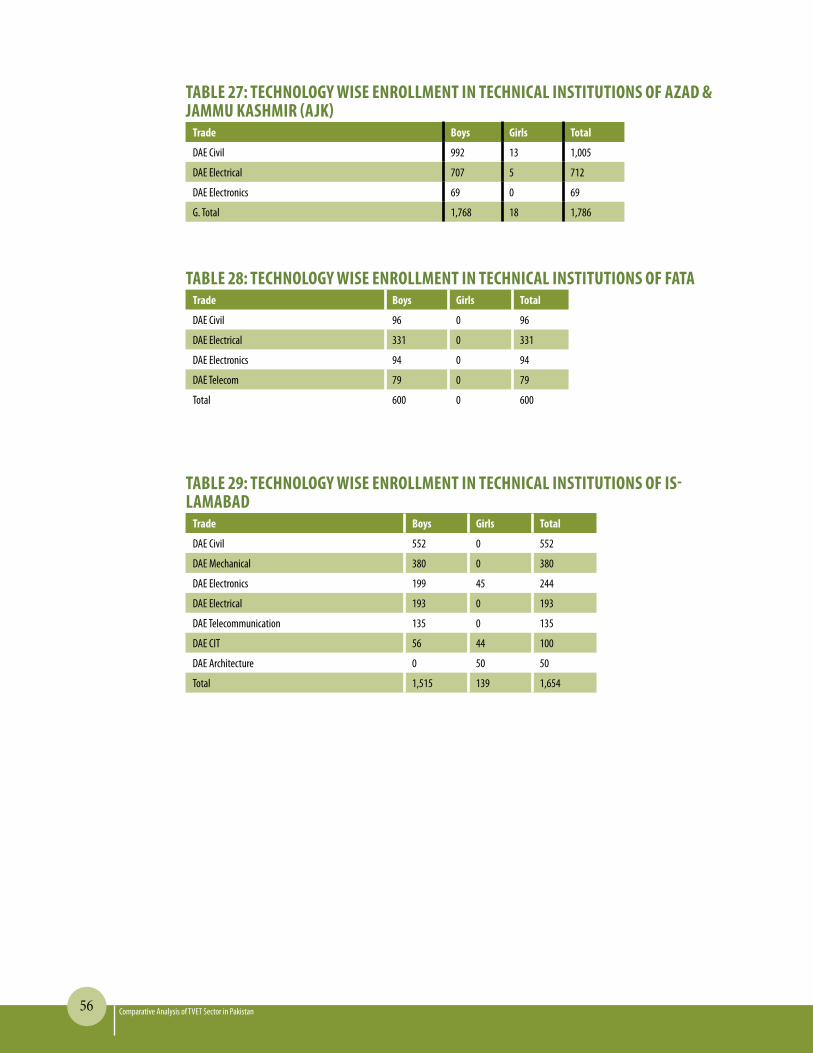
56 Comparative Analysis of TVET Sector in Pakistan
TABlE 27: TEChnology WiSE EnrollmEnT in TEChniCAl inSTiTuTionS of AzAd & jAmmu kAShmir (Ajk)
Trade Boys girls Total
DAE Civil 992 13 1,005
DAE Electrical 707 5 712
DAE Electronics 69 0 69
G. Total 1,768 18 1,786
TABlE 28: TEChnology WiSE EnrollmEnT in TEChniCAl inSTiTuTionS of fATATrade Boys girls Total
DAE Civil 96 0 96
DAE Electrical 331 0 331
DAE Electronics 94 0 94
DAE Telecom 79 0 79
Total 600 0 600
TABlE 29: TEChnology WiSE EnrollmEnT in TEChniCAl inSTiTuTionS of iS-lAmABAd
Trade Boys girls Total
DAE Civil 552 0 552
DAE mechanical 380 0 380
DAE Electronics 199 45 244
DAE Electrical 193 0 193
DAE Telecommunication 135 0 135
DAE CiT 56 44 100
DAE Architecture 0 50 50
Total 1,515 139 1,654

57Comparative Analysis of TVET Sector in Pakistan
AnnEx-ii: QUEsTiOnnAiREs