Comparative Value Chain and Economic Analysis of...
55
119 IV. Comparative Value Chain and Economic Analysis of the Leather Shoe Sector (Sheepskin Loafers) in Ethiopia, Tanzania, Zambia, China and Vietnam 47 47 Although no leather casual or fashion shoes are manufactured in Zambia (only leather workboots and children‘s school shoes are manufactured in Zambia – all are cowhide), Zambian leather and leather products sectoral information is included in this chapter.
Transcript of Comparative Value Chain and Economic Analysis of...
119
IV. Comparative Value Chain and Economic
Analysis of the Leather Shoe Sector (Sheepskin
Loafers) in Ethiopia, Tanzania, Zambia, China
and Vietnam47
47
Although no leather casual or fashion shoes are manufactured in Zambia (only leather workboots and
children‘s school shoes are manufactured in Zambia – all are cowhide), Zambian leather and leather
products sectoral information is included in this chapter.
120
IV.1. Leather Products Analysis: Objectives
The purpose of the leather products analysis is to assess the current competitiveness of
the subsector. To do this, a typical product (sheepskin leather loafer) is analyzed in the
following manner:
Examine important issues and trends in the world leather products market;
Review the structures of the Ethiopian, Tanzanian, Zambian, Chinese and
Vietnamese leather goods markets;
Assess the key features, strengths and weaknesses of the existing supply chains
for leather products in Ethiopia, Tanzania, Zambia, China and Vietnam;
Assess the overall economic efficiency of domestic leather products production in
relation to world prices (based primarily on prices in China, a leading exporter of
leather shoes) using alternative cost projection scenarios to establish current and
medium term competitiveness;
Taking the economic efficiency result as a starting point, analyze the leather
products (loafers) value chain to identify key strengths, weaknesses and
opportunities or needs for investment, expansion or contraction to maintain and
increase leather products productivity and competitiveness at the business
strategy and business process level; and
Provide possible policy options and recommendations to help stimulate growth
and improve competitiveness in the sector.
IV.2. Product Selection Method
Following a review of the first product screening in which 40 products were selected for
consideration for the value chain analysis and feasibility study, the World Bank (WB)
and Global Development Solutions (GDS)/HQ teams immediately agreed on seven out of
the ten products needed for the analysis. The seven products selected by the teams were
as follows:
1. Apparel:
a. Polo shirt; and
b. Underwear
2. Agribusiness:
a. Milk; and
b. Wheat milling
3. Leather:
a. High-end sheepskin loafers
4. Wood:
121
a. Windows/French windows and frames
5. Metal:
a. Padlocks.
To finalize the selection of the remaining products from the wood, metal and leather
sectors, based on the Africa Competitiveness: Phase 1.1 - Preliminary Product Screening
in Ethiopia report (July 2010), the WB and GDS/HQ teams chose six products as
potential candidates to be included in the list of the final ten products to be the target
products for the value chain analysis and feasibility study. The six products included the
following:
1. Wood products:
a. Wooden doors; and
b. Wooden chairs (not upholstered).
2. Leather products:
a. Leather golf gloves; and
b. Sports footwear of leather.
3. Metal products:
a. Metal doors, window-frame (security window frame); and
b. Aluminum doors and windows.
In order to screen the final six products, a product screening survey was developed which
revolved around six factors:
1. Whether these products are currently produced by companies with less than
50 employees;
2. If companies identified in #1 above can be set up with less than US$100,000
in investment capital;
3. The minimum level of skills and know-how required to produce the products;
4. Whether the products produced by the companies in #1 are being exported;
5. Whether products produced by companies in #1 are consolidated by brokers
or other intermediaries for exports; and
6. Whether companies identified in #1 can readily access raw material inputs in
the market to produce the products.
These questions were posed to the wood, metal and leather sector associations in both
China and Vietnam. Following interviews with sector associations, additional interviews
were conducted at the firm level to identify specifically the level of investments and
minimum level of technical skills required for an entrepreneur or existing SMEs to set up
a production operation. These questions were posed to existing operators in China and
Vietnam to identify whether:
122
Barriers to market entry, particularly from a financial and skills
requirement, were sufficiently low to allow entrepreneurs and SMEs in
Ethiopia to easily establish operations; and
These products are currently being produced by SMEs in China and
Vietnam, and are effectively being sold in local and export markets.
The product screening survey identified the following products as viable candidates to be
targeted for the value chain and feasibility analysis.
1. Wood product:
a. Wooden chairs (soft wood); and
b. Wooden door (semi-solid).
Although French windows and their frames made of wood had originally been
preselected for analysis, a decision was made to opt to analyze both wooden
chairs and wooden doors. This decision stemmed from the fact that French
windows require glass thus introducing an outside factor that could influence
the manufacturing of the final product. Wooden doors (without glass) and
wooden chairs (without upholstery) are more representative of wood
processing exclusively.
2. Leather products: Leather golf gloves or sports glove of comparable structure
and weight.
3. Metal products: Both the pre-selected products (security window frame; and
aluminum doors and windows) were screened out of the selection due to
various factors including high initial investment requirements. As a result,
further analyses of products identified during the preliminary product
screening were conducted. Interviews with metal sector associations and
enterprises currently operating in China and Vietnam, as well as interviews
with existing operators in the fabricated metal products sector in Ethiopia
identified crown corks (bottle caps) as a viable candidate to be targeted for
value chain analysis. Crown corks currently are produced in four of the five
countries, but Ethiopia continues to import substantial volumes of this product,
including imports from China. As a result, crown corks have been chosen as
the final fabricated metal product to be the focus of a value chain analysis in
all target countries.
123
IV.2.1. Respective Government Definitions of Small, Medium and
Large Enterprises in Ethiopia, Tanzania, Zambia, China and
Vietnam
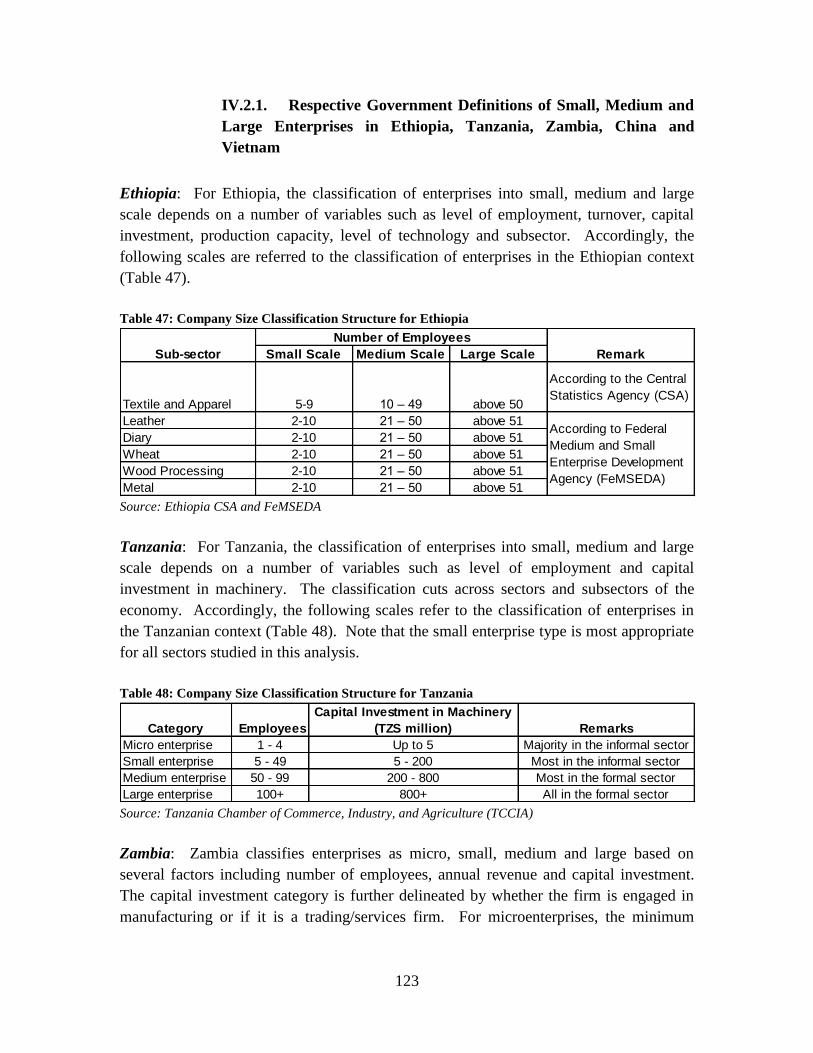
Ethiopia: For Ethiopia, the classification of enterprises into small, medium and large
scale depends on a number of variables such as level of employment, turnover, capital
investment, production capacity, level of technology and subsector. Accordingly, the
following scales are referred to the classification of enterprises in the Ethiopian context
(Table 47).
Table 47: Company Size Classification Structure for Ethiopia
Small Scale Medium Scale Large Scale
Textile and Apparel 5-9 10 – 49 above 50
According to the Central
Statistics Agency (CSA)
Leather 2-10 21 – 50 above 51
Diary 2-10 21 – 50 above 51
Wheat 2-10 21 – 50 above 51
Wood Processing 2-10 21 – 50 above 51
Metal 2-10 21 – 50 above 51
According to Federal
Medium and Small
Enterprise Development
Agency (FeMSEDA)
Sub-sector Remark
Number of Employees
Source: Ethiopia CSA and FeMSEDA
Tanzania: For Tanzania, the classification of enterprises into small, medium and large
scale depends on a number of variables such as level of employment and capital
investment in machinery. The classification cuts across sectors and subsectors of the
economy. Accordingly, the following scales refer to the classification of enterprises in
the Tanzanian context (Table 48). Note that the small enterprise type is most appropriate
for all sectors studied in this analysis.
Table 48: Company Size Classification Structure for Tanzania
Category Employees
Capital Investment in Machinery
(TZS million) Remarks
Micro enterprise 1 - 4 Up to 5 Majority in the informal sector
Small enterprise 5 - 49 5 - 200 Most in the informal sector
Medium enterprise 50 - 99 200 - 800 Most in the formal sector
Large enterprise 100+ 800+ All in the formal sector Source: Tanzania Chamber of Commerce, Industry, and Agriculture (TCCIA)
Zambia: Zambia classifies enterprises as micro, small, medium and large based on
several factors including number of employees, annual revenue and capital investment.
The capital investment category is further delineated by whether the firm is engaged in
manufacturing or if it is a trading/services firm. For microenterprises, the minimum
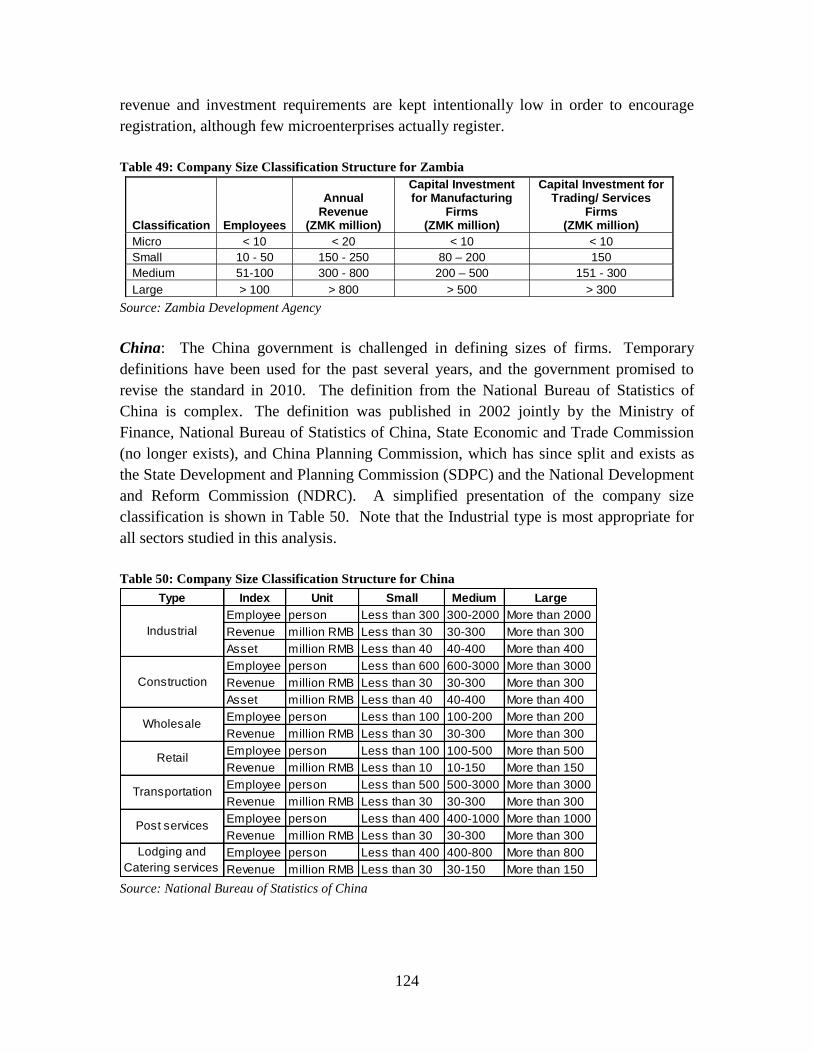
124
revenue and investment requirements are kept intentionally low in order to encourage
registration, although few microenterprises actually register.
Table 49: Company Size Classification Structure for Zambia
Classification Employees
Annual Revenue
(ZMK million)
Capital Investment for Manufacturing
Firms (ZMK million)
Capital Investment for Trading/ Services
Firms (ZMK million)
Micro < 10 < 20 < 10 < 10
Small 10 - 50 150 - 250 80 – 200 150
Medium 51-100 300 - 800 200 – 500 151 - 300
Large > 100 > 800 > 500 > 300
Source: Zambia Development Agency
China: The China government is challenged in defining sizes of firms. Temporary
definitions have been used for the past several years, and the government promised to
revise the standard in 2010. The definition from the National Bureau of Statistics of
China is complex. The definition was published in 2002 jointly by the Ministry of
Finance, National Bureau of Statistics of China, State Economic and Trade Commission
(no longer exists), and China Planning Commission, which has since split and exists as
the State Development and Planning Commission (SDPC) and the National Development
and Reform Commission (NDRC). A simplified presentation of the company size
classification is shown in Table 50. Note that the Industrial type is most appropriate for
all sectors studied in this analysis.
Table 50: Company Size Classification Structure for China
Type Index Unit Small Medium Large
Employee person Less than 300 300-2000 More than 2000
Revenue million RMB Less than 30 30-300 More than 300
Asset million RMB Less than 40 40-400 More than 400
Employee person Less than 600 600-3000 More than 3000
Revenue million RMB Less than 30 30-300 More than 300
Asset million RMB Less than 40 40-400 More than 400
Employee person Less than 100 100-200 More than 200
Revenue million RMB Less than 30 30-300 More than 300
Employee person Less than 100 100-500 More than 500
Revenue million RMB Less than 10 10-150 More than 150
Employee person Less than 500 500-3000 More than 3000
Revenue million RMB Less than 30 30-300 More than 300
Employee person Less than 400 400-1000 More than 1000
Revenue million RMB Less than 30 30-300 More than 300
Employee person Less than 400 400-800 More than 800
Revenue million RMB Less than 30 30-150 More than 150
Lodging and
Catering services
Industrial
Construction
Wholesale
Retail
Transportation
Post services
Source: National Bureau of Statistics of China
125
Vietnam: A small firm has less than 50 laborers, while a medium-size firm has 51-200
laborers. Within the small and medium-size classifications, there are some detailed
categories depending on the purpose of research and management. For instance, a firm
with less than 10 laborers is called a super small-size firm. Such a regulation is in line
with Social Insurance Law.48
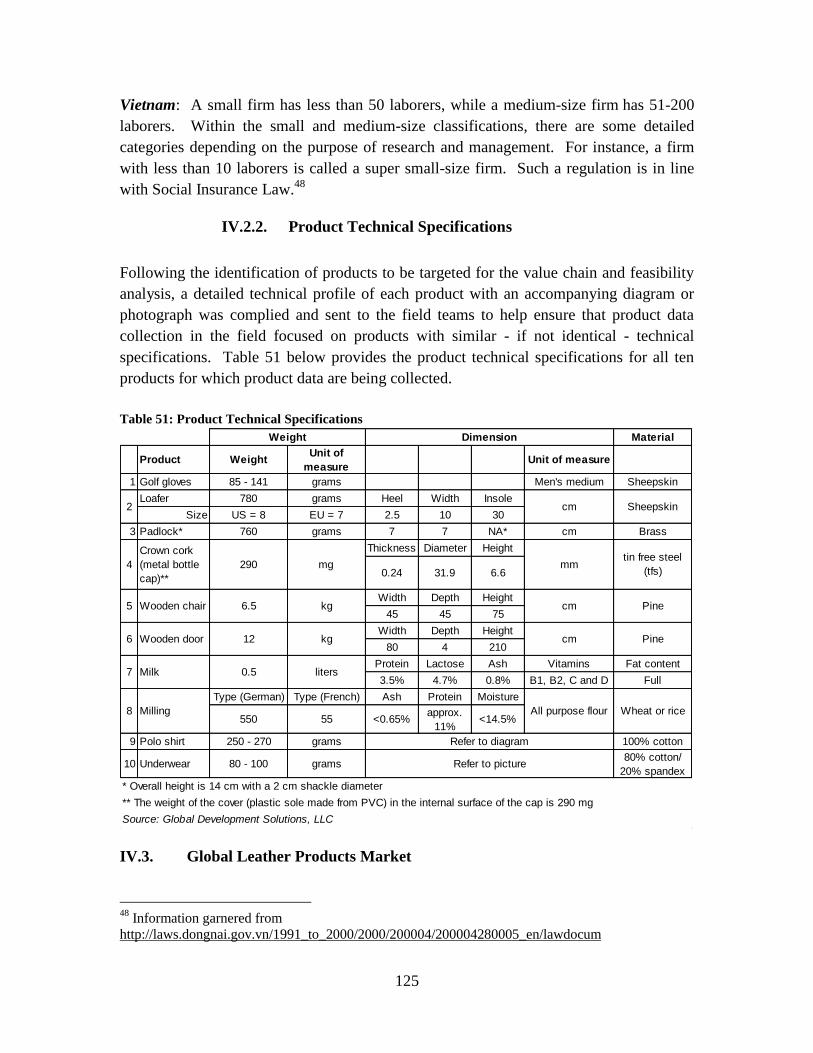
IV.2.2. Product Technical Specifications
Following the identification of products to be targeted for the value chain and feasibility
analysis, a detailed technical profile of each product with an accompanying diagram or
photograph was complied and sent to the field teams to help ensure that product data
collection in the field focused on products with similar - if not identical - technical
specifications. Table 51 below provides the product technical specifications for all ten
products for which product data are being collected.
Table 51: Product Technical Specifications
Material
Product WeightUnit of
measureUnit of measure
1 Golf gloves 85 - 141 grams Men's medium Sheepskin
Loafer 780 grams Heel Width Insole
Size US = 8 EU = 7 2.5 10 30
3 Padlock* 760 grams 7 7 NA* cm Brass
Thickness Diameter Height
0.24 31.9 6.6
Width Depth Height
45 45 75
Width Depth Height
80 4 210
Protein Lactose Ash Vitamins Fat content
3.5% 4.7% 0.8% B1, B2, C and D Full
Type (German) Type (French) Ash Protein Moisture
550 55 <0.65%approx.
11%<14.5%
9 Polo shirt 250 - 270 grams 100% cotton
10 Underwear 80 - 100 grams80% cotton/
20% spandex
* Overall height is 14 cm with a 2 cm shackle diameter
** The weight of the cover (plastic sole made from PVC) in the internal surface of the cap is 290 mg
Source: Global Development Solutions, LLC
Pine
Wheat or rice
Dimension
All purpose flour
cm
Refer to diagram
Weight
cm
mm
cm
tin free steel
(tfs)
Sheepskin
Pine
mg
kg
kg
liters
Refer to picture
Crown cork
(metal bottle
cap)**
Wooden chair
Wooden door
Milk
Milling
290
6.5
12
0.5
2
4
5
6
7
8
IV.3. Global Leather Products Market
48
Information garnered from
http://laws.dongnai.gov.vn/1991_to_2000/2000/200004/200004280005_en/lawdocum
126
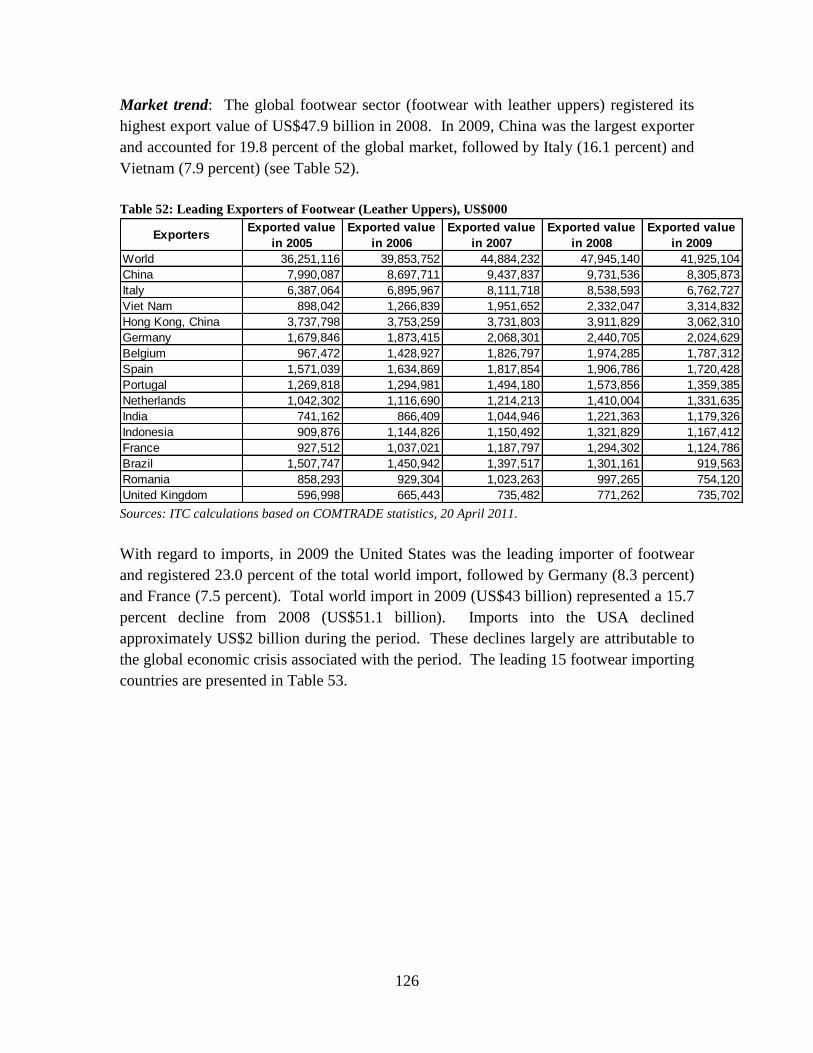
Market trend: The global footwear sector (footwear with leather uppers) registered its
highest export value of US$47.9 billion in 2008. In 2009, China was the largest exporter
and accounted for 19.8 percent of the global market, followed by Italy (16.1 percent) and
Vietnam (7.9 percent) (see Table 52).
Table 52: Leading Exporters of Footwear (Leather Uppers), US$000
ExportersExported value
in 2005
Exported value
in 2006
Exported value
in 2007
Exported value
in 2008
Exported value
in 2009
World 36,251,116 39,853,752 44,884,232 47,945,140 41,925,104
China 7,990,087 8,697,711 9,437,837 9,731,536 8,305,873
Italy 6,387,064 6,895,967 8,111,718 8,538,593 6,762,727
Viet Nam 898,042 1,266,839 1,951,652 2,332,047 3,314,832
Hong Kong, China 3,737,798 3,753,259 3,731,803 3,911,829 3,062,310
Germany 1,679,846 1,873,415 2,068,301 2,440,705 2,024,629
Belgium 967,472 1,428,927 1,826,797 1,974,285 1,787,312
Spain 1,571,039 1,634,869 1,817,854 1,906,786 1,720,428
Portugal 1,269,818 1,294,981 1,494,180 1,573,856 1,359,385
Netherlands 1,042,302 1,116,690 1,214,213 1,410,004 1,331,635
India 741,162 866,409 1,044,946 1,221,363 1,179,326
Indonesia 909,876 1,144,826 1,150,492 1,321,829 1,167,412
France 927,512 1,037,021 1,187,797 1,294,302 1,124,786
Brazil 1,507,747 1,450,942 1,397,517 1,301,161 919,563
Romania 858,293 929,304 1,023,263 997,265 754,120
United Kingdom 596,998 665,443 735,482 771,262 735,702 Sources: ITC calculations based on COMTRADE statistics, 20 April 2011.
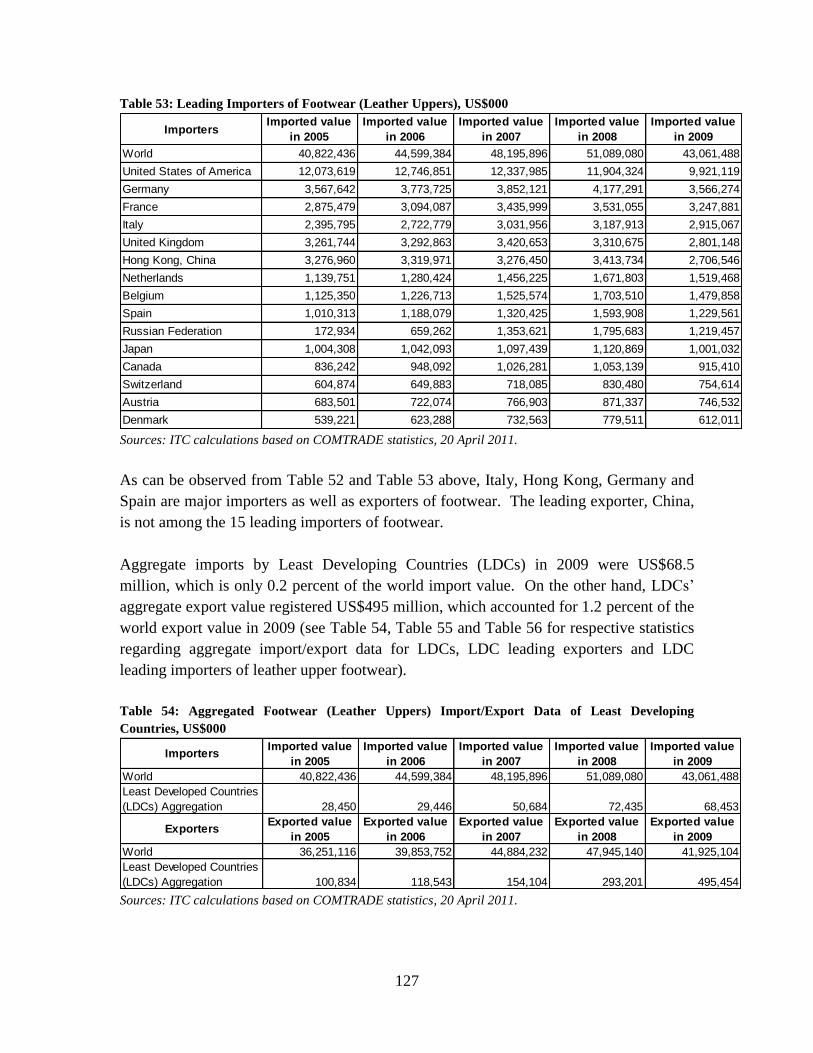
With regard to imports, in 2009 the United States was the leading importer of footwear
and registered 23.0 percent of the total world import, followed by Germany (8.3 percent)
and France (7.5 percent). Total world import in 2009 (US$43 billion) represented a 15.7
percent decline from 2008 (US$51.1 billion). Imports into the USA declined
approximately US$2 billion during the period. These declines largely are attributable to
the global economic crisis associated with the period. The leading 15 footwear importing
countries are presented in Table 53.
127
Table 53: Leading Importers of Footwear (Leather Uppers), US$000
ImportersImported value
in 2005
Imported value
in 2006
Imported value
in 2007
Imported value
in 2008
Imported value
in 2009
World 40,822,436 44,599,384 48,195,896 51,089,080 43,061,488
United States of America 12,073,619 12,746,851 12,337,985 11,904,324 9,921,119
Germany 3,567,642 3,773,725 3,852,121 4,177,291 3,566,274
France 2,875,479 3,094,087 3,435,999 3,531,055 3,247,881
Italy 2,395,795 2,722,779 3,031,956 3,187,913 2,915,067
United Kingdom 3,261,744 3,292,863 3,420,653 3,310,675 2,801,148
Hong Kong, China 3,276,960 3,319,971 3,276,450 3,413,734 2,706,546
Netherlands 1,139,751 1,280,424 1,456,225 1,671,803 1,519,468
Belgium 1,125,350 1,226,713 1,525,574 1,703,510 1,479,858
Spain 1,010,313 1,188,079 1,320,425 1,593,908 1,229,561
Russian Federation 172,934 659,262 1,353,621 1,795,683 1,219,457
Japan 1,004,308 1,042,093 1,097,439 1,120,869 1,001,032
Canada 836,242 948,092 1,026,281 1,053,139 915,410
Switzerland 604,874 649,883 718,085 830,480 754,614
Austria 683,501 722,074 766,903 871,337 746,532
Denmark 539,221 623,288 732,563 779,511 612,011 Sources: ITC calculations based on COMTRADE statistics, 20 April 2011.
As can be observed from Table 52 and Table 53 above, Italy, Hong Kong, Germany and
Spain are major importers as well as exporters of footwear. The leading exporter, China,
is not among the 15 leading importers of footwear.
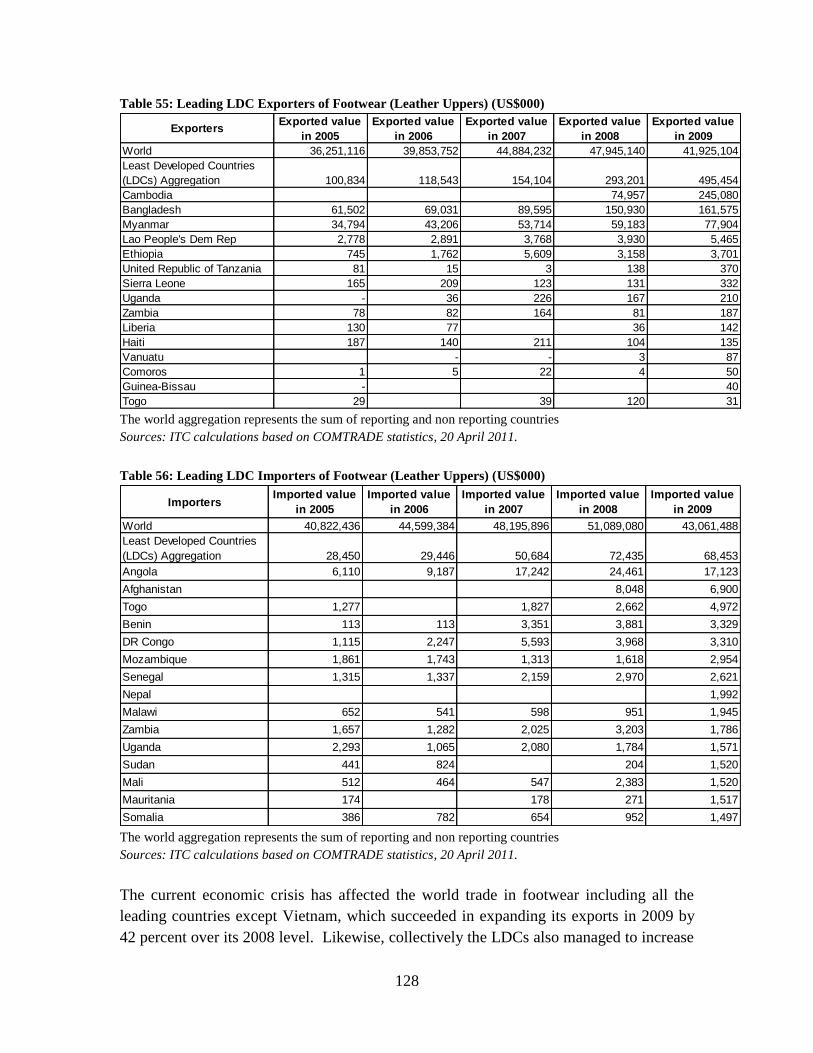
Aggregate imports by Least Developing Countries (LDCs) in 2009 were US$68.5
million, which is only 0.2 percent of the world import value. On the other hand, LDCs‘
aggregate export value registered US$495 million, which accounted for 1.2 percent of the
world export value in 2009 (see Table 54, Table 55 and Table 56 for respective statistics
regarding aggregate import/export data for LDCs, LDC leading exporters and LDC
leading importers of leather upper footwear).
Table 54: Aggregated Footwear (Leather Uppers) Import/Export Data of Least Developing
Countries, US$000
ImportersImported value
in 2005
Imported value
in 2006
Imported value
in 2007
Imported value
in 2008
Imported value
in 2009
World 40,822,436 44,599,384 48,195,896 51,089,080 43,061,488
Least Developed Countries
(LDCs) Aggregation 28,450 29,446 50,684 72,435 68,453
ExportersExported value
in 2005
Exported value
in 2006
Exported value
in 2007
Exported value
in 2008
Exported value
in 2009
World 36,251,116 39,853,752 44,884,232 47,945,140 41,925,104
Least Developed Countries
(LDCs) Aggregation 100,834 118,543 154,104 293,201 495,454 Sources: ITC calculations based on COMTRADE statistics, 20 April 2011.
128
Table 55: Leading LDC Exporters of Footwear (Leather Uppers) (US$000)
ExportersExported value
in 2005
Exported value
in 2006
Exported value
in 2007
Exported value
in 2008
Exported value
in 2009
World 36,251,116 39,853,752 44,884,232 47,945,140 41,925,104
Least Developed Countries
(LDCs) Aggregation 100,834 118,543 154,104 293,201 495,454
Cambodia 74,957 245,080
Bangladesh 61,502 69,031 89,595 150,930 161,575
Myanmar 34,794 43,206 53,714 59,183 77,904
Lao People's Dem Rep 2,778 2,891 3,768 3,930 5,465
Ethiopia 745 1,762 5,609 3,158 3,701
United Republic of Tanzania 81 15 3 138 370
Sierra Leone 165 209 123 131 332
Uganda - 36 226 167 210
Zambia 78 82 164 81 187
Liberia 130 77 36 142
Haiti 187 140 211 104 135
Vanuatu - - 3 87
Comoros 1 5 22 4 50
Guinea-Bissau - 40
Togo 29 39 120 31 The world aggregation represents the sum of reporting and non reporting countries
Sources: ITC calculations based on COMTRADE statistics, 20 April 2011.
Table 56: Leading LDC Importers of Footwear (Leather Uppers) (US$000)
ImportersImported value
in 2005
Imported value
in 2006
Imported value
in 2007
Imported value
in 2008
Imported value
in 2009
World 40,822,436 44,599,384 48,195,896 51,089,080 43,061,488
Least Developed Countries
(LDCs) Aggregation 28,450 29,446 50,684 72,435 68,453
Angola 6,110 9,187 17,242 24,461 17,123
Afghanistan 8,048 6,900
Togo 1,277 1,827 2,662 4,972
Benin 113 113 3,351 3,881 3,329
DR Congo 1,115 2,247 5,593 3,968 3,310
Mozambique 1,861 1,743 1,313 1,618 2,954
Senegal 1,315 1,337 2,159 2,970 2,621
Nepal 1,992
Malawi 652 541 598 951 1,945
Zambia 1,657 1,282 2,025 3,203 1,786
Uganda 2,293 1,065 2,080 1,784 1,571
Sudan 441 824 204 1,520
Mali 512 464 547 2,383 1,520
Mauritania 174 178 271 1,517
Somalia 386 782 654 952 1,497 The world aggregation represents the sum of reporting and non reporting countries
Sources: ITC calculations based on COMTRADE statistics, 20 April 2011.
The current economic crisis has affected the world trade in footwear including all the
leading countries except Vietnam, which succeeded in expanding its exports in 2009 by
42 percent over its 2008 level. Likewise, collectively the LDCs also managed to increase
129
their exports by 69 percent over 2008 despite the global recession.
Industry and Consumer Trend: The footwear industry is increasing product value by
enhancing product functionality (e.g., making products water resistant, increasing
durability and improving comfort). Manufacturers have had to make changes to respond
quickly to fashion changes as well as become more resource efficient (e.g., minimizing
cutting wastes and using technologies that are more productive).
Notwithstanding the above, footwear is a consumer good for which consumption level
depends on population and its corresponding purchasing power. Consumption is closely
correlated with the income of people, which can be represented by per capita GDP of a
country.
Supply and Demand: As per the study conducted by United Nations Industrial
Development Organization (UNIDO),49
the lowest footwear consumption is in Africa
with 0.5 pairs/person/year, and the highest is in the USA with 7.1 pairs/person/year.
According to a conservative forecast, world shoe consumption is expected to increase to
2.5 pairs/person/year by year 2015, bringing the total world consumption to 17.2 billion
pairs, which is an increase of 4 billion pairs compared to the 2009 consumption level.
Important to note is that 55 percent of finished genuine leather produced globally is used
for footwear. According to the study by UNIDO, there is an anticipated shortage of
rawhide and skin, which suggests that there may be a shortfall of 2.4 billion pairs in the
world market by 2015. It is therefore anticipated that the scarcity of genuine leather will
result in significant price increases of finished leather goods, including leather shoes.
IV.4. Comparative Sector Profile: Leather Products Sector
Key Indicators: In Ethiopia, it is estimated that 1,000 small, eight medium-size, and six
large firms operate in the leather products sector. Approximately 5,000 people are
employed by the small firms, 800 by medium-size and 1,800 by large firms. Of the
approximately 7,600 employees working in the sector, 56 percent are male.
In Tanzania, an estimated eleven firms operate in the footwear (7) and leather products
(4) sector and employ an estimated 1,000 people, of which approximately 58 percent are
male.50
The bulk of employment (700-800 people) and export revenue (100 percent)
from the footwear sector in Tanzania is generated by two large firms that produce non-
49
Development Trends in the World Leather Products Trade, UNIDO, 2009 50
Data for Tanzania does not include micro/small enterprises employing less than 10 people. Data for such
firms, such as small workshops, repair shops, etc, are not available – an estimated 95 percent of all
manufacturing firms belong in this unrecorded category of firms.
130
leather footwear such as plastic slippers, shoes, etc. Only an estimated five small firms
produce leather footwear in Tanzania.51
In Zambia there are eight companies operating in the leather products sector, of which six
produce leather shoes.52
Three of these six companies are classified as small, two
medium-sizes and one large. Seventy-five percent of the employees are male.
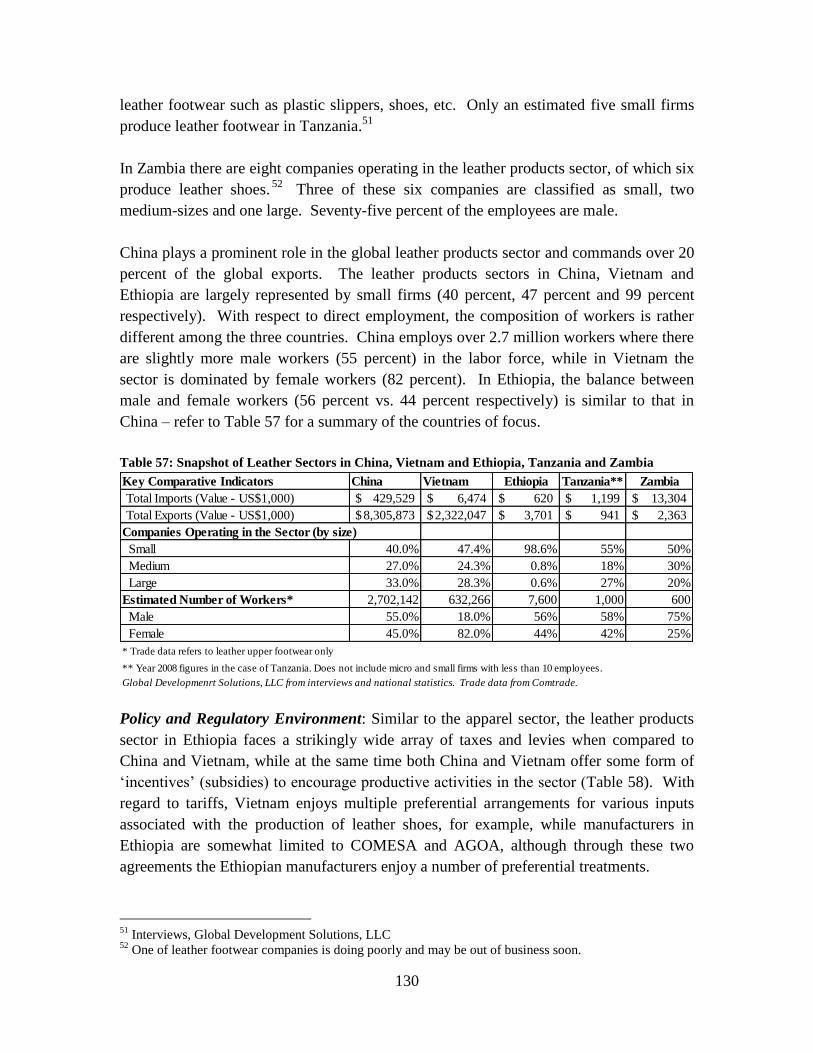
China plays a prominent role in the global leather products sector and commands over 20
percent of the global exports. The leather products sectors in China, Vietnam and
Ethiopia are largely represented by small firms (40 percent, 47 percent and 99 percent
respectively). With respect to direct employment, the composition of workers is rather
different among the three countries. China employs over 2.7 million workers where there
are slightly more male workers (55 percent) in the labor force, while in Vietnam the
sector is dominated by female workers (82 percent). In Ethiopia, the balance between
male and female workers (56 percent vs. 44 percent respectively) is similar to that in
China – refer to Table 57 for a summary of the countries of focus.
Table 57: Snapshot of Leather Sectors in China, Vietnam and Ethiopia, Tanzania and Zambia
Key Comparative Indicators China Vietnam Ethiopia Tanzania** Zambia
Total Imports (Value - US$1,000) 429,529$ 6,474$ 620$ 1,199$ 13,304$
Total Exports (Value - US$1,000) 8,305,873$ 2,322,047$ 3,701$ 941$ 2,363$
Companies Operating in the Sector (by size)
Small 40.0% 47.4% 98.6% 55% 50%
Medium 27.0% 24.3% 0.8% 18% 30%
Large 33.0% 28.3% 0.6% 27% 20%
Estimated Number of Workers* 2,702,142 632,266 7,600 1,000 600
Male 55.0% 18.0% 56% 58% 75%
Female 45.0% 82.0% 44% 42% 25%
* Trade data refers to leather upper footwear only
** Year 2008 figures in the case of Tanzania. Does not include micro and small firms with less than 10 employees.
Global Developmenrt Solutions, LLC from interviews and national statistics. Trade data from Comtrade.
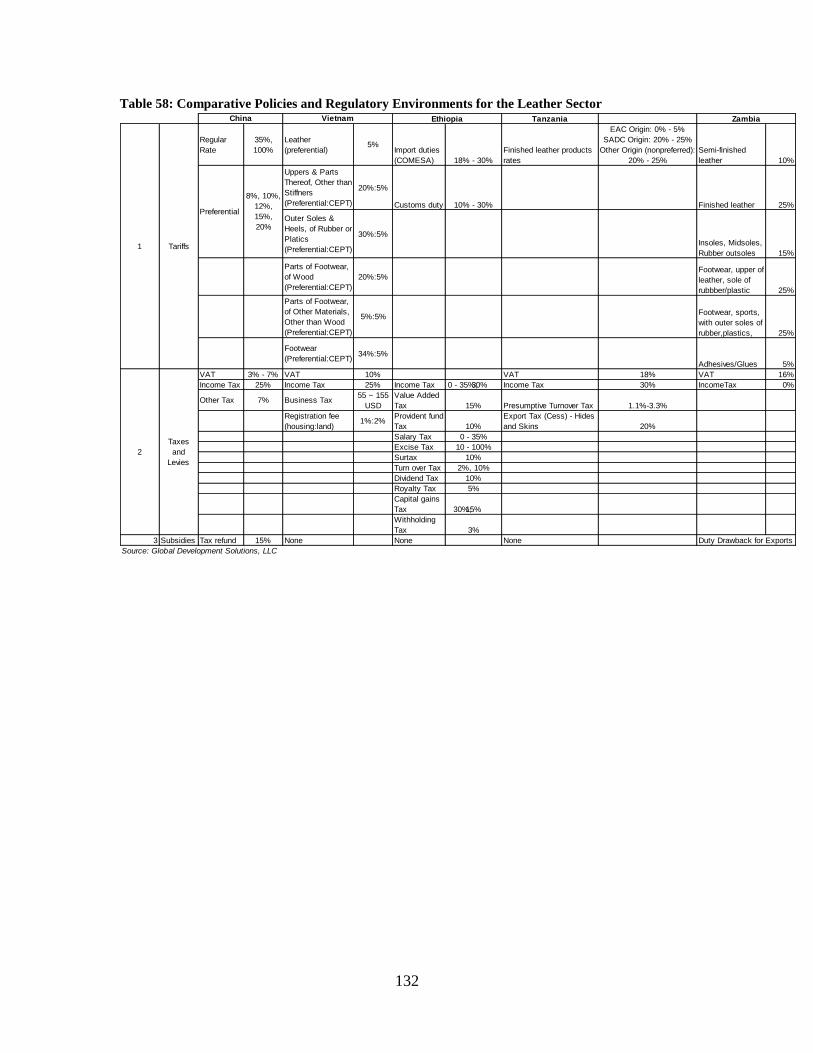
Policy and Regulatory Environment: Similar to the apparel sector, the leather products
sector in Ethiopia faces a strikingly wide array of taxes and levies when compared to
China and Vietnam, while at the same time both China and Vietnam offer some form of
‗incentives‘ (subsidies) to encourage productive activities in the sector (Table 58). With
regard to tariffs, Vietnam enjoys multiple preferential arrangements for various inputs
associated with the production of leather shoes, for example, while manufacturers in
Ethiopia are somewhat limited to COMESA and AGOA, although through these two
agreements the Ethiopian manufacturers enjoy a number of preferential treatments.
51
Interviews, Global Development Solutions, LLC 52
One of leather footwear companies is doing poorly and may be out of business soon.
131
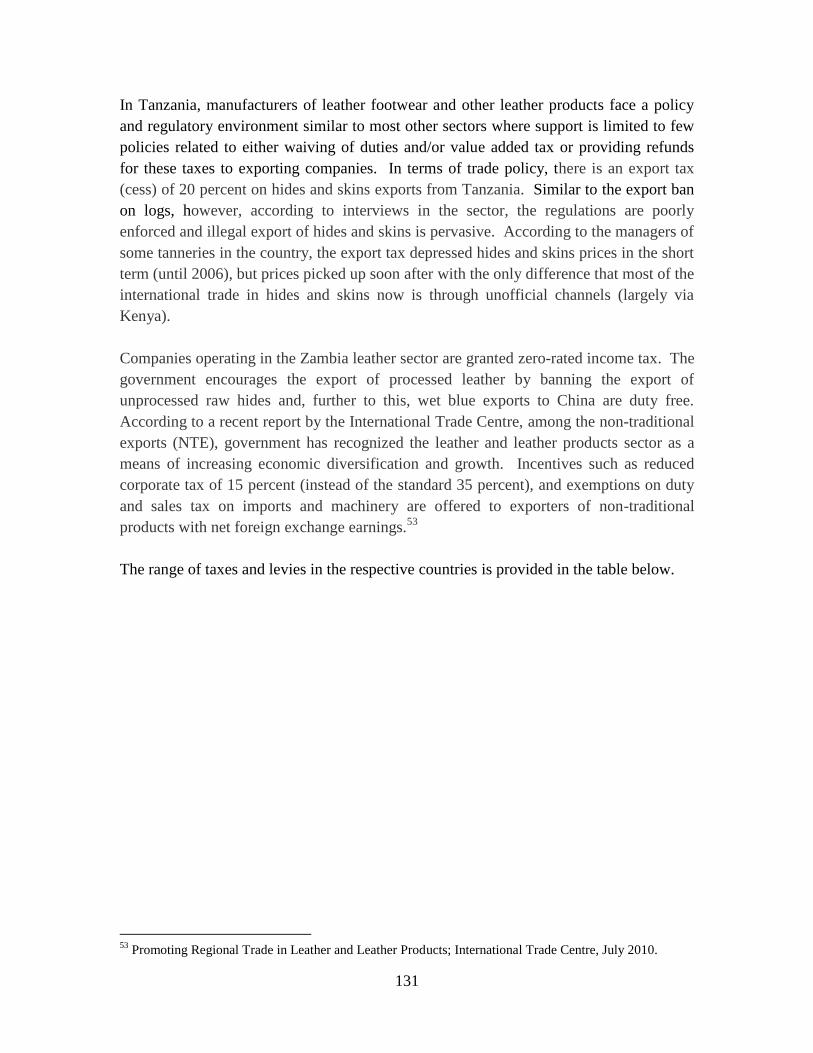
In Tanzania, manufacturers of leather footwear and other leather products face a policy
and regulatory environment similar to most other sectors where support is limited to few
policies related to either waiving of duties and/or value added tax or providing refunds
for these taxes to exporting companies. In terms of trade policy, there is an export tax
(cess) of 20 percent on hides and skins exports from Tanzania. Similar to the export ban
on logs, however, according to interviews in the sector, the regulations are poorly
enforced and illegal export of hides and skins is pervasive. According to the managers of
some tanneries in the country, the export tax depressed hides and skins prices in the short
term (until 2006), but prices picked up soon after with the only difference that most of the
international trade in hides and skins now is through unofficial channels (largely via
Kenya).
Companies operating in the Zambia leather sector are granted zero-rated income tax. The
government encourages the export of processed leather by banning the export of
unprocessed raw hides and, further to this, wet blue exports to China are duty free.
According to a recent report by the International Trade Centre, among the non-traditional
exports (NTE), government has recognized the leather and leather products sector as a
means of increasing economic diversification and growth. Incentives such as reduced
corporate tax of 15 percent (instead of the standard 35 percent), and exemptions on duty
and sales tax on imports and machinery are offered to exporters of non-traditional
products with net foreign exchange earnings.53
The range of taxes and levies in the respective countries is provided in the table below.
53
Promoting Regional Trade in Leather and Leather Products; International Trade Centre, July 2010.
132
Table 58: Comparative Policies and Regulatory Environments for the Leather Sector Tanzania
Regular
Rate
35%,
100%
Leather
(preferential)5%
Import duties
(COMESA) 18% - 30%
Finished leather products
rates
EAC Origin: 0% - 5%
SADC Origin: 20% - 25%
Other Origin (nonpreferred):
20% - 25%
Semi-finished
leather 10%
Uppers & Parts
Thereof, Other than
Stiffners
(Preferential:CEPT)
20%:5%
Customs duty 10% - 30% Finished leather 25%
Outer Soles &
Heels, of Rubber or
Platics
(Preferential:CEPT)
30%:5%Insoles, Midsoles,
Rubber outsoles 15%
Parts of Footwear,
of Wood
(Preferential:CEPT)
20%:5%Footwear, upper of
leather, sole of
rubbber/plastic 25%
Parts of Footwear,
of Other Materials,
Other than Wood
(Preferential:CEPT)
5%:5%Footwear, sports,
with outer soles of
rubber,plastics, 25%
Footwear
(Preferential:CEPT)34%:5%
Adhesives/Glues 5%
VAT 3% - 7% VAT 10% VAT 18% VAT 16%
Income Tax 25% Income Tax 25% Income Tax 0 - 35%;30% Income Tax 30% IncomeTax 0%
Other Tax 7% Business Tax55 ~ 155
USD
Value Added
Tax 15% Presumptive Turnover Tax 1.1%-3.3%
Registration fee
(housing:land)1%:2%
Provident fund
Tax 10%
Export Tax (Cess) - Hides
and Skins 20%
Salary Tax 0 - 35%
Excise Tax 10 - 100%
Surtax 10%
Turn over Tax 2%, 10%
Dividend Tax 10%
Royalty Tax 5%
Capital gains
Tax 30%;15%
Withholding
Tax 3%
3 Subsidies Tax refund 15% None None None
Source: Global Development Solutions, LLC
Duty Drawback for Exports
1 Tariffs
China Vietnam
Preferential
8%, 10%,
12%,
15%,
20%
Ethiopia Zambia
2
Taxes
and
Levies
133
IV.5. Sector Profiles for the Leather Products Sector in Ethiopia, Tanzania,
Zambia, China, and Vietnam
IV.5.1. Sector Profile: Leather and Leather Footwear in Ethiopia
The Ethiopian leather footwear and leather products sector accounted for 7.0 percent of
the country‘s industrial production in 2009/10. In the fiscal year 2009/2010 ending in
June 2010, the entire leather industry exported a total of US$56.5 million, which
comprised 2.8 percent of the country‘s total exports for the year.54
Key leather products
for the year were footwear, leather garments and leather goods. Major export
destinations were Italy, Germany, USA, Canada and Kenya.
From 2008 to 2009, as shown in Table 59 below, footwear experienced a significant
increase in both production volume (208 percent) and production value (more than a
fourfold increase). The dramatic rise in production from 2008 to 2009 reflects a direct
government intervention to help stimulate production in the sector through regular
meetings with the private sector, and the introduction in 2008 of a 150 percent tax on
exports on raw skins and hides, wet blue and pickled (see section IV.5.1.1 Supply Chain
and Institution Support Structure: Leather Products - Ethiopia below). In addition, the
increase reflects the entry of new manufacturers in the leather shoe industry, and a shift in
local consumer preference away from less expensive and low quality shoes from China to
a more durable locally manufactured leather shoe.
54
Ethiopia Ministry of Trade and Industry
134
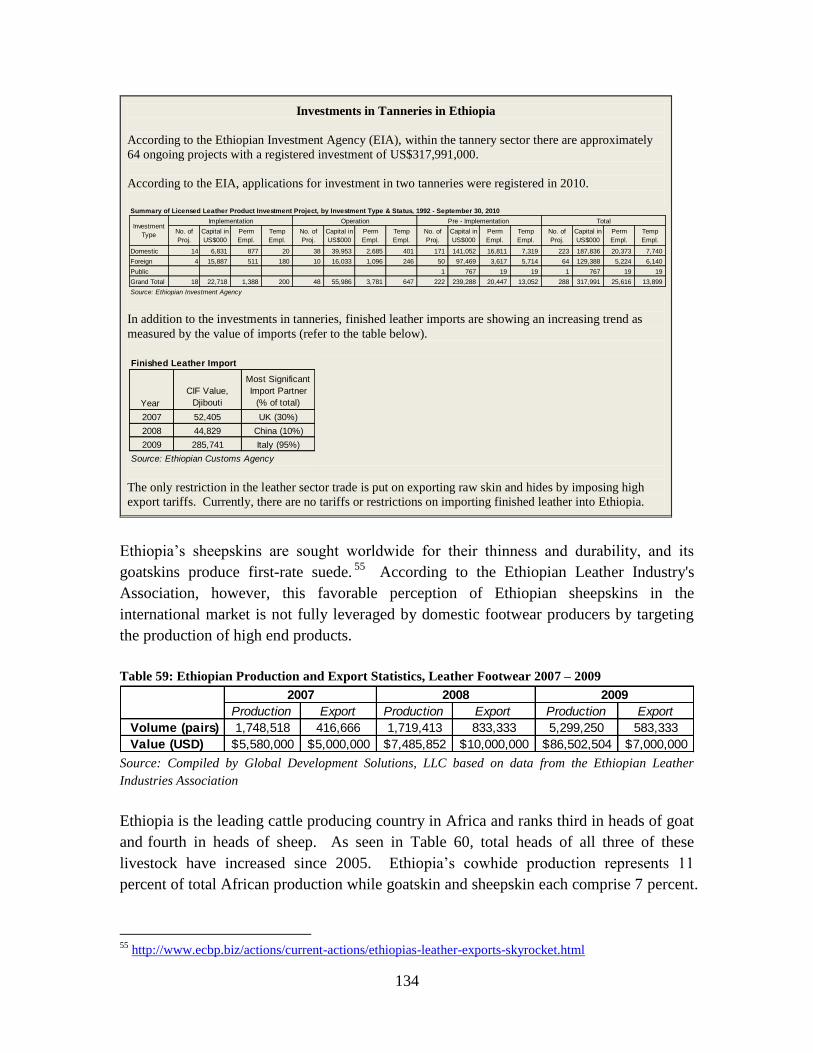
Investments in Tanneries in Ethiopia
According to the Ethiopian Investment Agency (EIA), within the tannery sector there are approximately
64 ongoing projects with a registered investment of US$317,991,000.
According to the EIA, applications for investment in two tanneries were registered in 2010.
In addition to the investments in tanneries, finished leather imports are showing an increasing trend as
measured by the value of imports (refer to the table below).
The only restriction in the leather sector trade is put on exporting raw skin and hides by imposing high
export tariffs. Currently, there are no tariffs or restrictions on importing finished leather into Ethiopia.
Summary of Licensed Leather Product Investment Project, by Investment Type & Status, 1992 - September 30, 2010
No. of
Proj.
Capital in
US$000
Perm
Empl.
Temp
Empl.
No. of
Proj.
Capital in
US$000
Perm
Empl.
Temp
Empl.
No. of
Proj.
Capital in
US$000
Perm
Empl.
Temp
Empl.
No. of
Proj.
Capital in
US$000
Perm
Empl.
Temp
Empl.
Domestic 14 6,831 877 20 38 39,953 2,685 401 171 141,052 16,811 7,319 223 187,836 20,373 7,740
Foreign 4 15,887 511 180 10 16,033 1,096 246 50 97,469 3,617 5,714 64 129,388 5,224 6,140
Public 1 767 19 19 1 767 19 19
Grand Total 18 22,718 1,388 200 48 55,986 3,781 647 222 239,288 20,447 13,052 288 317,991 25,616 13,899
Source: Ethiopian Investment Agency
Implementation Operation Pre - Implementation TotalInvestment
Type
Finished Leather Import
Year
CIF Value,
Djibouti
Most Significant
Import Partner
(% of total)
2007 52,405 UK (30%)
2008 44,829 China (10%)
2009 285,741 Italy (95%)
Source: Ethiopian Customs Agency
Ethiopia‘s sheepskins are sought worldwide for their thinness and durability, and its
goatskins produce first-rate suede.55
According to the Ethiopian Leather Industry's
Association, however, this favorable perception of Ethiopian sheepskins in the
international market is not fully leveraged by domestic footwear producers by targeting
the production of high end products.
Table 59: Ethiopian Production and Export Statistics, Leather Footwear 2007 – 2009
Production Export Production Export Production Export
Volume (pairs) 1,748,518 416,666 1,719,413 833,333 5,299,250 583,333
Value (USD) 5,580,000$ 5,000,000$ 7,485,852$ 10,000,000$ 86,502,504$ 7,000,000$
2007 2008 2009
Source: Compiled by Global Development Solutions, LLC based on data from the Ethiopian Leather
Industries Association
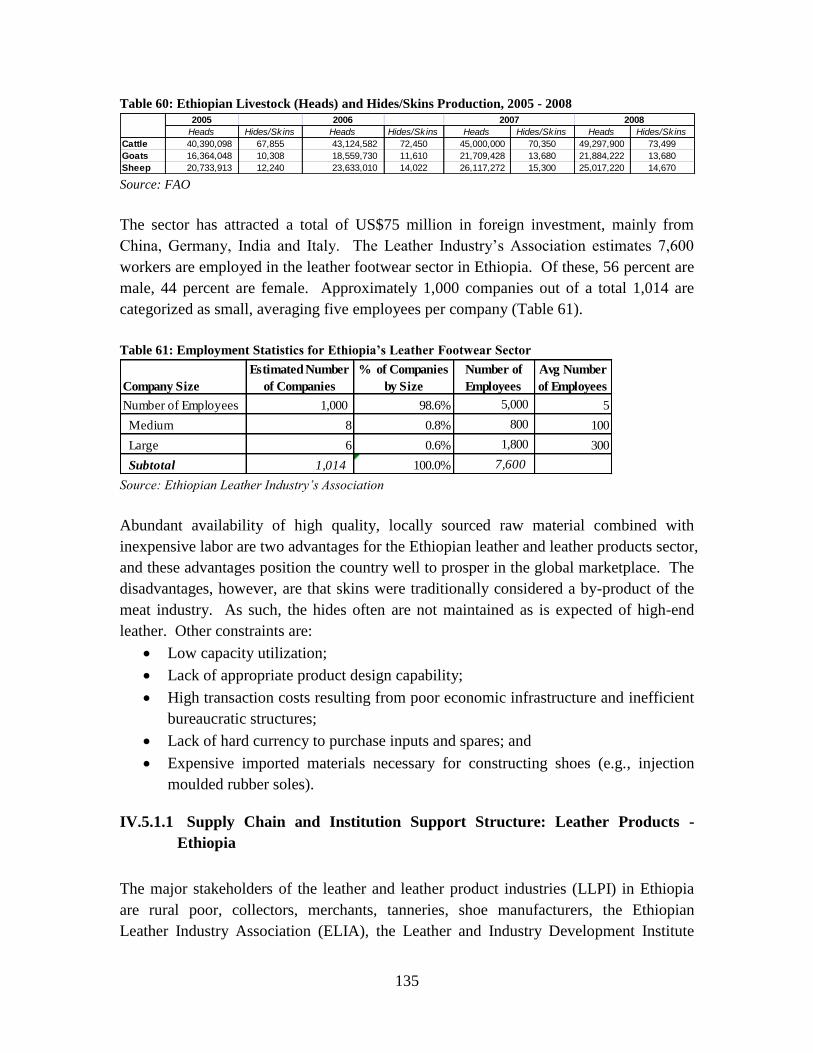
Ethiopia is the leading cattle producing country in Africa and ranks third in heads of goat
and fourth in heads of sheep. As seen in Table 60, total heads of all three of these
livestock have increased since 2005. Ethiopia‘s cowhide production represents 11
percent of total African production while goatskin and sheepskin each comprise 7 percent.
55
http://www.ecbp.biz/actions/current-actions/ethiopias-leather-exports-skyrocket.html
135
Table 60: Ethiopian Livestock (Heads) and Hides/Skins Production, 2005 - 2008
2005 2006
Heads Hides/Skins Heads Hides/Skins Heads Hides/Skins Heads Hides/Skins
Cattle 40,390,098 67,855 43,124,582 72,450 45,000,000 70,350 49,297,900 73,499
Goats 16,364,048 10,308 18,559,730 11,610 21,709,428 13,680 21,884,222 13,680
Sheep 20,733,913 12,240 23,633,010 14,022 26,117,272 15,300 25,017,220 14,670
2007 2008
Source: FAO
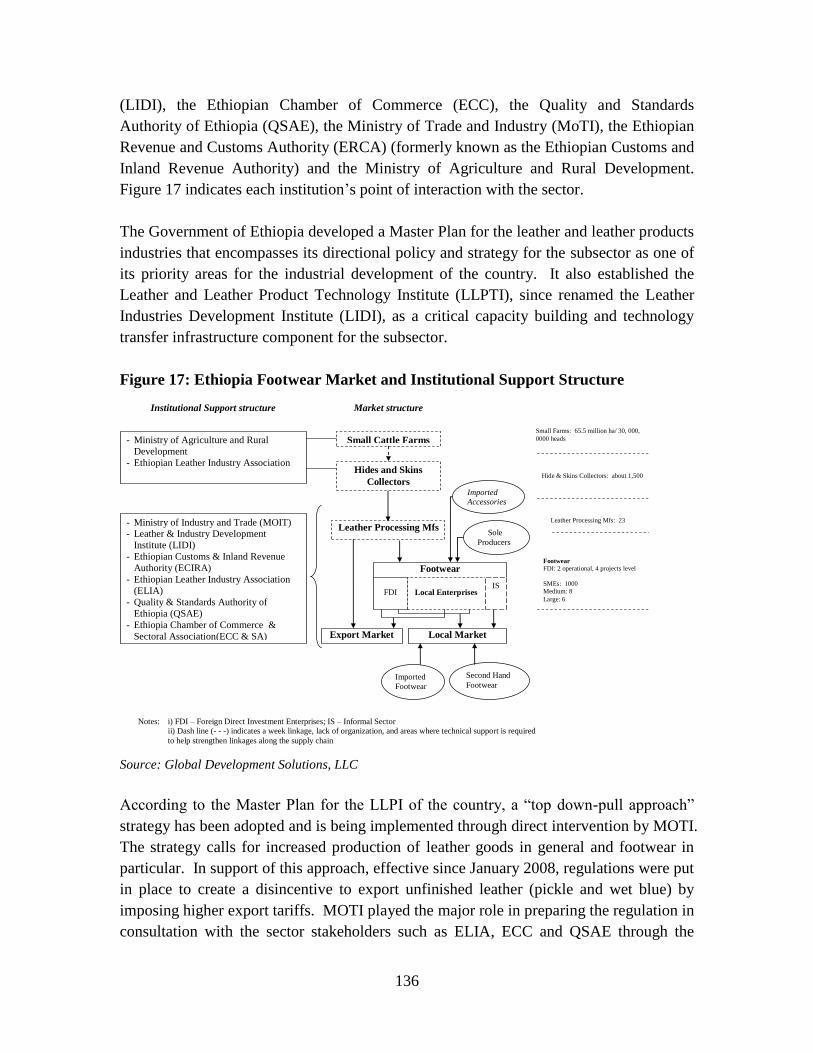
The sector has attracted a total of US$75 million in foreign investment, mainly from
China, Germany, India and Italy. The Leather Industry‘s Association estimates 7,600
workers are employed in the leather footwear sector in Ethiopia. Of these, 56 percent are
male, 44 percent are female. Approximately 1,000 companies out of a total 1,014 are
categorized as small, averaging five employees per company (Table 61).
Table 61: Employment Statistics for Ethiopia’s Leather Footwear Sector
Company Size
Estimated Number
of Companies
% of Companies
by Size
Number of
Employees
Avg Number
of Employees
Number of Employees 1,000 98.6% 5,000 5
Medium 8 0.8% 800 100
Large 6 0.6% 1,800 300
Subtotal 1,014 100.0% 7,600 Source: Ethiopian Leather Industry’s Association
Abundant availability of high quality, locally sourced raw material combined with
inexpensive labor are two advantages for the Ethiopian leather and leather products sector,
and these advantages position the country well to prosper in the global marketplace. The
disadvantages, however, are that skins were traditionally considered a by-product of the
meat industry. As such, the hides often are not maintained as is expected of high-end
leather. Other constraints are:
Low capacity utilization;
Lack of appropriate product design capability;
High transaction costs resulting from poor economic infrastructure and inefficient
bureaucratic structures;
Lack of hard currency to purchase inputs and spares; and
Expensive imported materials necessary for constructing shoes (e.g., injection
moulded rubber soles).
IV.5.1.1 Supply Chain and Institution Support Structure: Leather Products -
Ethiopia
The major stakeholders of the leather and leather product industries (LLPI) in Ethiopia
are rural poor, collectors, merchants, tanneries, shoe manufacturers, the Ethiopian
Leather Industry Association (ELIA), the Leather and Industry Development Institute
136
(LIDI), the Ethiopian Chamber of Commerce (ECC), the Quality and Standards
Authority of Ethiopia (QSAE), the Ministry of Trade and Industry (MoTI), the Ethiopian
Revenue and Customs Authority (ERCA) (formerly known as the Ethiopian Customs and
Inland Revenue Authority) and the Ministry of Agriculture and Rural Development.
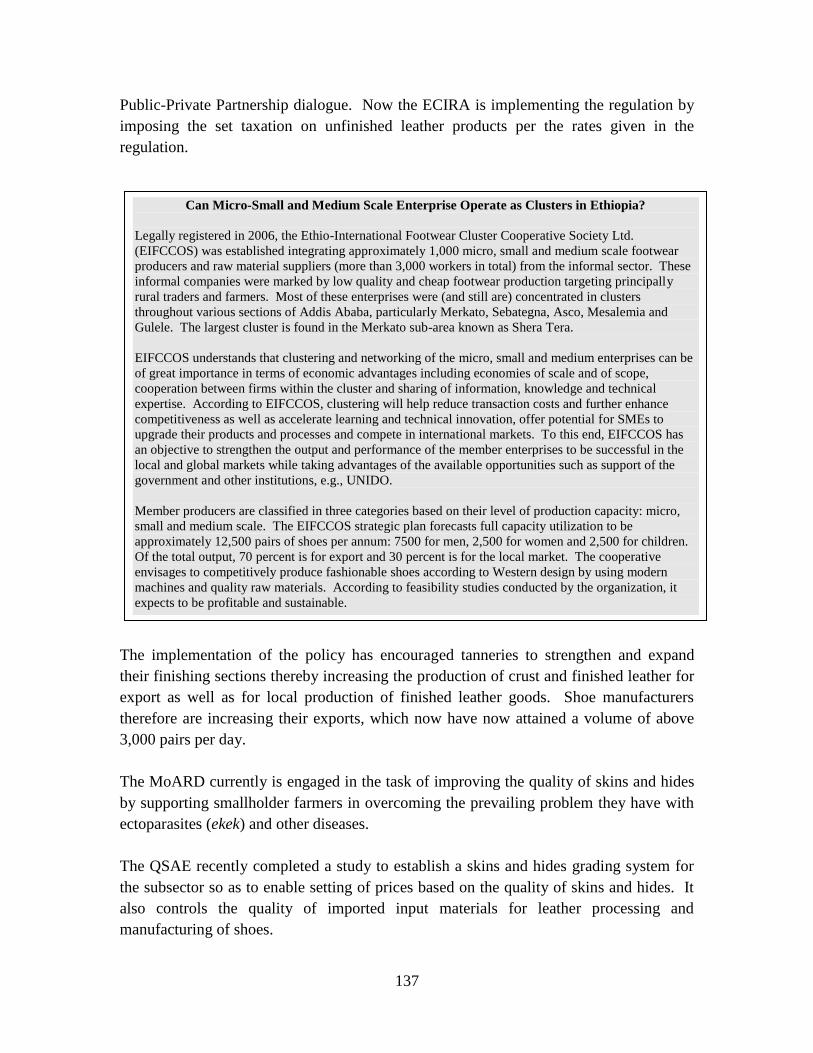
Figure 17 indicates each institution‘s point of interaction with the sector.
The Government of Ethiopia developed a Master Plan for the leather and leather products
industries that encompasses its directional policy and strategy for the subsector as one of
its priority areas for the industrial development of the country. It also established the
Leather and Leather Product Technology Institute (LLPTI), since renamed the Leather
Industries Development Institute (LIDI), as a critical capacity building and technology
transfer infrastructure component for the subsector.
Figure 17: Ethiopia Footwear Market and Institutional Support Structure Ethiopia Footwear Market and Institutional Support Structure
Market structure Institutional Support structure
Small Cattle Farms - Ministry of Agriculture and Rural
Development
- Ethiopian Leather Industry Association
Hides and Skins
Collectors
Leather Processing Mfs
Footwear
FDI
Export Market Local Market
- Ministry of Industry and Trade (MOIT) - Leather & Industry Development
Institute (LIDI)
- Ethiopian Customs & Inland Revenue
Authority (ECIRA)
- Ethiopian Leather Industry Association
(ELIA)
- Quality & Standards Authority of
Ethiopia (QSAE)
- Ethiopia Chamber of Commerce &
Sectoral Association(ECC & SA)
- SA
Notes: i) FDI – Foreign Direct Investment Enterprises; IS – Informal Sector
ii) Dash line (- - -) indicates a week linkage, lack of organization, and areas where technical support is required
to help strengthen linkages along the supply chain
Second Hand
Footwear Imported
Footwear
Imported
Accessories
Local Enterprises
Small Farms: 65.5 million ha/ 30, 000,
0000 heads
Hide & Skins Collectors: about 1,500
Leather Processing Mfs: 23
Footwear
FDI: 2 operational, 4 projects level
SMEs: 1000
Medium: 8
Large: 6
IS
Sole
Producers
Source: Global Development Solutions, LLC
According to the Master Plan for the LLPI of the country, a ―top down-pull approach‖
strategy has been adopted and is being implemented through direct intervention by MOTI.
The strategy calls for increased production of leather goods in general and footwear in
particular. In support of this approach, effective since January 2008, regulations were put
in place to create a disincentive to export unfinished leather (pickle and wet blue) by
imposing higher export tariffs. MOTI played the major role in preparing the regulation in
consultation with the sector stakeholders such as ELIA, ECC and QSAE through the
137
Public-Private Partnership dialogue. Now the ECIRA is implementing the regulation by
imposing the set taxation on unfinished leather products per the rates given in the
regulation.
The implementation of the policy has encouraged tanneries to strengthen and expand
their finishing sections thereby increasing the production of crust and finished leather for
export as well as for local production of finished leather goods. Shoe manufacturers
therefore are increasing their exports, which now have now attained a volume of above
3,000 pairs per day.
The MoARD currently is engaged in the task of improving the quality of skins and hides
by supporting smallholder farmers in overcoming the prevailing problem they have with
ectoparasites (ekek) and other diseases.
The QSAE recently completed a study to establish a skins and hides grading system for
the subsector so as to enable setting of prices based on the quality of skins and hides. It
also controls the quality of imported input materials for leather processing and
manufacturing of shoes.
Can Micro-Small and Medium Scale Enterprise Operate as Clusters in Ethiopia?
Legally registered in 2006, the Ethio-International Footwear Cluster Cooperative Society Ltd.
(EIFCCOS) was established integrating approximately 1,000 micro, small and medium scale footwear
producers and raw material suppliers (more than 3,000 workers in total) from the informal sector. These
informal companies were marked by low quality and cheap footwear production targeting principally
rural traders and farmers. Most of these enterprises were (and still are) concentrated in clusters
throughout various sections of Addis Ababa, particularly Merkato, Sebategna, Asco, Mesalemia and
Gulele. The largest cluster is found in the Merkato sub-area known as Shera Tera.
EIFCCOS understands that clustering and networking of the micro, small and medium enterprises can be
of great importance in terms of economic advantages including economies of scale and of scope,
cooperation between firms within the cluster and sharing of information, knowledge and technical
expertise. According to EIFCCOS, clustering will help reduce transaction costs and further enhance
competitiveness as well as accelerate learning and technical innovation, offer potential for SMEs to
upgrade their products and processes and compete in international markets. To this end, EIFCCOS has
an objective to strengthen the output and performance of the member enterprises to be successful in the
local and global markets while taking advantages of the available opportunities such as support of the
government and other institutions, e.g., UNIDO.
Member producers are classified in three categories based on their level of production capacity: micro,
small and medium scale. The EIFCCOS strategic plan forecasts full capacity utilization to be
approximately 12,500 pairs of shoes per annum: 7500 for men, 2,500 for women and 2,500 for children.
Of the total output, 70 percent is for export and 30 percent is for the local market. The cooperative
envisages to competitively produce fashionable shoes according to Western design by using modern
machines and quality raw materials. According to feasibility studies conducted by the organization, it
expects to be profitable and sustainable.
138
IV.5.2. Sector Profile: Leather and Leather Footwear in Tanzania
Tanzanian annual industrial production surveys cover only ‗large industrial
establishments operating in mainland Tanzania‘56
– the term ‗large‘ as used in industrial
production surveys is a terminology used to highlight the fact that micro enterprises
(employing less than 10 people) are not covered by these surveys. Based on the Business
Survey 2007/08, there were 25,000 manufacturing enterprises with permanent premises
operating in Tanzania, and 97 percent of them were micro/small scale manufactures with
less than 10 workers. 57
The distribution of such enterprises across sectors, the number of
employees and other indicators are not known and are not covered in this sector profile.
This sector profile covers only firms employing 10 or more people, officially recorded as
‗industrial enterprises/manufacturing establishments‘ under national statistics.
Tanzanian leather products and leather footwear manufacturing is extremely limited. In
2008, the country had two operational tanneries out of six. The estimated annual leather
processing capacity in Tanzania is roughly 40 million square feet, only 9 percent of
which is utilized.58
In terms of leather products‘ manufacturers (of saddlery, harness,
belts, bags, etc.), there are an estimated four firms making such products in Tanzania.59
In terms of leather footwear producers, only five firms are estimated to make such
products.60
The industrial survey undertaken in 2008 does not distinguish leather
footwear firm employment from employment in footwear in general, and precise figures
of employment in the leather footwear sector are not available. According to interviews
with leather and other footwear firms in the country, not more than 200 workers are
employed in the leather footwear sector in Tanzania (excluding micro/small enterprises
employing less than 10 people). Of these, 58 percent are male and 42 percent are female
(see Table 62 below).61
56
Annual Survey of Industrial Production 2008, Tanzania Ministry of Industry, Trade, and Marketing. 57
National Bureau of Statistics, Tanzania 58
International Trade Center. 59
Note that shoe makers and other leather product makers make a variety of leather products
interchangeably, depending on orders. Micro/small firms employing less than ten people not included. 60
Ibid. 61
Average based on reported breakdown from Industrial Survey 2008, aggregate item ‗manufacture of
textiles, wearing apparel and leather products.‘
139
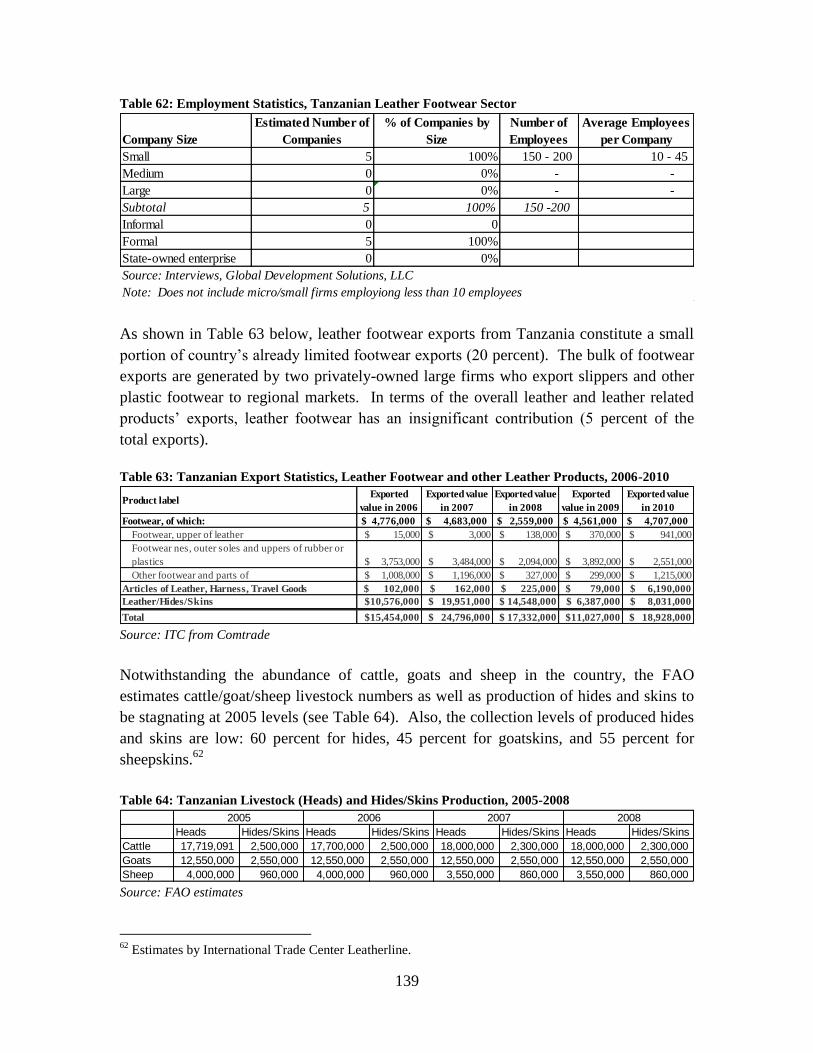
Table 62: Employment Statistics, Tanzanian Leather Footwear Sector
Company Size
Estimated Number of
Companies
% of Companies by
Size
Number of
Employees
Average Employees
per Company
Small 5 100% 150 - 200 10 - 45
Medium 0 0% - -
Large 0 0% - -
Subtotal 5 100% 150 -200
Informal 0 0
Formal 5 100%
State-owned enterprise 0 0%
Source: Interviews, Global Development Solutions, LLC
Note: Does not include micro/small firms employiong less than 10 employees
As shown in Table 63 below, leather footwear exports from Tanzania constitute a small
portion of country‘s already limited footwear exports (20 percent). The bulk of footwear
exports are generated by two privately-owned large firms who export slippers and other
plastic footwear to regional markets. In terms of the overall leather and leather related
products‘ exports, leather footwear has an insignificant contribution (5 percent of the
total exports).
Table 63: Tanzanian Export Statistics, Leather Footwear and other Leather Products, 2006-2010
Product labelExported
value in 2006
Exported value
in 2007
Exported value
in 2008
Exported
value in 2009
Exported value
in 2010
Footwear, of which: $ 4,776,000 $ 4,683,000 $ 2,559,000 $ 4,561,000 $ 4,707,000
Footwear, upper of leather $ 15,000 $ 3,000 $ 138,000 $ 370,000 $ 941,000
Footwear nes, outer soles and uppers of rubber or
plastics $ 3,753,000 $ 3,484,000 $ 2,094,000 $ 3,892,000 $ 2,551,000
Other footwear and parts of $ 1,008,000 $ 1,196,000 $ 327,000 $ 299,000 $ 1,215,000
Articles of Leather, Harness, Travel Goods $ 102,000 $ 162,000 $ 225,000 $ 79,000 $ 6,190,000
Leather/Hides/Skins $10,576,000 $ 19,951,000 $ 14,548,000 $ 6,387,000 $ 8,031,000
Total $15,454,000 $ 24,796,000 $ 17,332,000 $11,027,000 $ 18,928,000 Source: ITC from Comtrade
Notwithstanding the abundance of cattle, goats and sheep in the country, the FAO
estimates cattle/goat/sheep livestock numbers as well as production of hides and skins to
be stagnating at 2005 levels (see Table 64). Also, the collection levels of produced hides
and skins are low: 60 percent for hides, 45 percent for goatskins, and 55 percent for
sheepskins.62
Table 64: Tanzanian Livestock (Heads) and Hides/Skins Production, 2005-2008
Heads Hides/Skins Heads Hides/Skins Heads Hides/Skins Heads Hides/Skins
Cattle 17,719,091 2,500,000 17,700,000 2,500,000 18,000,000 2,300,000 18,000,000 2,300,000
Goats 12,550,000 2,550,000 12,550,000 2,550,000 12,550,000 2,550,000 12,550,000 2,550,000
Sheep 4,000,000 960,000 4,000,000 960,000 3,550,000 860,000 3,550,000 860,000
2005 2006 2007 2008
Source: FAO estimates
62
Estimates by International Trade Center Leatherline.
140
In the current environment, the leather products and footwear sector faces a range of
challenges:
Insufficient supply of quality of hides/skins/leather due to a combination of
factors:
o Poor flaying methods (99 percent by hand)63
;
o Major/most tanneries not operational;
o Higher quality hides/skins available/produced locally are exported
informally to avoid export taxes.
Lack of appropriate product design capability;
Poor enforcement of trade regulations and rules, especially in terms of flow of
informal trade in Asian footwear/leather products; and
Relatively high manufacturing wages.
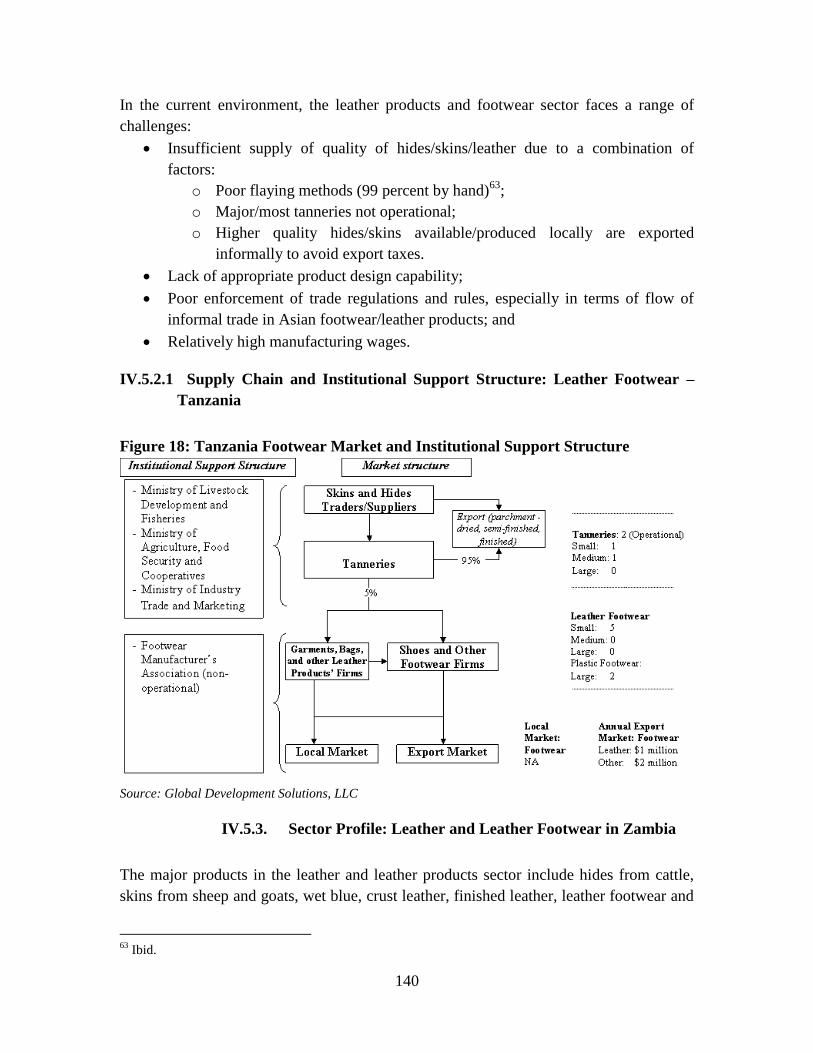
IV.5.2.1 Supply Chain and Institutional Support Structure: Leather Footwear –
Tanzania
Figure 18: Tanzania Footwear Market and Institutional Support Structure
Source: Global Development Solutions, LLC
IV.5.3. Sector Profile: Leather and Leather Footwear in Zambia
The major products in the leather and leather products sector include hides from cattle,
skins from sheep and goats, wet blue, crust leather, finished leather, leather footwear and
63
Ibid.
141
leather goods. Other sources of hides and skins include wildlife, game ranching and
crocodile farming.
The development of the processed leather industry in Zambia is strongly based on
availability of quality hides and skins, which are by-products of the meat industry. Hides
and skins are found throughout the country, and their availability depends on the
efficiency of collection and access to markets by traders, farmers and abattoir operators.
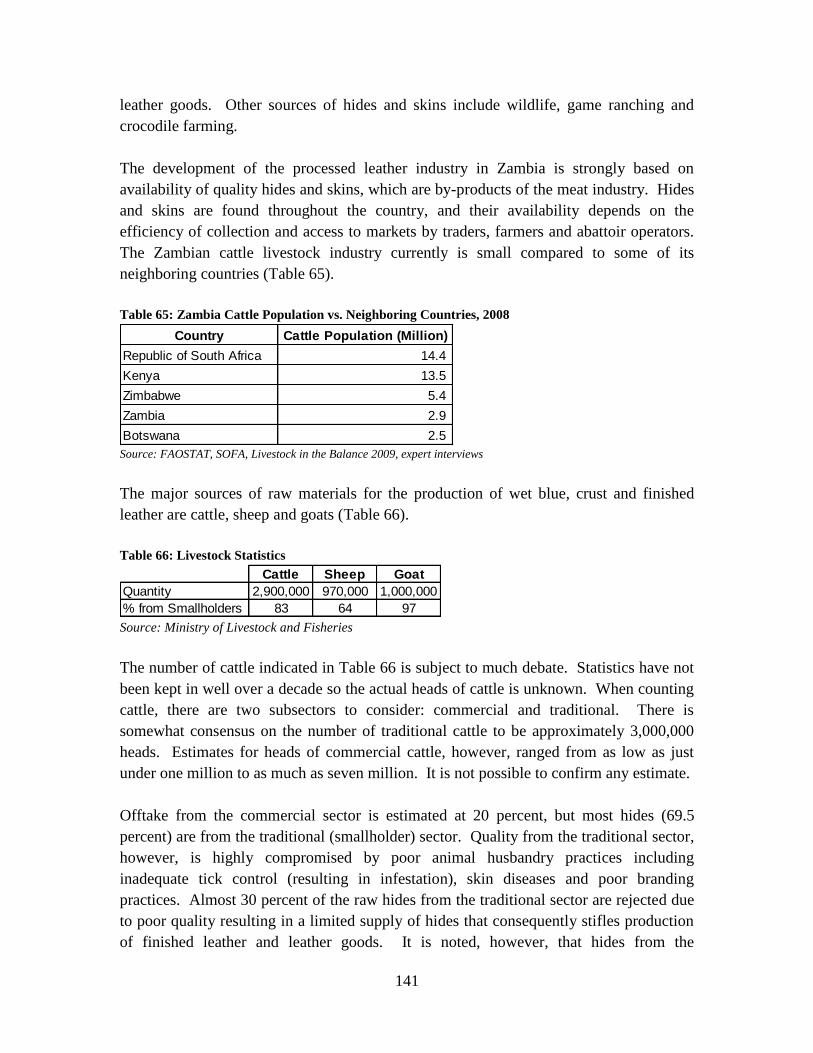
The Zambian cattle livestock industry currently is small compared to some of its
neighboring countries (Table 65).
Table 65: Zambia Cattle Population vs. Neighboring Countries, 2008
Country Cattle Population (Million)
Republic of South Africa 14.4
Kenya 13.5
Zimbabwe 5.4
Zambia 2.9
Botswana 2.5 Source: FAOSTAT, SOFA, Livestock in the Balance 2009, expert interviews
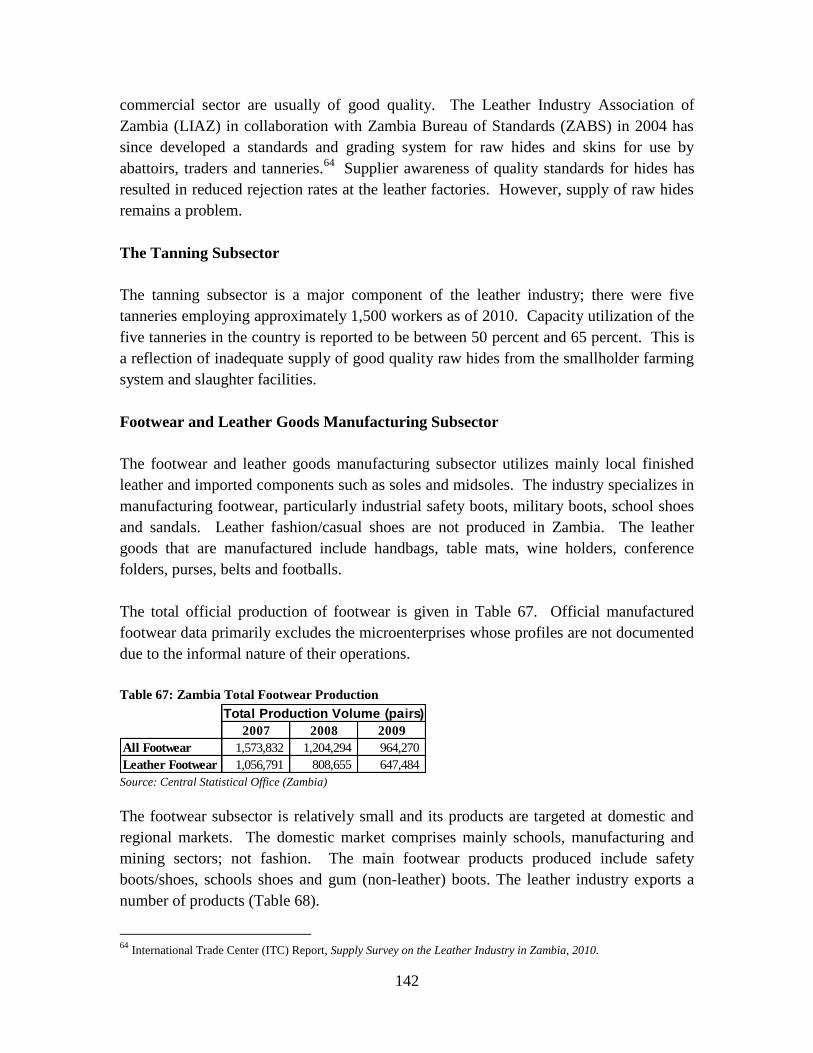
The major sources of raw materials for the production of wet blue, crust and finished
leather are cattle, sheep and goats (Table 66).
Table 66: Livestock Statistics
Cattle Sheep Goat
Quantity 2,900,000 970,000 1,000,000
% from Smallholders 83 64 97 Source: Ministry of Livestock and Fisheries
The number of cattle indicated in Table 66 is subject to much debate. Statistics have not
been kept in well over a decade so the actual heads of cattle is unknown. When counting
cattle, there are two subsectors to consider: commercial and traditional. There is
somewhat consensus on the number of traditional cattle to be approximately 3,000,000
heads. Estimates for heads of commercial cattle, however, ranged from as low as just
under one million to as much as seven million. It is not possible to confirm any estimate.
Offtake from the commercial sector is estimated at 20 percent, but most hides (69.5
percent) are from the traditional (smallholder) sector. Quality from the traditional sector,
however, is highly compromised by poor animal husbandry practices including
inadequate tick control (resulting in infestation), skin diseases and poor branding
practices. Almost 30 percent of the raw hides from the traditional sector are rejected due
to poor quality resulting in a limited supply of hides that consequently stifles production
of finished leather and leather goods. It is noted, however, that hides from the
142
commercial sector are usually of good quality. The Leather Industry Association of
Zambia (LIAZ) in collaboration with Zambia Bureau of Standards (ZABS) in 2004 has
since developed a standards and grading system for raw hides and skins for use by
abattoirs, traders and tanneries.64
Supplier awareness of quality standards for hides has
resulted in reduced rejection rates at the leather factories. However, supply of raw hides
remains a problem.
The Tanning Subsector
The tanning subsector is a major component of the leather industry; there were five
tanneries employing approximately 1,500 workers as of 2010. Capacity utilization of the
five tanneries in the country is reported to be between 50 percent and 65 percent. This is
a reflection of inadequate supply of good quality raw hides from the smallholder farming
system and slaughter facilities.
Footwear and Leather Goods Manufacturing Subsector
The footwear and leather goods manufacturing subsector utilizes mainly local finished
leather and imported components such as soles and midsoles. The industry specializes in
manufacturing footwear, particularly industrial safety boots, military boots, school shoes
and sandals. Leather fashion/casual shoes are not produced in Zambia. The leather
goods that are manufactured include handbags, table mats, wine holders, conference
folders, purses, belts and footballs.
The total official production of footwear is given in Table 67. Official manufactured
footwear data primarily excludes the microenterprises whose profiles are not documented
due to the informal nature of their operations.
Table 67: Zambia Total Footwear Production
2007 2008 2009
All Footwear 1,573,832 1,204,294 964,270
Leather Footwear 1,056,791 808,655 647,484
Total Production Volume (pairs)
Source: Central Statistical Office (Zambia)
The footwear subsector is relatively small and its products are targeted at domestic and
regional markets. The domestic market comprises mainly schools, manufacturing and
mining sectors; not fashion. The main footwear products produced include safety
boots/shoes, schools shoes and gum (non-leather) boots. The leather industry exports a
number of products (Table 68).
64
International Trade Center (ITC) Report, Supply Survey on the Leather Industry in Zambia, 2010.
143
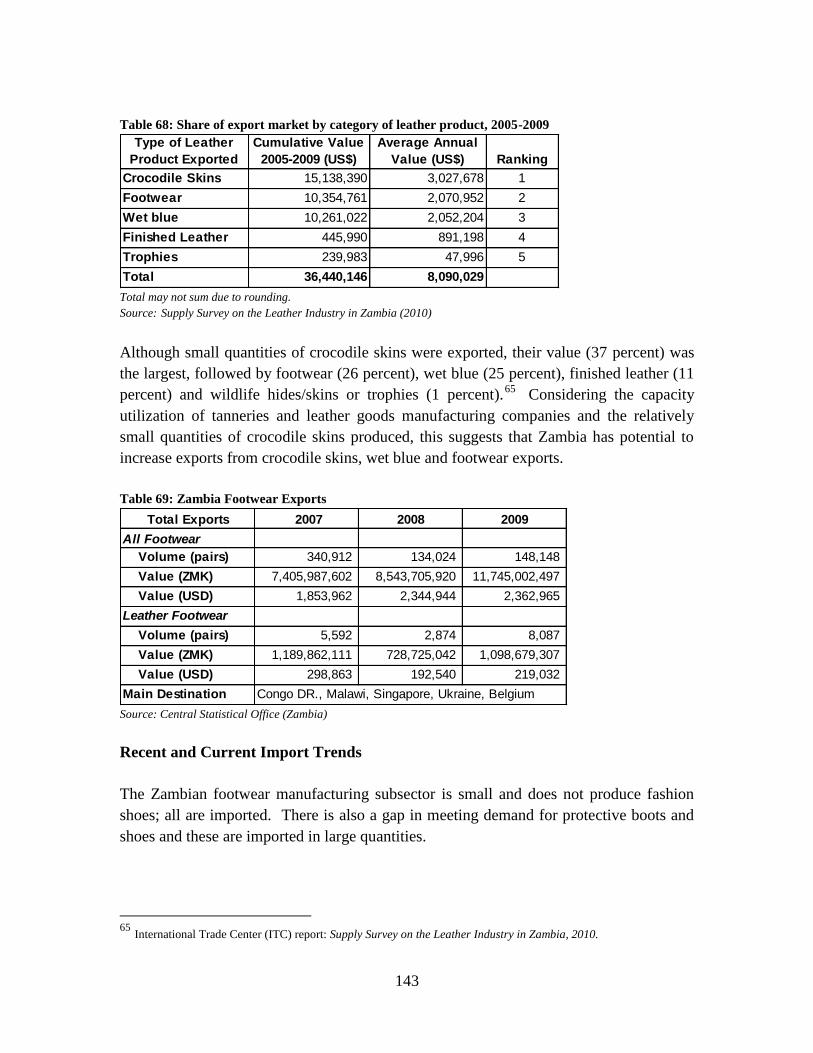
Table 68: Share of export market by category of leather product, 2005-2009
Type of Leather
Product Exported
Cumulative Value
2005-2009 (US$)
Average Annual
Value (US$) Ranking
Crocodile Skins 15,138,390 3,027,678 1
Footwear 10,354,761 2,070,952 2
Wet blue 10,261,022 2,052,204 3
Finished Leather 445,990 891,198 4
Trophies 239,983 47,996 5
Total 36,440,146 8,090,029
Total may not sum due to rounding.
Source: Supply Survey on the Leather Industry in Zambia (2010)
Although small quantities of crocodile skins were exported, their value (37 percent) was
the largest, followed by footwear (26 percent), wet blue (25 percent), finished leather (11
percent) and wildlife hides/skins or trophies (1 percent).65
Considering the capacity
utilization of tanneries and leather goods manufacturing companies and the relatively
small quantities of crocodile skins produced, this suggests that Zambia has potential to
increase exports from crocodile skins, wet blue and footwear exports.
Table 69: Zambia Footwear Exports
Total Exports 2007 2008 2009
All Footwear
Volume (pairs) 340,912 134,024 148,148
Value (ZMK) 7,405,987,602 8,543,705,920 11,745,002,497
Value (USD) 1,853,962 2,344,944 2,362,965
Leather Footwear
Volume (pairs) 5,592 2,874 8,087
Value (ZMK) 1,189,862,111 728,725,042 1,098,679,307
Value (USD) 298,863 192,540 219,032
Main Destination Congo DR., Malawi, Singapore, Ukraine, Belgium
Source: Central Statistical Office (Zambia)
Recent and Current Import Trends
The Zambian footwear manufacturing subsector is small and does not produce fashion
shoes; all are imported. There is also a gap in meeting demand for protective boots and
shoes and these are imported in large quantities.
65
International Trade Center (ITC) report: Supply Survey on the Leather Industry in Zambia, 2010.
144
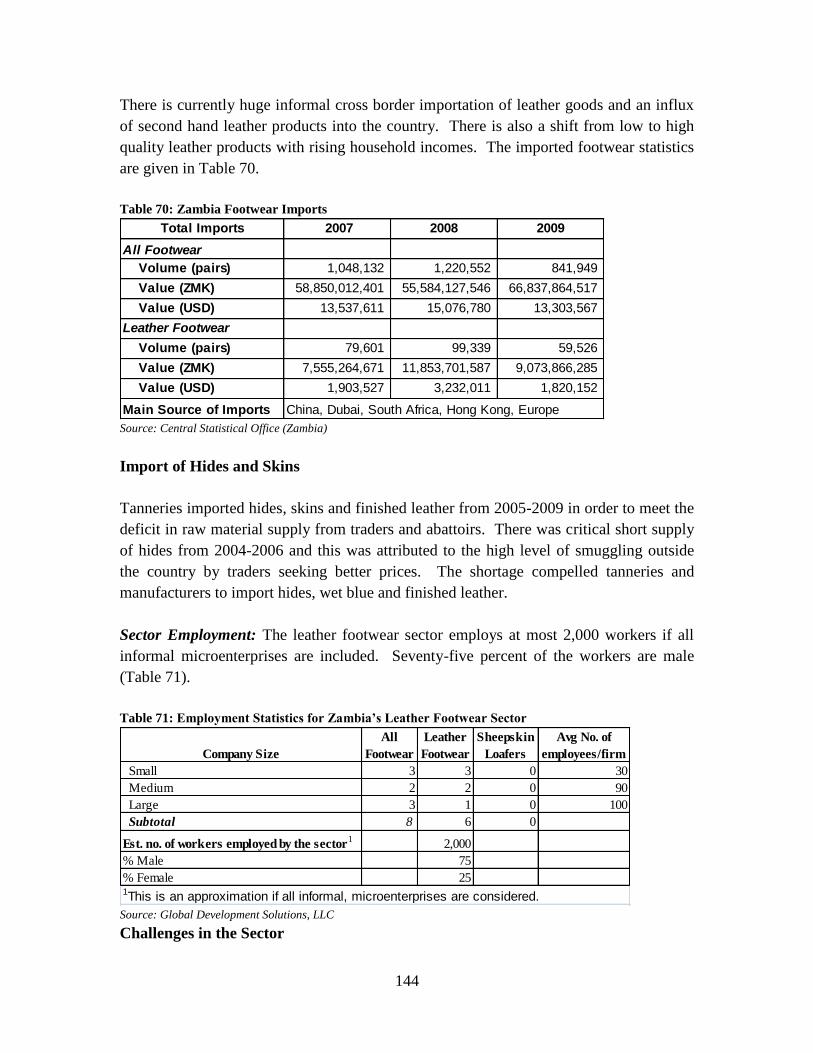
There is currently huge informal cross border importation of leather goods and an influx
of second hand leather products into the country. There is also a shift from low to high
quality leather products with rising household incomes. The imported footwear statistics
are given in Table 70.
Table 70: Zambia Footwear Imports
Total Imports 2007 2008 2009
All Footwear
Volume (pairs) 1,048,132 1,220,552 841,949
Value (ZMK) 58,850,012,401 55,584,127,546 66,837,864,517
Value (USD) 13,537,611 15,076,780 13,303,567
Leather Footwear
Volume (pairs) 79,601 99,339 59,526
Value (ZMK) 7,555,264,671 11,853,701,587 9,073,866,285
Value (USD) 1,903,527 3,232,011 1,820,152
Main Source of Imports China, Dubai, South Africa, Hong Kong, Europe Source: Central Statistical Office (Zambia)
Import of Hides and Skins
Tanneries imported hides, skins and finished leather from 2005-2009 in order to meet the
deficit in raw material supply from traders and abattoirs. There was critical short supply
of hides from 2004-2006 and this was attributed to the high level of smuggling outside
the country by traders seeking better prices. The shortage compelled tanneries and
manufacturers to import hides, wet blue and finished leather.
Sector Employment: The leather footwear sector employs at most 2,000 workers if all
informal microenterprises are included. Seventy-five percent of the workers are male
(Table 71).
Table 71: Employment Statistics for Zambia’s Leather Footwear Sector
Company Size
All
Footwear
Leather
Footwear
Sheepskin
Loafers
Avg No. of
employees/firm
Small 3 3 0 30
Medium 2 2 0 90
Large 3 1 0 100
Subtotal 8 6 0
Est. no. of workers employed by the sector1
2,000
% Male 75
% Female 251This is an approximation if all informal, microenterprises are considered.
Source: Global Development Solutions, LLC
Challenges in the Sector
145
The footwear and leather goods subsector currently is facing many challenges. The main
challenges are given as:
The use of old and obsolete machines;
The lack of design expertise and supporting technologies to produce fashionable
products;
Skills shortages;
Poor supply of quality raw hides;
The high costs of finance;
High costs of production inputs;
High import tariffs on inputs (25 percent on finished leather and 15 - 25 percent
on midsoles and outsoles);
High volatility of the local currency against major foreign currencies; and
High volume of second hand shoe imports due to the lack of import restrictions
and tariffs equal to that of raw materials for shoe manufacturing (25 percent).
Other challenges include the global economic downturn of 2008-2009 that made the
entire production sector decline. During the economic downturn, market access by
exporters of wet blue, finished leather and leather goods declined significantly due to low
demand for these products on the international market.
146
IV.5.3.1 Supply Chain and Institution Support Structure: Leather Footwear –
Zambia
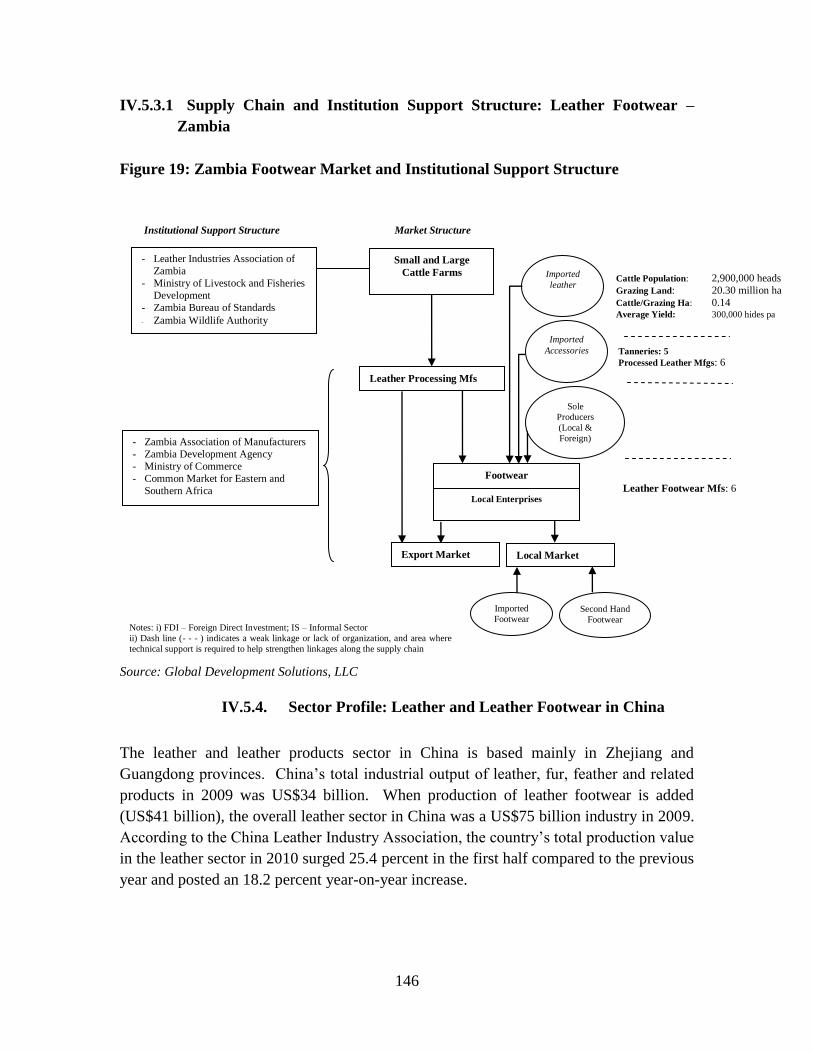
Figure 19: Zambia Footwear Market and Institutional Support Structure
Tanneries: 5
Processed Leather Mfgs: 6
- Leather Industries Association of
Zambia
- Ministry of Livestock and Fisheries
Development
- Zambia Bureau of Standards
- Zambia Wildlife Authority
- Zambia Association of Manufacturers
- Zambia Development Agency
- Ministry of Commerce
- Common Market for Eastern and
Southern Africa
-
Institutional Support Structure Market Structure
Small and Large
Cattle Farms
Leather Footwear Mfs: 6
Notes: i) FDI – Foreign Direct Investment; IS – Informal Sector
ii) Dash line (- - - ) indicates a weak linkage or lack of organization, and area where
technical support is required to help strengthen linkages along the supply chain
Leather Processing Mfs
Imported
leather
Imported
Accessories
Sole
Producers
(Local &
Foreign)
Cattle Population: 2,900,000 heads
Grazing Land: 20.30 million ha
Cattle/Grazing Ha: 0.14 Average Yield: 300,000 hides pa
Export Market Local Market
Local Enterprises
Footwear
Second Hand
Footwear
Imported
Footwear
Source: Global Development Solutions, LLC
IV.5.4. Sector Profile: Leather and Leather Footwear in China
The leather and leather products sector in China is based mainly in Zhejiang and
Guangdong provinces. China‘s total industrial output of leather, fur, feather and related
products in 2009 was US$34 billion. When production of leather footwear is added
(US$41 billion), the overall leather sector in China was a US$75 billion industry in 2009.
According to the China Leather Industry Association, the country‘s total production value
in the leather sector in 2010 surged 25.4 percent in the first half compared to the previous
year and posted an 18.2 percent year-on-year increase.
147
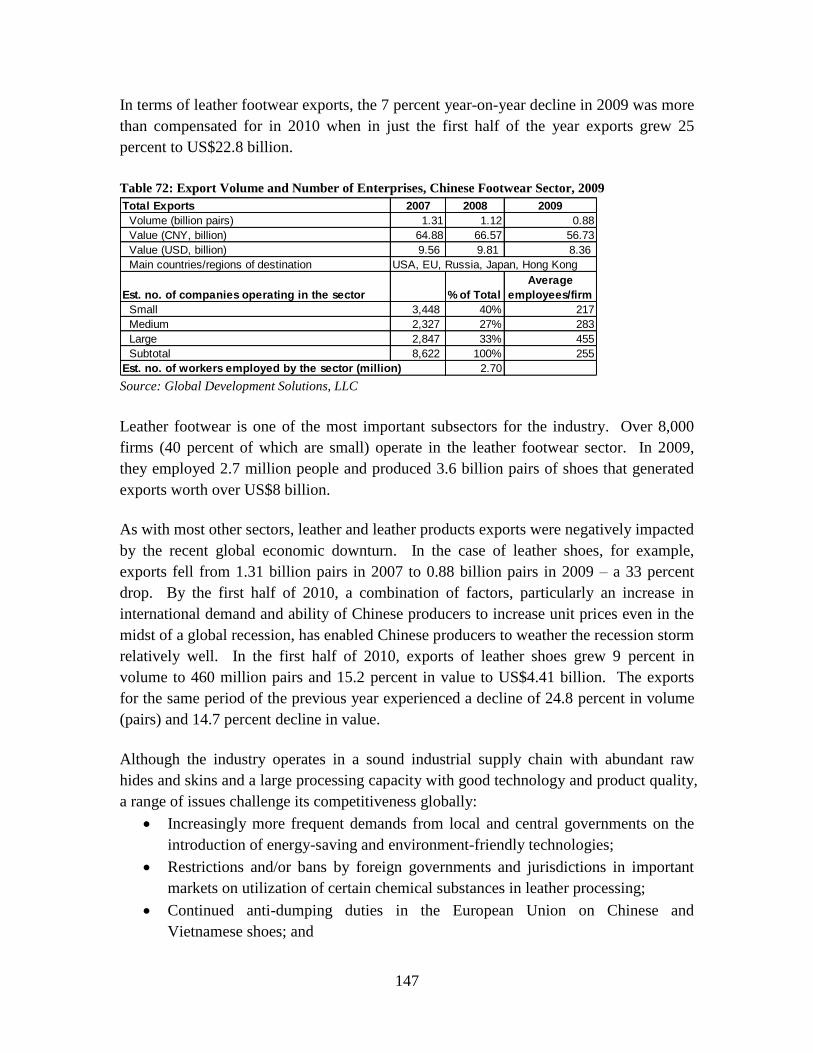
In terms of leather footwear exports, the 7 percent year-on-year decline in 2009 was more
than compensated for in 2010 when in just the first half of the year exports grew 25
percent to US$22.8 billion.
Table 72: Export Volume and Number of Enterprises, Chinese Footwear Sector, 2009
Total Exports 2007 2008 2009
Volume (billion pairs) 1.31 1.12 0.88
Value (CNY, billion) 64.88 66.57 56.73
Value (USD, billion) 9.56 9.81 8.36
Main countries/regions of destination USA, EU, Russia, Japan, Hong Kong
Est. no. of companies operating in the sector % of Total
Average
employees/firm
Small 3,448 40% 217
Medium 2,327 27% 283
Large 2,847 33% 455
Subtotal 8,622 100% 255
Est. no. of workers employed by the sector (million) 2.70 Source: Global Development Solutions, LLC
Leather footwear is one of the most important subsectors for the industry. Over 8,000
firms (40 percent of which are small) operate in the leather footwear sector. In 2009,
they employed 2.7 million people and produced 3.6 billion pairs of shoes that generated
exports worth over US$8 billion.
As with most other sectors, leather and leather products exports were negatively impacted
by the recent global economic downturn. In the case of leather shoes, for example,
exports fell from 1.31 billion pairs in 2007 to 0.88 billion pairs in 2009 – a 33 percent
drop. By the first half of 2010, a combination of factors, particularly an increase in
international demand and ability of Chinese producers to increase unit prices even in the
midst of a global recession, has enabled Chinese producers to weather the recession storm
relatively well. In the first half of 2010, exports of leather shoes grew 9 percent in
volume to 460 million pairs and 15.2 percent in value to US$4.41 billion. The exports
for the same period of the previous year experienced a decline of 24.8 percent in volume
(pairs) and 14.7 percent decline in value.
Although the industry operates in a sound industrial supply chain with abundant raw
hides and skins and a large processing capacity with good technology and product quality,
a range of issues challenge its competitiveness globally:
Increasingly more frequent demands from local and central governments on the
introduction of energy-saving and environment-friendly technologies;
Restrictions and/or bans by foreign governments and jurisdictions in important
markets on utilization of certain chemical substances in leather processing;
Continued anti-dumping duties in the European Union on Chinese and
Vietnamese shoes; and
148
Increasing labor costs and high labor turnover rates.
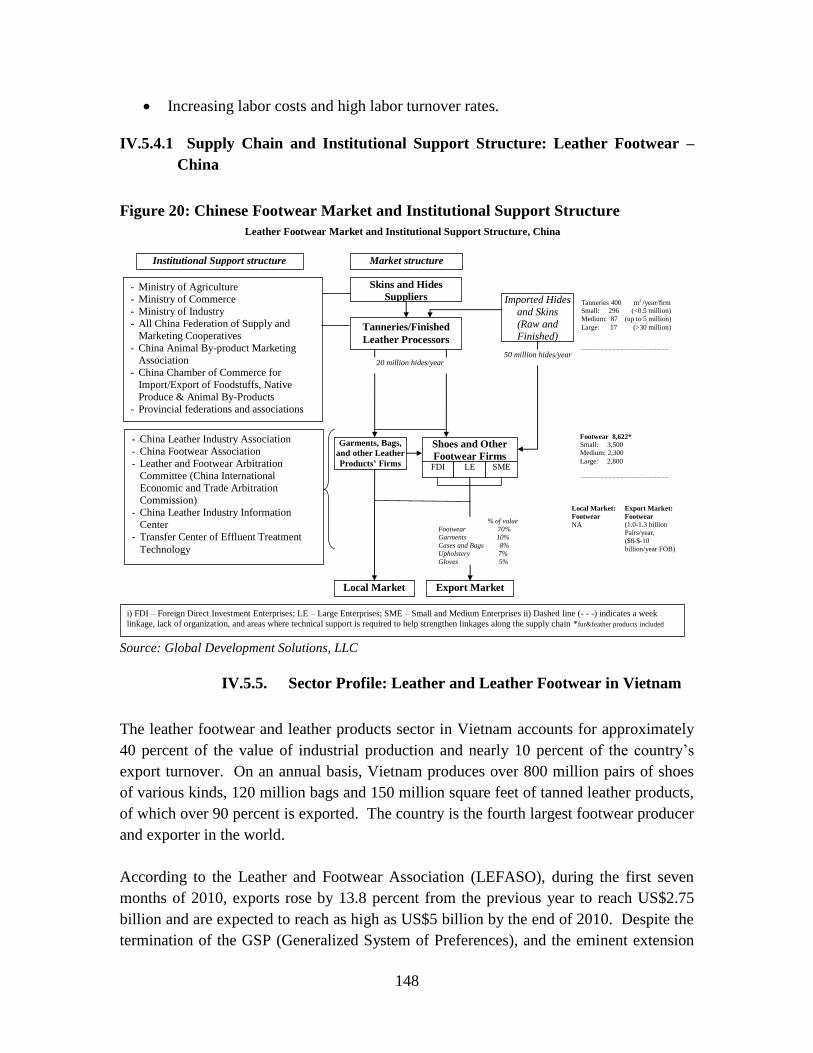
IV.5.4.1 Supply Chain and Institutional Support Structure: Leather Footwear –
China
Figure 20: Chinese Footwear Market and Institutional Support Structure
Market structure Institutional Support structure
- Ministry of Agriculture
- Ministry of Commerce
- Ministry of Industry
- All China Federation of Supply and
Marketing Cooperatives
- China Animal By-product Marketing
Association
- China Chamber of Commerce for
Import/Export of Foodstuffs, Native
Produce & Animal By-Products
- Provincial federations and associations
- China Leather Industry Association
- China Footwear Association
- Leather and Footwear Arbitration
Committee (China International
Economic and Trade Arbitration
Commission)
- China Leather Industry Information
Center
- Transfer Center of Effluent Treatment
Technology
i) FDI – Foreign Direct Investment Enterprises; LE – Large Enterprises; SME – Small and Medium Enterprises ii) Dashed line (- - -) indicates a week
linkage, lack of organization, and areas where technical support is required to help strengthen linkages along the supply chain *fur&feather products included
Skins and Hides
Suppliers
Tanneries/Finished
Leather Processors
Imported Hides
and Skins
(Raw and
Finished)
Garments, Bags,
and other Leather
Products’ Firms
Shoes and Other
Footwear Firms FDI LE SME
Local Market Export Market
Tanneries 400 m2 /year/firm Small: 296 (<0.5 million)
Medium: 87 (up to 5 million)
Large: 17 (>30 million)
Footwear 8,622*
Small: 3,500
Medium: 2,300
Large: 2,800
Export Market:
Footwear
(1.0-1.3 billion
Pairs/year,
($8-$-10
billion/year FOB)
Local Market:
Footwear
NA
50 million hides/year 20 million hides/year
% of value
Footwear 70%
Garments 10%
Cases and Bags 8%
Upholstery 7%
Gloves 5%
Leather Footwear Market and Institutional Support Structure, China
Source: Global Development Solutions, LLC
IV.5.5. Sector Profile: Leather and Leather Footwear in Vietnam
The leather footwear and leather products sector in Vietnam accounts for approximately
40 percent of the value of industrial production and nearly 10 percent of the country‘s
export turnover. On an annual basis, Vietnam produces over 800 million pairs of shoes
of various kinds, 120 million bags and 150 million square feet of tanned leather products,
of which over 90 percent is exported. The country is the fourth largest footwear producer
and exporter in the world.
According to the Leather and Footwear Association (LEFASO), during the first seven
months of 2010, exports rose by 13.8 percent from the previous year to reach US$2.75
billion and are expected to reach as high as US$5 billion by the end of 2010. Despite the
termination of the GSP (Generalized System of Preferences), and the eminent extension
149
of the anti-dumping duties on Vietnamese leather-capped shoes until 2011 by the EU,
currently the European market is Vietnam‘s biggest buyer with nearly 50 percent of the
country‘s total export turnover followed by the US (25 percent) and Japan (3 percent).
According to LEFASO, the sector employs approximately 632,260 workers; 82 percent
of which are female (only 18 percent are male). Since much of the production of leather
shoes is done on a subcontracting basis, the sector is represented evenly by small,
medium and large enterprises. The number of officially registered enterprises in the
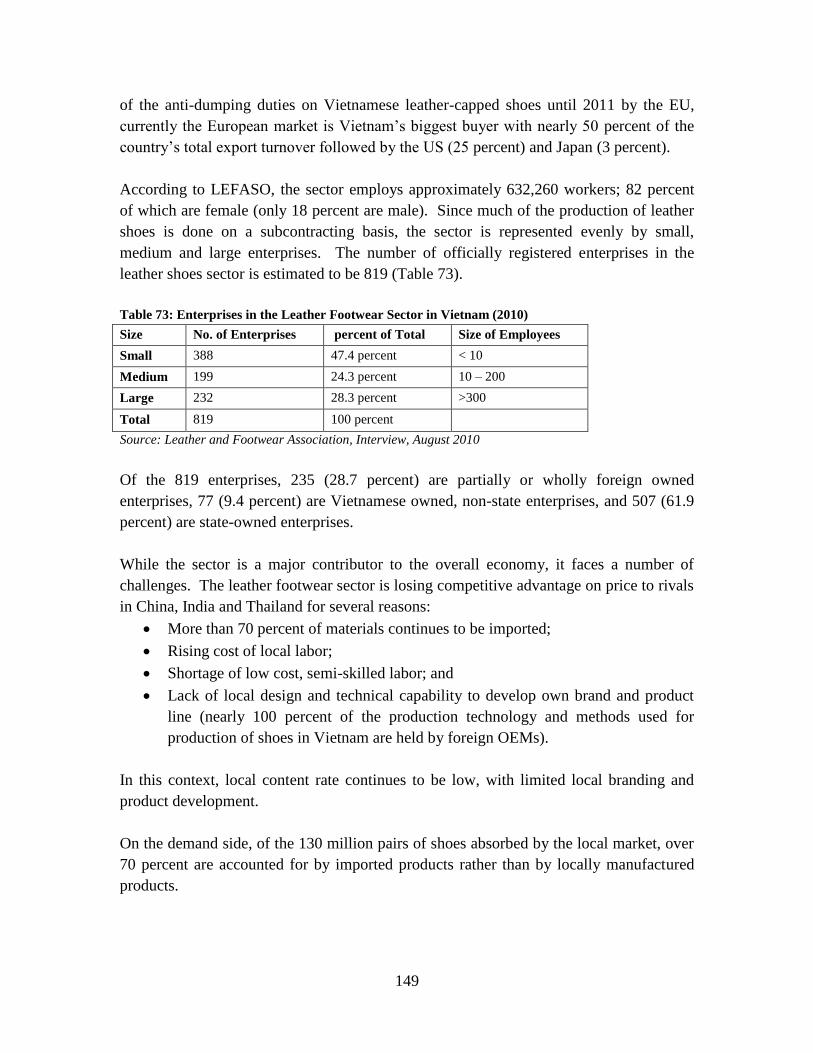
leather shoes sector is estimated to be 819 (Table 73).
Table 73: Enterprises in the Leather Footwear Sector in Vietnam (2010)
Size No. of Enterprises percent of Total Size of Employees
Small 388 47.4 percent < 10
Medium 199 24.3 percent 10 – 200
Large 232 28.3 percent >300
Total 819 100 percent
Source: Leather and Footwear Association, Interview, August 2010
Of the 819 enterprises, 235 (28.7 percent) are partially or wholly foreign owned
enterprises, 77 (9.4 percent) are Vietnamese owned, non-state enterprises, and 507 (61.9
percent) are state-owned enterprises.
While the sector is a major contributor to the overall economy, it faces a number of
challenges. The leather footwear sector is losing competitive advantage on price to rivals
in China, India and Thailand for several reasons:
More than 70 percent of materials continues to be imported;
Rising cost of local labor;
Shortage of low cost, semi-skilled labor; and
Lack of local design and technical capability to develop own brand and product
line (nearly 100 percent of the production technology and methods used for
production of shoes in Vietnam are held by foreign OEMs).
In this context, local content rate continues to be low, with limited local branding and
product development.
On the demand side, of the 130 million pairs of shoes absorbed by the local market, over
70 percent are accounted for by imported products rather than by locally manufactured
products.
150
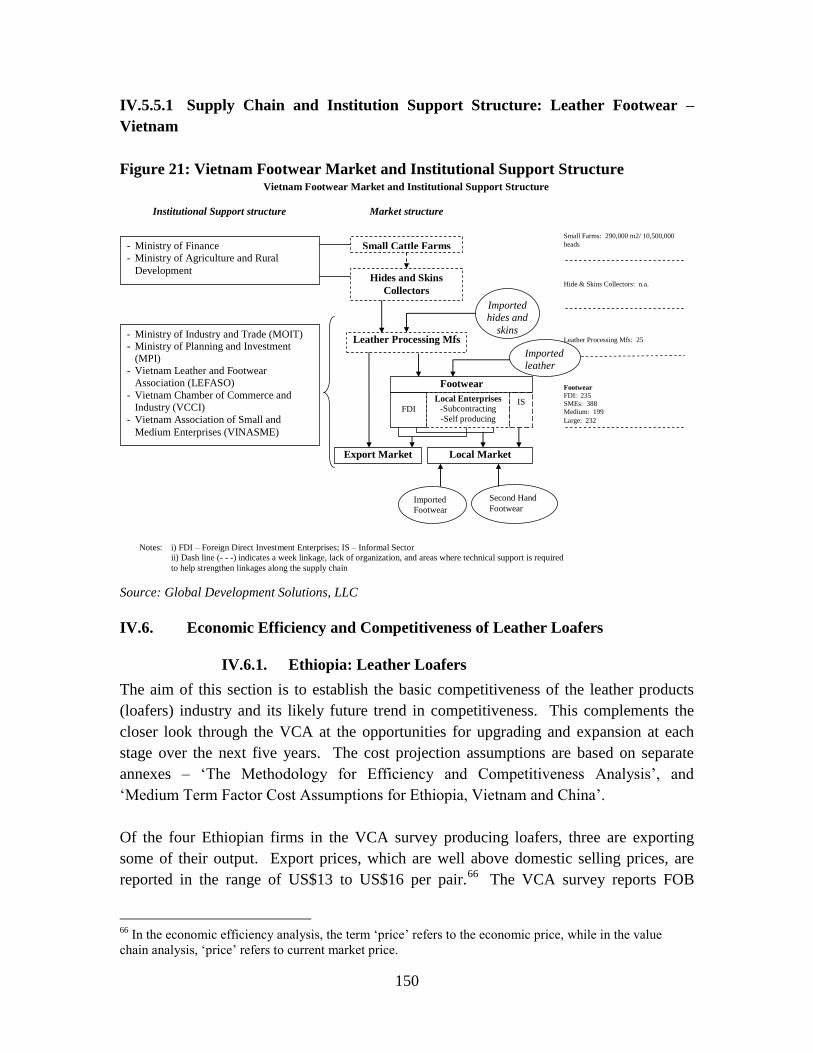
IV.5.5.1 Supply Chain and Institution Support Structure: Leather Footwear –
Vietnam
Figure 21: Vietnam Footwear Market and Institutional Support Structure Vietnam Footwear Market and Institutional Support Structure
Market structure Institutional Support structure
Small Cattle Farms - Ministry of Finance
- Ministry of Agriculture and Rural
Development Hides and Skins
Collectors
Leather Processing Mfs
Imported
hides and
skins
Footwear
FDI
Export Market Local Market
- Ministry of Industry and Trade (MOIT) - Ministry of Planning and Investment
(MPI)
- Vietnam Leather and Footwear
Association (LEFASO)
- Vietnam Chamber of Commerce and
Industry (VCCI)
- Vietnam Association of Small and
Medium Enterprises (VINASME)
Notes: i) FDI – Foreign Direct Investment Enterprises; IS – Informal Sector
ii) Dash line (- - -) indicates a week linkage, lack of organization, and areas where technical support is required
to help strengthen linkages along the supply chain
Second Hand
Footwear Imported
Footwear
Imported
leather
Local Enterprises
-Subcontracting
-Self producing
Small Farms: 290,000 m2/ 10,500,000
heads
Hide & Skins Collectors: n.a.
Leather Processing Mfs: 25
Footwear
FDI: 235
SMEs: 388
Medium: 199
Large: 232
IS
Source: Global Development Solutions, LLC
IV.6. Economic Efficiency and Competitiveness of Leather Loafers
IV.6.1. Ethiopia: Leather Loafers
The aim of this section is to establish the basic competitiveness of the leather products
(loafers) industry and its likely future trend in competitiveness. This complements the
closer look through the VCA at the opportunities for upgrading and expansion at each
stage over the next five years. The cost projection assumptions are based on separate
annexes – ‗The Methodology for Efficiency and Competitiveness Analysis‘, and
‗Medium Term Factor Cost Assumptions for Ethiopia, Vietnam and China‘.
Of the four Ethiopian firms in the VCA survey producing loafers, three are exporting
some of their output. Export prices, which are well above domestic selling prices, are
reported in the range of US$13 to US$16 per pair.66
The VCA survey reports FOB
66
In the economic efficiency analysis, the term ‗price‘ refers to the economic price, while in the value
chain analysis, ‗price‘ refers to current market price.
151
export prices for firms in China in the range US$9.60 to US$20 per pair. Ethiopian
prices are within this range but there are some quality differences with Chinese goods
because imports into Ethiopia tend to be high end fashion loafers that are not directly
comparable with Ethiopian goods.
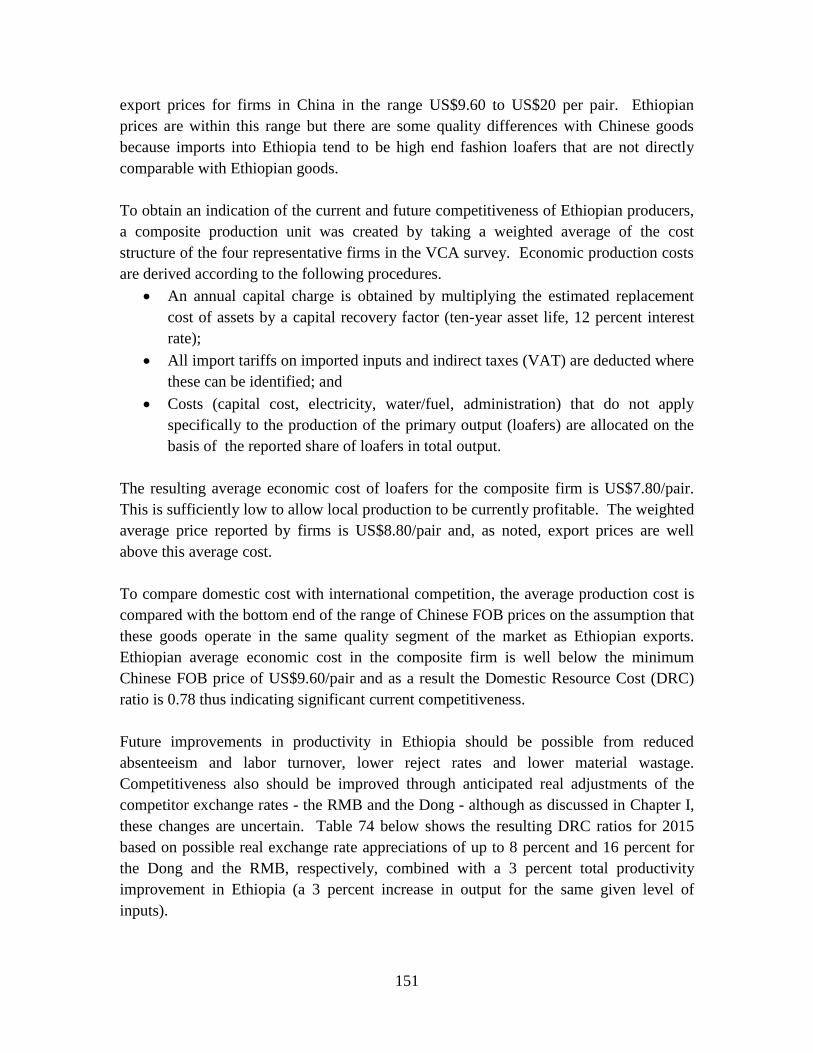
To obtain an indication of the current and future competitiveness of Ethiopian producers,
a composite production unit was created by taking a weighted average of the cost
structure of the four representative firms in the VCA survey. Economic production costs
are derived according to the following procedures.
An annual capital charge is obtained by multiplying the estimated replacement
cost of assets by a capital recovery factor (ten-year asset life, 12 percent interest
rate);
All import tariffs on imported inputs and indirect taxes (VAT) are deducted where
these can be identified; and
Costs (capital cost, electricity, water/fuel, administration) that do not apply
specifically to the production of the primary output (loafers) are allocated on the
basis of the reported share of loafers in total output.
The resulting average economic cost of loafers for the composite firm is US$7.80/pair.
This is sufficiently low to allow local production to be currently profitable. The weighted
average price reported by firms is US$8.80/pair and, as noted, export prices are well
above this average cost.
To compare domestic cost with international competition, the average production cost is
compared with the bottom end of the range of Chinese FOB prices on the assumption that
these goods operate in the same quality segment of the market as Ethiopian exports.
Ethiopian average economic cost in the composite firm is well below the minimum
Chinese FOB price of US$9.60/pair and as a result the Domestic Resource Cost (DRC)
ratio is 0.78 thus indicating significant current competitiveness.
Future improvements in productivity in Ethiopia should be possible from reduced
absenteeism and labor turnover, lower reject rates and lower material wastage.
Competitiveness also should be improved through anticipated real adjustments of the
competitor exchange rates - the RMB and the Dong - although as discussed in Chapter I,
these changes are uncertain. Table 74 below shows the resulting DRC ratios for 2015
based on possible real exchange rate appreciations of up to 8 percent and 16 percent for
the Dong and the RMB, respectively, combined with a 3 percent total productivity
improvement in Ethiopia (a 3 percent increase in output for the same given level of
inputs).
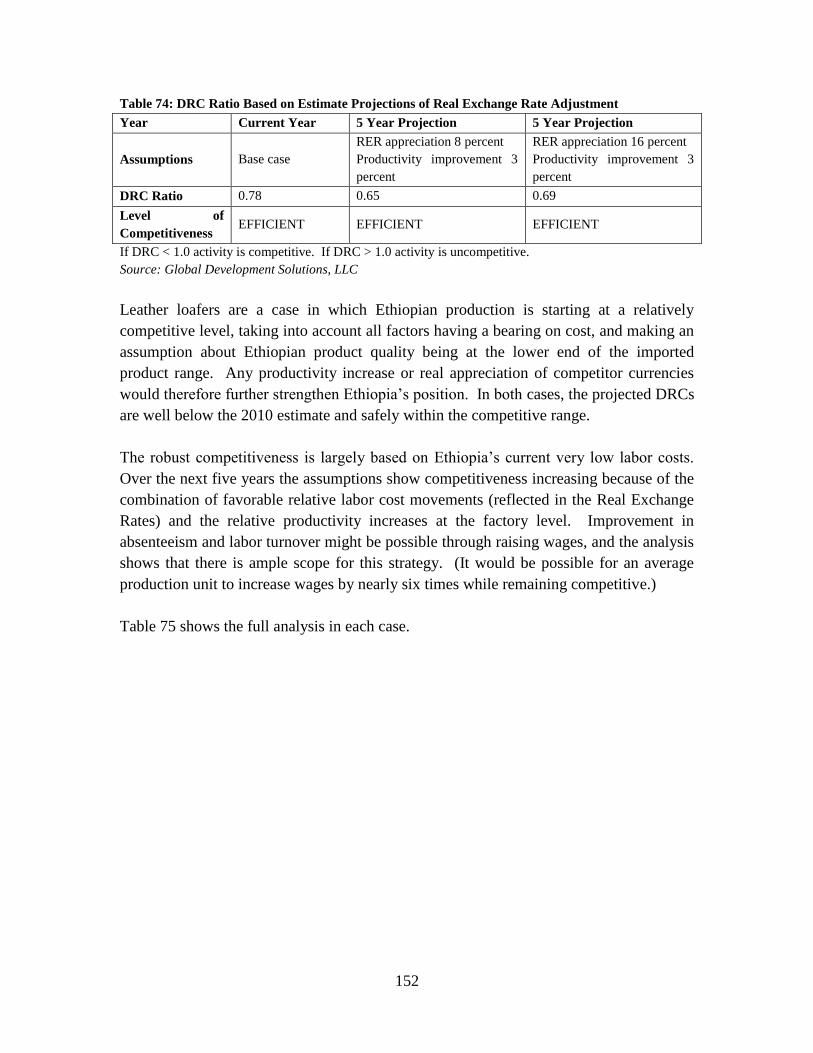
152
Table 74: DRC Ratio Based on Estimate Projections of Real Exchange Rate Adjustment
Year Current Year 5 Year Projection 5 Year Projection
Assumptions Base case
RER appreciation 8 percent
Productivity improvement 3
percent
RER appreciation 16 percent
Productivity improvement 3
percent
DRC Ratio 0.78 0.65 0.69
Level of
Competitiveness EFFICIENT EFFICIENT EFFICIENT
If DRC < 1.0 activity is competitive. If DRC > 1.0 activity is uncompetitive.
Source: Global Development Solutions, LLC
Leather loafers are a case in which Ethiopian production is starting at a relatively
competitive level, taking into account all factors having a bearing on cost, and making an
assumption about Ethiopian product quality being at the lower end of the imported
product range. Any productivity increase or real appreciation of competitor currencies
would therefore further strengthen Ethiopia‘s position. In both cases, the projected DRCs
are well below the 2010 estimate and safely within the competitive range.
The robust competitiveness is largely based on Ethiopia‘s current very low labor costs.
Over the next five years the assumptions show competitiveness increasing because of the
combination of favorable relative labor cost movements (reflected in the Real Exchange
Rates) and the relative productivity increases at the factory level. Improvement in
absenteeism and labor turnover might be possible through raising wages, and the analysis
shows that there is ample scope for this strategy. (It would be possible for an average
production unit to increase wages by nearly six times while remaining competitive.)
Table 75 shows the full analysis in each case.
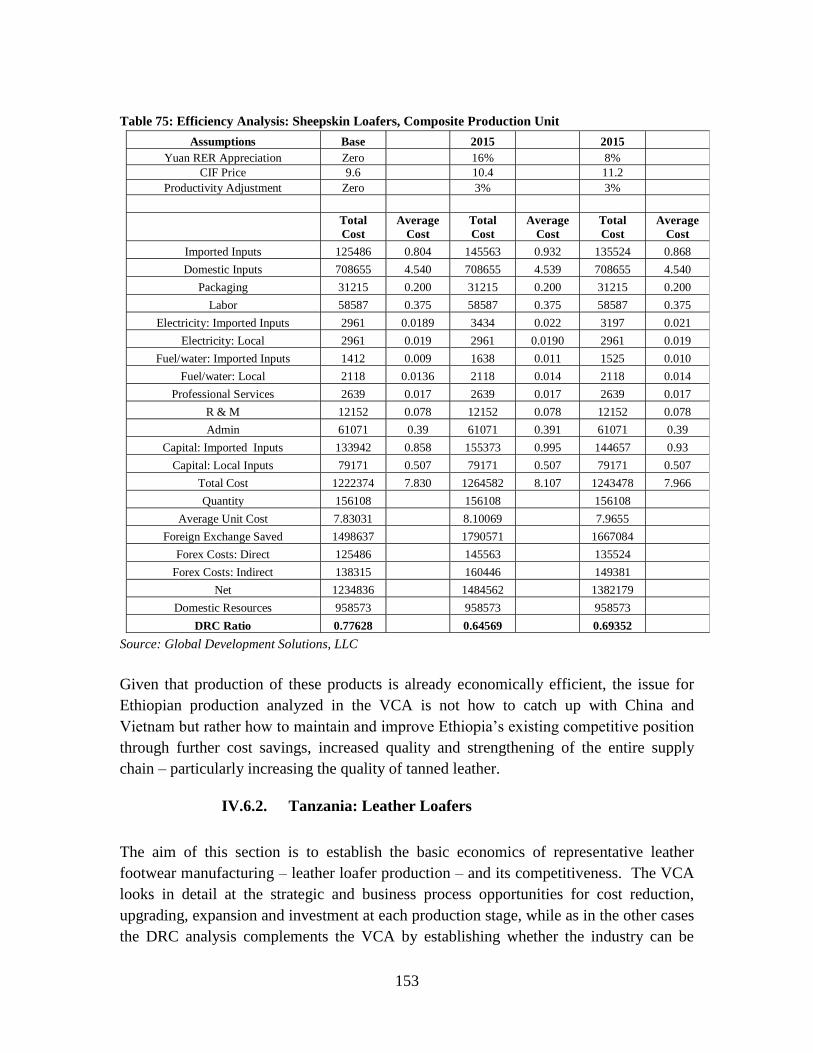
153
Table 75: Efficiency Analysis: Sheepskin Loafers, Composite Production Unit
Assumptions Base 2015 2015
Yuan RER Appreciation Zero 16% 8%
CIF Price 9.6 10.4 11.2
Productivity Adjustment Zero 3% 3%
Total
Cost
Average
Cost
Total
Cost
Average
Cost
Total
Cost
Average
Cost
Imported Inputs 125486 0.804 145563 0.932 135524 0.868
Domestic Inputs 708655 4.540 708655 4.539 708655 4.540
Packaging 31215 0.200 31215 0.200 31215 0.200
Labor 58587 0.375 58587 0.375 58587 0.375
Electricity: Imported Inputs 2961 0.0189 3434 0.022 3197 0.021
Electricity: Local 2961 0.019 2961 0.0190 2961 0.019
Fuel/water: Imported Inputs 1412 0.009 1638 0.011 1525 0.010
Fuel/water: Local 2118 0.0136 2118 0.014 2118 0.014
Professional Services 2639 0.017 2639 0.017 2639 0.017
R & M 12152 0.078 12152 0.078 12152 0.078
Admin 61071 0.39 61071 0.391 61071 0.39
Capital: Imported Inputs 133942 0.858 155373 0.995 144657 0.93
Capital: Local Inputs 79171 0.507 79171 0.507 79171 0.507
Total Cost 1222374 7.830 1264582 8.107 1243478 7.966
Quantity 156108 156108 156108
Average Unit Cost 7.83031 8.10069 7.9655
Foreign Exchange Saved 1498637 1790571 1667084
Forex Costs: Direct 125486 145563 135524
Forex Costs: Indirect 138315 160446 149381
Net 1234836 1484562 1382179
Domestic Resources 958573 958573 958573
DRC Ratio 0.77628 0.64569 0.69352
Source: Global Development Solutions, LLC
Given that production of these products is already economically efficient, the issue for
Ethiopian production analyzed in the VCA is not how to catch up with China and
Vietnam but rather how to maintain and improve Ethiopia‘s existing competitive position
through further cost savings, increased quality and strengthening of the entire supply
chain – particularly increasing the quality of tanned leather.
IV.6.2. Tanzania: Leather Loafers
The aim of this section is to establish the basic economics of representative leather
footwear manufacturing – leather loafer production – and its competitiveness. The VCA
looks in detail at the strategic and business process opportunities for cost reduction,
upgrading, expansion and investment at each production stage, while as in the other cases
the DRC analysis complements the VCA by establishing whether the industry can be
154
competitive, the ground that it has to cover to become competitive or, alternatively, how
well it can maintain competitiveness.
The DRC cost adjustment methodology is based on a separate methodological annex –
‗The Methodology for Efficiency and Competitiveness Analysis.‘
The current trade balance in Tanzania is in deficit for footwear and thus leather loafers
would qualify as importable. Information on sheepskins loafers in Tanzania is subject to
uncertainty because it is based on data provided for loafers produced in the recent past
but which has been suspended, with capacity transferred into production of boots.
Estimated economic production cost at US$9.4/pair is above the weighted average
calculated for Ethiopian firms of US$7.8/pair but well below domestic selling prices of
around US$18.0/pair wholesale, suggesting that the activity is potentially profitable.
Import prices to Tanzania are based on VCA survey findings from Chinese firms whose
landed export prices are in a wide range of US$9.6 to US$20/pair, varying with quality.
As in the analysis for Ethiopia, the bottom of this range of US$9.6 was used as the import
competitor reference price on the grounds that Tanzanian producers would be operating
at the lower quality end of the range.
Average unit economic cost is calculated by adjusting the firm-level financial data from
the VCA survey to economic values as follows:
Import tariffs are removed from the value of imported inputs;
VAT is removed is removed from the value of domestic items;
An annual capital charge is estimated based on the application of a capital
recovery factor for 12 percent over 10 years to the replacement value of assets;
To allow for indirect foreign exchange content, it is assumed that 80 percent of
fuel and electricity cost is for foreign exchange;67
Import duties will vary with origin; it is assumed that all imported inputs qualify
for the 5 percent preferential duty but that they are subject to VAT at the standard
rate of 18 percent; and
As the cost of buildings is not included in estimated capital costs, the reported
rent figure is included in operating cost.
Of the unit economic cost of US$9.4/pair, US$3.4 is for locally purchased leather,
indicating the resource-intensity of the activity (Table 76). Tanzanian economic unit
costs are slightly below the price of US$9.6 from China with a DRC of 0.96 when
imports of loafers are valued at this price (Table 77). This suggests that at the low quality
67
This is only an assumption, but given the relatively small share of fuel in total cost, the results are not
sensitive to this assumption.
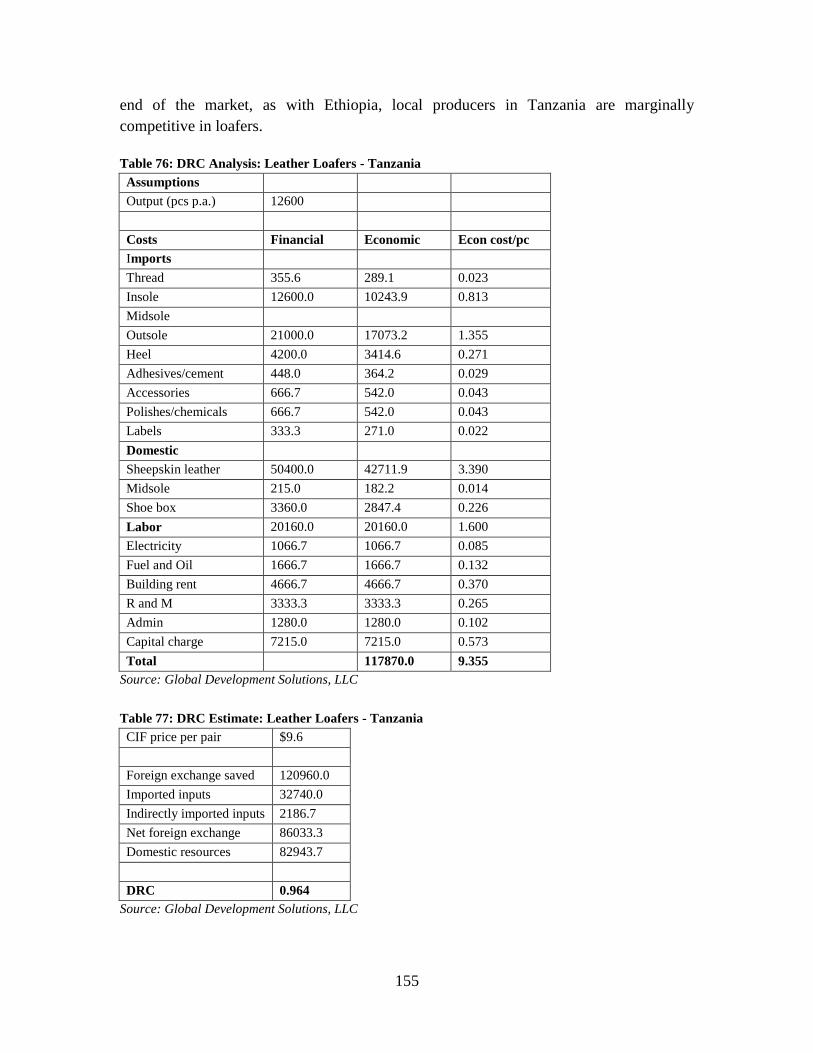
155
end of the market, as with Ethiopia, local producers in Tanzania are marginally
competitive in loafers.
Table 76: DRC Analysis: Leather Loafers - Tanzania
Assumptions
Output (pcs p.a.) 12600
Costs Financial Economic Econ cost/pc
Imports
Thread 355.6 289.1 0.023
Insole 12600.0 10243.9 0.813
Midsole
Outsole 21000.0 17073.2 1.355
Heel 4200.0 3414.6 0.271
Adhesives/cement 448.0 364.2 0.029
Accessories 666.7 542.0 0.043
Polishes/chemicals 666.7 542.0 0.043
Labels 333.3 271.0 0.022
Domestic
Sheepskin leather 50400.0 42711.9 3.390
Midsole 215.0 182.2 0.014
Shoe box 3360.0 2847.4 0.226
Labor 20160.0 20160.0 1.600
Electricity 1066.7 1066.7 0.085
Fuel and Oil 1666.7 1666.7 0.132
Building rent 4666.7 4666.7 0.370
R and M 3333.3 3333.3 0.265
Admin 1280.0 1280.0 0.102
Capital charge 7215.0 7215.0 0.573
Total 117870.0 9.355
Source: Global Development Solutions, LLC
Table 77: DRC Estimate: Leather Loafers - Tanzania
CIF price per pair $9.6
Foreign exchange saved 120960.0
Imported inputs 32740.0
Indirectly imported inputs 2186.7
Net foreign exchange 86033.3
Domestic resources 82943.7
DRC 0.964
Source: Global Development Solutions, LLC
156
Medium-Term Outlook – 2015
The DRC of below unity implies that currently loafer production is just competitive with
China. This suggests that with the necessary investment in equipment and design,
footwear production based on local leather has the potential to be internationally
competitive. Nevertheless, the result, which comes with a degree of uncertainty, shows
only marginal efficiency. Domestic leather is around 35 percent of total cost, so
maintaining an adequate supply of good quality leather at a competitive price will be an
important part of retaining competitiveness.
Tanzania footwear production also suffers from relative low capacity utilization and a
high rate of absenteeism compared to the competition even though it is shown as
competitive. There is thus scope for further improvement in productivity and cost
reduction through progress in these areas. Any future realignment of TZS to RMB real
exchange rates that sees a real appreciation of the RMB would strengthen this position
further, but this is not currently a necessary factor in Tanzania‘s competitiveness in this
product.
IV.7. Value Chain Analysis: Leather Loafers68
The cost of producing export quality men‘s leather loafers made of sheepskin in Ethiopia
is on average about US$7.28/pair, while the same pair of loafers costs about US$10.01 to
produce in Tanzania. In China, a pair of loafers costs about US$16.17/pair to produce.69
In Vietnam, as is the case in the apparel sector, a large majority of shoe production is on
an assembly only basis (US$1.75/pair) where the input materials (usually with the
exception of packing/packaging material) are provided by the buyer (refer to the value
chain diagrams in Figure 22 - Figure 25 below).
Key Characteristics: The cost of raw material (sheepskin) generally constitutes the
largest portion of shoe production (Table 78).
68
Value chain diagrams in this section reflect actual data from export oriented best practice firms. 69
While the technical specification of the products from Ethiopia, China and Vietnam are the same, quality
differences were noted, particularly with regard to the quality of the finish and stitching. Further, although
specifications were given, loafer style also varied greatly between the examples examined.
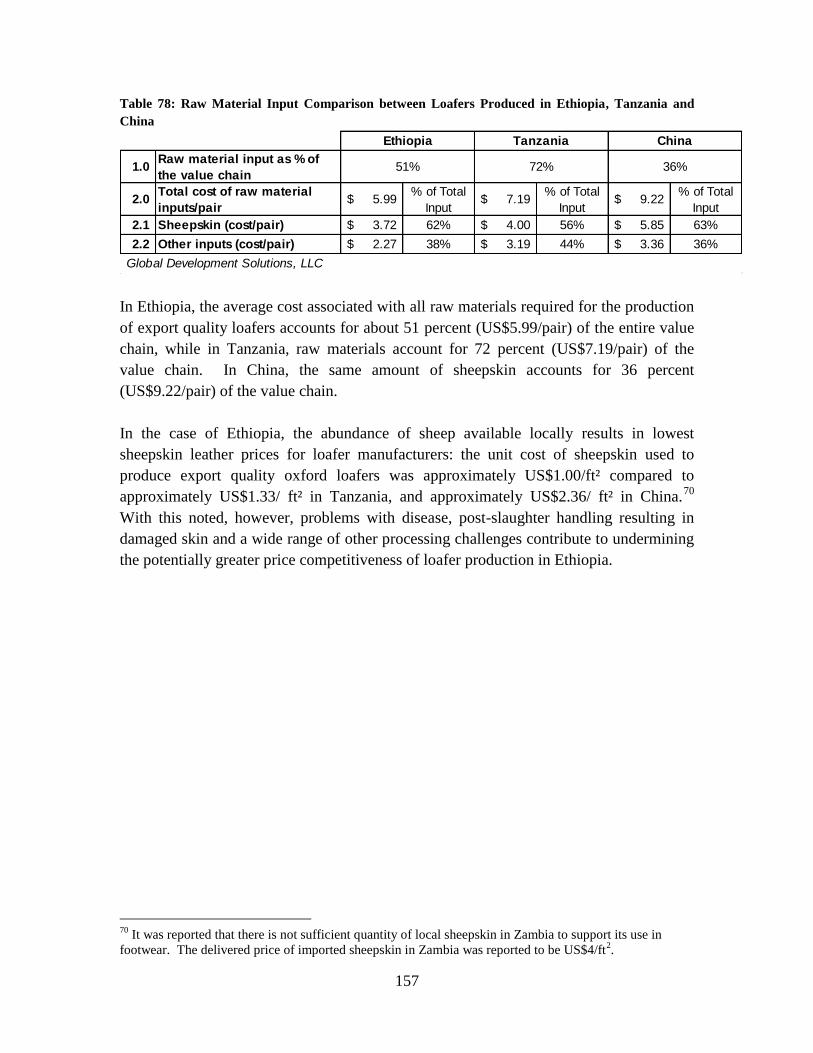
157
Table 78: Raw Material Input Comparison between Loafers Produced in Ethiopia, Tanzania and
China
1.0 Raw material input as % of
the value chain
2.0 Total cost of raw material
inputs/pair5.99$
% of Total
Input7.19$
% of Total
Input9.22$
% of Total
Input
2.1 Sheepskin (cost/pair) 3.72$ 62% 4.00$ 56% 5.85$ 63%
2.2 Other inputs (cost/pair) 2.27$ 38% 3.19$ 44% 3.36$ 36%
Global Development Solutions, LLC
Ethiopia Tanzania China
51% 72% 36%
In Ethiopia, the average cost associated with all raw materials required for the production
of export quality loafers accounts for about 51 percent (US$5.99/pair) of the entire value
chain, while in Tanzania, raw materials account for 72 percent (US$7.19/pair) of the
value chain. In China, the same amount of sheepskin accounts for 36 percent
(US$9.22/pair) of the value chain.
In the case of Ethiopia, the abundance of sheep available locally results in lowest
sheepskin leather prices for loafer manufacturers: the unit cost of sheepskin used to
produce export quality oxford loafers was approximately US$1.00/ft² compared to
approximately US$1.33/ ft² in Tanzania, and approximately US$2.36/ ft² in China.70
With this noted, however, problems with disease, post-slaughter handling resulting in
damaged skin and a wide range of other processing challenges contribute to undermining
the potentially greater price competitiveness of loafer production in Ethiopia.
70
It was reported that there is not sufficient quantity of local sheepskin in Zambia to support its use in
footwear. The delivered price of imported sheepskin in Zambia was reported to be US$4/ft2.
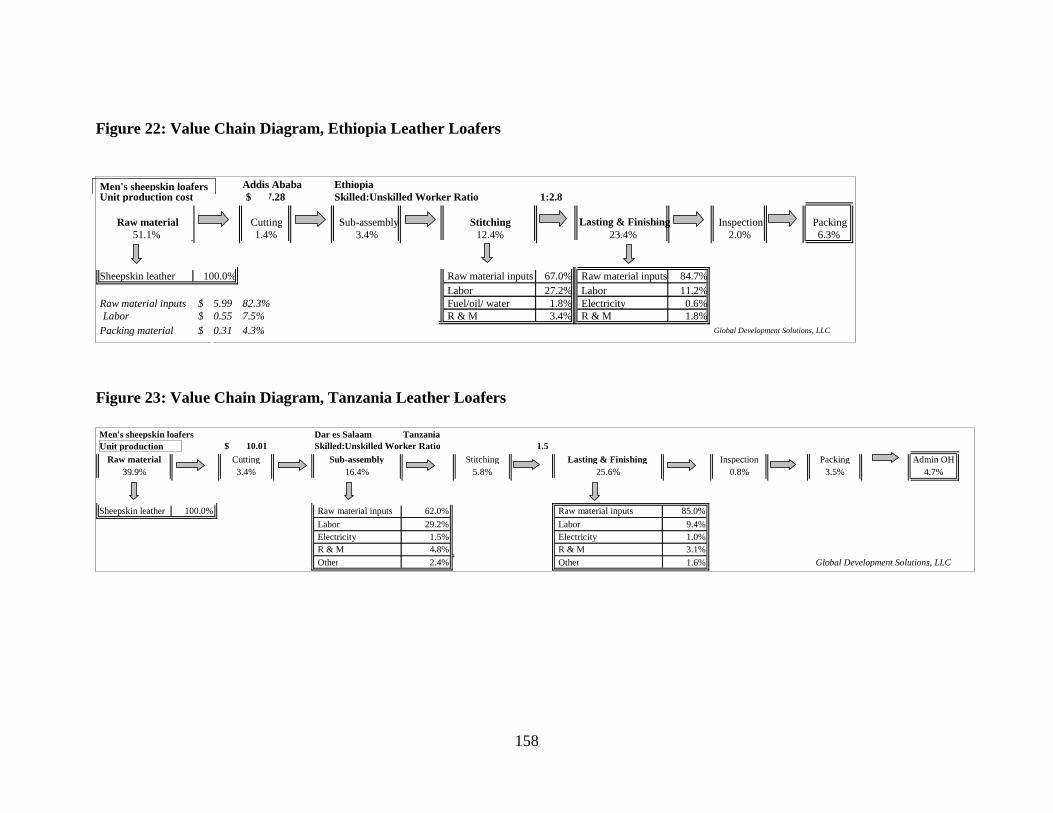
158
Figure 22: Value Chain Diagram, Ethiopia Leather Loafers
Figure 23: Value Chain Diagram, Tanzania Leather Loafers
Men's sheepskin loafers Dar es Salaam Tanzania Unit production
cost 10.01 $ Skilled:Unskilled Worker Ratio 1.5
Raw material Cutting Sub-assembly Stitching Lasting & Finishing Inspection Packing Admin OH 39.9% 3.4% 16.4% 5.8% 25.6% 0.8% 3.5% 4.7%
Sheepskin leather 100.0% Raw material inputs 62.0% Raw material inputs 85.0% Labor 29.2% Labor 9.4% Electricity 1.5% Electricity 1.0% R & M 4.8% R & M 3.1% Other 2.4% Other 1.6% Global Development Solutions, LLC
Men's sheepskin loafers Addis Ababa Ethiopia Unit production cost 7.28 $ Skilled:Unskilled Worker Ratio 1:2.8
Raw material Cutting Sub-assembly Stitching Lasting & Finishing Inspection Packing 51.1% 1.4% 3.4% 12.4% 23.4% 2.0% 6.3%
Sheepskin leather 100.0% Raw material inputs 67.0% Raw material inputs 84.7% Labor 27.2% Labor 11.2%
Raw material inputs 5.99 $ 82.3% Fuel/oil/ water 1.8% Electricity 0.6% Labor 0.55 $ 7.5% R & M 3.4% R & M 1.8%
Packing material 0.31 $ 4.3% Global Development Solutions, LLC
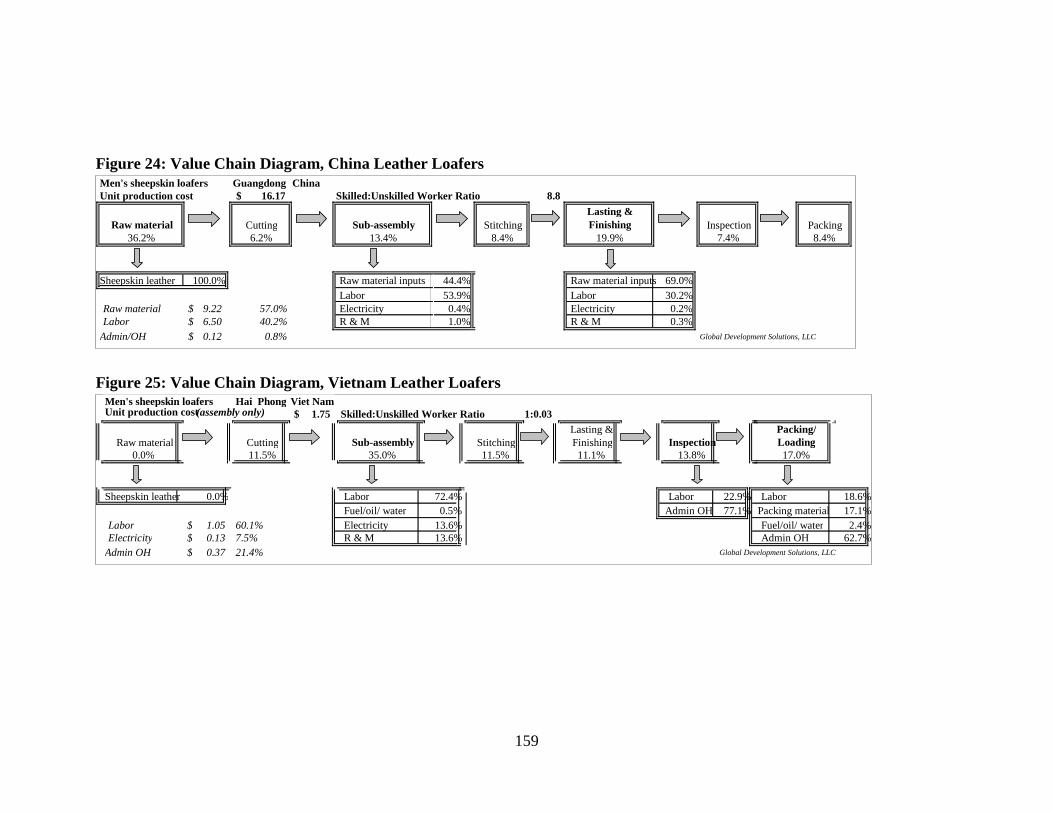
159
Figure 24: Value Chain Diagram, China Leather Loafers
Figure 25: Value Chain Diagram, Vietnam Leather Loafers
Men's sheepskin loafers Hai Phong Viet Nam Unit production cost (assembly only) 1.75 $ Skilled:Unskilled Worker Ratio 1:0.03
Raw material Cutting Sub-assembly Stitching Lasting & Finishing Inspection
Packing/ Loading
0.0% 11.5% 35.0% 11.5% 11.1% 13.8% 17.0%
Sheepskin leather 0.0% Labor 72.4% Labor 22.9% Labor 18.6% Fuel/oil/ water 0.5% Admin OH 77.1% Packing material 17.1%
Labor 1.05 $ 60.1% Electricity 13.6% Fuel/oil/ water 2.4% Electricity 0.13 $ 7.5% R & M 13.6% Admin OH 62.7%
Admin OH 0.37 $ 21.4% Global Development Solutions, LLC
Men's sheepskin loafers Guangdong China Unit production cost 16.17 $ Skilled:Unskilled Worker Ratio 8.8
Raw material Cutting Sub-assembly Stitching Lasting & Finishing Inspection Packing
36.2% 6.2% 13.4% 8.4% 19.9% 7.4% 8.4%
Sheepskin leather 100.0% Raw material inputs 44.4% Raw material inputs 69.0% Labor 53.9% Labor 30.2%
Raw material 9.22 $ 57.0% Electricity 0.4% Electricity 0.2% Labor 6.50 $ 40.2% R & M 1.0% R & M 0.3%
Admin/OH 0.12 $ 0.8% Global Development Solutions, LLC
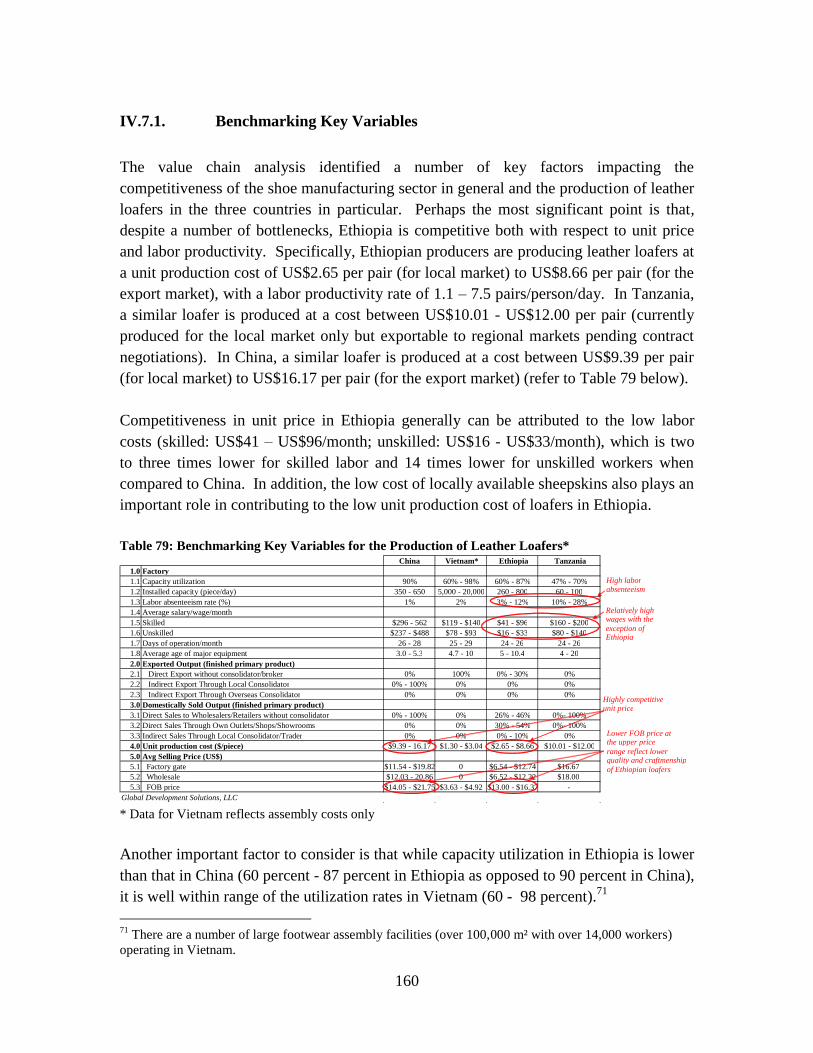
160
IV.7.1. Benchmarking Key Variables
The value chain analysis identified a number of key factors impacting the
competitiveness of the shoe manufacturing sector in general and the production of leather
loafers in the three countries in particular. Perhaps the most significant point is that,
despite a number of bottlenecks, Ethiopia is competitive both with respect to unit price
and labor productivity. Specifically, Ethiopian producers are producing leather loafers at
a unit production cost of US$2.65 per pair (for local market) to US$8.66 per pair (for the
export market), with a labor productivity rate of 1.1 – 7.5 pairs/person/day. In Tanzania,
a similar loafer is produced at a cost between US$10.01 - US$12.00 per pair (currently
produced for the local market only but exportable to regional markets pending contract
negotiations). In China, a similar loafer is produced at a cost between US$9.39 per pair
(for local market) to US$16.17 per pair (for the export market) (refer to Table 79 below).
Competitiveness in unit price in Ethiopia generally can be attributed to the low labor
costs (skilled: US$41 – US$96/month; unskilled: US$16 - US$33/month), which is two
to three times lower for skilled labor and 14 times lower for unskilled workers when
compared to China. In addition, the low cost of locally available sheepskins also plays an
important role in contributing to the low unit production cost of loafers in Ethiopia.
Table 79: Benchmarking Key Variables for the Production of Leather Loafers*
* Data for Vietnam reflects assembly costs only
Another important factor to consider is that while capacity utilization in Ethiopia is lower
than that in China (60 percent - 87 percent in Ethiopia as opposed to 90 percent in China),
it is well within range of the utilization rates in Vietnam (60 - 98 percent).71
71
There are a number of large footwear assembly facilities (over 100,000 m² with over 14,000 workers)
operating in Vietnam.
China Vietnam* Ethiopia Tanzania 1.0 Factory 1.1 Capacity utilization 90% 60% - 98% 60% - 87% 47% - 70% 1.2 Installed capacity (piece/day) 350 - 650 5,000 - 20,000 260 - 800 60 - 100 1.3 Labor absenteeism rate (%) 1% 2% 3% - 12% 10% - 28% 1.4 Average salary/wage/month 1.5 Skilled $296 - 562 $119 - $140 $41 - $96 $160 - $200 1.6 Unskilled $237 - $488 $78 - $93 $16 - $33 $80 - $140 1.7 Days of operation/month 26 - 28 25 - 29 24 - 26 24 - 26 1.8 Average age of major equipment 3.0 - 5.3 4.7 - 10 5 - 10.4 4 - 20 2.0 Exported Output (finished primary product) 2.1 Direct Export without consolidator/broker 0% 100% 0% - 30% 0% 2.2 Indirect Export Through Local Consolidator 0% - 100% 0% 0% 0% 2.3 Indirect Export Through Overseas Consolidator 0% 0% 0% 0% 3.0 Domestically Sold Output (finished primary product) 3.1 Direct Sales to Wholesalers/Retailers without consolidator 0% - 100% 0% 26% - 46% 0%- 100% 3.2 Direct Sales Through Own Outlets/Shops/Showrooms 0% 0% 30% - 54% 0%- 100% 3.3 Indirect Sales Through Local Consolidator/Trader 0% 0% 0% - 10% 0% 4.0 Unit production cost ($/piece) $9.39 - 16.17 $1.30 - $3.04 $2.65 - $8.66 $10.01 - $12.00 5.0 Avg Selling Price (US$) 5.1 Factory gate $11.54 - $19.82 0 $6.54 - $12.74 $16.67 5.2 Wholesale $12.03 - 20.86 0 $6.52 - $12.22 $18.00 5.3 FOB price $14.05 - $21.75 $3.63 - $4.92 $13.00 - $16.37 -
Global Development Solutions, LLC
High labor absenteeism
Relatively high wages with the exception of Ethiopia
Lower FOB price at the upper price range reflect lower quality and craftmenship of Ethiopian loafers
Highly competitive unit price
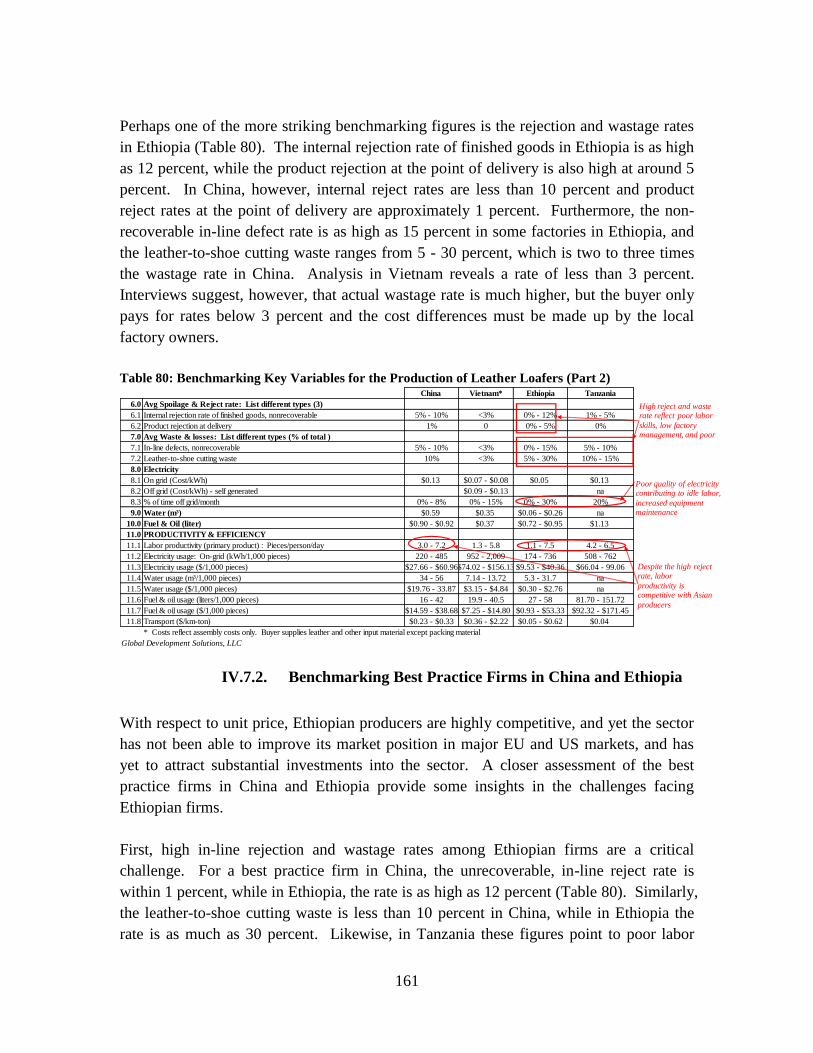
161
Perhaps one of the more striking benchmarking figures is the rejection and wastage rates
in Ethiopia (Table 80). The internal rejection rate of finished goods in Ethiopia is as high
as 12 percent, while the product rejection at the point of delivery is also high at around 5
percent. In China, however, internal reject rates are less than 10 percent and product
reject rates at the point of delivery are approximately 1 percent. Furthermore, the non-
recoverable in-line defect rate is as high as 15 percent in some factories in Ethiopia, and
the leather-to-shoe cutting waste ranges from 5 - 30 percent, which is two to three times
the wastage rate in China. Analysis in Vietnam reveals a rate of less than 3 percent.
Interviews suggest, however, that actual wastage rate is much higher, but the buyer only
pays for rates below 3 percent and the cost differences must be made up by the local
factory owners.
Table 80: Benchmarking Key Variables for the Production of Leather Loafers (Part 2) China Vietnam* Ethiopia Tanzania
6.0 Avg Spoilage & Reject rate: List different types (3)
6.1 Internal rejection rate of finished goods, nonrecoverable 5% - 10% <3% 0% - 12% 1% - 5%
6.2 Product rejection at delivery 1% 0 0% - 5% 0%
7.0 Avg Waste & losses: List different types (% of total )
7.1 In-line defects, nonrecoverable 5% - 10% <3% 0% - 15% 5% - 10%
7.2 Leather-to-shoe cutting waste 10% <3% 5% - 30% 10% - 15%
8.0 Electricity
8.1 On grid (Cost/kWh) $0.13 $0.07 - $0.08 $0.05 $0.13
8.2 Off grid (Cost/kWh) - self generated $0.09 - $0.13 na
8.3 % of time off grid/month 0% - 8% 0% - 15% 0% - 30% 20%
9.0 Water (m³) $0.59 $0.35 $0.06 - $0.26 na
10.0 Fuel & Oil (liter) $0.90 - $0.92 $0.37 $0.72 - $0.95 $1.13
11.0 PRODUCTIVITY & EFFICIENCY
11.1 Labor productivity (primary product) : Pieces/person/day 3.0 - 7.2 1.3 - 5.8 1.1 - 7.5 4.2 - 6.5
11.2 Electricity usage: On-grid (kWh/1,000 pieces) 220 - 485 952 - 2,009 174 - 736 508 - 762
11.3 Electricity usage ($/1,000 pieces) $27.66 - $60.96$74.02 - $156.13 $9.53 - $40.36 $66.04 - 99.06
11.4 Water usage (m³/1,000 pieces) 34 - 56 7.14 - 13.72 5.3 - 31.7 na
11.5 Water usage ($/1,000 pieces) $19.76 - 33.87 $3.15 - $4.84 $0.30 - $2.76 na
11.6 Fuel & oil usage (liters/1,000 pieces) 16 - 42 19.9 - 40.5 27 - 58 81.70 - 151.72
11.7 Fuel & oil usage ($/1,000 pieces) $14.59 - $38.68 $7.25 - $14.80 $0.93 - $53.33 $92.32 - $171.45
11.8 Transport ($/km-ton) $0.23 - $0.33 $0.36 - $2.22 $0.05 - $0.62 $0.04
* Costs reflect assembly costs only. Buyer supplies leather and other input material except packing material
Global Development Solutions, LLC
High reject and waste rate reflect poor labor
skills, low factory management, and poor
Poor quality of electricity contributing to idle labor,
increased equipment maintenance
Despite the high reject rate, labor
productivity is competitive with Asian
producers
IV.7.2. Benchmarking Best Practice Firms in China and Ethiopia
With respect to unit price, Ethiopian producers are highly competitive, and yet the sector
has not been able to improve its market position in major EU and US markets, and has
yet to attract substantial investments into the sector. A closer assessment of the best
practice firms in China and Ethiopia provide some insights in the challenges facing
Ethiopian firms.
First, high in-line rejection and wastage rates among Ethiopian firms are a critical
challenge. For a best practice firm in China, the unrecoverable, in-line reject rate is
within 1 percent, while in Ethiopia, the rate is as high as 12 percent (Table 80). Similarly,
the leather-to-shoe cutting waste is less than 10 percent in China, while in Ethiopia the
rate is as much as 30 percent. Likewise, in Tanzania these figures point to poor labor
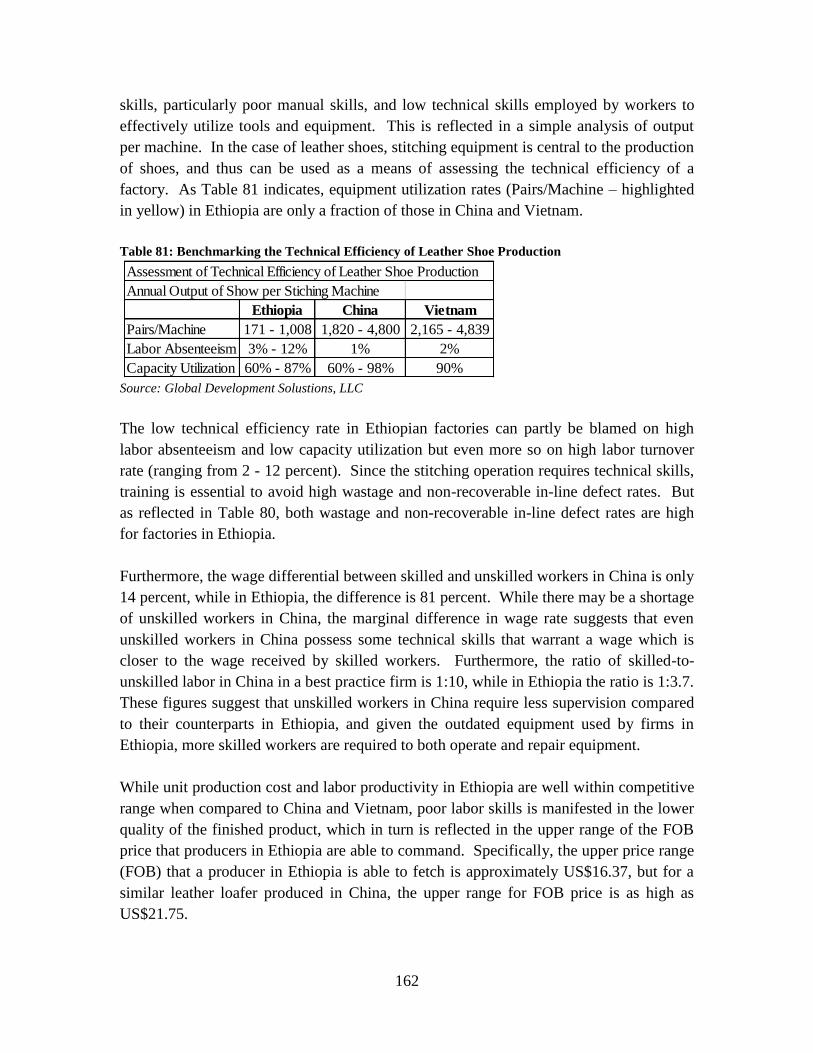
162
skills, particularly poor manual skills, and low technical skills employed by workers to
effectively utilize tools and equipment. This is reflected in a simple analysis of output
per machine. In the case of leather shoes, stitching equipment is central to the production
of shoes, and thus can be used as a means of assessing the technical efficiency of a
factory. As Table 81 indicates, equipment utilization rates (Pairs/Machine – highlighted
in yellow) in Ethiopia are only a fraction of those in China and Vietnam.
Table 81: Benchmarking the Technical Efficiency of Leather Shoe Production
Assessment of Technical Efficiency of Leather Shoe Production
Annual Output of Show per Stiching Machine
Ethiopia China Vietnam
Pairs/Machine 171 - 1,008 1,820 - 4,800 2,165 - 4,839
Labor Absenteeism 3% - 12% 1% 2%
Capacity Utilization 60% - 87% 60% - 98% 90% Source: Global Development Solustions, LLC
The low technical efficiency rate in Ethiopian factories can partly be blamed on high
labor absenteeism and low capacity utilization but even more so on high labor turnover
rate (ranging from 2 - 12 percent). Since the stitching operation requires technical skills,
training is essential to avoid high wastage and non-recoverable in-line defect rates. But
as reflected in Table 80, both wastage and non-recoverable in-line defect rates are high
for factories in Ethiopia.
Furthermore, the wage differential between skilled and unskilled workers in China is only
14 percent, while in Ethiopia, the difference is 81 percent. While there may be a shortage
of unskilled workers in China, the marginal difference in wage rate suggests that even
unskilled workers in China possess some technical skills that warrant a wage which is
closer to the wage received by skilled workers. Furthermore, the ratio of skilled-to-
unskilled labor in China in a best practice firm is 1:10, while in Ethiopia the ratio is 1:3.7.
These figures suggest that unskilled workers in China require less supervision compared
to their counterparts in Ethiopia, and given the outdated equipment used by firms in
Ethiopia, more skilled workers are required to both operate and repair equipment.
While unit production cost and labor productivity in Ethiopia are well within competitive
range when compared to China and Vietnam, poor labor skills is manifested in the lower
quality of the finished product, which in turn is reflected in the upper range of the FOB
price that producers in Ethiopia are able to command. Specifically, the upper price range
(FOB) that a producer in Ethiopia is able to fetch is approximately US$16.37, but for a
similar leather loafer produced in China, the upper range for FOB price is as high as
US$21.75.
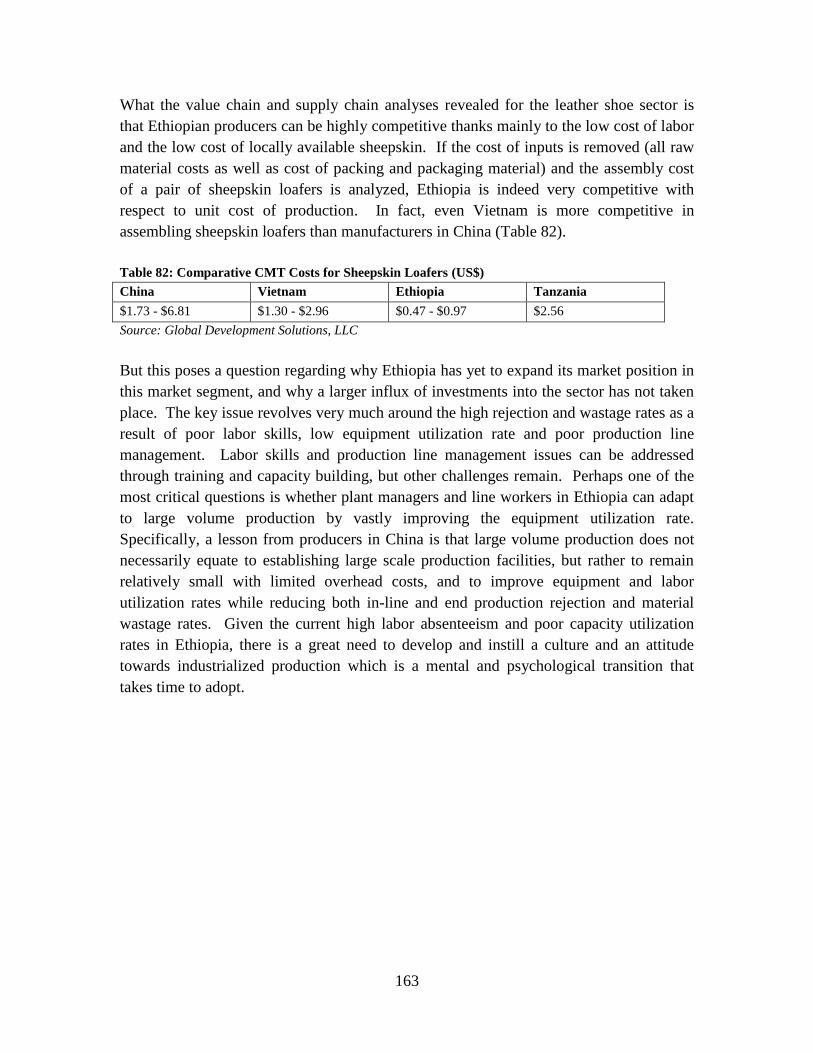
163
What the value chain and supply chain analyses revealed for the leather shoe sector is
that Ethiopian producers can be highly competitive thanks mainly to the low cost of labor
and the low cost of locally available sheepskin. If the cost of inputs is removed (all raw
material costs as well as cost of packing and packaging material) and the assembly cost
of a pair of sheepskin loafers is analyzed, Ethiopia is indeed very competitive with
respect to unit cost of production. In fact, even Vietnam is more competitive in
assembling sheepskin loafers than manufacturers in China (Table 82).
Table 82: Comparative CMT Costs for Sheepskin Loafers (US$)
China Vietnam Ethiopia Tanzania
$1.73 - $6.81 $1.30 - $2.96 $0.47 - $0.97 $2.56
Source: Global Development Solutions, LLC
But this poses a question regarding why Ethiopia has yet to expand its market position in
this market segment, and why a larger influx of investments into the sector has not taken
place. The key issue revolves very much around the high rejection and wastage rates as a
result of poor labor skills, low equipment utilization rate and poor production line
management. Labor skills and production line management issues can be addressed
through training and capacity building, but other challenges remain. Perhaps one of the
most critical questions is whether plant managers and line workers in Ethiopia can adapt
to large volume production by vastly improving the equipment utilization rate.
Specifically, a lesson from producers in China is that large volume production does not
necessarily equate to establishing large scale production facilities, but rather to remain
relatively small with limited overhead costs, and to improve equipment and labor
utilization rates while reducing both in-line and end production rejection and material
wastage rates. Given the current high labor absenteeism and poor capacity utilization
rates in Ethiopia, there is a great need to develop and instill a culture and an attitude
towards industrialized production which is a mental and psychological transition that
takes time to adopt.
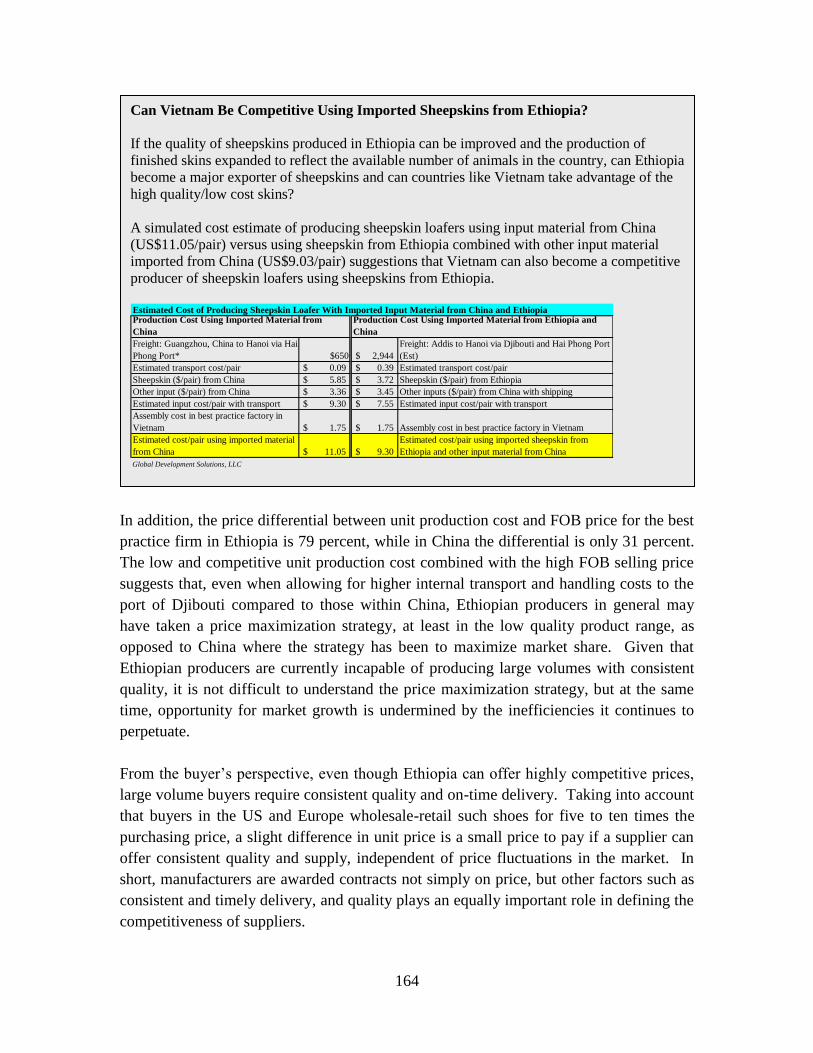
164
In addition, the price differential between unit production cost and FOB price for the best
practice firm in Ethiopia is 79 percent, while in China the differential is only 31 percent.
The low and competitive unit production cost combined with the high FOB selling price
suggests that, even when allowing for higher internal transport and handling costs to the
port of Djibouti compared to those within China, Ethiopian producers in general may
have taken a price maximization strategy, at least in the low quality product range, as
opposed to China where the strategy has been to maximize market share. Given that
Ethiopian producers are currently incapable of producing large volumes with consistent
quality, it is not difficult to understand the price maximization strategy, but at the same
time, opportunity for market growth is undermined by the inefficiencies it continues to
perpetuate.
From the buyer‘s perspective, even though Ethiopia can offer highly competitive prices,
large volume buyers require consistent quality and on-time delivery. Taking into account
that buyers in the US and Europe wholesale-retail such shoes for five to ten times the
purchasing price, a slight difference in unit price is a small price to pay if a supplier can
offer consistent quality and supply, independent of price fluctuations in the market. In
short, manufacturers are awarded contracts not simply on price, but other factors such as
consistent and timely delivery, and quality plays an equally important role in defining the
competitiveness of suppliers.
Can Vietnam Be Competitive Using Imported Sheepskins from Ethiopia?
If the quality of sheepskins produced in Ethiopia can be improved and the production of
finished skins expanded to reflect the available number of animals in the country, can Ethiopia
become a major exporter of sheepskins and can countries like Vietnam take advantage of the
high quality/low cost skins?
A simulated cost estimate of producing sheepskin loafers using input material from China
(US$11.05/pair) versus using sheepskin from Ethiopia combined with other input material
imported from China (US$9.03/pair) suggestions that Vietnam can also become a competitive
producer of sheepskin loafers using sheepskins from Ethiopia.
Estimated Cost of Producing Sheepskin Loafer With Imported Input Material from China and Ethiopia
Freight: Guangzhou, China to Hanoi via Hai
Phong Port* $650 $ 2,944
Freight: Addis to Hanoi via Djibouti and Hai Phong Port
(Est)
Estimated transport cost/pair $ 0.09 $ 0.39 Estimated transport cost/pair
Sheepskin ($/pair) from China $ 5.85 $ 3.72 Sheepskin ($/pair) from Ethiopia
Other input ($/pair) from China $ 3.36 $ 3.45 Other inputs ($/pair) from China with shipping
Estimated input cost/pair with transport $ 9.30 $ 7.55 Estimated input cost/pair with transport
Assembly cost in best practice factory in
Vietnam $ 1.75 $ 1.75 Assembly cost in best practice factory in Vietnam
Estimated cost/pair using imported material
from China $ 11.05 $ 9.30
Estimated cost/pair using imported sheepskin from
Ethiopia and other input material from China
Global Development Solutions, LLC
Production Cost Using Imported Material from
China
Production Cost Using Imported Material from Ethiopia and
China
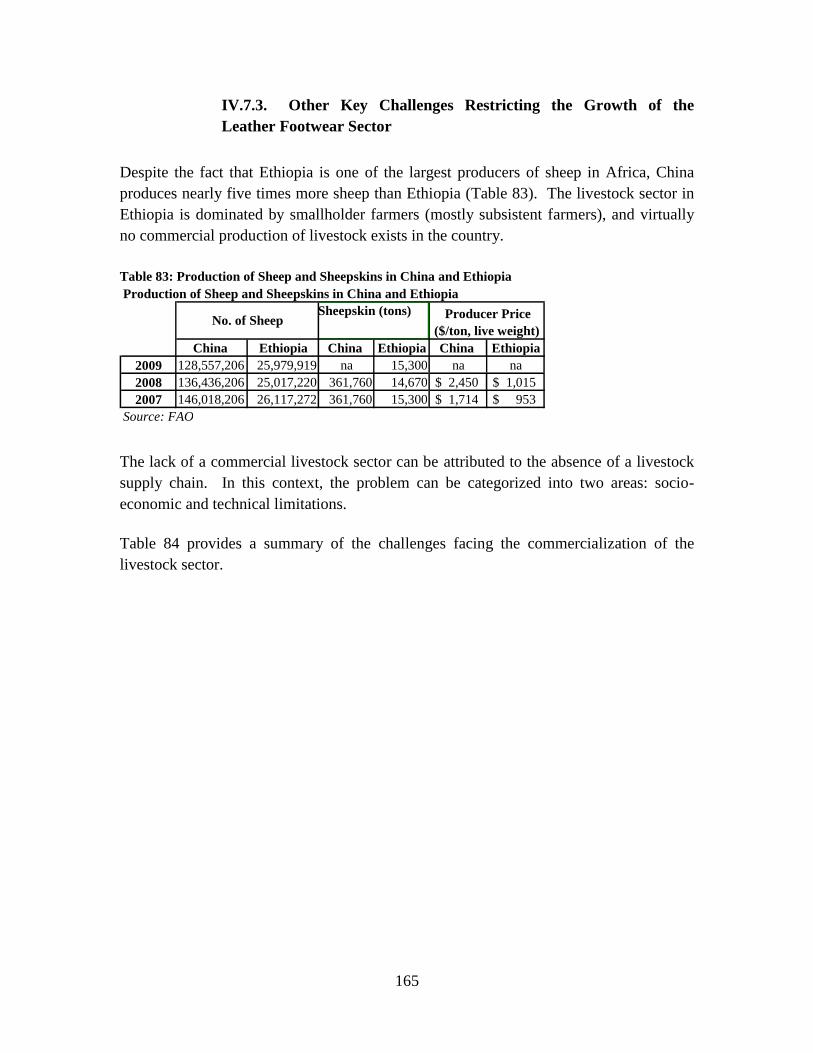
165
IV.7.3. Other Key Challenges Restricting the Growth of the
Leather Footwear Sector
Despite the fact that Ethiopia is one of the largest producers of sheep in Africa, China
produces nearly five times more sheep than Ethiopia (Table 83). The livestock sector in
Ethiopia is dominated by smallholder farmers (mostly subsistent farmers), and virtually
no commercial production of livestock exists in the country.
Table 83: Production of Sheep and Sheepskins in China and Ethiopia
The lack of a commercial livestock sector can be attributed to the absence of a livestock
supply chain. In this context, the problem can be categorized into two areas: socio-
economic and technical limitations.
Table 84 provides a summary of the challenges facing the commercialization of the
livestock sector.
Production of Sheep and Sheepskins in China and Ethiopia
China Ethiopia China Ethiopia China Ethiopia 2009 128,557,206 25,979,919 na 15,300 na na 2008 136,436,206 25,017,220 361,760 14,670 $ 2,450 $ 1,015 2007 146,018,206 26,117,272 361,760 15,300 $ 1,714 $ 953
Source: FAO
No. of Sheep Sheepskin (tons) Producer Price
($/ton, live weight)
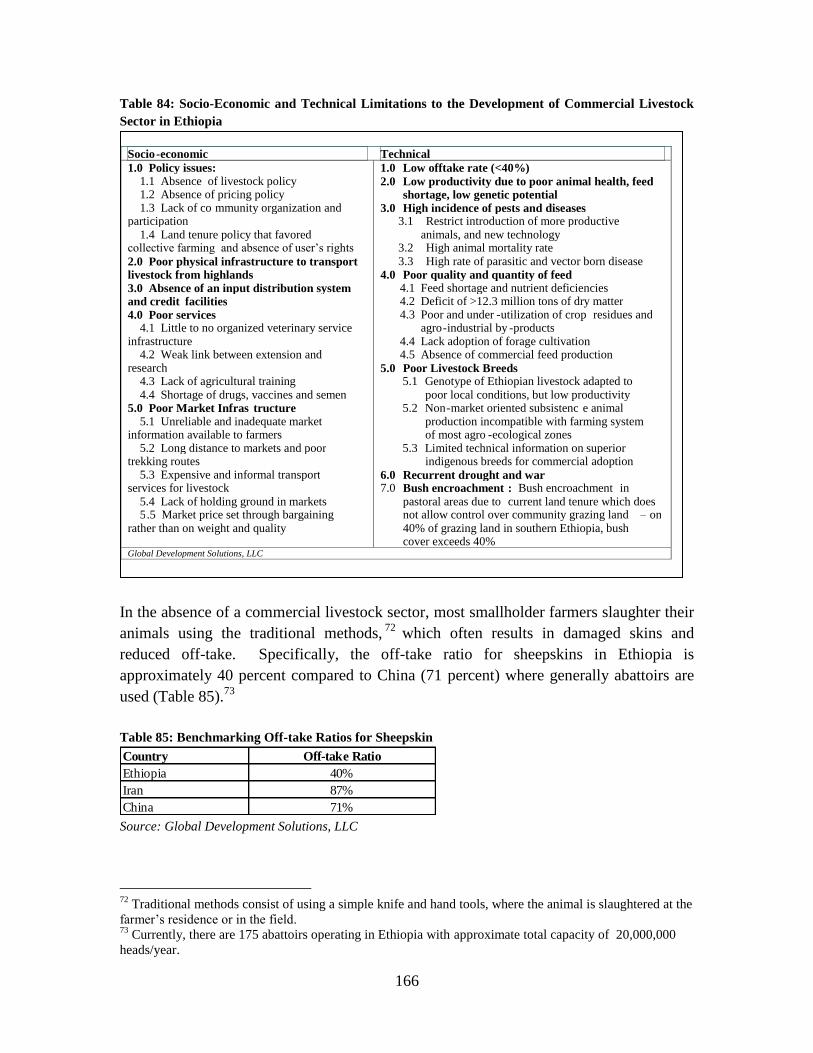
166
Table 84: Socio-Economic and Technical Limitations to the Development of Commercial Livestock
Sector in Ethiopia
In the absence of a commercial livestock sector, most smallholder farmers slaughter their
animals using the traditional methods,72
which often results in damaged skins and
reduced off-take. Specifically, the off-take ratio for sheepskins in Ethiopia is
approximately 40 percent compared to China (71 percent) where generally abattoirs are
used (Table 85).73
Table 85: Benchmarking Off-take Ratios for Sheepskin
Country Off-take Ratio
Ethiopia 40%
Iran 87%
China 71% Source: Global Development Solutions, LLC
72
Traditional methods consist of using a simple knife and hand tools, where the animal is slaughtered at the
farmer‘s residence or in the field. 73
Currently, there are 175 abattoirs operating in Ethiopia with approximate total capacity of 20,000,000
heads/year.
Socio - economic Technical 1.0 Policy issues: 1.1 Absence of livestock policy 1.2 Absence of pricing policy 1.3 Lack of co mmunity organization and participation 1.4 Land tenure policy that favored collective farming and absence of user‘s rights 2.0 Poor physical infrastructure to transport livestock from highlands 3.0 Absence of an input distribution system and credit facilities 4.0 Poor services 4.1 Little to no organized veterinary service infrastructure 4.2 Weak link between extension and research 4.3 Lack of agricultural training 4.4 Shortage of drugs, vaccines and semen 5.0 Poor Market Infras tructure 5.1 Unreliable and inadequate market information available to farmers 5.2 Long distance to markets and poor trekking routes 5.3 Expensive and informal transport services for livestock 5.4 Lack of holding ground in markets 5 .5 Market price set through bargaining rather than on weight and quality
1.0 Low offtake rate (<40%) 2.0 Low productivity due to poor animal health, feed
shortage, low genetic potential 3.0 High incidence of pests and diseases
3.1 Restrict introduction of more productive animals, and new technology
3.2 High animal mortality rate 3.3 High rate of parasitic and vector born disease
4.0 Poor quality and quantity of feed 4.1 Feed shortage and nutrient deficiencies 4.2 Deficit of >12.3 million tons of dry matter 4.3 Poor and under - utilization of crop residues and
agro - industrial by - products 4.4 Lack adoption of forage cultivation 4.5 Absence of commercial feed production
5.0 Poor Livestock Breeds 5.1 Genotype of Ethiopian livestock adapted to
poor local conditions, but low productivity 5.2 Non - market oriented subsistenc e animal
production incompatible with farming system of most agro - ecological zones
5.3 Limited technical information on superior indigenous breeds for commercial adoption
6.0 Recurrent drought and war 7.0 Bush encroachment : Bush encroachment in
pastoral areas due to current land tenure which does not allow control over community grazing land – on 40% of grazing land in southern Ethiopia, bush cover exceeds 40%
Global Development Solutions, LLC

167
In addition to the low off-take ratio, due to poor animal husbandry, over 80 percent of the
sheepskin from the highlands of Ethiopia is affected by ectoparasites, known locally as
ekek. Of the 9.4 million tons reaching the tanneries, nearly 90 percent of the stock must
be downgraded to Grade III quality, mainly due to ekek and poor handling.
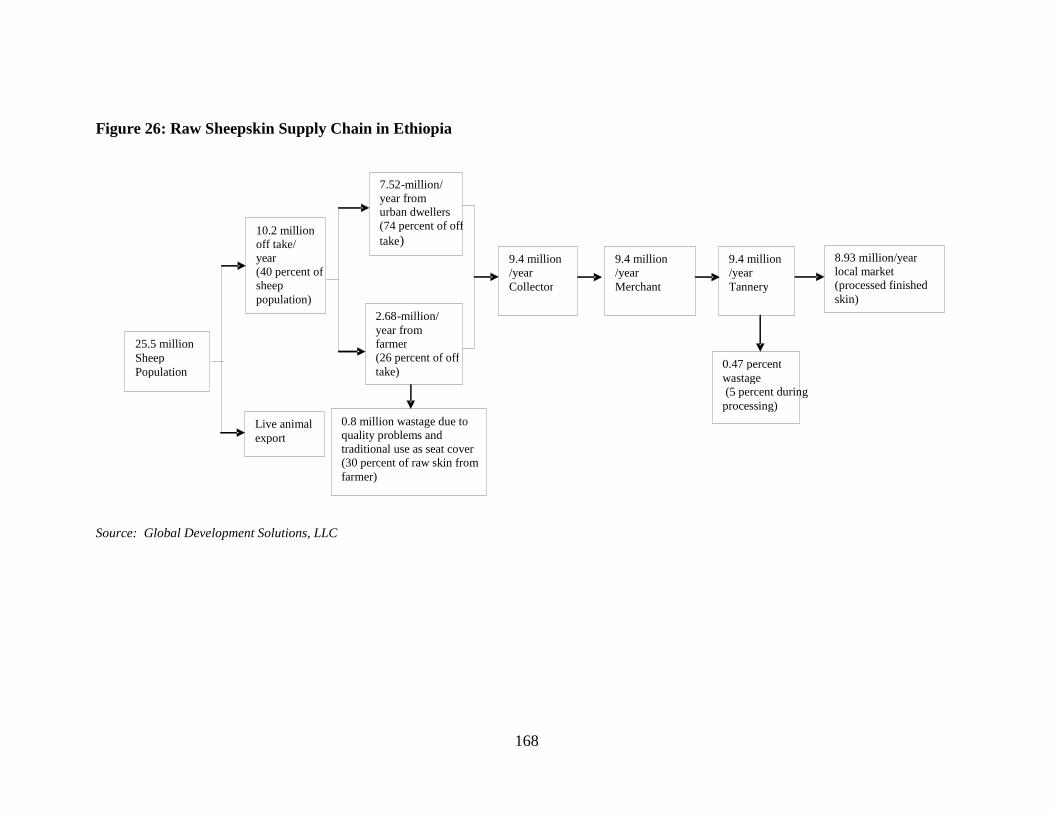
168
Figure 26: Raw Sheepskin Supply Chain in Ethiopia
Source: Global Development Solutions, LLC
25.5 million Sheep Population
10.2 million off take/ ye ar (40 percent of sheep population)
Live animal export
7.52 - million/ year from urban dwellers (74 percent of off take )
2.68 - million/ year from farmer (26 percent of off take)
9.4 million /year Collector
9.4 million /year Merchant
9.4 million /year Tannery
8.93 m illion/year local market ( processed finished skin)
0.8 million wastage due to quality problems and traditional use as seat cover (30 percent of raw skin from farmer)
0.47 percent wastage (5 percent during processing)
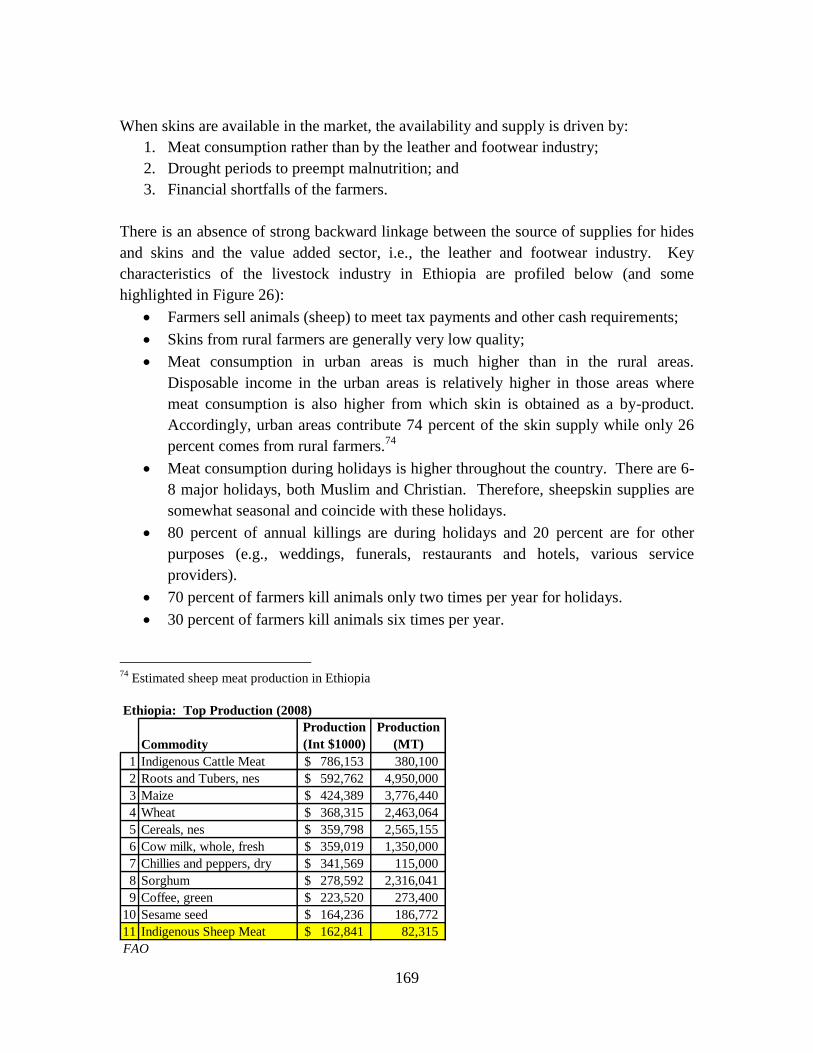
169
When skins are available in the market, the availability and supply is driven by:
1. Meat consumption rather than by the leather and footwear industry;
2. Drought periods to preempt malnutrition; and
3. Financial shortfalls of the farmers.
There is an absence of strong backward linkage between the source of supplies for hides
and skins and the value added sector, i.e., the leather and footwear industry. Key
characteristics of the livestock industry in Ethiopia are profiled below (and some
highlighted in Figure 26):
Farmers sell animals (sheep) to meet tax payments and other cash requirements;
Skins from rural farmers are generally very low quality;
Meat consumption in urban areas is much higher than in the rural areas.
Disposable income in the urban areas is relatively higher in those areas where
meat consumption is also higher from which skin is obtained as a by-product.
Accordingly, urban areas contribute 74 percent of the skin supply while only 26
percent comes from rural farmers.74
Meat consumption during holidays is higher throughout the country. There are 6-
8 major holidays, both Muslim and Christian. Therefore, sheepskin supplies are
somewhat seasonal and coincide with these holidays.
80 percent of annual killings are during holidays and 20 percent are for other
purposes (e.g., weddings, funerals, restaurants and hotels, various service
providers).
70 percent of farmers kill animals only two times per year for holidays.
30 percent of farmers kill animals six times per year.
74
Estimated sheep meat production in Ethiopia
Ethiopia: Top Production (2008)
Commodity
Production
(Int $1000)
Production
(MT)
1 Indigenous Cattle Meat 786,153$ 380,100
2 Roots and Tubers, nes 592,762$ 4,950,000
3 Maize 424,389$ 3,776,440
4 Wheat 368,315$ 2,463,064
5 Cereals, nes 359,798$ 2,565,155
6 Cow milk, whole, fresh 359,019$ 1,350,000
7 Chillies and peppers, dry 341,569$ 115,000
8 Sorghum 278,592$ 2,316,041
9 Coffee, green 223,520$ 273,400
10 Sesame seed 164,236$ 186,772
11 Indigenous Sheep Meat 162,841$ 82,315
FAO
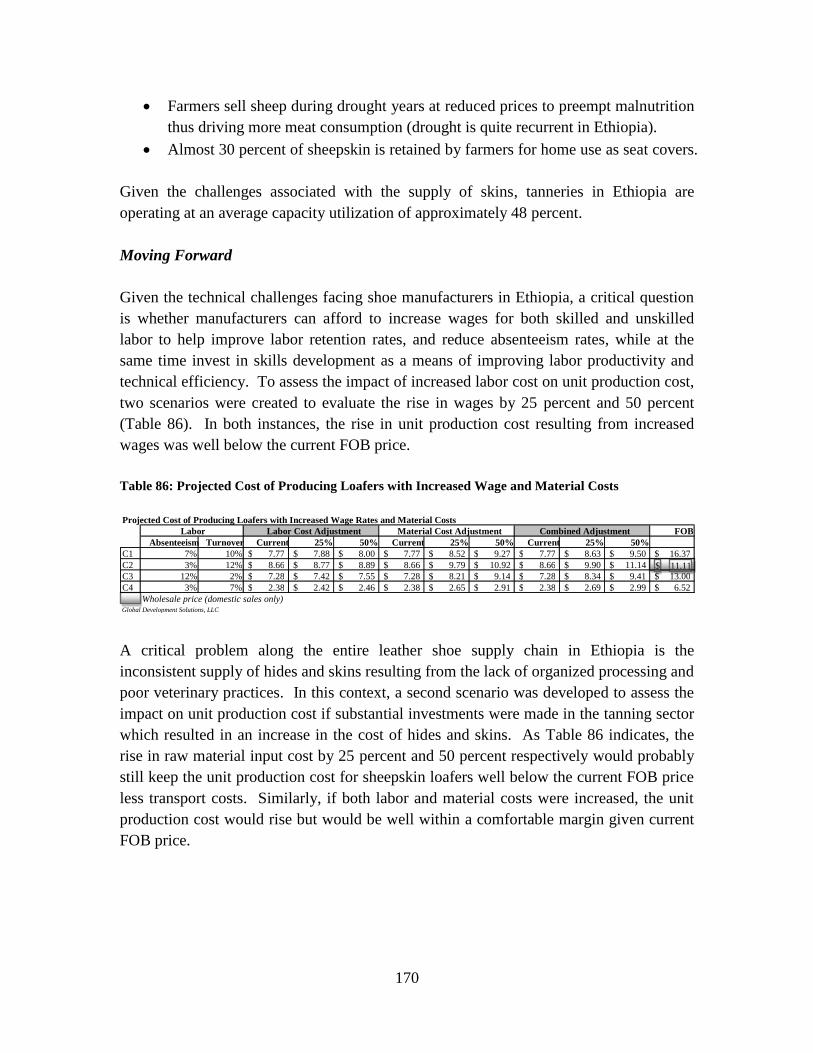
170
Farmers sell sheep during drought years at reduced prices to preempt malnutrition
thus driving more meat consumption (drought is quite recurrent in Ethiopia).
Almost 30 percent of sheepskin is retained by farmers for home use as seat covers.
Given the challenges associated with the supply of skins, tanneries in Ethiopia are
operating at an average capacity utilization of approximately 48 percent.
Moving Forward
Given the technical challenges facing shoe manufacturers in Ethiopia, a critical question
is whether manufacturers can afford to increase wages for both skilled and unskilled
labor to help improve labor retention rates, and reduce absenteeism rates, while at the
same time invest in skills development as a means of improving labor productivity and
technical efficiency. To assess the impact of increased labor cost on unit production cost,
two scenarios were created to evaluate the rise in wages by 25 percent and 50 percent
(Table 86). In both instances, the rise in unit production cost resulting from increased
wages was well below the current FOB price.
Table 86: Projected Cost of Producing Loafers with Increased Wage and Material Costs
A critical problem along the entire leather shoe supply chain in Ethiopia is the
inconsistent supply of hides and skins resulting from the lack of organized processing and
poor veterinary practices. In this context, a second scenario was developed to assess the
impact on unit production cost if substantial investments were made in the tanning sector
which resulted in an increase in the cost of hides and skins. As Table 86 indicates, the
rise in raw material input cost by 25 percent and 50 percent respectively would probably
still keep the unit production cost for sheepskin loafers well below the current FOB price
less transport costs. Similarly, if both labor and material costs were increased, the unit
production cost would rise but would be well within a comfortable margin given current
FOB price.
Projected Cost of Producing Loafers with Increased Wage Rates and Material Costs FOB
Absenteeism Turnover Current 25% 50% Current 25% 50% Current 25% 50% C1 7% 10% 7.77 $
7.88 $ 8.00 $
7.77 $ 8.52 $
9.27 $ 7.77 $
8.63 $ 9.50 $
16.37 $
C2 3% 12% 8.66 $ 8.77 $
8.89 $ 8.66 $
9.79 $ 10.92 $
8.66 $ 9.90 $
11.14 $ 11.11 $
C3 12% 2% 7.28 $
7.42 $ 7.55 $
7.28 $ 8.21 $
9.14 $ 7.28 $
8.34 $ 9.41 $
13.00 $
C4 3% 7% 2.38 $ 2.42 $
2.46 $ 2.38 $
2.65 $ 2.91 $
2.38 $ 2.69 $
2.99 $ 6.52 $
Wholesale price (domestic sales only)
Global Development Solutions, LLC
Labor Labor Cost Adjustment Material Cost Adjustment Combined Adjustment
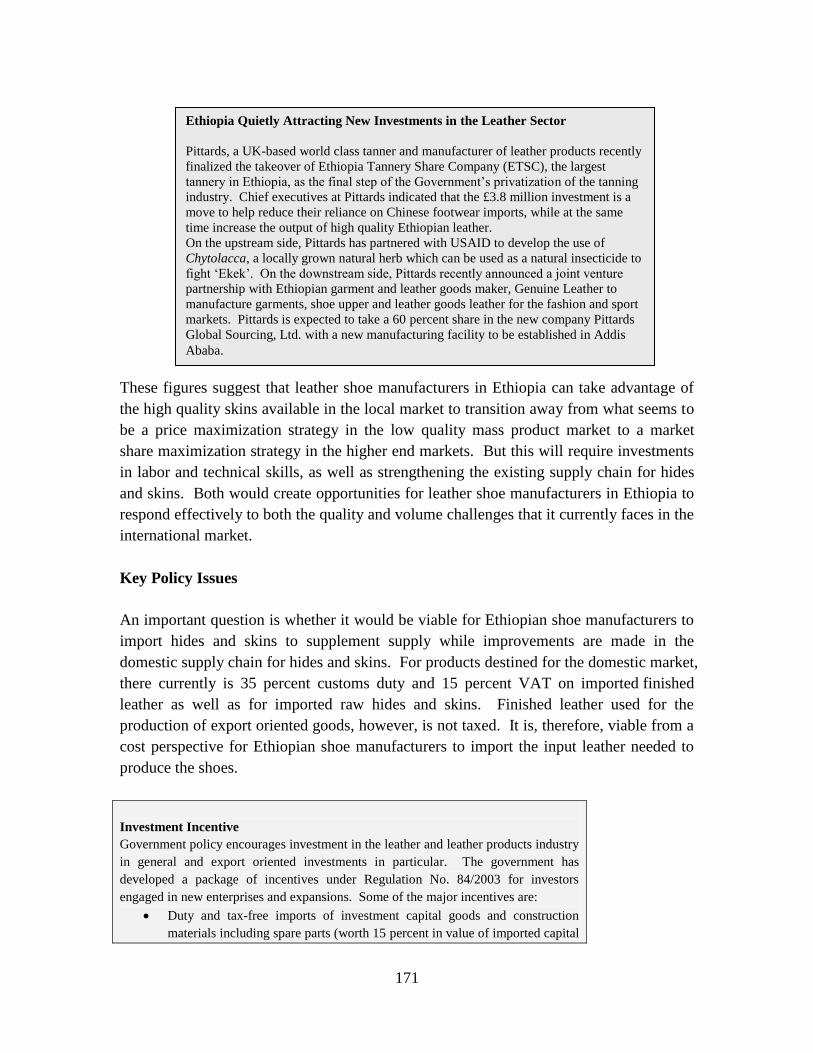
171
These figures suggest that leather shoe manufacturers in Ethiopia can take advantage of
the high quality skins available in the local market to transition away from what seems to
be a price maximization strategy in the low quality mass product market to a market
share maximization strategy in the higher end markets. But this will require investments
in labor and technical skills, as well as strengthening the existing supply chain for hides
and skins. Both would create opportunities for leather shoe manufacturers in Ethiopia to
respond effectively to both the quality and volume challenges that it currently faces in the
international market.
Key Policy Issues
An important question is whether it would be viable for Ethiopian shoe manufacturers to
import hides and skins to supplement supply while improvements are made in the
domestic supply chain for hides and skins. For products destined for the domestic market,
there currently is 35 percent customs duty and 15 percent VAT on imported finished
leather as well as for imported raw hides and skins. Finished leather used for the
production of export oriented goods, however, is not taxed. It is, therefore, viable from a
cost perspective for Ethiopian shoe manufacturers to import the input leather needed to
produce the shoes.
Investment Incentive
Government policy encourages investment in the leather and leather products industry
in general and export oriented investments in particular. The government has
developed a package of incentives under Regulation No. 84/2003 for investors
engaged in new enterprises and expansions. Some of the major incentives are:
Duty and tax-free imports of investment capital goods and construction
materials including spare parts (worth 15 percent in value of imported capital
Ethiopia Quietly Attracting New Investments in the Leather Sector
Pittards, a UK-based world class tanner and manufacturer of leather products recently
finalized the takeover of Ethiopia Tannery Share Company (ETSC), the largest
tannery in Ethiopia, as the final step of the Government‘s privatization of the tanning
industry. Chief executives at Pittards indicated that the £3.8 million investment is a
move to help reduce their reliance on Chinese footwear imports, while at the same
time increase the output of high quality Ethiopian leather.
On the upstream side, Pittards has partnered with USAID to develop the use of
Chytolacca, a locally grown natural herb which can be used as a natural insecticide to
fight ‗Ekek‘. On the downstream side, Pittards recently announced a joint venture
partnership with Ethiopian garment and leather goods maker, Genuine Leather to
manufacture garments, shoe upper and leather goods leather for the fashion and sport
markets. Pittards is expected to take a 60 percent share in the new company Pittards
Global Sourcing, Ltd. with a new manufacturing facility to be established in Addis
Ababa.
172
goods);
Duty and tax free importation of raw materials for production of goods
destined for export;
Income tax exemption for 2-8 years (depending on area of investment,
export volume and location of investment);
Loss carry forward for losses made during tax holiday; and
Remittance of funds, investment guarantee and protection and availing of
land at reasonable lease prices.
IV.8. Conclusions: The Possibilities and Actions for Maintaining
Competitiveness in Leather Loafers
Combining economics and VCA in a medium term framework, this analysis has
developed a series of recommendations regarding the maintenance of future
competitiveness in the leather products industry in Ethiopia. The key conclusions are as
follows:
Under present circumstances, Ethiopian leather products are cost and price
competitive on the world market due to low labor costs and access to inexpensive
local sheepskins.
Over the next five years it is anticipated that relative movements in Chinese and
Vietnamese Real Exchange Rates will benefit Ethiopia by increasing the costs of
the competitive suppliers.
However, there are product quality problems and a number of productivity
constraints in Ethiopia such as high labor absenteeism and turnover rates, poor
equipment utilization and high wastage and reject rates.
Ethiopian producers appear to be maximizing short-term profits whereas
competing manufacturers, e.g., from China, have expanded long term market
share by lowering their prices. If the general Ethiopian strategy is one of profit
maximization, then it would limit the chances of scaling up production and thus
maintain an industry of small scale producers for whom economies of scale
cannot be achieved. It would be in the interests of the industry to encourage
major private investors to look for merger opportunities. Referring back to Table
61 and Table 72 it is seen that Chinese shoe factories are larger than the Ethiopian
shoe factories.
Competitiveness could be further assured and increased over time by:
o Improvements in product quality and reductions in wastage and reject
rates;
o Labor skill development;
o Introduction of modern production flow management techniques; and
o Implementation of lean manufacturing practices.
173
Competitiveness could also be improved through reduced absenteeism and labor
turnover especially among skilled workers. Analysis shows that because of very
low comparative labor costs, the industry could afford a significant wage increase
tied to higher labor efficiency including lower absenteeism.
The supply chain could be enhanced by increased investment in improved quality
and availability of sheepskin, particularly in the context of improving consistency
in supply, which will require substantial improvements in the supply chain
between farmers and tanneries.
The outlook for Ethiopian leather is relatively good at the present moment and its cost
advantages are likely to be retained. There are a number of opportunities for productivity
improvement that could attract investment into the subsector.
The growth outlook for Tanzania‘s leather footwear industry revolves around addressing
inefficiencies fairly similar to those prevailing in Ethiopia:
1. Productivity levels have room for improvement.
2. Capacity utilization is generally low. Public and/or private security
organizations in the country are the largest buyers of leather shoes, boots,
etc., and capacity utilization of leather shoe manufacturers largely depends
on the volatile order flow from these organizations.
3. While the know-how to make shoes in general is there, leather footwear
producers in Tanzania do not have sufficient technology and know-how
levels to make exportable sheepskin shoes.
In reference to Zambia, similar factors plague the industry as noted above in Tanzania
and the industry is in decline. As a result, the country is not a factor in fashion or casual
leather shoe production: only workboots and children‘s school shoes are produced in
Zambia. In recent years, several producers have stopped manufacturing leather footwear
and others have gone out of business. Sheepskin is not used in footwear in Zambia
because of low supply. For cowhide footwear, as is the case in Ethiopia, hides are a
byproduct of the meat industry even though there are commercial farms in Zambia. Poor
branding techniques render large portions of the skins useless for processing into useable
hides. In addition, the market itself is not prone to purchasing locally produced fashion
and casual footwear and this segment of the footwear industry has suffered similar fate of
the apparel industry with imported second hand products taking the market from local
producers.