Comparative Value Chain and Economic Analysis of the Apparel
54
65 III. Comparative Value Chain and Economic Analysis of the Apparel Sector (Polo Shirts) in Ethiopia, Tanzania, Zambia, China and Vietnam 19 19 Although polo shirts are not manufactured in Zambia, a basic understanding of the shortcomings of the Zambian apparel sector is included in this chapter.
Transcript of Comparative Value Chain and Economic Analysis of the Apparel
65
III. Comparative Value Chain and Economic
Analysis of the Apparel Sector (Polo Shirts) in
Ethiopia, Tanzania, Zambia, China and
Vietnam19
19
Although polo shirts are not manufactured in Zambia, a basic understanding of the shortcomings of the
Zambian apparel sector is included in this chapter.

66
III.1. Apparel Products Analysis: Objectives
The purpose of the garment products analysis is to assess the current competitiveness of
the subsector and the main opportunities for moving from the current relative inefficiency
and low competitiveness to reach a competitive production level in the medium term
future. To do this, a typical product (a polo shirt) is analyzed in the following manner:
Examine important issues and trends in the world garment products market;
Review the structure of the Ethiopian, Tanzanian, Zambian, Chinese and
Vietnamese garments markets;
Assess the key features, strengths and weaknesses of the existing supply chain for
garments in Ethiopia, Tanzania, Zambia, China and Vietnam;
Assess the overall economic efficiency of domestic garment production in relation
to world prices (based primarily on Chinese prices) using alternative cost
projection scenarios to establish current and medium term competitiveness;
Taking the economic efficiency result as a starting point, analyze the garment
(polo shirt) value chain to identify key strengths, weaknesses and opportunities or
needs for investment, expansion or contraction to move towards international
competitiveness at the business strategy and business process level; and
Provide possible policy options and recommendations to help stimulate growth
and improve competitiveness in the sector.
III.2. Product Selection Method
Following a review of the first product screening in which 40 products were selected for
consideration for the value chain analysis and feasibility study, the World Bank (WB)
and Global Development Solutions (GDS)/HQ teams immediately agreed on seven out of
the ten products needed for the analysis. The seven products selected by the teams were
as follows:
1. Apparel:
a. Polo shirt; and
b. Underwear
2. Agribusiness:
a. Milk; and
b. Wheat milling
3. Leather:
a. High-end sheepskin loafers
4. Wood:
67
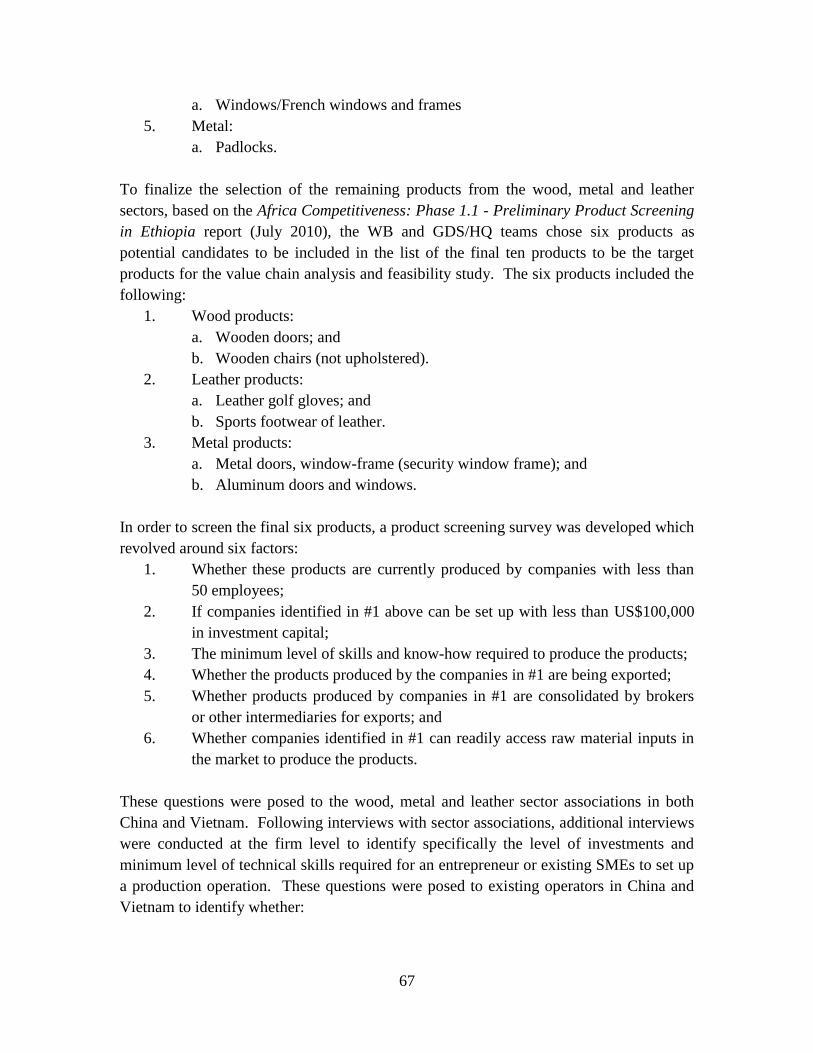
a. Windows/French windows and frames
5. Metal:
a. Padlocks.
To finalize the selection of the remaining products from the wood, metal and leather
sectors, based on the Africa Competitiveness: Phase 1.1 - Preliminary Product Screening
in Ethiopia report (July 2010), the WB and GDS/HQ teams chose six products as
potential candidates to be included in the list of the final ten products to be the target
products for the value chain analysis and feasibility study. The six products included the
following:
1. Wood products:
a. Wooden doors; and
b. Wooden chairs (not upholstered).
2. Leather products:
a. Leather golf gloves; and
b. Sports footwear of leather.
3. Metal products:
a. Metal doors, window-frame (security window frame); and
b. Aluminum doors and windows.
In order to screen the final six products, a product screening survey was developed which
revolved around six factors:
1. Whether these products are currently produced by companies with less than
50 employees;
2. If companies identified in #1 above can be set up with less than US$100,000
in investment capital;
3. The minimum level of skills and know-how required to produce the products;
4. Whether the products produced by the companies in #1 are being exported;
5. Whether products produced by companies in #1 are consolidated by brokers
or other intermediaries for exports; and
6. Whether companies identified in #1 can readily access raw material inputs in
the market to produce the products.
These questions were posed to the wood, metal and leather sector associations in both
China and Vietnam. Following interviews with sector associations, additional interviews
were conducted at the firm level to identify specifically the level of investments and
minimum level of technical skills required for an entrepreneur or existing SMEs to set up
a production operation. These questions were posed to existing operators in China and
Vietnam to identify whether:

68
Barriers to market entry, particularly from a financial and skills
requirement, were sufficiently low to allow entrepreneurs and SMEs in
Ethiopia to easily establish operations; and
These products are currently being produced by SMEs in China and
Vietnam, and are effectively being sold in local and export markets.
The product screening survey identified the following products as viable candidates to be
targeted for the value chain and feasibility analysis.
1. Wood product:
a. Wooden chairs (soft wood); and
b. Wooden door (semi-solid).
Although French windows and their frames made of wood had originally been
pre-selected for analysis, a decision was made to opt to analyze both wooden
chairs and wooden doors. This decision stemmed from the fact that French
windows require glass thus introducing an outside factor that could influence
the manufacturing of the final product. Wooden doors (without glass) and
wooden chairs (without upholstery) are more representative of wood
processing exclusively.
2. Leather products: Leather golf gloves or sports glove of comparable structure
and weight.
3. Metal products: Both the pre-selected products (security window frame; and
aluminum doors and windows) were screened out of the selection due to
various factors including high initial investment requirements. As a result,
further analyses of products identified during the preliminary product
screening were conducted. Interviews with metal sector associations and
enterprises currently operating in China and Vietnam, as well as interviews
with existing operators in the fabricated metal products sector in Ethiopia,
identified crown cork (bottle caps) as a viable candidate to be targeted for
value chain analysis. Crown corks currently are produced in four of the five
countries, but Ethiopia continues to import substantial volumes of this product,
including imports from China. As a result, crown corks have been chosen as
the final fabricated metal product to be the focus of a value chain analysis in
the target countries.

69
III.2.1. Respective Government Definitions of Small, Medium and
Large Enterprises in Ethiopia, Tanzania, Zambia, China and
Vietnam
Ethiopia: For Ethiopia, the classification of enterprises into small, medium and large
scale depends on a number of variables such as level of employment, turnover, capital
investment, production capacity, level of technology and subsector. Accordingly, the
following scales are referred to the classification of enterprises in the Ethiopian context
(Table 15).
Table 15: Company Size Classification Structure for Ethiopia
Small Scale Medium Scale Large Scale
Textile and Apparel 5-9 10 – 49 above 50
According to the Central
Statistics Agency (CSA)
Leather 2-10 21 – 50 above 51
Diary 2-10 21 – 50 above 51
Wheat 2-10 21 – 50 above 51
Wood Processing 2-10 21 – 50 above 51
Metal 2-10 21 – 50 above 51
According to Federal
Medium and Small
Enterprise Development
Agency (FeMSEDA)
Sub-sector Remark
Number of Employees
Source: Ethiopia CSA and FeMSEDA
Tanzania: For Tanzania, the classification of enterprises into small, medium and large
scale depends on a number of variables such as level of employment and capital
investment in machinery. The classification cuts across sectors and subsectors of the
economy. Accordingly, the following scales refer to the classification of enterprises in
the Tanzanian context (Table 16). Note that small enterprises form the core of the value
chain analyses for Tanzania.
Table 16: Company Size Classification Structure for Tanzania
Category Employees
Capital Investment in Machinery
(TZS million) Remarks
Micro enterprise 1 - 4 Up to 5 Majority in the informal sector
Small enterprise 5 - 49 5 - 200 Most in the informal sector
Medium enterprise 50 - 99 200 - 800 Most in the formal sector
Large enterprise 100+ 800+ All in the formal sector Source: Tanzania Chamber of Commerce, Industry and Agriculture (TCCIA)
Zambia: Zambia classifies enterprises as micro, small, medium and large based on
several factors including number of employees, annual revenue and capital investment.
The capital investment category is further delineated by whether the firm is engaged in
manufacturing or if it is a trading/services firm. For microenterprises, the minimum

70
revenue and investment requirements are kept intentionally low in order to encourage
registration, although few microenterprises actually register.
Table 17: Company Size Classification Structure for Zambia
Classification Employees
Annual Revenue
(ZMK million)
Capital Investment for Manufacturing
Firms (ZMK million)
Capital Investment for Trading/ Services
Firms (ZMK million)
Micro < 10 < 20 < 10 < 10
Small 10 - 50 150 - 250 80 – 200 150
Medium 51-100 300 - 800 200 – 500 151 - 300
Large > 100 > 800 > 500 > 300
Source: Zambia Development Agency
China: The Chinese government is challenged in defining sizes of firms. Temporary
definitions have been used for the past several years, and the government promised to
revise the standard in 2010. The definition from the National Bureau of Statistics of
China is complex. The definition was published in 2002 jointly by the Ministry of
Finance, National Bureau of Statistics of China, State Economic and Trade Commission
(no longer exists) and China Planning Commission, which has since split and exists as
the State Development and Planning Commission (SDPC) and the National Development
and Reform Commission (NDRC). A simplified presentation of the company size
classification is shown in Table 18. Note that the Industrial type is most appropriate for
all sectors studied in this analysis.
Table 18: Company Size Classification Structure for China
Type Index Unit Small Medium Large
Employee person Less than 300 300-2000 More than 2000
Revenue million RMB Less than 30 30-300 More than 300
Asset million RMB Less than 40 40-400 More than 400
Employee person Less than 600 600-3000 More than 3000
Revenue million RMB Less than 30 30-300 More than 300
Asset million RMB Less than 40 40-400 More than 400
Employee person Less than 100 100-200 More than 200
Revenue million RMB Less than 30 30-300 More than 300
Employee person Less than 100 100-500 More than 500
Revenue million RMB Less than 10 10-150 More than 150
Employee person Less than 500 500-3000 More than 3000
Revenue million RMB Less than 30 30-300 More than 300
Employee person Less than 400 400-1000 More than 1000
Revenue million RMB Less than 30 30-300 More than 300
Employee person Less than 400 400-800 More than 800
Revenue million RMB Less than 30 30-150 More than 150
Lodging and
Catering services
Industrial
Construction
Wholesale
Retail
Transportation
Post services
Source: National Bureau of Statistics of China
Vietnam: A small firm has less than 50 laborers, while a medium-size firm has 51-200
laborers. Within the small and medium-size classifications, there are some detailed

71
categories depending on the purpose of research and management. For instance, a firm
with less than 10 laborers is called a super small-size firm. Such a regulation is in line
with Social Insurance Law.20
III.2.2. Product Technical Specification
Following the identification of products to be targeted for the value chain and feasibility
analysis, a detailed technical profile of each product with an accompanying diagram or
photograph was complied and sent to the field teams to help ensure that product data
collection in the field focused on products with similar - if not identical - technical
specifications. Table 19 below provides the product technical specifications for all ten
products for which product data are being collected.
Table 19: Product Technical Specifications
Material
Product WeightUnit of
measureUnit of measure
1 Golf gloves 85 - 141 grams Men's medium Sheepskin
Loafer 780 grams Heel Width Insole
Size US = 8 EU = 7 2.5 10 30
3 Padlock* 760 grams 7 7 NA* cm Brass
Thickness Diameter Height
0.24 31.9 6.6
Width Depth Height
45 45 75
Width Depth Height
80 4 210
Protein Lactose Ash Vitamins Fat content
3.5% 4.7% 0.8% B1, B2, C and D Full
Type (German) Type (French) Ash Protein Moisture
550 55 <0.65%approx.
11%<14.5%
9 Polo shirt 250 - 270 grams 100% cotton
10 Underwear 80 - 100 grams80% cotton/
20% spandex
* Overall height is 14 cm with a 2 cm shackle diameter
** The weight of the cover (plastic sole made from PVC) in the internal surface of the cap is 290 mg
Source: Global Development Solutions, LLC
Pine
Wheat or rice
Dimension
All purpose flour
cm
Refer to diagram
Weight
cm
mm
cm
tin free steel
(tfs)
Sheepskin
Pine
mg
kg
kg
liters
Refer to picture
Crown cork
(metal bottle
cap)**
Wooden chair
Wooden door
Milk
Milling
290
6.5
12
0.5
2
4
5
6
7
8
III.3. Global Apparel Market
Market Trends: In 2009, the global apparel retail industry grew by 2.1 percent year-on-
year, to reach a value of US$1.078 billion; an estimated 80 percent of which is the value
20
Information garnered from
http://laws.dongnai.gov.vn/1991_to_2000/2000/200004/200004280005_en/lawdocum

72
of the global clothing retail industry. By 2014, the global apparel retail industry is
forecast to have a value of US$1.222 billion. The largest segment of the global apparel
retail industry is women‘s wear, accounting for over half (51.3 percent) of the industry's
total value, followed by men‘s wear, women‘s underwear, and children‘s wear. The
largest market is the Americas, which accounts for over a third of the global apparel retail
industry value (35.7 percent).21
Table 20: Leading Importers and Exporters of Clothing (US$ billion and percent), 2009
2009 1980 1990 2000 2009 2000-09 2007 2008 2009
Exporters
China a 107 4.0 8.9 18.3 34.0 13 21 4 -11
European Union (27) 97 - - 28.5 30.7 6 15 8 -15
extra-EU (27) exports 22 - - 6.6 6.9 6 19 12 -22
Hong Kong, China 23 - - - - -1 1 -3 -18
domestic exports 1 11.5 8.6 5.0 0.2 -27 -26 -42 -80
re-exports 22 - - - - 5 10 5 -11
Turkey 12 0.3 3.1 3.3 3.7 7 15 -2 -15
India 11 1.7 2.3 3.0 3.6 8 5 16 0
Bangladesh b 11 0.0 0.6 2.6 3.4 9 6 23 -2
Viet Nam b 9 ... ... 0.9 2.7 19 33 18 -1
Indonesia 6 0.2 1.5 2.4 1.9 3 2 7 -6
United States 4 3.1 2.4 4.4 1.3 -8 -11 3 -6
Mexico a 4 0.0 0.5 4.4 1.3 -8 -19 -4 -15
Thailand 4 0.7 2.6 1.9 1.2 0 -4 4 -12
Pakistan 3 0.3 0.9 1.1 1.1 5 -3 3 -14
Malaysia a 3 0.4 1.2 1.1 1.0 4 11 15 -14
Tunisia 3 0.8 1.0 1.1 1.0 4 18 5 -17
Morocco a 3 0.3 0.7 1.2 1.0 3 9 -3 -10
Above 15 278 - - 79.2 88.0 - - - -
Importers
European Union (27) 160 - - 41.0 48.5 8 14 9 -11
extra-EU (27) imports 85 - - 19.8 25.8 9 14 10 -9
United States 72 16.4 24.0 33.1 21.8 1 2 -3 -13
Japan 26 3.6 7.8 9.7 7.7 3 1 8 -1
Hong Kong, China 16 - - - - 0 2 -3 -16
retained imports ... ... ... ... ... ... ... ... ...
Canada c 8 1.7 2.1 1.8 2.3 8 12 8 -8
Russian Federation b, c 7 - - 1.3 2.2 12 79 -17 -40
Sw itzerland 5 3.4 3.1 1.6 1.6 6 11 12 -10
Australia c 4 0.8 0.6 0.9 1.2 9 13 16 -5
Korea, Republic of 3 0.0 0.1 0.6 1.0 11 15 -2 -20
Saudi Arabia b 3 1.6 0.7 0.4 0.9 16 18 4 50
United Arab Emirates 3 0.6 0.5 0.4 0.8 13 26 21 -8
Norw ay 2 1.7 1.1 0.6 0.7 6 16 12 -13
Turkey 2 0.0 0.0 0.1 0.7 26 43 41 -3
Mexico a, c 2 0.3 0.5 1.8 0.6 -6 -2 3 -17
China a 2 0.1 0.0 0.6 0.6 5 15 16 -19
Above 15 d 299 - - 94.1 90.7 - - - -
Share in world exports/imports Value Annual percentage change
a Includes significant shipments through processing zones.
b Includes WTO Secretariat estimates.
c Imports are valued f.o.b.
21
Datamonitor

73
d Excludes retained imports of Hong Kong, China. Source: WTO. Note: WTO estimates of world trade vary UN Comtrade statistics to include EPZ data
The largest exporter of apparel in general and clothing in particular is China. The
phasing out of quotas and related safeguards in 2002, 2005 and 2008 led to arguably one
of the biggest short-term transfers of production in the history of the world: by 2009, one-
third of world‘s clothing exports came from China compared to less than 10 percent
twenty years earlier (see Table 20 above).
The recent global recession, however, had a serious impact on most major clothing export
countries, including China. Of the top supplying countries, India, Vietnam and
Bangladesh were the only three that were able to withstand the sharp fall in annual export
volumes during 2009.
Industry and Consumer Trends: Notwithstanding the current economic crisis, the
global apparel market is expected to grow steadily. The living standards in emerging
markets are growing and one of the most watched industry trends in the next decade is
how, when and to what extent multinational corporations will expand their reach and
penetrate emerging markets, especially in China, Russia and India.
The apparel industry also is experiencing significant trends in the form of increased:
Consolidation amongst retailers;
Proliferation of private brands;
Proliferation of lifestyle and quick fashion brands; and
Entrenchment of outsourcing and its integration in firm supply chains.
Supplying countries/firms that are best able to adjust to these trends are anticipated to
succeed in the global clothing supply chain. Even though rising labor costs and the
appreciation of its currency in recent years have caused many to question China‘s ability
to remain competitive, China‘s ever-rising share in global clothing exports illustrates the
importance of adaptability to industry trends. More often than not, in order to
compensate for China‘s ability to compete on various levels other than on price,
industries in competing countries must lower their prices in order to remain competitive
with the industry in China - and not because Chinese export prices of clothing items are
always lower (contrary to this ―myth,‖ Chinese prices are most of the time higher – see
Table 21 below).
74
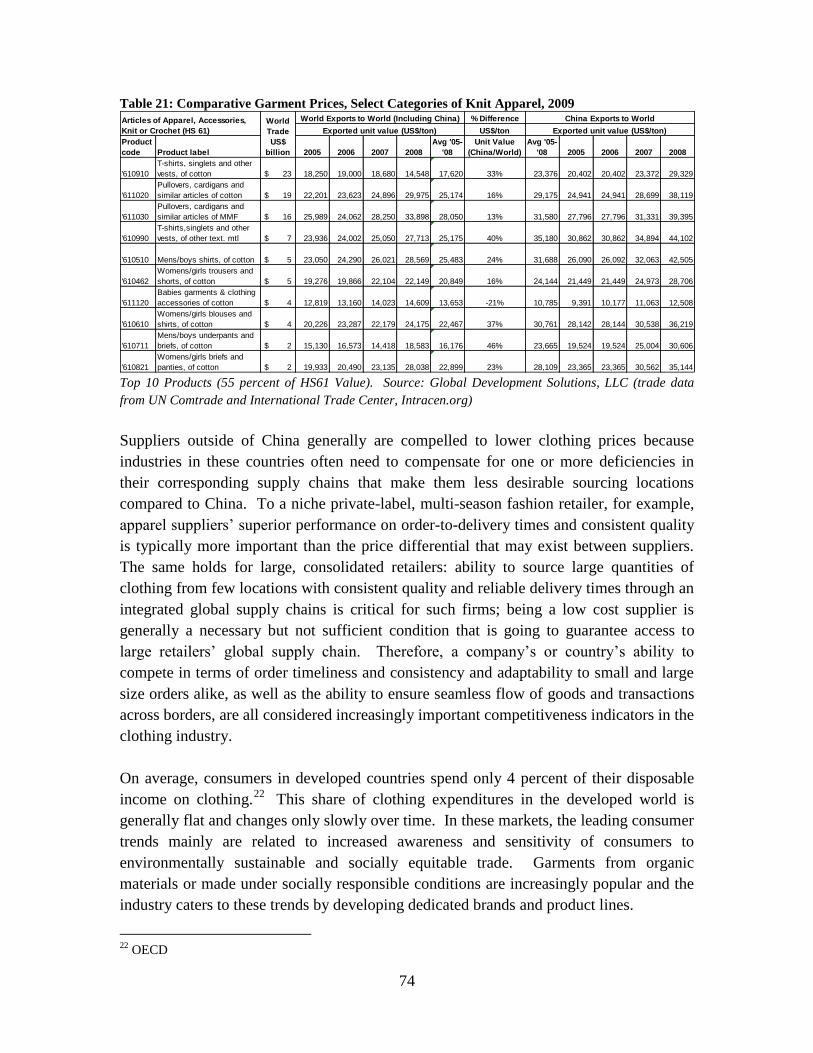
Table 21: Comparative Garment Prices, Select Categories of Knit Apparel, 2009 % Difference
US$/ton
Product
code Product label 2005 2006 2007 2008
Avg '05-
'08
Unit Value
(China/World)
Avg '05-
'08 2005 2006 2007 2008
'610910
T-shirts, singlets and other
vests, of cotton 23$ 18,250 19,000 18,680 14,548 17,620 33% 23,376 20,402 20,402 23,372 29,329
'611020
Pullovers, cardigans and
similar articles of cotton 19$ 22,201 23,623 24,896 29,975 25,174 16% 29,175 24,941 24,941 28,699 38,119
'611030
Pullovers, cardigans and
similar articles of MMF 16$ 25,989 24,062 28,250 33,898 28,050 13% 31,580 27,796 27,796 31,331 39,395
'610990
T-shirts,singlets and other
vests, of other text. mtl 7$ 23,936 24,002 25,050 27,713 25,175 40% 35,180 30,862 30,862 34,894 44,102
'610510 Mens/boys shirts, of cotton 5$ 23,050 24,290 26,021 28,569 25,483 24% 31,688 26,090 26,092 32,063 42,505
'610462
Womens/girls trousers and
shorts, of cotton 5$ 19,276 19,866 22,104 22,149 20,849 16% 24,144 21,449 21,449 24,973 28,706
'611120
Babies garments & clothing
accessories of cotton 4$ 12,819 13,160 14,023 14,609 13,653 -21% 10,785 9,391 10,177 11,063 12,508
'610610
Womens/girls blouses and
shirts, of cotton 4$ 20,226 23,287 22,179 24,175 22,467 37% 30,761 28,142 28,144 30,538 36,219
'610711
Mens/boys underpants and
briefs, of cotton 2$ 15,130 16,573 14,418 18,583 16,176 46% 23,665 19,524 19,524 25,004 30,606
'610821
Womens/girls briefs and
panties, of cotton 2$ 19,933 20,490 23,135 28,038 22,899 23% 28,109 23,365 23,365 30,562 35,144
World
Trade
US$
billion
Exported unit value (US$/ton)
World Exports to World (Including China) China Exports to World
Exported unit value (US$/ton)
Articles of Apparel, Accessories,
Knit or Crochet (HS 61)
Top 10 Products (55 percent of HS61 Value). Source: Global Development Solutions, LLC (trade data
from UN Comtrade and International Trade Center, Intracen.org)
Suppliers outside of China generally are compelled to lower clothing prices because
industries in these countries often need to compensate for one or more deficiencies in
their corresponding supply chains that make them less desirable sourcing locations
compared to China. To a niche private-label, multi-season fashion retailer, for example,
apparel suppliers‘ superior performance on order-to-delivery times and consistent quality
is typically more important than the price differential that may exist between suppliers.
The same holds for large, consolidated retailers: ability to source large quantities of
clothing from few locations with consistent quality and reliable delivery times through an
integrated global supply chains is critical for such firms; being a low cost supplier is
generally a necessary but not sufficient condition that is going to guarantee access to
large retailers‘ global supply chain. Therefore, a company‘s or country‘s ability to
compete in terms of order timeliness and consistency and adaptability to small and large
size orders alike, as well as the ability to ensure seamless flow of goods and transactions
across borders, are all considered increasingly important competitiveness indicators in the
clothing industry.
On average, consumers in developed countries spend only 4 percent of their disposable
income on clothing.22
This share of clothing expenditures in the developed world is
generally flat and changes only slowly over time. In these markets, the leading consumer
trends mainly are related to increased awareness and sensitivity of consumers to
environmentally sustainable and socially equitable trade. Garments from organic
materials or made under socially responsible conditions are increasingly popular and the
industry caters to these trends by developing dedicated brands and product lines.
22
OECD

75
In emerging markets, by contrast, especially China and India, it is expected that rising
incomes will generate increased share of household expenditures on clothing. In these
markets, consumers increasingly prefer international brand names and/or retail chain
clothing brands, both at the luxury and low-end price levels. As a result, an increasing
number of multinational apparel brands are present in these markets.
III.3.1. Sub-Saharan Africa (SSA) Apparel Trade
SSA countries imported US$4.5 billion worth of apparel in 2009, an increase of almost
50 percent from 2006 levels (US$3 billion).23
South Africa alone imported over a quarter
of all SSA apparel (in terms of value), followed by Kenya and Angola.
Table 22: Apparel Imports, Sub-Saharan Africa, 2009 (US$000)
Importers Imported value
in 2006
Imported value
in 2007
Imported value
in 2008
Imported value
in 2009
% of
World
% of
SSA
'World $328,896,944 $ 364,163,116 $ 387,607,124 $ 351,981,680 100%
Africa $ 4,524,324 $ 5,101,811 $ 6,264,902 $ 6,982,315 2.0%
Sub Saharan $ 3,113,350 $ 3,491,023 $ 4,107,291 $ 4,412,448 1.3%
'South Africa $ 1,156,471 $ 1,055,347 $ 1,058,673 $ 1,111,833 25.2%
'Kenya $ 121,289 $ 140,314 $ 135,580 $ 299,163 6.8%
'Angola $ 168,069 $ 227,669 $ 338,736 $ 280,678 6.4%
'Togo $ 40,529 $ 347,634 $ 251,523 5.7%
'Sudan $ 193,029 $ 169,074 $ 246,161 5.6%
'Ghana $ 94,413 $ 106,000 $ 118,974 $ 225,929 5.1%
'Nigeria $ 6,985 $ 30,865 $ 31,472 $ 225,376 5.1%
'Benin $ 83,636 $ 269,235 $ 263,514 $ 216,589 4.9%
'Cameroon $ 63,672 $ 124,022 $ 150,056 $ 136,928 3.1%
'Ethiopia $ 171,863 $ 159,847 $ 117,327 $ 124,570 2.8%
'Congo $ 70,843 $ 86,717 $ 102,915 $ 106,294 2.4%
Tanzania $ 56,605 $ 65,666 $ 89,087 $ 88,788 2.0%
'Namibia $ 106,750 $ 152,543 $ 143,838 $ 80,684 1.8%
DR Congo $ 62,287 $ 84,173 $ 79,474 $ 76,347 1.7%
'Senegal $ 35,684 $ 59,084 $ 63,803 $ 76,252 1.7%
'Côte d'Ivoire $ 41,063 $ 62,370 $ 59,305 $ 69,848 1.6%
'Uganda $ 78,100 $ 104,539 $ 112,160 $ 64,202 1.5%
'Mozambique $ 33,926 $ 34,484 $ 41,533 $ 53,402 1.2%
'Botswana $ 87,658 $ 110,765 $ 85,517 $ 53,135 1.2%
'Zambia $ 43,030 $ 53,168 $ 45,741 $ 50,134 1.1%
'Guinea $ 8,604 $ 9,621 $ 14,745 $ 49,603 1.1%
'Malawi $ 27,231 $ 27,663 $ 36,795 $ 46,731 1.1%
'Madagascar $ 30,549 $ 48,665 $ 38,436 $ 44,456 1.0%
'Mauritania $ 11,830 $ 32,224 $ 43,281 1.0%
'Gabon $ 22,431 $ 33,607 $ 38,760 $ 37,492 0.8%
'Mauritius $ 40,705 $ 47,168 $ 64,789 $ 33,203 0.8%
'Mali $ 25,055 $ 48,280 $ 54,154 $ 33,052 0.7%
'Rwanda $ 29,283 $ 25,702 $ 31,953 $ 32,774 0.7%
'Niger $ 43,601 $ 48,005 $ 66,132 $ 32,141 0.7%
Other $ 210,518 $ 223,145 $ 174,890 $ 221,879 5.0% Source: Global Development Solutions LLC from ITC/Comtrade data
23
Includes HS 61, 62 and 63.
76
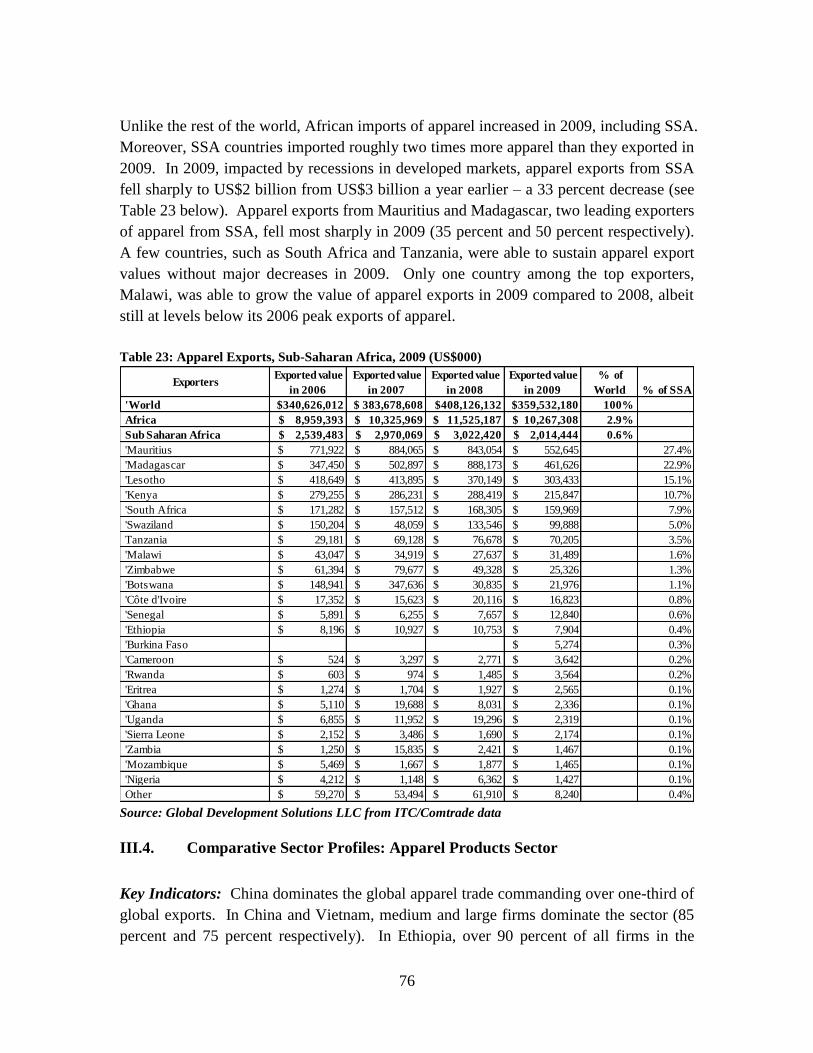
Unlike the rest of the world, African imports of apparel increased in 2009, including SSA.
Moreover, SSA countries imported roughly two times more apparel than they exported in
2009. In 2009, impacted by recessions in developed markets, apparel exports from SSA
fell sharply to US$2 billion from US$3 billion a year earlier – a 33 percent decrease (see
Table 23 below). Apparel exports from Mauritius and Madagascar, two leading exporters
of apparel from SSA, fell most sharply in 2009 (35 percent and 50 percent respectively).
A few countries, such as South Africa and Tanzania, were able to sustain apparel export
values without major decreases in 2009. Only one country among the top exporters,
Malawi, was able to grow the value of apparel exports in 2009 compared to 2008, albeit
still at levels below its 2006 peak exports of apparel.
Table 23: Apparel Exports, Sub-Saharan Africa, 2009 (US$000)
Exporters Exported value
in 2006
Exported value
in 2007
Exported value
in 2008
Exported value
in 2009
% of
World % of SSA
'World $340,626,012 $ 383,678,608 $408,126,132 $359,532,180 100%
Africa $ 8,959,393 $ 10,325,969 $ 11,525,187 $ 10,267,308 2.9%
Sub Saharan Africa $ 2,539,483 $ 2,970,069 $ 3,022,420 $ 2,014,444 0.6%
'Mauritius $ 771,922 $ 884,065 $ 843,054 $ 552,645 27.4%
'Madagascar $ 347,450 $ 502,897 $ 888,173 $ 461,626 22.9%
'Lesotho $ 418,649 $ 413,895 $ 370,149 $ 303,433 15.1%
'Kenya $ 279,255 $ 286,231 $ 288,419 $ 215,847 10.7%
'South Africa $ 171,282 $ 157,512 $ 168,305 $ 159,969 7.9%
'Swaziland $ 150,204 $ 48,059 $ 133,546 $ 99,888 5.0%
Tanzania $ 29,181 $ 69,128 $ 76,678 $ 70,205 3.5%
'Malawi $ 43,047 $ 34,919 $ 27,637 $ 31,489 1.6%
'Zimbabwe $ 61,394 $ 79,677 $ 49,328 $ 25,326 1.3%
'Botswana $ 148,941 $ 347,636 $ 30,835 $ 21,976 1.1%
'Côte d'Ivoire $ 17,352 $ 15,623 $ 20,116 $ 16,823 0.8%
'Senegal $ 5,891 $ 6,255 $ 7,657 $ 12,840 0.6%
'Ethiopia $ 8,196 $ 10,927 $ 10,753 $ 7,904 0.4%
'Burkina Faso $ 5,274 0.3%
'Cameroon $ 524 $ 3,297 $ 2,771 $ 3,642 0.2%
'Rwanda $ 603 $ 974 $ 1,485 $ 3,564 0.2%
'Eritrea $ 1,274 $ 1,704 $ 1,927 $ 2,565 0.1%
'Ghana $ 5,110 $ 19,688 $ 8,031 $ 2,336 0.1%
'Uganda $ 6,855 $ 11,952 $ 19,296 $ 2,319 0.1%
'Sierra Leone $ 2,152 $ 3,486 $ 1,690 $ 2,174 0.1%
'Zambia $ 1,250 $ 15,835 $ 2,421 $ 1,467 0.1%
'Mozambique $ 5,469 $ 1,667 $ 1,877 $ 1,465 0.1%
'Nigeria $ 4,212 $ 1,148 $ 6,362 $ 1,427 0.1%
Other $ 59,270 $ 53,494 $ 61,910 $ 8,240 0.4% Source: Global Development Solutions LLC from ITC/Comtrade data
III.4. Comparative Sector Profiles: Apparel Products Sector
Key Indicators: China dominates the global apparel trade commanding over one-third of
global exports. In China and Vietnam, medium and large firms dominate the sector (85
percent and 75 percent respectively). In Ethiopia, over 90 percent of all firms in the

77
sector are small. Of the roughly 10,000 people employed in the apparel sector in
Ethiopia, male and female workers are equally represented in the workforce. By contrast,
the majority (80 percent) of the sector‘s workforces in China and Vietnam are female. In
Tanzania, the size of the export-based garment sector is extremely limited and shrinking.
In 2008, two integrated garment plants existed in the north of the country, and two non-
integrated garment assembly plants operated in the Dar es Salaam region. As of January
2011, only four purely export-oriented garment firms existed in the country, and these
generated very limited employment (estimated at less than 2,000 people).24
An estimated
three other small firms produce a mix of consumer and industrial clothing dedicated
mostly for the local market; these firms are estimated to employ less than 100 people. By
contrast, China and Vietnam generate millions of jobs in the sector (refer to Table 24
below).
Table 24: A Snapshot of the Apparel Sector in China, Vietnam, Ethiopia, Tanzania and Zambia
Key Comparative Indicators China Vietnam Ethiopia Tanzania Zambia
Total Imports (Value) 1,651,745,000$ 604,373,333$ 72,546,928$ $ 88,788,000 * 18,719,204$
Total Exports (Value) 100,479,288,000$ 8,244,000,000$ 10,405,248$ $ 8,299,000** 303,842$
Companies Operating in the Sector 52,828 3,174 436 9 12
Small 13.2% 26.8% 91.1% 66.7% -
Medium 54.0% 55.0% 1.6% 22.2% 50.0%
Large 32.8% 18.2% 7.3% 11.1% 50.0%
Estimated no. of work. in the sector 4,587,000 1,194,310 9,746 2,000 1,500
Male 20.0% 17.0% 58.0% n.a 74.0%
Female 80.0% 82.8% 42.0% n.a 26.0%
* Includes worn clothing US$40 million; ** Includes only clothing apparel (excl. furnishing textiles, linens, drapes, etc)
Global Development Solutions, LLC
Policy and Regulatory Environment: China and Vietnam maintain various input and/or
output subsidies to encourage industrial production and exports. In Vietnam electricity
prices, for example, are controlled and generally subsidized; industry can access
electricity at low prices and generally at rates on par with household consumers without
paying premiums for load factors. In China, apparel exporters are given a 16 percent
rebate on the exported price of apparel; in other words, all apparel manufacturing value
added receives a 16 percent rebate - this more than covers the VAT manufacturers pay on
inputs and allows Chinese exporter‘s significant room for price discounts when
negotiating with foreign buyers.25
In Ethiopia and Tanzania (and Zambia as well) apparel manufacturers do not enjoy
support at such levels and generally face a range of taxes and levies that increase their
costs of doing business. Garment exporters working under Export Processing Zone status
are exempt from duties on inputs and get VAT refunds.
24
Excludes apparel producers of printed fabric that produce traditional kitenges and kangas used in the
region as cover garments. One textile mill, which also produces exportable knit garments, employs over
2,000 people but not all of them work in garment assembly. 25
The rebate rates and the list of items that qualify for export rebates change frequently depending on
policy-makers assessments of various trends such as global price outlook, local market developments, etc.

78
Table 25: Comparative Policy and Regulatory Environment for the Apparel Sector Comparative Policy and Regulatory Environment for the Apparel Sector
Cotton(Preferential) 1%-40% Thread (Preterential) 5% COMESA 18% - 30% EAC Origin 0-5% Cotton Yarn 15%
Cotton (Regular) 125% Thread (CEPT) 5% Customs duty 10 - 30% SADEC Origin 10%-25% Cotton Fabric 15%
Fabric (Regular) 80-90% Fabric (Preferential) 12% 0% 0% All other Origins 20%-25% Cotton Garments 25%
Fabric(Preferential) 10-14% Fabric(CEPT) 5% 0% 0% Polo Shirts 25%
Clothes(Regular) 90-130% Clothes(Preferential) 20% 0% 0% Used Clothing 25%
Clothes(Preferential) 14-17.5% Clothes(CEPT) 5% 0% 0%
Zippers, buttons
& other
accessories 25%
VAT 3% or 17% VAT(Cotton:Other) 5% 10% VAT 15% VAT 18% VAT 16%
Income Tax 25% Income Tax 25% Provident fund Tax 10% Income tax 0 - 35%;30% Income Tax 25%
Other tax 7% Business tax 55 ~ 155 USD Salary Tax 0 - 35%
1% 2% Excise tax 10 - 100%
Surtax 10%
Turnover Tax 2%, 10%
Dividend tax 10%
Royalty tax 5%
Capital gains tax 30%;15%
Withholding Tax 3%
Income tax 0 - 35%;30%
Export Rebate 16% Electricity prices
0 0% Normal time 0.047USD/kWh None None None
0 0% Peak-time 0.092USD/kWh
Off-peak time 0.025USD/kWh
Water price 0.351USD/m3
Zambia
Tariffs
3
1
2Taxes and
Levies
Subsidies
Registration fee (land:
vehicle)
Presumptive
Turnover Tax 1.1%-3.3%
EthiopiaChina Vietnam Tanzania
Source: Global Development Solutions, LLC
III.5. Sector Profile for the Apparel Products Sector in Ethiopia, Tanzania,
Zambia, China, and Vietnam
III.5.1. Sector Profile: Apparel Sector – Ethiopia
The Ethiopian apparel sector accounted for 7.1 percent of the country‘s industrial
production in 2009/10. As of the fiscal year ending in June 2010, apparel exports totaled
US$12 million, which comprised 0.72 percent of the country‘s total exports for the
period.26
Key products for the year were polo shirts (4,219,250 pieces), T-shirts
(5,424,750 pieces), sportswear (2,411,000 pieces), work clothes (1,845,000 pieces), and
uniforms (2,152,500 pieces). Major export destinations were the United States (11.4
percent), Italy (10 percent), Netherlands (5.1 percent), Germany (3.9 percent), Belgium
(3.2 percent) and United Kingdom (1.9 percent).
Ethiopia apparel imports (primarily from China) outweigh domestic production by
approximately 7:1 (see Table 26 below). The total import value is nearly equivalent to
domestic demand (value = 99.3 percent of demand) yet import volume is 88 percent of
demand thus suggesting domestically produced items are less costly than imported goods.
Export figures suggest that the price per piece is much higher than those sold in the
domestic market and imported products. This suggests higher quality items are being
26
Ministry of Trade and Industry

79
exported from Ethiopia. These trends have been repeated for at least the past three years
since 2007.
Table 26: Apparel Production and Trade Statistics, Ethiopia, 2009
Domestic Production Domestic Demand Total Imports Total Exports
Volume (pieces) 17,543,075 132,467,738 117,734,080 2,809,417
Value (USD) 10,937,533 73,079,213 72,546,928 10,405,248 Source: Global Development Solutions, LLC; Ethiopian Customs Authority; Ministry of Trade and Industry
The socialist government (1974-1991) allocated more land for cotton production,
nationalized existing textile and apparel firms and built large textile factories to supply
yarn and fabric. The textile sector grew to become the biggest contributor to GDP and
became one of the largest employers in the country. Inefficiencies of the command
economy led to the sector falling into neglect as technology became outdated and
international standards could no longer be met. As a result, the cotton farming and
apparel sectors ended up producing well below capacity. Revitalization, however, has
taken effect over the past decade as factories have been privatized and foreign investment
has come in. The sector has attracted US$3 million in foreign investments, mainly from
United States, Italy and Turkey. Ethiopian apparel exports have been growing steadily
considering that in 2002 exports totaled less than US$4 million.
The sector employs an estimated 9,746 workers: 58 percent male and 42 percent female.
Small companies are prevalent and employ approximately 91 percent of the apparel labor
force (see Table 27 below).
Table 27: Employment Statistics for Ethiopia Apparel Sector
Company Size
Estimated Number
of Companies % of Companies by Size
Number of
Employees Avg Number of Employees
Small 397 91.1% 1,961 5
Medium 7 1.6% 343 49
Large 32 7.3% 7,442 233
Total 436 100.0% 9,746 Source: Central Statistical Authority
Advantages for the apparel sector in Ethiopia are low labor wages, raw material supply
and preferential access for Ethiopian exports to the United States under the African
Growth and Opportunity Act (AGOA) until 2015.
Drawbacks for the sector exist as well. A major drawback is that Ethiopia is landlocked.
This, compounded by the weak transportation and communication links, presents
problems for efficient exports, especially considering the high importance of time-to-
market in the global apparel market. Further, and most significantly, while local raw

80
material (cotton) is available, as will be explained in detail in a subsequent section, the
inability of the textile sector to produce fabric in sufficient quantity and quality for use in
export apparel completely offsets the advantage of having locally grown cotton.
III.5.1.1 Supply Chain and Institution Support Structure: Apparel – Ethiopia
The major stakeholders in the Ethiopian textile and garment sector are small farm holders,
collectors (merchants), private commercial farms, state farm enterprises, ginneries and
textile and garment manufacturers. They are supported by development partners
(UNIDO, USAID and FAO) and technical and vocational training (TVET) institutions as
well as universities, sector associations, and government institutions (see Figure 2 below).
Figure 2: Ethiopia’s Cotton-to-Garment Market and Institutional Support
Structure Ethiopia’s Cotton-to-Garment Market and Institutional Support Structure
Market structure Institutional Support structure
Cotton Farm - Ministry of Agriculture and Rural
Development (MoARD)
- Bureaus of Agricultural and Rural
Development (BoARDs)
- Ethiopian Institute of Agricultural
Research (EIAR)
Cotton Ginning &
Spinning Mfs
Textile Mfs
Imported
fabric
Garment/Apparel
FDI LE SME
Local Market Export Market
Imported
garment
- Development Partners (ecbp, UNIDO,
USAID, FAO),
- Technical and vocational Training
(TVET)
- Ethiopian Textile and Garment
Manufacturers Association (ETGAMA),
- Ethiopian Chamber of Commerce and
Sector Associations (ECC & SA),
- Textile and Apparel Institute (TAI),
Quality and Standards Authority of
Ethiopia (QSAE),
- Ethiopian Revenue and Customs
Authority (ERCA),
- Ministry of Trade and Industry (MOTI)
- Ministry of Capacity Building (MoCB)
- MoE (Ministry of Education)
Notes: i) FDI – Foreign Direct Investment Enterprises; LE – Large Enterprises; SME – Small and Medium Enterprises
ii) Dash line (- - -) indicates a week linkage, lack of organization, and areas where technical support is required
to help strengthen linkages along the supply chain
Area: 118,000 ha
Output: 227,000 tons
Textiles: 13 Garment (midium
& large: 39
Export Market:
Apparel
US$10 million
Local Market:
Apparel
US$73 million
Cotton
Cotton Ginning & Spinning
Mfs: 22
Source: Global Development Solutions, LLC
The Ethiopian Ministry of Trade and Industry (MoTI) determines policy and strategy and
leads and supports the industrial development of the country. The Textile and Apparel
Institute (TAI) is a specialized institute under MoTI and has the task to promote the
textile and garment subsector. TAI is responsible for human resource development,
technology transfer for industrial development, marketing support and research and

81
development activities in the subsector. The Ministry of Agriculture and Rural
Development (MoARD) leads the development of cotton as a major input for the textile
industry. Regional developments, extension services and training are promoted and
organized through the Bureaus of Agricultural and Rural Development (BoARDs).
Under the guidance of the Ministry of Education (MoE), seven TVET centers in textile
occupations have been selected countrywide in connection with the establishment of
textile and garment clusters: Addis Ababa, Nazreth, Awassa, Kombolcha, Adwa, Bahir
Dar and Dire Dawa. However, Bahir Dar University Textile Department is the only
educational institution where textile education is provided at university level. Also, the
Ministry of Capacity Building (MoCB), together with development partners, aims to
build capacity in priority sectors of the Ethiopian economy.
The Cotton Growers Association and the Ethiopian Textile and Garment Manufacturers
Association (ETGAMA) share a role in the developmental activities of the textile and
garment sector in Ethiopia. ETGAMA was established in 2003 and represents the
majority of Ethiopia‘s textile mills and garment factories.
Multiple problems persist along the cotton-to-garment processing chain in Ethiopia.
Starting from the farm level and all the way up to garment assembly, productivity and
capacity utilization are not optimal, technology is generally obsolete, and dependence on
imported inputs is high (see Figure 3 below).

82
Figure 3: Ethiopia’s Cotton-to-Garment Processing Road Map
Source: Global Development Solutions, LLC
From interviews with people in the textile sector, the consensus is that the performance of
the existing textile mills in Ethiopia is relatively poor and the sector is not in a position to
produce world class competitive fabric due to the following major factors:
Low level of technology used;
Lack of skilled human resource; and
Ethiopia ’s Cotton - to - Garment Processing Road Map
Ethiopian Cotton Farm s /cotton (118,000 ha / Output: 227,000 tons)
) Cotton Farm ’s Issues - L ow productivities - Low quality and poor varieties - P oor irrigation management - Low far ming, harvesting, and
handling technology - Insufficient inc entives for farmers
Ginning & Spinning Mfs ( Cotton Ginning 11 & Spinning 11 )
Ginning output 84 ,000 tons/year
Textile & Garment Manufacturers ( Textile Mfs 13, Garment Mfs : Medium 7 and
large 32 ) Textile Production Capacity: 25,858 ton/year Installed Capacity: 37,625 ton/year Garment Production Capacity:
Woven - 1 0.9 million pcs /year Knitwear - 16.6 million pcs/year
Installed Capacity: Woven – 37. 4 million pcs/year Knitwear – 18.2 million pcs/year
Upstream
Principal pr oblems of textile & garment industry - Obsol e t e technology - Low quali ty products - Low added value - High dependent on imported inputs - Low domestic market shares - Lack of domestic designers, brand names,
distributors - Shortage of skilled labor - Lack of marketing and management skills
Downstream
83
Financial constraints to acquire adequate technology and operate at optimal capacity
levels.
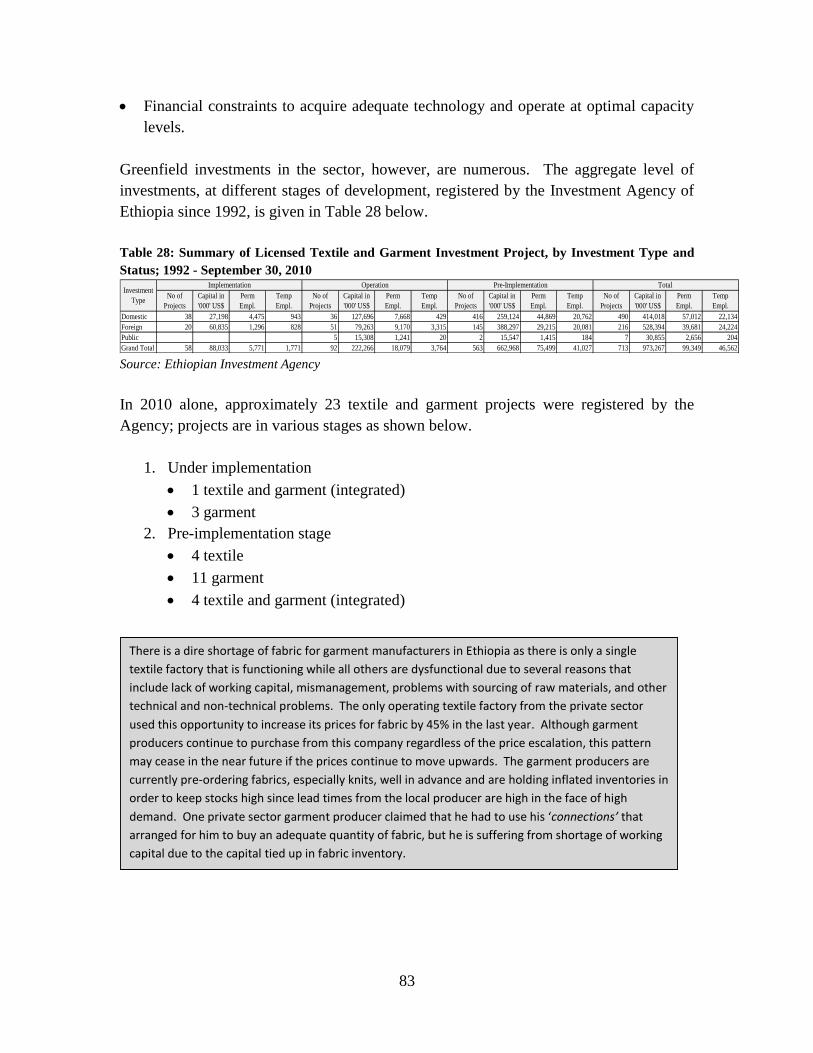
Greenfield investments in the sector, however, are numerous. The aggregate level of
investments, at different stages of development, registered by the Investment Agency of
Ethiopia since 1992, is given in Table 28 below.
Table 28: Summary of Licensed Textile and Garment Investment Project, by Investment Type and
Status; 1992 - September 30, 2010
No of
Projects
Capital in
'000' US$
Perm
Empl.
Temp
Empl.
No of
Projects
Capital in
'000' US$
Perm
Empl.
Temp
Empl.
No of
Projects
Capital in
'000' US$
Perm
Empl.
Temp
Empl.
No of
Projects
Capital in
'000' US$
Perm
Empl.
Temp
Empl.
Domestic 38 27,198 4,475 943 36 127,696 7,668 429 416 259,124 44,869 20,762 490 414,018 57,012 22,134
Foreign 20 60,835 1,296 828 51 79,263 9,170 3,315 145 388,297 29,215 20,081 216 528,394 39,681 24,224
Public 5 15,308 1,241 20 2 15,547 1,415 184 7 30,855 2,656 204
Grand Total 58 88,033 5,771 1,771 92 222,266 18,079 3,764 563 662,968 75,499 41,027 713 973,267 99,349 46,562
Investment
Type
Implementation Operation Pre-Implementation Total
Source: Ethiopian Investment Agency
In 2010 alone, approximately 23 textile and garment projects were registered by the
Agency; projects are in various stages as shown below.
1. Under implementation
1 textile and garment (integrated)
3 garment
2. Pre-implementation stage
4 textile
11 garment
4 textile and garment (integrated)
There is a dire shortage of fabric for garment manufacturers in Ethiopia as there is only a single
textile factory that is functioning while all others are dysfunctional due to several reasons that
include lack of working capital, mismanagement, problems with sourcing of raw materials, and other
technical and non-technical problems. The only operating textile factory from the private sector
used this opportunity to increase its prices for fabric by 45% in the last year. Although garment
producers continue to purchase from this company regardless of the price escalation, this pattern
may cease in the near future if the prices continue to move upwards. The garment producers are
currently pre-ordering fabrics, especially knits, well in advance and are holding inflated inventories in
order to keep stocks high since lead times from the local producer are high in the face of high
demand. One private sector garment producer claimed that he had to use his ‘connections’ that
arranged for him to buy an adequate quantity of fabric, but he is suffering from shortage of working
capital due to the capital tied up in fabric inventory.
84
III.5.2. Sector Profile: Apparel Sector – Tanzania
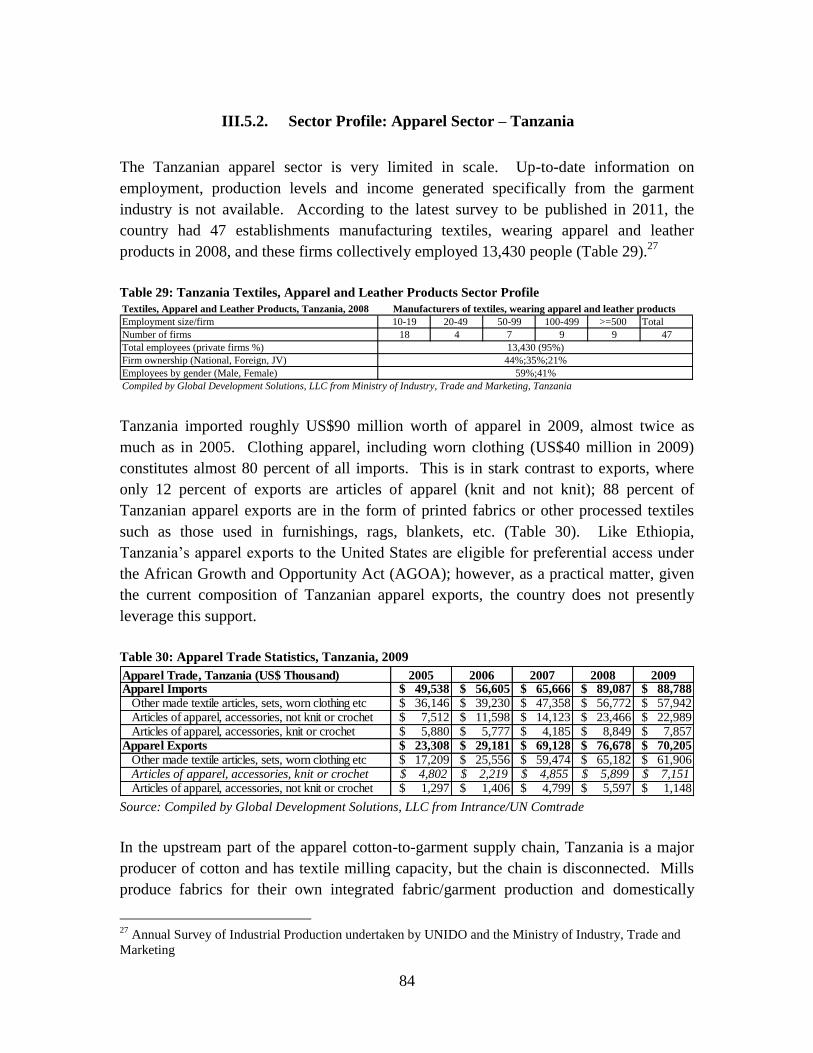
The Tanzanian apparel sector is very limited in scale. Up-to-date information on
employment, production levels and income generated specifically from the garment
industry is not available. According to the latest survey to be published in 2011, the
country had 47 establishments manufacturing textiles, wearing apparel and leather
products in 2008, and these firms collectively employed 13,430 people (Table 29).27
Table 29: Tanzania Textiles, Apparel and Leather Products Sector Profile
Textiles, Apparel and Leather Products, Tanzania, 2008
Employment size/firm 10-19 20-49 50-99 100-499 >=500 Total
Number of firms 18 4 7 9 9 47
Total employees (private firms %)
Firm ownership (National, Foreign, JV)
Employees by gender (Male, Female)
Compiled by Global Development Solutions, LLC from Ministry of Industry, Trade and Marketing, Tanzania
Manufacturers of textiles, wearing apparel and leather products
13,430 (95%)
44%;35%;21%
59%;41%
Tanzania imported roughly US$90 million worth of apparel in 2009, almost twice as
much as in 2005. Clothing apparel, including worn clothing (US$40 million in 2009)
constitutes almost 80 percent of all imports. This is in stark contrast to exports, where
only 12 percent of exports are articles of apparel (knit and not knit); 88 percent of
Tanzanian apparel exports are in the form of printed fabrics or other processed textiles
such as those used in furnishings, rags, blankets, etc. (Table 30). Like Ethiopia,
Tanzania‘s apparel exports to the United States are eligible for preferential access under
the African Growth and Opportunity Act (AGOA); however, as a practical matter, given
the current composition of Tanzanian apparel exports, the country does not presently
leverage this support.
Table 30: Apparel Trade Statistics, Tanzania, 2009
Apparel Trade, Tanzania (US$ Thousand) 2005 2006 2007 2008 2009Apparel Imports $ 49,538 $ 56,605 $ 65,666 $ 89,087 $ 88,788
Other made textile articles, sets, worn clothing etc $ 36,146 $ 39,230 $ 47,358 $ 56,772 $ 57,942 Articles of apparel, accessories, not knit or crochet $ 7,512 $ 11,598 $ 14,123 $ 23,466 $ 22,989 Articles of apparel, accessories, knit or crochet $ 5,880 $ 5,777 $ 4,185 $ 8,849 $ 7,857
Apparel Exports $ 23,308 $ 29,181 $ 69,128 $ 76,678 $ 70,205
Other made textile articles, sets, worn clothing etc $ 17,209 $ 25,556 $ 59,474 $ 65,182 $ 61,906 Articles of apparel, accessories, knit or crochet $ 4,802 $ 2,219 $ 4,855 $ 5,899 $ 7,151 Articles of apparel, accessories, not knit or crochet $ 1,297 $ 1,406 $ 4,799 $ 5,597 $ 1,148
Source: Compiled by Global Development Solutions, LLC from Intrance/UN Comtrade
In the upstream part of the apparel cotton-to-garment supply chain, Tanzania is a major
producer of cotton and has textile milling capacity, but the chain is disconnected. Mills
produce fabrics for their own integrated fabric/garment production and domestically
27
Annual Survey of Industrial Production undertaken by UNIDO and the Ministry of Industry, Trade and
Marketing

85
produced knit and woven fabric is not readily available to the garment industry. In the
cases when local knit fabric mills make their fabric available to garment firms, the fabric
generally is of poor quality and is not used for export-oriented garments.
III.5.2.1 Supply Chain and Institution Support Structure: Apparel – Tanzania
The major stakeholders in the Tanzanian cotton, textile and garment sector are provided
in the map below.
Figure 4: Tanzania’s Cotton-to-Garment Market and Institutional Support
Structure
Source: Global Development Solutions, LLC
III.5.3. Sector Profile: Apparel – Zambia
The Zambian apparel sector is very limited in scale and scope. Up-to-date information
on employment, production levels and income generated specifically from the garment
industry generally is unavailable. According to the Central Statistical Office, the annual
production of all clothing apparel totaled 14,000 metric tons (MT) in 2007, 11,000 MT in
2008 and 8,600 MT in 2009. The production statistics provide evidence that the sector is
not only limited but actually in rapid decline, with the output falling 39 percent in the
Market structure Institutional Support structure
- Ministry of Agriculture, Food Security and
Cooperatives
- Tanzania Cotton Board
- Tanzania Cotton Association
- Tanzania Cotton Growers‘Association
- Tanzania Chamber of Commerce, Industry, and
Agriculture
- Cotton Research Station
- Primary societies, cooperative unions, etc
- Ministry of Trade and Industry
- Tanzania National Business Council
- Tanzania Investment Center
- Confederation of Tanzanian Industries
i) FDI – Foreign Direct Investment Enterprises; LE – Large Enterprises; SME – Small and Medium Enterprises ii) Dashed line (- - -)
indicates a week linkage, lack of organization, and areas where technical support is required to help strengthen linkages along the
supply chain. Note: Figures for number of farmers, ginning, textile, and garment companies from 2008.
Cotton Farmers
Cotton Ginning
Textile Mfs Garment/Apparel
FDI LE SME
Local Market Export Market
400,000 – 500,000
cotton farmers
Garment
Small: na Medium: 5
Large: 2
Export
Market:
Apparel
US$7 mil
Local
Market:
Apparel
NA
48 ginning
companies/cooperatives
Textile
9 companies 12 mills
(including
printed fabrics)
86
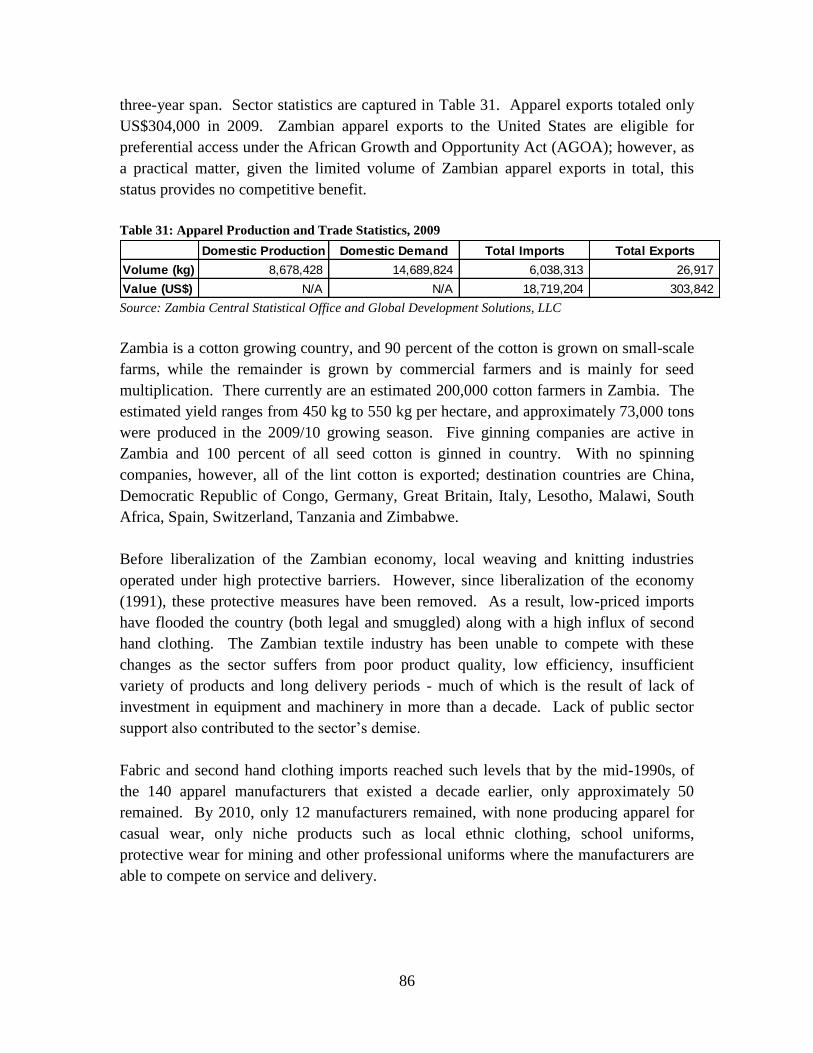
three-year span. Sector statistics are captured in Table 31. Apparel exports totaled only
US$304,000 in 2009. Zambian apparel exports to the United States are eligible for
preferential access under the African Growth and Opportunity Act (AGOA); however, as
a practical matter, given the limited volume of Zambian apparel exports in total, this
status provides no competitive benefit.
Table 31: Apparel Production and Trade Statistics, 2009
Domestic Production Domestic Demand Total Imports Total Exports
Volume (kg) 8,678,428 14,689,824 6,038,313 26,917
Value (US$) N/A N/A 18,719,204 303,842 Source: Zambia Central Statistical Office and Global Development Solutions, LLC
Zambia is a cotton growing country, and 90 percent of the cotton is grown on small-scale
farms, while the remainder is grown by commercial farmers and is mainly for seed
multiplication. There currently are an estimated 200,000 cotton farmers in Zambia. The
estimated yield ranges from 450 kg to 550 kg per hectare, and approximately 73,000 tons
were produced in the 2009/10 growing season. Five ginning companies are active in
Zambia and 100 percent of all seed cotton is ginned in country. With no spinning
companies, however, all of the lint cotton is exported; destination countries are China,
Democratic Republic of Congo, Germany, Great Britain, Italy, Lesotho, Malawi, South
Africa, Spain, Switzerland, Tanzania and Zimbabwe.
Before liberalization of the Zambian economy, local weaving and knitting industries
operated under high protective barriers. However, since liberalization of the economy
(1991), these protective measures have been removed. As a result, low-priced imports
have flooded the country (both legal and smuggled) along with a high influx of second
hand clothing. The Zambian textile industry has been unable to compete with these
changes as the sector suffers from poor product quality, low efficiency, insufficient
variety of products and long delivery periods - much of which is the result of lack of
investment in equipment and machinery in more than a decade. Lack of public sector
support also contributed to the sector‘s demise.
Fabric and second hand clothing imports reached such levels that by the mid-1990s, of
the 140 apparel manufacturers that existed a decade earlier, only approximately 50
remained. By 2010, only 12 manufacturers remained, with none producing apparel for
casual wear, only niche products such as local ethnic clothing, school uniforms,
protective wear for mining and other professional uniforms where the manufacturers are
able to compete on service and delivery.

87
III.5.3.1 Supply Chain and Institution Support Structure: Apparel – Zambia
The supply chain for the Zambian cotton, textile and garment sector is provided in the
map below.
Figure 5: Zambia’s Cotton-to-Garment Market and Institutional Support Structure
Source: Global Development Solutions, LLC
Table 32 below provides a rough guide regarding the number of firms operating
specifically in textiles and garments (excluding leather products).
Local Market Export Market
Apparel: Apparel:
14,689,824 kg 26,917 kg
- Ministry of Agriculture and Cooperatives
- Cotton Board of Zambia - Seed Control and Certification
Institute
- Cotton Association of Zambia
- Ministry of Trade and Industry - Zambia Development Agency - Cotton Ginners Association of
Zambia - Development Bank Of Zambia - Citizens Economic Empowerment
Commission (CEEC) - Zambia Chamber of Commerce
and Industries - Manufacturers Association of
Zambia
Institutional Support Structure
Area: 146,000 ha
Output: 73,000 tons
Market Structure
Cotton Farmers
Cotton Ginning Cotton Ginners: 5
Spinners: none
Textile Mfs
Local Market
Medium/ Large
Enterprises
Garment/Apparel
Export
(100
percent)
Imported Yarn
Fabrics and
Accessories
Imported Second
Hand Clothing
Imported
Clothing
Notes: i) FDI – Foreign Direct Investment; IS – Informal Sector
ii) Dash line (- - - ) indicates a weak linkage, lack of organization, and area where
technical support is required to help strengthen linkages along the supply chain
Textile: Garment:
4 12 (med
& large)
Export Market
88
Table 32: Firm Statistics, Zambia Apparel Manufacturing
Company Size
Estimated Number
of Companies
% of Companies
by Size
Estimated Number
of Employees
Avg Employees/
Firm
Small 0 0 - -
Medium 6 50% 600 100
Large 6 50% 900 150
Total 12 100% 1500
Registration
Formal 12
Informal 0
State-owned enterprises 0
Gender
% Male 74%
% Female 26% Source: Zambia Central Statistical Office
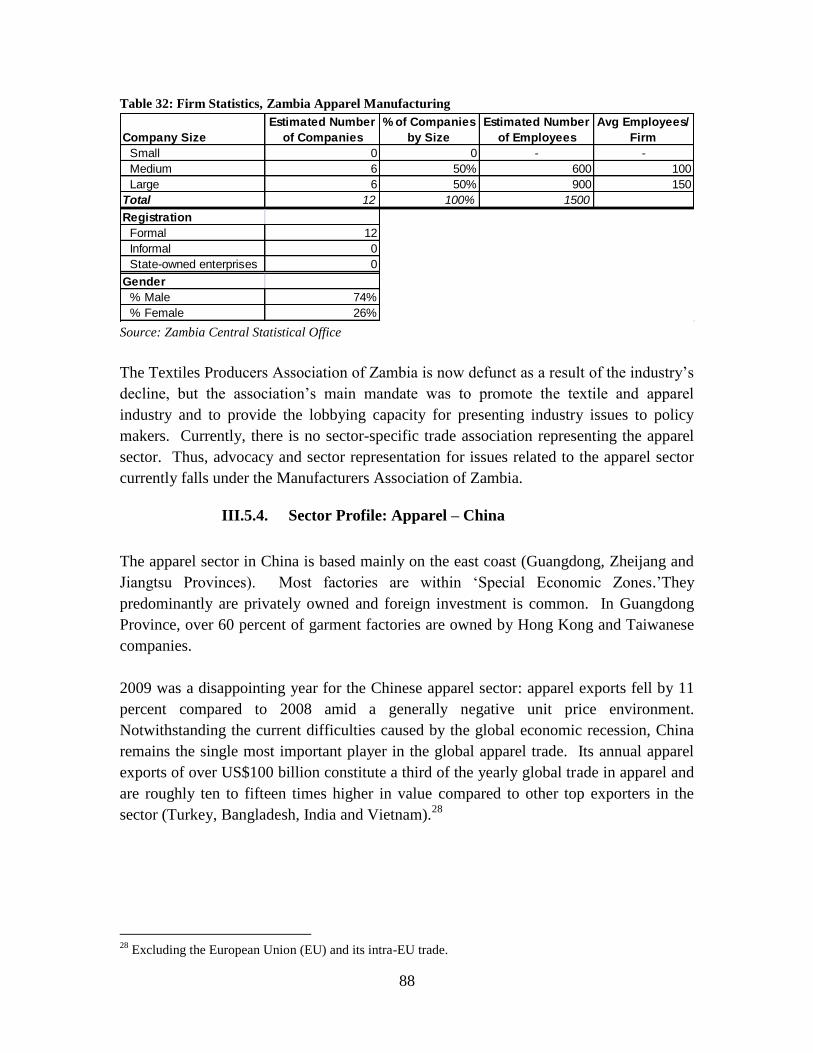
The Textiles Producers Association of Zambia is now defunct as a result of the industry‘s
decline, but the association‘s main mandate was to promote the textile and apparel
industry and to provide the lobbying capacity for presenting industry issues to policy
makers. Currently, there is no sector-specific trade association representing the apparel
sector. Thus, advocacy and sector representation for issues related to the apparel sector
currently falls under the Manufacturers Association of Zambia.
III.5.4. Sector Profile: Apparel – China
The apparel sector in China is based mainly on the east coast (Guangdong, Zheijang and
Jiangtsu Provinces). Most factories are within ‗Special Economic Zones.‘They
predominantly are privately owned and foreign investment is common. In Guangdong
Province, over 60 percent of garment factories are owned by Hong Kong and Taiwanese
companies.
2009 was a disappointing year for the Chinese apparel sector: apparel exports fell by 11
percent compared to 2008 amid a generally negative unit price environment.
Notwithstanding the current difficulties caused by the global economic recession, China
remains the single most important player in the global apparel trade. Its annual apparel
exports of over US$100 billion constitute a third of the yearly global trade in apparel and
are roughly ten to fifteen times higher in value compared to other top exporters in the
sector (Turkey, Bangladesh, India and Vietnam).28
28
Excluding the European Union (EU) and its intra-EU trade.
89
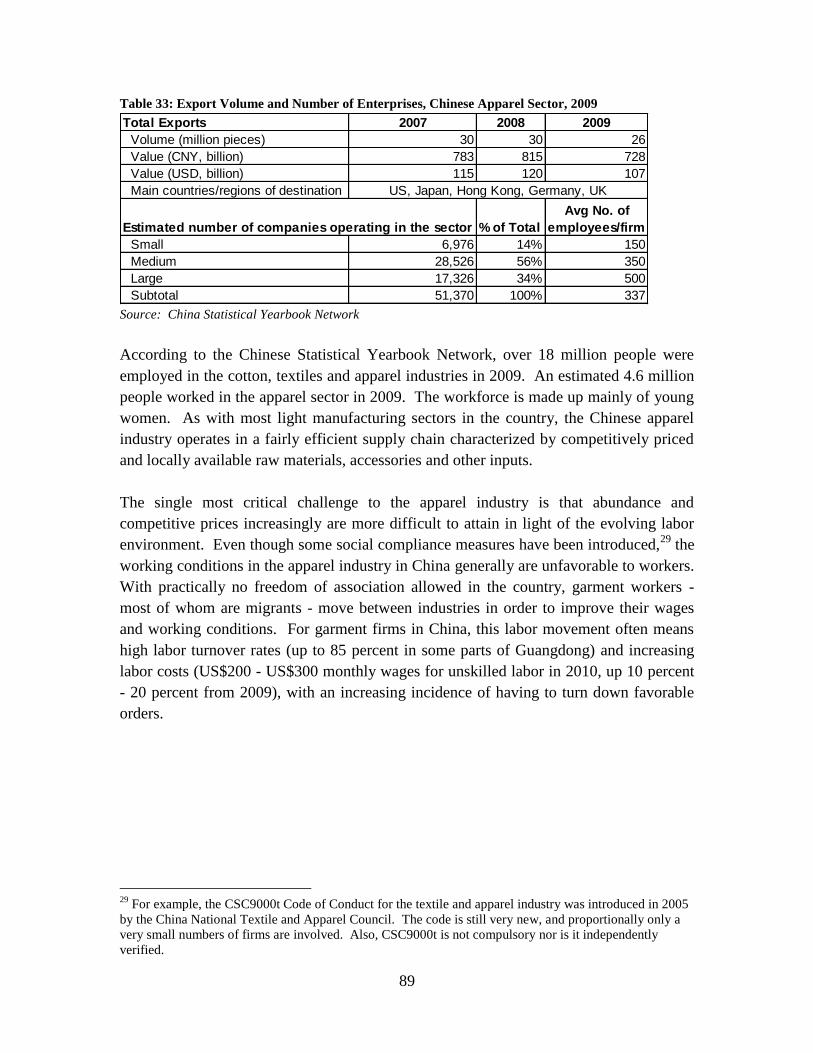
Table 33: Export Volume and Number of Enterprises, Chinese Apparel Sector, 2009
Total Exports 2007 2008 2009
Volume (million pieces) 30 30 26
Value (CNY, billion) 783 815 728
Value (USD, billion) 115 120 107
Main countries/regions of destination
Estimated number of companies operating in the sector % of Total
Avg No. of
employees/firm
Small 6,976 14% 150
Medium 28,526 56% 350
Large 17,326 34% 500
Subtotal 51,370 100% 337
US, Japan, Hong Kong, Germany, UK
Source: China Statistical Yearbook Network
According to the Chinese Statistical Yearbook Network, over 18 million people were
employed in the cotton, textiles and apparel industries in 2009. An estimated 4.6 million
people worked in the apparel sector in 2009. The workforce is made up mainly of young
women. As with most light manufacturing sectors in the country, the Chinese apparel
industry operates in a fairly efficient supply chain characterized by competitively priced
and locally available raw materials, accessories and other inputs.
The single most critical challenge to the apparel industry is that abundance and
competitive prices increasingly are more difficult to attain in light of the evolving labor
environment. Even though some social compliance measures have been introduced,29
the
working conditions in the apparel industry in China generally are unfavorable to workers.
With practically no freedom of association allowed in the country, garment workers -
most of whom are migrants - move between industries in order to improve their wages
and working conditions. For garment firms in China, this labor movement often means
high labor turnover rates (up to 85 percent in some parts of Guangdong) and increasing
labor costs (US$200 - US$300 monthly wages for unskilled labor in 2010, up 10 percent
- 20 percent from 2009), with an increasing incidence of having to turn down favorable
orders.
29
For example, the CSC9000t Code of Conduct for the textile and apparel industry was introduced in 2005
by the China National Textile and Apparel Council. The code is still very new, and proportionally only a
very small numbers of firms are involved. Also, CSC9000t is not compulsory nor is it independently
verified.

90
III.5.4.1 Supply Chain and Institution Support Structure: Apparel – China
Figure 6: Cotton-to-Garment Market and Institutional Support Structure, China
Market structure Institutional Support structure
- Ministry of Agriculture
- Ministry of Commerce
- All China Federation of Supply and Marketing
Cooperatives
- China Cotton Association
- China Cotton Research Institute
- China National Cotton Exchange
- China Cotton Spinning Association
- Provincial federations and associations
- Ministry of Commerce
- Cotton Textile Association
- Wool Textile Association
- Chemical Fibers Association
- Dyeing and Printing Association
- Knitting Industrial Association
- Nonwovens and Industrial Textile Association
- Textile Machinery and Accessories Association
- China National Textile & Apparel Council
(Textile Industry Chamber of Commerce, China
Chamber of International Commerce and Textile)
- International Trade Promotion Center
- Textile International Exchange Center
- Textile Information Center
- National Garment Association
- Fashion Color Association
- Suit Research Center
- Provincial federations and associations
i) FDI – Foreign Direct Investment Enterprises; LE – Large Enterprises; SME – Small and Medium Enterprises ii) Dashed line (- - -) indicates a week
linkage, lack of organization, and areas where technical support is required to help strengthen linkages along the supply chain * above CNY5 million annual rev.
Cotton Farmers
Cotton Ginning &
Spinning Mfs
Imported
lint cotton
Textile Mfs Garment/Apparel
FDI LE SME
Local Market Export Market
Smallholder farms: +/-10 million Medium/large scale farms: NA
Small: total 7,000-8,000
Medium: size bkdwn NA.
Large:
Textiles
Small: NA
Medium/Large:
33,000*
Garment
Small: 7,000
Medium: 29,000
Large: 18,000
Export Market:
Apparel
Local Market:
Apparel
Estimated
cloting RETAIL
value US$150
billion in 2007
FOB value
US$100 billion
Cotton-to-Garment Market and Institutional Support Structure, China
Global Development Solutions, LLC
Source: Global Development Solutions, LLC
III.5.5. Sector Profile: Apparel – Vietnam
According to Vietnam‘s General Statistics Office (GSO), the apparel industry took the
lead among Vietnam‘s exports in 2009, with a turnover of US$9.1 billion, and, in the first
seven months of 2010, exports rose a healthy 17.4 percent from the previous year to
US$5.87 billion. Currently, Vietnam‘s apparel products account for roughly 2.7 percent
of the world‘s total market share. The main importers of Vietnam‘s apparel are the US
(55 percent), the EU (20 percent) and Japan (10 percent). In the domestic market, during
the first half of 2010, garment and textile producers achieved a growth rate of 15 – 18
percent. According to the Vietnam Textile and Garment Group (Vinatex), local apparel
manufacturers reported a rise in export orders, with prices rising between 10 percent – 15
percent year-on-year amid the global economic recovery.
According to Vinatex, the apparel sector employs about 1.2 million (1,194,310) workers
divided among 3,174 officially registered small, medium and large enterprises (Table 34).

91
Table 34: Enterprises in the Apparel Sector in Vietnam (2010)
Size Category No. of Enterprises % of Total No. of Employees
Small 851 26.8% < 10
Medium 1,745 55.0% 10 – 200
Large 578 18.2% >300
Total 3,174 100%
Source: Vinatex, Interview, August 2010
Of the 3,174 enterprises, 587 (18.5 percent) are partially or wholly foreign owned
enterprises, 2,539 (80.0 percent) are Vietnamese owned non-state enterprises, and 48 (1.5
percent) are state-owned enterprises.
Amidst the impressive growth achieved by the apparel industry are also a host of
challenges that continue to threaten the competitiveness of the sector (see Figure 7
below).
Figure 7: Vietnam’s Cotton-to-Garment Processing Road Map
Source: Global Development Solutions, LLC
Vietnam ’s Cotton - to - Garment Processing Road Map
Vietnam Cotton Farm (3,000 ha/4,000tons)
Cotton Mfs. (8 factories, installed capacity:
240,000tons/year)
Cotton Industry’s Issues - Relative low price, low productivities - Abnormal weather/climate - Low technology - Lack of incentives
Ginning & Spinning Mfs (145 firms, 3,789 mil. Spindles, installed es,
capacity 350,000 tons/year)
Textile & Garment Mfs (401 weaving firms, 21,800 weaving
machines, installed capacity: 1,000 mil. m 2 ; 2 ,424 garment firms, 918,700 sewing
machines, installed capacity 2,400 mil. units)
Upstream
Downstream
Princ ipal problems of textile & garment ind. - Low added value - High dependent on imported inputs - Low domestic market shares - Lack of domestic designers, brand names,
distributors - Labor shortage - Lack of marketing and management skills - High processing ratio in expor t
92
The biggest hurdle to maintain competitiveness in the world market is Vietnam‘s high
dependence on imported inputs. Currently, it is estimated that 80 – 95 percent of the
production relies on imported material (primarily from China, Taiwan and Korea). For
example, during the first seven months of 2010, the sector imported US$3.18 billion
worth of cloth (up 34.3 percent from the previous year), US$1.47 billion worth of apparel
and footwear materials and accessories (up 35.4 percent from the previous year), US$620
million worth of fiber (up 47.5 percent) and US$362 million worth of cotton (up 98
percent). With respect to cotton, global prices more than doubled in 2010, placing even
more downward pressure on profits for the apparel sector in Vietnam.
The second challenge faced by the sector is the slow transformation of the sector from
CMT (cut, make and trim) to ODM (original design manufacturing). However, in order
to realize a fully integrated value chain from the production of cotton to finished fabric,
vast amounts of investments, technical know-how and technology is still required. With
this noted, however, Vinatex recently has invested VND15.3 billion (or US$0.8 billion)
in the production of fiber, cotton and dye, but growth in the sector far outpaced the level
of investments made by both state and private enterprises along the entire value chain.
The third challenge faced by the sector is the shortage of skilled and semi-skilled labor.
Even with a starting salary at VND 2 – 3.5 million (US$104 – US$181) per month,
enterprises have a difficult time hiring workers, particularly in urban and peri-urban areas
where factories currently are located. The Government is encouraging the relocation of
factories to rural areas through the development of specialized processing zones, but
according to Vinatex, the labor shortage is likely to exceed 10 percent in 2010. As such,
the apparel sector in Vietnam is basically low value-added production.
93
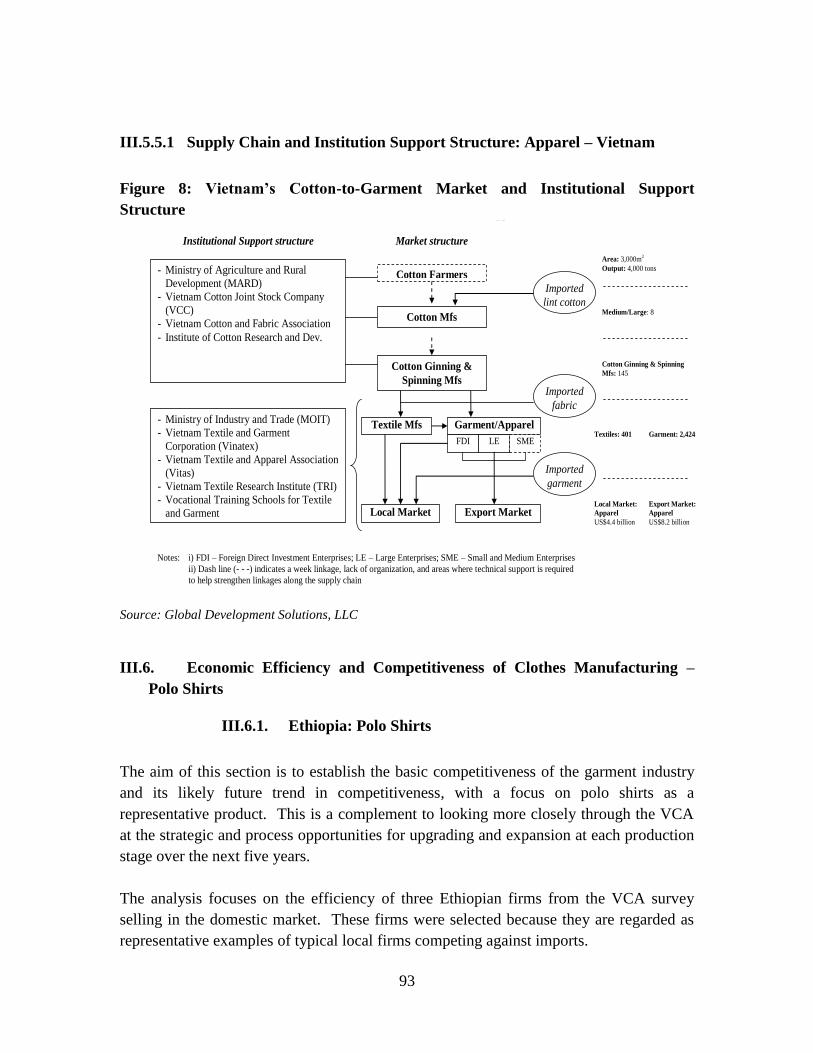
III.5.5.1 Supply Chain and Institution Support Structure: Apparel – Vietnam
Figure 8: Vietnam’s Cotton-to-Garment Market and Institutional Support
Structure Vietnam’s Cotton-to-Garment Market and Institutional Support Structure
Market structure Institutional Support structure
Cotton Farmers - Ministry of Agriculture and Rural
Development (MARD)
- Vietnam Cotton Joint Stock Company
(VCC)
- Vietnam Cotton and Fabric Association
- Institute of Cotton Research and Dev.
Cotton Ginning &
Spinning Mfs
Imported
lint cotton
Textile Mfs
Imported
fabric
Garment/Apparel
FDI LE SME
Local Market Export Market
Imported
garment
- Ministry of Industry and Trade (MOIT)
- Vietnam Textile and Garment
Corporation (Vinatex)
- Vietnam Textile and Apparel Association
(Vitas)
- Vietnam Textile Research Institute (TRI)
- Vocational Training Schools for Textile
and Garment
Notes: i) FDI – Foreign Direct Investment Enterprises; LE – Large Enterprises; SME – Small and Medium Enterprises
ii) Dash line (- - -) indicates a week linkage, lack of organization, and areas where technical support is required
to help strengthen linkages along the supply chain
Area: 3,000m2
Output: 4,000 tons
Medium/Large: 8
Textiles: 401 Garment: 2,424
Export Market:
Apparel
US$8.2 billion
Local Market:
Apparel
US$4.4 billion
Cotton Mfs
Cotton Ginning & Spinning
Mfs: 145
Source: Global Development Solutions, LLC
III.6. Economic Efficiency and Competitiveness of Clothes Manufacturing –
Polo Shirts
III.6.1. Ethiopia: Polo Shirts
The aim of this section is to establish the basic competitiveness of the garment industry
and its likely future trend in competitiveness, with a focus on polo shirts as a
representative product. This is a complement to looking more closely through the VCA
at the strategic and process opportunities for upgrading and expansion at each production
stage over the next five years.
The analysis focuses on the efficiency of three Ethiopian firms from the VCA survey
selling in the domestic market. These firms were selected because they are regarded as
representative examples of typical local firms competing against imports.
94
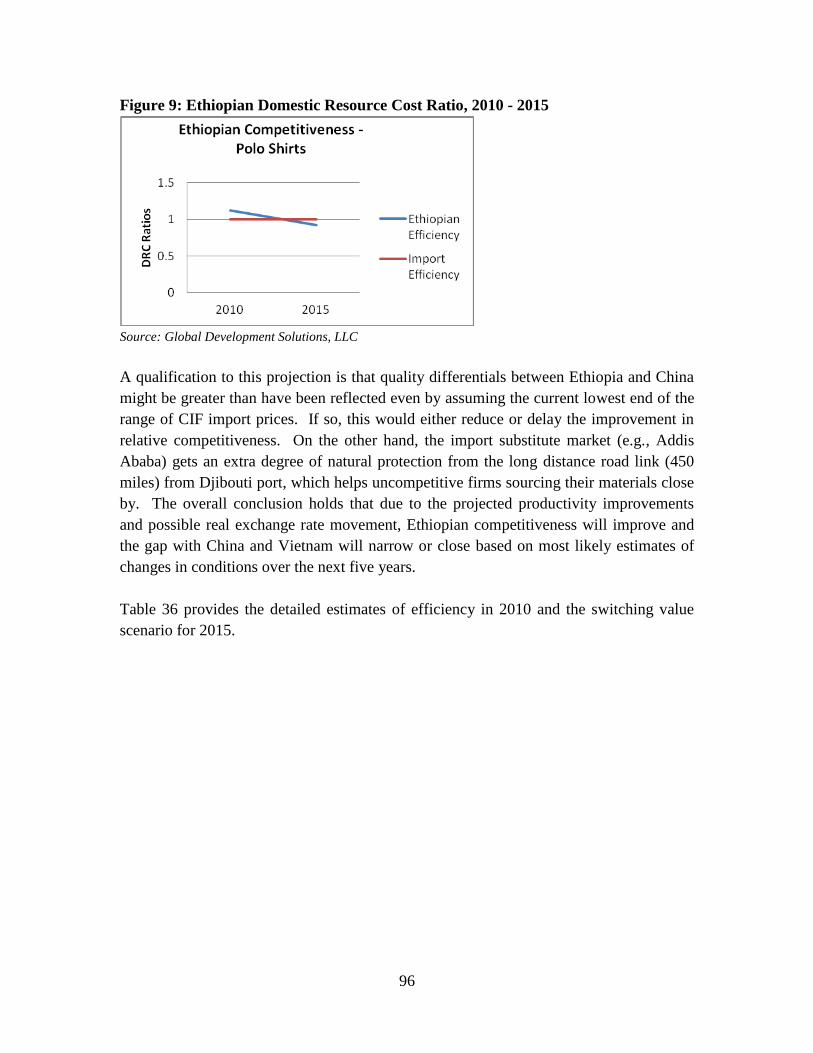
For the analysis, a composite firm was created by taking a weighted average of the
economic production cost of the three firms (as defined above). This cost is compared
with the cost of competing imports, which is reported as being in the range of US$2.95-
US$3.25 per piece, with China likely to be the marginal import supplier. Given the
problem of quality comparability, the low end of this range, i.e., US$2.95 per piece, is
taken as the applicable cost of the import alternative. It also is assumed that the internal
transport cost of moving domestic goods from the wholesale stage to the consumption
point is the same as for imports.
Economic production costs are derived according to the following procedures:
An annual capital charge is obtained by multiplying the estimated replacement
cost of assets by a capital recovery factor (ten-year asset life, 12 percent interest
rate).
All import tariffs on imported inputs and indirect taxes (VAT) are deducted where
these can be identified.
Costs (capital cost, electricity, water/fuel, administration) that do not apply
specifically to the production of the primary output (polo shirts) are allocated on
the basis of the reported share of polo shirts in total output.
Utility costs of electricity, water and fuel are small components of total cost and
have been adjusted only on the basis of their indirect foreign exchange effect.
Table 35 shows the results of the Domestic Resource Cost (DRC) efficiency calculation
for the base year and for five years ahead (in 2015). The projections used and the DRC
methodology are described in more detail in the Annex.
The key projections assumptions used here and reflected in Table 35 are:
A 5 percent Ethiopian productivity growth over 2010 levels by 2015. This is an
overall productivity increase in the sense of extra output for a given set of total
inputs and is based on a review of the differentials in absenteeism, reject rates and
material wastage rates in polo shirt production between Ethiopia, China and
Vietnam as shown in the VCA section.
A real appreciation of both the RMB and the Dong. Since the precise value of a
future appreciation of these currencies is uncertain, the ‗switching value‘ of the
currencies (at which Ethiopian production becomes competitive) is calculated and
compared with plausible future real exchange rates of these currencies.

95
Table 35: Competitiveness Switch Table, Ethiopia
Year 2010 2015 2015 2015
Assumptions Base Year
5 percent productivity
increase;
Switching value 6.5 percent
real RMB appreciation
5 percent
productivity
increase;
Constant RMB
5 percent
productivity
increase;
16 percent real
RMB appreciation
DRC Ratio 1.12 1.0 1.06 0.92
Level of
Competitiveness INEFFICIENT
MARGINALLY
EFFICIENT INEFFICIENT EFFICIENT
Source: Global Development Solutions, LLC
Based on the VCA, the current economic cost of production of polo shirts (i.e., after
deducting all taxes and duties and valuing all traded cost and revenue items at border
equivalent prices) is 12 percent higher than the cost of equivalent imports. (That is, the
cost of saving foreign exchange through local production is 12 percent above the market
exchange rate in 2010 prices). However, if Ethiopia can achieve an overall productivity
increase of 5 percent by 2015, it requires only a 6.5 percent real exchange rate
appreciation of the RMB for the position to switch to a competitive one vis-à-vis China.
This analysis is conservative in that it assumes that both the value of competing imported
products and of imported inputs used in Ethiopian production of polo shirts increase as a
result of the real appreciation (so implicitly all imported inputs are assumed to come from
China).
A 6.5 percent real appreciation of the RMB over the years from 2010 to 2015 is relatively
modest in comparison with the projections based on the range of World Bank estimates
discussed in Chapter I. At the upper end of the range projected for the real value of the
RMB in 2015, Ethiopian production cost would be 8 percent below that of China. Based
on the latter, the switch, vis-à-vis China as the main import source, can be denoted in
Figure 9 where the Ethiopian domestic resource cost ratio falls below the benchmark
import supplier‘s cost ratio during the five-year period.
96
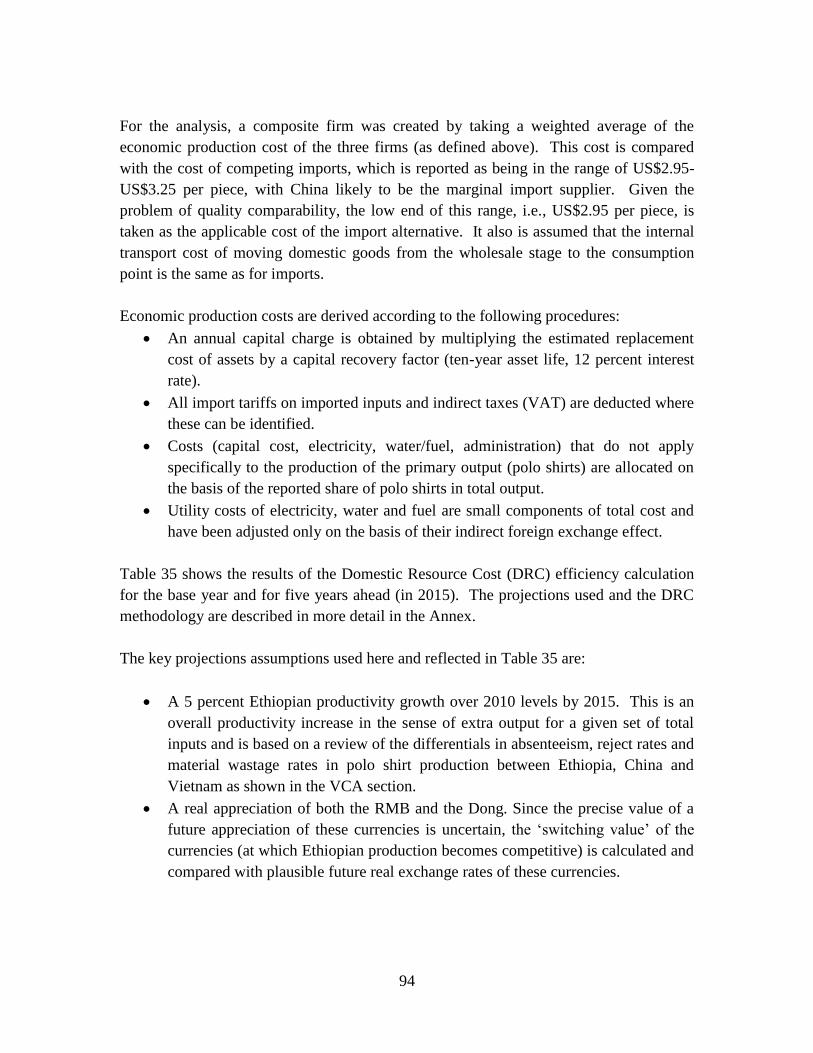
Figure 9: Ethiopian Domestic Resource Cost Ratio, 2010 - 2015
Source: Global Development Solutions, LLC
A qualification to this projection is that quality differentials between Ethiopia and China
might be greater than have been reflected even by assuming the current lowest end of the
range of CIF import prices. If so, this would either reduce or delay the improvement in
relative competitiveness. On the other hand, the import substitute market (e.g., Addis
Ababa) gets an extra degree of natural protection from the long distance road link (450
miles) from Djibouti port, which helps uncompetitive firms sourcing their materials close
by. The overall conclusion holds that due to the projected productivity improvements
and possible real exchange rate movement, Ethiopian competitiveness will improve and
the gap with China and Vietnam will narrow or close based on most likely estimates of
changes in conditions over the next five years.
Table 36 provides the detailed estimates of efficiency in 2010 and the switching value
scenario for 2015.
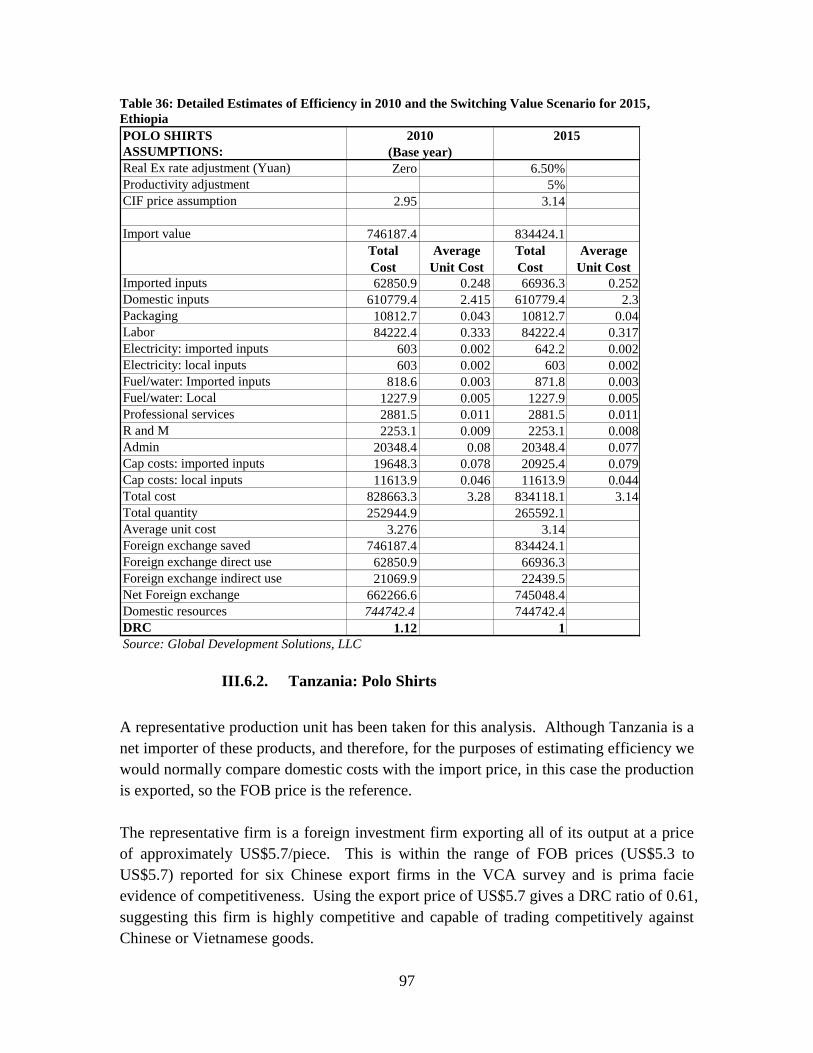
97
Table 36: Detailed Estimates of Efficiency in 2010 and the Switching Value Scenario for 2015,
Ethiopia
POLO SHIRTS
ASSUMPTIONS:
Real Ex rate adjustment (Yuan) Zero 6.50%
Productivity adjustment 5%
CIF price assumption 2.95 3.14
Import value 746187.4 834424.1
Total
Cost
Average
Unit Cost
Total
Cost
Average
Unit Cost
Imported inputs 62850.9 0.248 66936.3 0.252
Domestic inputs 610779.4 2.415 610779.4 2.3
Packaging 10812.7 0.043 10812.7 0.04
Labor 84222.4 0.333 84222.4 0.317
Electricity: imported inputs 603 0.002 642.2 0.002
Electricity: local inputs 603 0.002 603 0.002
Fuel/water: Imported inputs 818.6 0.003 871.8 0.003
Fuel/water: Local 1227.9 0.005 1227.9 0.005
Professional services 2881.5 0.011 2881.5 0.011
R and M 2253.1 0.009 2253.1 0.008
Admin 20348.4 0.08 20348.4 0.077
Cap costs: imported inputs 19648.3 0.078 20925.4 0.079
Cap costs: local inputs 11613.9 0.046 11613.9 0.044
Total cost 828663.3 3.28 834118.1 3.14
Total quantity 252944.9 265592.1
Average unit cost 3.276 3.14
Foreign exchange saved 746187.4 834424.1
Foreign exchange direct use 62850.9 66936.3
Foreign exchange indirect use 21069.9 22439.5
Net Foreign exchange 662266.6 745048.4
Domestic resources 744742.4 744742.4
DRC 1.12 1
Source: Global Development Solutions, LLC
2010
(Base year)
2015
III.6.2. Tanzania: Polo Shirts
A representative production unit has been taken for this analysis. Although Tanzania is a
net importer of these products, and therefore, for the purposes of estimating efficiency we
would normally compare domestic costs with the import price, in this case the production
is exported, so the FOB price is the reference.
The representative firm is a foreign investment firm exporting all of its output at a price
of approximately US$5.7/piece. This is within the range of FOB prices (US$5.3 to
US$5.7) reported for six Chinese export firms in the VCA survey and is prima facie
evidence of competitiveness. Using the export price of US$5.7 gives a DRC ratio of 0.61,
suggesting this firm is highly competitive and capable of trading competitively against
Chinese or Vietnamese goods.

98
Average unit economic cost is calculated according to the following procedures. The
firm-level financial data from the VCA survey are adjusted as follows:
Import tariffs are removed from the value of imported inputs
VAT is removed is removed from the value of domestic items
An annual capital charge is estimated based on the application of a capital
recovery factor for 12 percent over 10 years to the replacement value of assets
To allow for indirect foreign exchange content, it is assumed that 80 percent of
fuel and electricity cost is for foreign exchange30
Import duties on fabric will vary with its origin - it is assumed that all fabric
qualifies for the 5 percent preferential duty but that it is subject to VAT at the
standard rate of 18 percent.
With these assumptions, average economic cost is US$4.5/piece, of which US$2 is the
cost of imported fabric.
30
This is only an assumption, but given the relatively small share of fuel in total cost, the results are not
sensitive to this assumption.
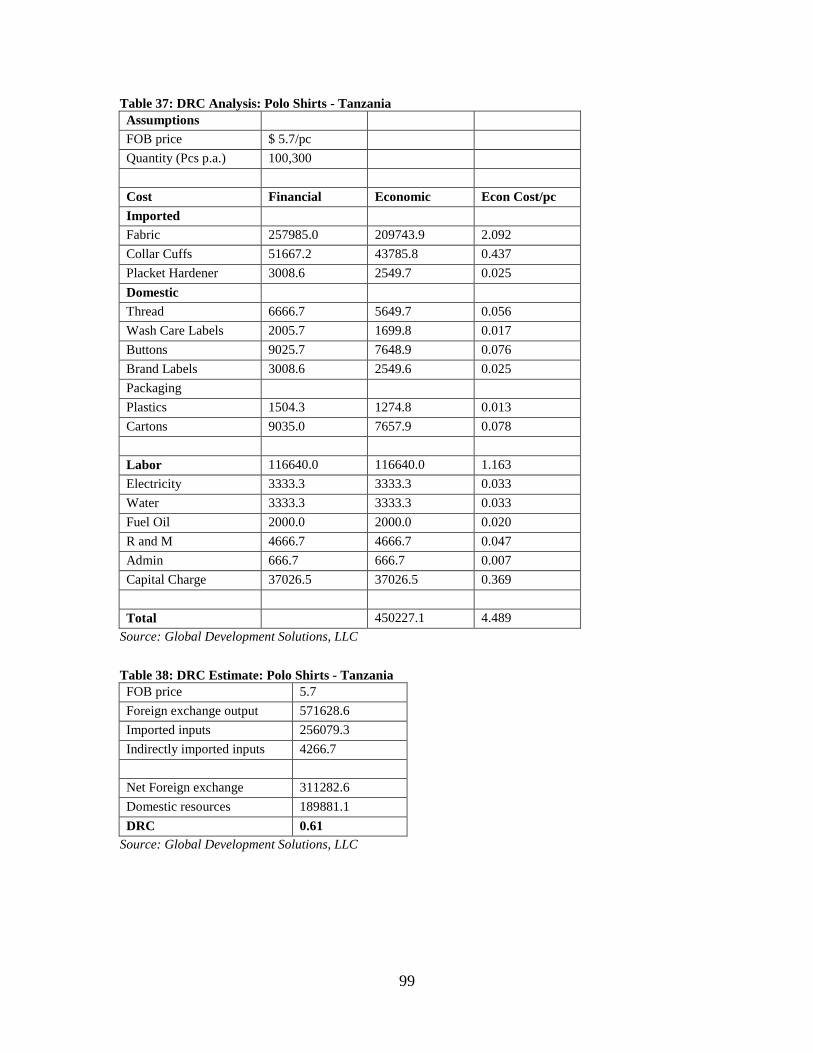
99
Table 37: DRC Analysis: Polo Shirts - Tanzania
Assumptions
FOB price $ 5.7/pc
Quantity (Pcs p.a.) 100,300
Cost Financial Economic Econ Cost/pc
Imported
Fabric 257985.0 209743.9 2.092
Collar Cuffs 51667.2 43785.8 0.437
Placket Hardener 3008.6 2549.7 0.025
Domestic
Thread 6666.7 5649.7 0.056
Wash Care Labels 2005.7 1699.8 0.017
Buttons 9025.7 7648.9 0.076
Brand Labels 3008.6 2549.6 0.025
Packaging
Plastics 1504.3 1274.8 0.013
Cartons 9035.0 7657.9 0.078
Labor 116640.0 116640.0 1.163
Electricity 3333.3 3333.3 0.033
Water 3333.3 3333.3 0.033
Fuel Oil 2000.0 2000.0 0.020
R and M 4666.7 4666.7 0.047
Admin 666.7 666.7 0.007
Capital Charge 37026.5 37026.5 0.369
Total 450227.1 4.489
Source: Global Development Solutions, LLC
Table 38: DRC Estimate: Polo Shirts - Tanzania
FOB price 5.7
Foreign exchange output 571628.6
Imported inputs 256079.3
Indirectly imported inputs 4266.7
Net Foreign exchange 311282.6
Domestic resources 189881.1
DRC 0.61
Source: Global Development Solutions, LLC
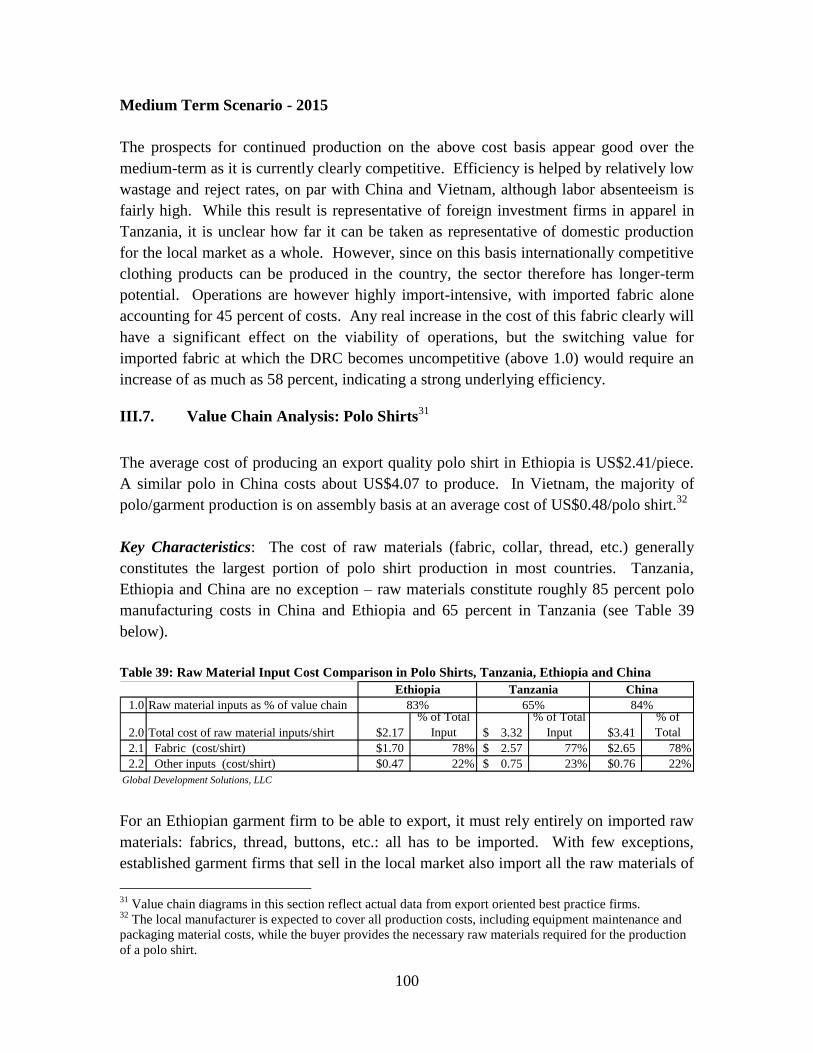
100
Medium Term Scenario - 2015
The prospects for continued production on the above cost basis appear good over the
medium-term as it is currently clearly competitive. Efficiency is helped by relatively low
wastage and reject rates, on par with China and Vietnam, although labor absenteeism is
fairly high. While this result is representative of foreign investment firms in apparel in
Tanzania, it is unclear how far it can be taken as representative of domestic production
for the local market as a whole. However, since on this basis internationally competitive
clothing products can be produced in the country, the sector therefore has longer-term
potential. Operations are however highly import-intensive, with imported fabric alone
accounting for 45 percent of costs. Any real increase in the cost of this fabric clearly will
have a significant effect on the viability of operations, but the switching value for
imported fabric at which the DRC becomes uncompetitive (above 1.0) would require an
increase of as much as 58 percent, indicating a strong underlying efficiency.
III.7. Value Chain Analysis: Polo Shirts31
The average cost of producing an export quality polo shirt in Ethiopia is US$2.41/piece.
A similar polo in China costs about US$4.07 to produce. In Vietnam, the majority of
polo/garment production is on assembly basis at an average cost of US$0.48/polo shirt.32
Key Characteristics: The cost of raw materials (fabric, collar, thread, etc.) generally
constitutes the largest portion of polo shirt production in most countries. Tanzania,
Ethiopia and China are no exception – raw materials constitute roughly 85 percent polo
manufacturing costs in China and Ethiopia and 65 percent in Tanzania (see Table 39
below).
Table 39: Raw Material Input Cost Comparison in Polo Shirts, Tanzania, Ethiopia and China Raw Material Input Cost Comparison in Polo Shirts - Ethiopia, Tanzania and China
1.0 Raw material inputs as % of value chain
2.0 Total cost of raw material inputs/shirt $2.17
% of Total
Input 3.32$
% of Total
Input $3.41
% of
Total
2.1 Fabric (cost/shirt) $1.70 78% 2.57$ 77% $2.65 78%
2.2 Other inputs (cost/shirt) $0.47 22% 0.75$ 23% $0.76 22%
Global Development Solutions, LLC
Ethiopia China
83% 84%
Tanzania
65%
For an Ethiopian garment firm to be able to export, it must rely entirely on imported raw
materials: fabrics, thread, buttons, etc.: all has to be imported. With few exceptions,
established garment firms that sell in the local market also import all the raw materials of
31
Value chain diagrams in this section reflect actual data from export oriented best practice firms. 32
The local manufacturer is expected to cover all production costs, including equipment maintenance and
packaging material costs, while the buyer provides the necessary raw materials required for the production
of a polo shirt.
101
varying quality as the local textiles and accessories industry either do not produce such
materials at all or produce them at poor quality and uncompetitive prices. For example,
Ethiopian firms can source locally produced polo fabric at US$6.00 - US$7.00/kg. This
fabric is neither good enough (more than three holes per kg of material) nor cheap
enough to enable manufacturers to compete in the foreign and local markets; most
companies therefore import their fabrics and other raw materials. Depending on the
segment in which they operate, firms in Ethiopia can import fabrics for as little as
US$3.00/kg (those selling in local market) and higher quality Italian or Chinese fabric at
US$6.60/kg.
In Tanzania, garment exporters also cannot rely on the quality of locally available fabric.
First, there is only one domestic supplier of knit fabrics. Second, fabric quality is poor.
The shrinkage rate of local knit fabrics averages 9.5 percent, compared to a more normal
rate of 5 percent for fabric used for export-grade garments. This suggests that Tanzanian
fabrics are not finished properly – in general, higher shrinkage rates are indicative of over
utilization of starch and under utilization of chemicals during finishing. Also, the local
fabric supplier offers a limited range of fabric width from which to choose compared to
imported fabric that can be ordered in many different width variations depending on
order/design/client needs. Although the local knit fabric is generally cheaper (US$7-
US$8 per kilogram) and transport to the factory (US$0.04/kg), Tanzania garment
producers purchase fabrics exclusively from abroad when assembling polo shirts to fill
export orders. Typically, Tanzanian garment exporters order fabrics from Mauritius,
Egypt, or from European countries at prices ranging from US$8.7 to US$9.2 per kilogram
with transport costs between US$1.3 - US$2 per kilogram depending on order size and
means of transport.
The inability of the local textile industry in Ethiopia and Tanzania to supply materials at
competitive prices and quality is, therefore, one of the key impediments in their
respective garment industries. Reliance on imports is necessary for local garment firms
but this weakens their supply chain in many aspects, including a critical one: time-to-
delivery. It takes Chinese firms approximately 30 - 45 days to complete an order. In
Tanzania it takes approximately 65 days to complete an order. Selection of proper
fabrics and other inputs, matching color/texture/design features, takes time to import.
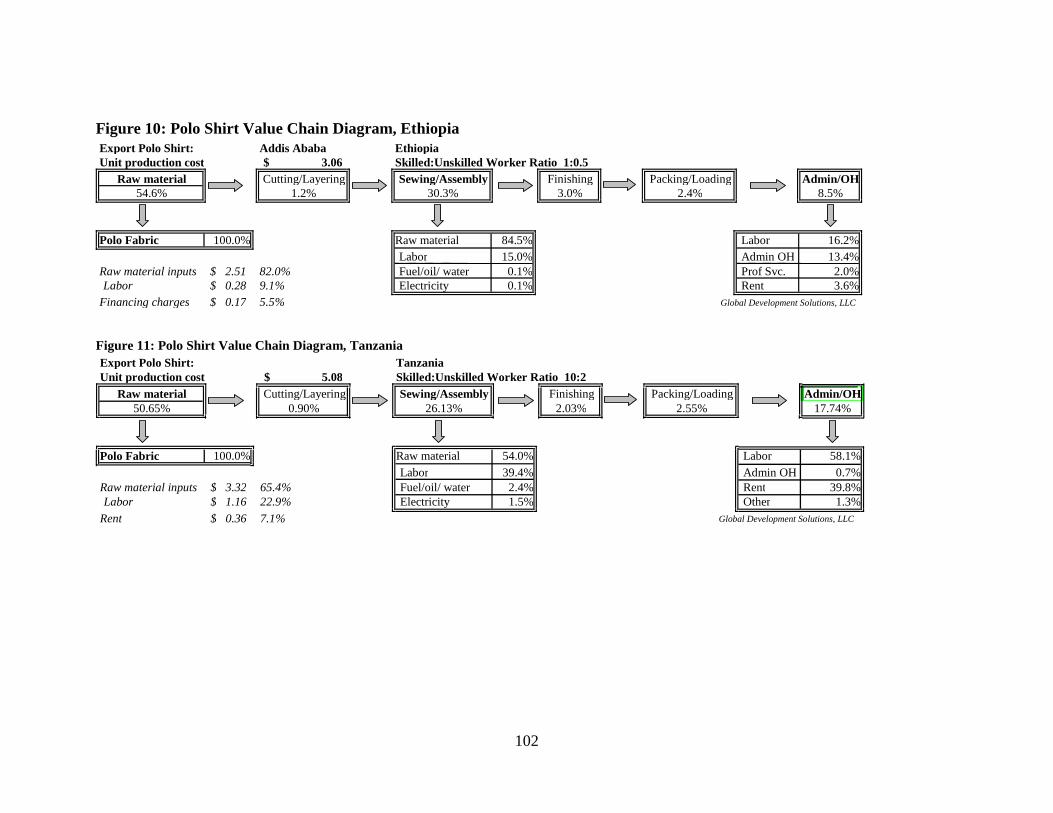
102
Figure 10: Polo Shirt Value Chain Diagram, Ethiopia
Figure 11: Polo Shirt Value Chain Diagram, Tanzania
Export Polo Shirt: Tanzania Unit production cost 5.08 $ Skilled:Unskilled Worker Ratio 10:2
Raw material Cutting/Layering Sewing/Assembly Finishing Packing/Loading Admin/OH 50.65% 0.90% 26.13% 2.03% 2.55% 17.74%
Polo Fabric 100.0% Raw material 54.0% Labor 58.1% Labor 39.4% Admin OH 0.7%
Raw material inputs 3.32 $ 65.4% Fuel/oil/ water 2.4% Rent 39.8% Labor 1.16 $ 22.9% Electricity 1.5% Other 1.3%
Rent 0.36 $ 7.1% Global Development Solutions, LLC
Export Polo Shirt: Addis Ababa Ethiopia Unit production cost 3.06 $ Skilled:Unskilled Worker Ratio 1:0.5
Raw material Cutting/Layering Sewing/Assembly Finishing Packing/Loading Admin/OH 54.6% 1.2% 30.3% 3.0% 2.4% 8.5%
Polo Fabric 100.0% Raw material 84.5% Labor 16.2% Labor 15.0% Admin OH 13.4%
Raw material inputs 2.51 $ 82.0% Fuel/oil/ water 0.1% Prof Svc. 2.0% Labor 0.28 $ 9.1% Electricity 0.1% Rent 3.6%
Financing charges 0.17 $ 5.5% Global Development Solutions, LLC

103
Figure 12: Polo Shirt Value Chain Diagram, China
Figure 13: Polo Shirt Value Chain Diagram, Vietnam
Export Polo Shirt: Hai Duong Vietnam Unit production cost 0.39 $ Skilled:Unskilled Worker Ratio 1:0.3
Raw material Cutting/Layering Sewing/Assembly Finishing Packing/Loading Admin/OH 0.0% 6.9% 39.6% 19.3% 21.1% 13.1%
Labor 0.31 $ 80.1% Labor 80.9% Labor 95.7% Labor 64.7% Other 0.08 $ 19.9% Fuel/oil/ water 0.8% Fuel/oil/ water 1.4% Fuel/oil/ water 11.2%
Electricity 2.9% Electricity 0.5% R & M 1.0% Global Development Solutions, LLC R & M 7.1% R & M 2.1% Packing material 22.2%
Export Polo Shirt Guangdong China Unit production cost 3.93 $ Skilled:Unskilled Worker Ratio 1:10
Raw material Cutting/Layering Sewing/Assembly Finishing/Washing Packing/Loading Admin/OH 62.2% 2.0% 25.4% 4.8% 2.5% 3.2%
Polo Fabric 100.0% Raw material 79.4% Raw material 2.6% Raw Material Inputs 3.24 $ 84.9% Labor 18.6% Labor 81.1% Labor 0.41 $ 10.8% Electricity 0.6% Electricity 7.2% Packing Materials 0.06 $ 1.5% R & M 1.2% R & M 9.1% Global Development Solutions, LLC

104
In Vietnam, availability of good quality and competitively priced fabric and other raw
materials is also limited, particularly given that the CMT market using imported materials
developed quickly without a parallel growth in the textile sector. With few exceptions,
textile producers in Vietnam, as is the case in Ethiopia, generally are not able to satisfy
quantity, quality or timely delivery standards of international buyers. Unlike Ethiopia,
however, Vietnam has been able to attract and encourage foreign firms to invest in and/or
source garments from Vietnam. Relatively low, albeit increasing, wages and a relatively
developed and business-friendly infrastructure have made Vietnam a location of choice
for many Korean, Taiwanese and other firms to source garments on CMT basis using
imported material.
While the CMT production modality generally is considered to be suboptimal among
Vietnamese policy makers, it has served Vietnam well particularly in the context of
employment creation, for developing a skilled and semi-skilled labor force and for
contributing to the economic growth of the country. For one, the CMT basis provides
Vietnamese garment producers opportunities to strengthen operational and management
capacity without committing scarce resources and taking risks.
The VCA suggests that polo CMT costs in Ethiopia can be competitive relative to
Tanzania, Vietnam and China (see Table 40 below). However, like Vietnam, in Ethiopia
the absence of a strong and efficient domestic textiles and accessories supply chain,
expansion of export production will not necessarily result in an increased domestic
content ratio and/or value addition. In Tanzania, CMT costs are highly uncompetitive
mainly due to high fixed operating costs such as the cost of rent in export processing
zones and extensive reliance on expatriate labor (typically from Kenya, Malaysia, etc.)
for factory floor management and other upper management positions.
Table 40: Comparative Polo Shirt CMT Costs
China Vietnam Ethiopia Tanzania
$0.33 - $0.71 $0.39 - $0.55 $0.23 - $0.55 $0.82 - $1.75
Comparative CMT Costs
Source: Global Development Solutions, LLC
III.7.1. Benchmarking Key Variables
In addition to the weak local raw material supply chains, the value chain analyses
identified a number of other key factors impacting the competitiveness of garment
manufacturing sector in general and the production of polo shirts in particular in Ethiopia
and Tanzania.

105
First, African garment producers have low polo shirt labor productivities. Specifically,
Ethiopian producers manufacture, on average, 11 polo shirts per worker per day;
Tanzanian producers manufacture, on average, 12 polo shirts per worker per day.33
Compared to Chinese workers, these productivity rates are low: in Guangzhou, garment
manufacturers produce, on average, 25 polo shirts per day.
Table 41: Benchmarking Key Variables for the Production of Polo Shirts Benchmarking Data Sheet: Polo Shirts China Vietnam Ethiopia Tanzania
1.0 Avg Spoilage & Reject rate: List different types (3)
1.1 In-factory product rejection 2% - 3% 1% - 3% 2% - 5% 1% - 3%
1.2 Product rejection by client 0% 0% - 1% 1% - 3% 0%
2.0 Avg Waste & losses: List different types (% of total )
2.1 Production waste - scrap (fabric-to-polo, weight) 5% - 10% 1% - 7% 10% - 11% 3% - 10%
2.2 Losses (theft) 0% 0% 0%
3.0 Electricity
3.1 On grid (Cost/kWh) 0.13$ 0.07$ $0.05 - $0.06 $0.14
3.2 Off grid (Cost/kWh) - self generated -$ $0.10 $0.07 $0.22
3.3 % of time off grid/month 0% - 10% 7% - 10% 10% - 16.7% 20% - 30%
4.0 Water ($/m³) $0.59 - $0.61 $0.31 - $0.45 0.06$ 0.06$
5.0 Fuel & Oil ($/liter) $0.87 - $0.96 $0.36 - $0.87 $0.89 - $0.93 $0.89 - $0.93
6.0 PRODUCTIVITY & EFFICIENCY
6.1 Range - Labor productivity (polos) : Pieces/employee/day 18 - 35 8-14 7-19 5 - 20
6.2 Average - Labor productivity (polos) : Pieces/employee/day 25 12 11 12
6.3 Electricity usage: On-grid (kWh/1,000 pieces) 49 - 196 132 - 344 40 - 98 120 - 140
6.4 Electricity usage ($/1,000 pieces) $6 - $24 $8 - $25 $2 - $6 $15 - $25
6.5 Water usage (m³/1,000 pieces) 3 - 14 3 - 15 16 - 37 18 - 20
6.6 Water usage ($/1,000 pieces) $2 - $8 $1 - $7 $1 - $2 $1 - $2
6.7 Fuel & oil usage (liters/1,000 pieces) 0.5 - 5 1-13 1-13 10 - 12
6.8 Fuel & oil usage ($/1,000 pieces) $1 - $5 $1 - $13 $0.73 - $12.28 $10 - $12
6.9 Transport ($/km-ton) $0.27 - $0.30 $0.12 - $0.25 $0.03 - $0.19 $0.04 - $0.06
* Cost reflects assembly costs only
High reject
rate
High scrap
rate
Poor quality
of electricity
Lowest labor
productivity
High electricity
price
Source: Global Development Solutions, LLC
This productivity gap reduces the labor/wage cost differential that Ethiopian firms may
enjoy compared to Chinese firms. When one considers the relatively high reject rates,
waste and high absenteeism in Ethiopia (up to 12 percent), Ethiopian firms in effect lose
most of their labor cost advantages to China as a result of these inefficiencies. Some of
these inefficiencies stem from the generally poor socioeconomic environment in Ethiopia,
including high HIV prevalence, which cannot entirely be attributed to firms‘ poor
management. At the same time, the VCA suggest that Ethiopian garment manufacturers
exhibit poor capacity utilization and management skills. For example, when measured in
terms of output per machinist, Ethiopian workers can sew more than 20 polo shirts per
day, although they are the least paid workers out of the three countries in this analysis.
Given the high absenteeism rate, 10 percent or more of the workers in Ethiopian garment
firms may not show up for work in any given day. Also, capacity utilization is low. As a
consequence, the worker-to-machine ratio in Ethiopian factories may be as high as 3:1 as
opposed to China where the ratio is generally around 1.25:1.
In Tanzania, the value chain analysis suggests that even though they are not on par with
Chinese factories, indicators such as waste, reject rates and labor productivity are better
33
Micro and small enterprises selling in the local market report making as few as 5 polos per person per
day. Best practice exporting firms report making 20 polos per person per day for single style large orders.
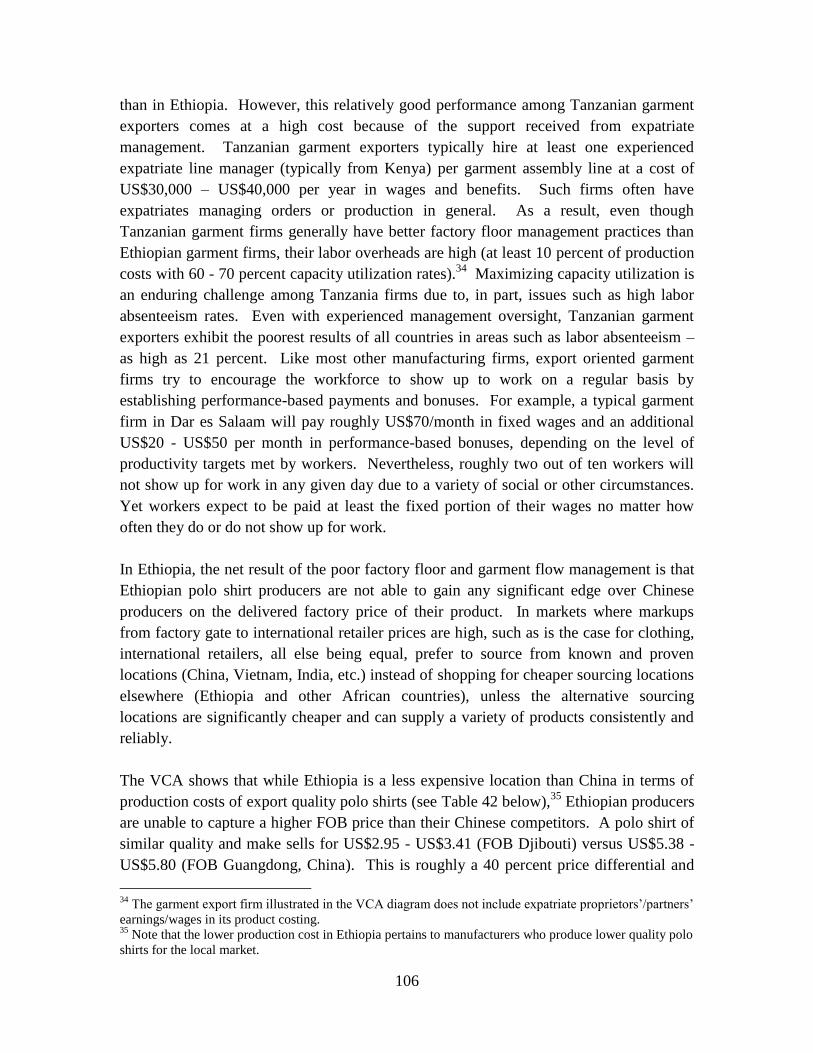
106
than in Ethiopia. However, this relatively good performance among Tanzanian garment
exporters comes at a high cost because of the support received from expatriate
management. Tanzanian garment exporters typically hire at least one experienced
expatriate line manager (typically from Kenya) per garment assembly line at a cost of
US$30,000 – US$40,000 per year in wages and benefits. Such firms often have
expatriates managing orders or production in general. As a result, even though
Tanzanian garment firms generally have better factory floor management practices than
Ethiopian garment firms, their labor overheads are high (at least 10 percent of production
costs with 60 - 70 percent capacity utilization rates).34
Maximizing capacity utilization is
an enduring challenge among Tanzania firms due to, in part, issues such as high labor
absenteeism rates. Even with experienced management oversight, Tanzanian garment
exporters exhibit the poorest results of all countries in areas such as labor absenteeism –
as high as 21 percent. Like most other manufacturing firms, export oriented garment
firms try to encourage the workforce to show up to work on a regular basis by
establishing performance-based payments and bonuses. For example, a typical garment
firm in Dar es Salaam will pay roughly US$70/month in fixed wages and an additional
US$20 - US$50 per month in performance-based bonuses, depending on the level of
productivity targets met by workers. Nevertheless, roughly two out of ten workers will
not show up for work in any given day due to a variety of social or other circumstances.
Yet workers expect to be paid at least the fixed portion of their wages no matter how
often they do or do not show up for work.
In Ethiopia, the net result of the poor factory floor and garment flow management is that
Ethiopian polo shirt producers are not able to gain any significant edge over Chinese
producers on the delivered factory price of their product. In markets where markups
from factory gate to international retailer prices are high, such as is the case for clothing,
international retailers, all else being equal, prefer to source from known and proven
locations (China, Vietnam, India, etc.) instead of shopping for cheaper sourcing locations
elsewhere (Ethiopia and other African countries), unless the alternative sourcing
locations are significantly cheaper and can supply a variety of products consistently and
reliably.
The VCA shows that while Ethiopia is a less expensive location than China in terms of
production costs of export quality polo shirts (see Table 42 below),35
Ethiopian producers
are unable to capture a higher FOB price than their Chinese competitors. A polo shirt of
similar quality and make sells for US$2.95 - US$3.41 (FOB Djibouti) versus US$5.38 -
US$5.80 (FOB Guangdong, China). This is roughly a 40 percent price differential and
34
The garment export firm illustrated in the VCA diagram does not include expatriate proprietors‘/partners‘
earnings/wages in its product costing. 35
Note that the lower production cost in Ethiopia pertains to manufacturers who produce lower quality polo
shirts for the local market.
107
reflects differences in quality, volume and the ability to deliver consistently on time. At
the same time, if Chinese producers are under pressure to sell, they can comfortably
decrease prices in proportion to the export rebate subsidy they obtain from the
government (or roughly US$0.75/piece or polo as per August 2010 rates).
For Tanzania, the VCA shows that the country has the highest production costs: roughly
US$5 per export quality polo. The high production costs are for the most part caused by
the inability of Tanzanian firms to generate sufficient orders to both minimize input costs
as well as to effectively spread out the high management and overhead costs associated
with an operation.36
In terms of input cost minimization, for example, Tanzanian
garment firms could reduce fabric input costs by at least 15 percent and up to 20 percent
only by the virtue of ordering one TEU load of fabric per order instead of the current case
of ordering only a fraction of a TEU load.37
In terms of spreading fixed costs across
higher volumes of production, an increase in capacity utilization from 60 percent to 85
percent is estimated to reduce production costs by at least 10 percent.38
Combined, these
two cost savings that could be generated by increased volumes of operation would reduce
production costs by at least 16 percent to US$4.27/polo. To date, small and medium-size
Tanzanian garment export firms have not been able to overcome the challenge of
securing large orders, partly because they generally have limited capacity (up to 550
pieces/day) and because they have limited product ranges. As such, they are not
attractive for foreign clients operating in the volume segment or those working with
multiple product and fashion cycles. In addition to their small size, Tanzanian garment
exporters face a range of other challenges to competition with both Asian and other
African competitors, including lack of country awareness by the majority of international
apparel buyers and/or their agents and generally inferior delivery times compared to
Asian competitors.
As was the case for Ethiopia, Tanzanian garment exporters operate in an industry small in
size and attractive only for the smallest buyers specializing in a few products. Unlike in
Ethiopia, however, garment exporters in Tanzania are able to execute the low-volume
high-price strategy well: they obtain high prices in the low-volume niche markets in
which they operate. The VCA shows that Tanzanian FOB prices are among the highest
of all countries surveyed (US$5.7-US$6.3/polo); employment of experienced expatriate
36
Analysis does not pertain to the two large garment exporters in Arusha (vertically integrated) who each
employ over 2,000 people. 37
Actual quotation from Mauritius fabric suppliers: sea freight costs of US$1.3 waived for any order of a
TEU load of fabric and a 10 percent discount on fabric prices for a repeat order of TEU load of fabric. 38
Simulation of actual production costs for the polo producer illustrated in the VCA, i.e., costs for
acquiring additional button opening and attaching machines that are required in this particular factory set
up to accommodate increased volumes are minimal (less than US$0.01 per polo piece) and therefore not
included. Additional labor costs for operating the additional machines are minimal (US$0.01per polo
piece) and are included.

108
management is one of the factors behind the high quality of polo garments produced in
Tanzania as reflected by their prices.
Table 42: Benchmarking Key Variables for the Production of Polo Shirts (Part 2) Benchmarking Data Sheet: Polo Shirts China Vietnam* Ethiopia Tanzania
7.0 FACTORY
7.1 Capacity utilization 60% - 85% 80% - 95% 55% - 70% 50% - 75%
7.2 Installed capacity (piece/day) 357 - 2,000 3,200 - 77,000 1,000 - 4,156 100 - 550
7.3 Labor absenteeism rate (%) 1% 0.3% - 2% 6% - 12% 15% - 21%
7.4 Average salary/wage/month
7.5 Skilled $311 - $370 $119 - 181 $37 - $185 $107 - $213
7.6 Unskilled $237 - $296 $78 - $130 $26 - $48 $93 - $173
7.7 Days of operation/month 26 - 28 26 25 26
7.8 Working hours/day 9 - 10 8 7.5 8.0
7.8 Average age of major equipment 1.1 - 2.5 4 - 13 3 - 13 8 - 15
8.0 Exported Output (finished primary product)
8.1 Direct Export without consolidator/broker 0% - 25% 97% - 100% 0% - 100% 0% - 100%
8.2 Indirect Export Through Local Consolidator 75% - 100% % 0% - 27% 0%
8.3 Indirect Export Through Overseas Consolidator 0% % 0% 0% - 100%
9.0 Domestically Sold Output (finished primary product)
9.1 Direct Sales to Wholesalers/Retailers without consolidator 0% 0% - 3% 0% - 80% 0% - 100%
9.2 Direct Sales Through Own Outlets/Shops/Showrooms 0% - 25% 0% 0% - 30% 0%
9.3 Indirect Sales Through Local Consolidator/Trader 0% 0% 0% - 10% 0% - 100%
10.0 Unit production cost ($/piece) $3.93 - $4.33 $0.39 - $0.55 $1.98 - $3.21 $4.76 - $5.10
10.1 Export VAT Rebate ($/piece) $0.74 - $0.79
11.0 Avg Selling Price (US$)
11.1 Factory gate $4.97 - $5.36 -$ $3.19 - $8.89 -
11.2 Wholesale $5.18 - $5.58 -$ $3.19 - $9.33 $8 - $10
11.3 FOB price $5.38 - $5.80 $0.80 - $1.42 $2.95 - $3.41 $5.70 - $6.30
Low capacity
utilization
High absenteeims
Relatively
low wages
Older equipment
Immediate
rebate
Relatively
high wages
Source: Global Development Solutions, LLC
III.7.2. Other Factors Contributing to Differences in
Competitiveness in the Apparel Sector
The value chain analysis identified a number of factors at the factory level that contribute
to differences in competitiveness between apparel manufacturers in the select countries.
But a closer analysis of the supply chain structure for the apparel sector revealed major
structural differences in the way the sector is organized that substantially impact labor
productivity and production efficiency.
Supply Chain Structure in Ethiopia: The apparel sector in Ethiopia is composed of:
Predominately SMEs producing for the local market with a few large, fully
integrated (fabric purchase-to-finished product export) manufacturers; and
Limited number of local producers capable of supplying export-quality fabric.
With a limited number of capable fabric suppliers, garment manufacturers must order
fabric from Asian suppliers, which generally take up to 20 – 30 days. In addition, no
production activities along the value chain are outsourced to local SMEs. Consequently,
the garment production structure in Ethiopia is characterized by:
Long order-to-delivery time (60 – 75 days) – the time lag is further aggravated by
the fact that the nearest port is over 700 km away in Djibouti;
High overhead costs to manage input material sourcing, in-house production,
finished product exports and sourcing packing/packaging material (as the value

109
chain diagram indicates, the Admin/OH cost is the third highest segment of the
value chain accounting for 4.3 percent of the total value chain cost compared to
3.3 percent in China);
High inland transport cost.39
Figure 14: Supply Chain Structure for Apparel Production in Ethiopia
Supply Chain Structure in Tanzania: The supply chain structure in Tanzania is very
similar to the one in Ethiopia, except that most garment firms operating in Tanzania are
much smaller (10-50 employees on average) than those in Ethiopia (100-250 employees
on average). The other notable difference is that Tanzania is not landlocked and the
logistics of operating in an export-based supply chain are less complex and often less
costly than they are in Ethiopia.40
Supply Chain Structure in China: An assessment of the supply chain structure for the
apparel sector in China points to a very different story. The supply chain structure in
China is characterized by the following (refer to the diagram below):
The sector is organized in a large cluster structure where entire towns and cities
are devoted to the production of apparel products;
Within the cluster structure are many SME suppliers supplying all of the
necessary input material within close proximity to the production facility where
input supplies can be accessed within a matter of days or even hours;
39
Note that from the benchmarking table the inland transport costs are higher for China and Vietnam
measured in US$km-ton due to the fact that the distances that the products are transported are very short,
and thus transport costs tended to be higher in these two countries. 40
Inland transport costs along main axes in Tanzania are relatively low (US$0.04/km-ton).
Key Characteristics
Long order - to - delivery time
High OH cost to manage
input material sourci ng, finished product export, and
packaging material
High transport cost
Order - to - delivery: 60 – 75 days
SME s (100 – 250 Employees) Raw Material
Cutting/Layering Sewing/Assembly
Finishing Packing/Loading
(Fabric) (in - house)
(in - house) (incl washing)
Asian supplier (20 - 30 days delivery)
- Imported packaging material
- Limited no. of suppliers
No subcontracting
Local supplier: - short supply
- limited no. of suppliers
Direct Export : -
Shipped to off - shore buyer/ consolidator
- 705 km to nearest port
Local Ma rket: Informal and formal local brokers
Global Development Solutions, LLC
Supply Chain Structure for Apparel Production in Ethiopia

110
Also within the cluster structure are many SMEs performing both similar and
specialized production activities where segments of the value chain can be readily
subcontracted out, thus allowing a garment manufacturer to achieve a much
higher labor productivity rate;
Many value adding activities, including contracting, shipping and market risk
management with overseas buyers are managed by a vast network of traders and
specialized agents that operate within a textile/garment cluster. This network
provides critical market linkage support to garment manufacturing firms,
especially SMEs, and allows them to focus on improving operating efficiencies
with limited overhead staffing and other expenses. This makes possible an
environment in which manufacturers enjoy low cost to market entry (limited
investment capital requirement) and low overhead cost. The trader/agent network
also maintains critical backward linkages with garment SMEs, such as
disseminating up-to-date information on the latest international consumer trends
and market developments. This gives the SMEs in the cluster the vital ability to
quickly shift from one product line to the next as seasonal and fashion demands
and preferences change;
All these characteristics contribute to a very short order-to-delivery time of 45
days.
Figure 15: Supply Chain Structure for Apparel Production in China
Trading Co. - Export license , contacts, network
- Shipment/Risk Management
- Contract/Payment Management
- VAT refund management
- Competitive fees (1% - 1.5%)
- A t least 10,000 nationally
Small Specialized Agent - One or two individuals (informal)
- Foreign contacts/network
- Competitive fees (max 5%)
- M illions of agents national ly
Direct Export
SME s (100 – 150 Employees) Raw Material
Cutting/Layering Sewing/Assembly
Finishing Packing/Loading
(Fabric) (in - house) (in - house/subcontract)
(incl washing)
100‘s of small local fabric suppliers & dyeing services
F F
F F F
F F F
D
D
D 100s of accessory suppliers within 10 – 15 km radius
1000‘s nationally
A A
A
A A A
A A
100s of SMEs within each
‗garment city‘
W Fi W W
W Fi Fi
100s of package supplier in ‗garment city‘
P P P
P P P
Many SME subcontractors: collaborative –
competition
S S S
S S
S
20% 8 0%
Rar e
Supply Chain Structure for Apparel Production in China Key Characteristics
Outsource non - essential
work
Minimize overhead (stay
nimble and small unless intending to scale up )
Take on large orders –
collaborate with other SMEs
Rely on trading co. for ord er
processing (minimize OH)
Order - to - delivery: 45 days
Global Devel opment Solutions, LLC
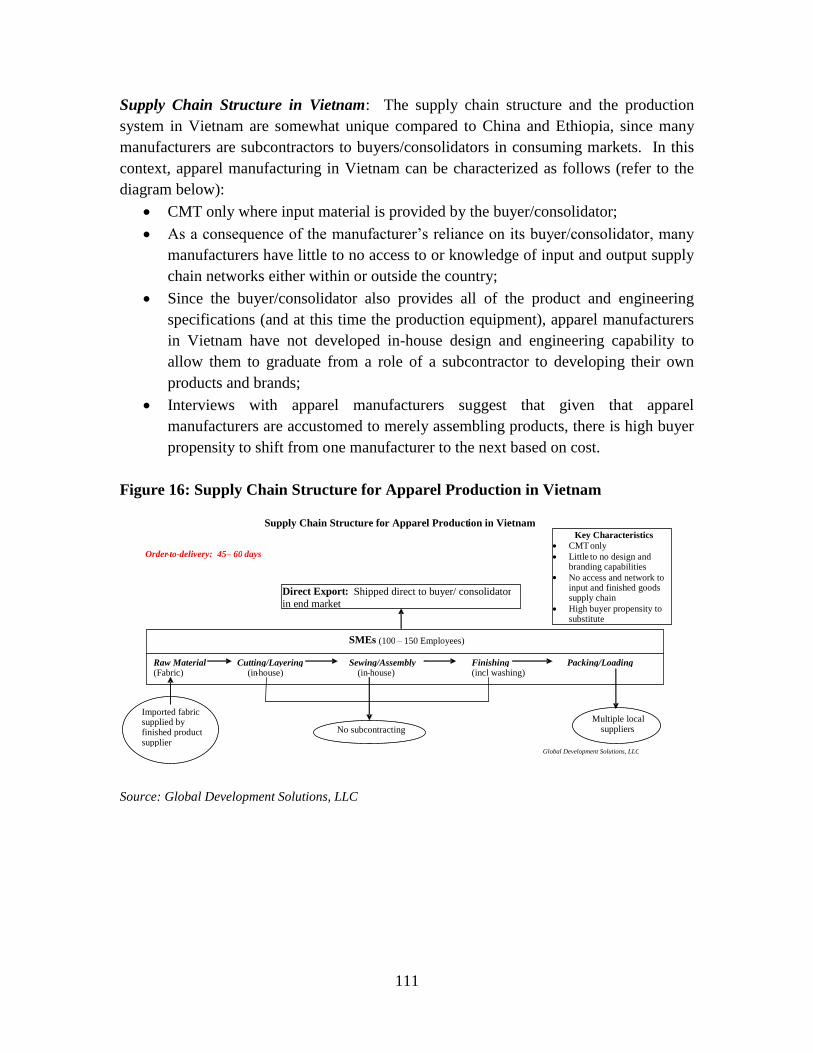
111
Supply Chain Structure in Vietnam: The supply chain structure and the production
system in Vietnam are somewhat unique compared to China and Ethiopia, since many
manufacturers are subcontractors to buyers/consolidators in consuming markets. In this
context, apparel manufacturing in Vietnam can be characterized as follows (refer to the
diagram below):
CMT only where input material is provided by the buyer/consolidator;
As a consequence of the manufacturer‘s reliance on its buyer/consolidator, many
manufacturers have little to no access to or knowledge of input and output supply
chain networks either within or outside the country;
Since the buyer/consolidator also provides all of the product and engineering
specifications (and at this time the production equipment), apparel manufacturers
in Vietnam have not developed in-house design and engineering capability to
allow them to graduate from a role of a subcontractor to developing their own
products and brands;
Interviews with apparel manufacturers suggest that given that apparel
manufacturers are accustomed to merely assembling products, there is high buyer
propensity to shift from one manufacturer to the next based on cost.
Figure 16: Supply Chain Structure for Apparel Production in Vietnam
Source: Global Development Solutions, LLC
1
Direct Export : Shipped direct to buyer/ consolidator in end market
SME s (100 – 150 Employees) Raw Material
Cutting/Layering Sewing/Assembly
Finishing Packing/Loading
(Fabric)
(in - house) (in - house)
(incl washing)
Imported fabric supplied by finished product supplier
Multiple local suppliers
No subcontracting
Supply Chain Structure for Apparel Product ion in Vietnam Key Characteristics
CMT only
Little to no design and
branding capabilities
No access and network to
input and finished goods supply chain
High buyer propensity to
substitute
Order - to - delivery: 45 – 60 days
Global Development Solutions, LLC
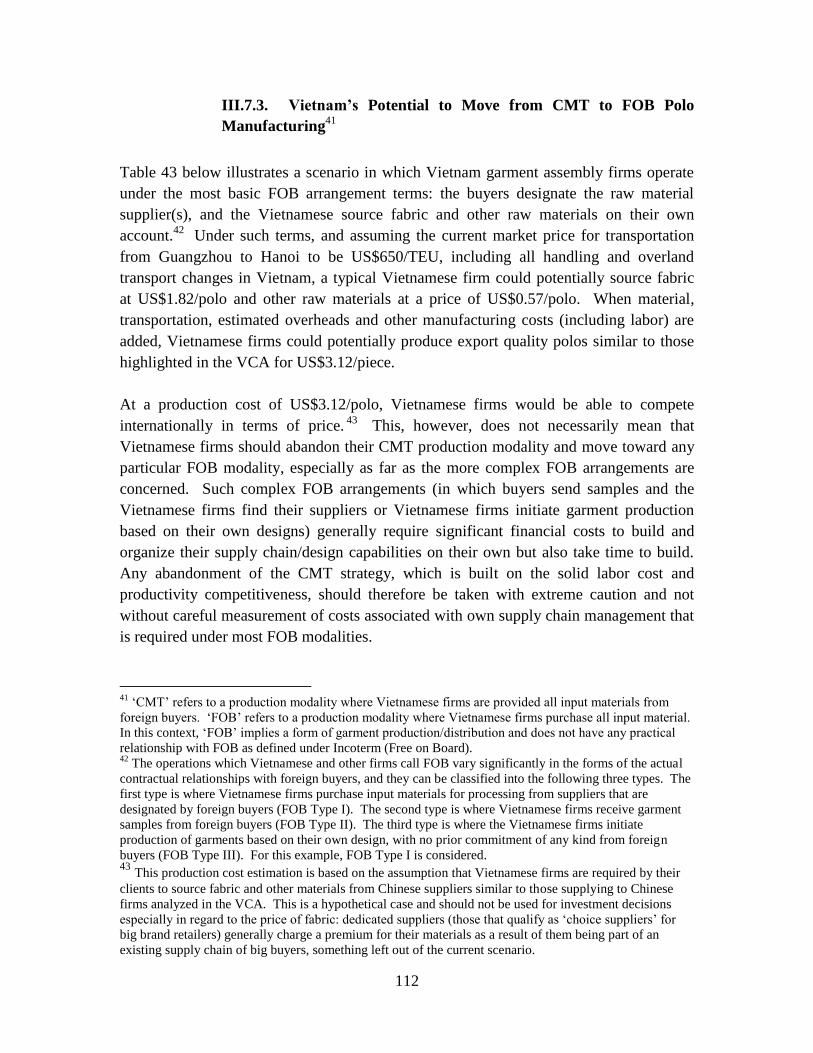
112
III.7.3. Vietnam’s Potential to Move from CMT to FOB Polo
Manufacturing41
Table 43 below illustrates a scenario in which Vietnam garment assembly firms operate
under the most basic FOB arrangement terms: the buyers designate the raw material
supplier(s), and the Vietnamese source fabric and other raw materials on their own
account.42
Under such terms, and assuming the current market price for transportation
from Guangzhou to Hanoi to be US$650/TEU, including all handling and overland
transport changes in Vietnam, a typical Vietnamese firm could potentially source fabric
at US$1.82/polo and other raw materials at a price of US$0.57/polo. When material,
transportation, estimated overheads and other manufacturing costs (including labor) are
added, Vietnamese firms could potentially produce export quality polos similar to those
highlighted in the VCA for US$3.12/piece.
At a production cost of US$3.12/polo, Vietnamese firms would be able to compete
internationally in terms of price.43
This, however, does not necessarily mean that
Vietnamese firms should abandon their CMT production modality and move toward any
particular FOB modality, especially as far as the more complex FOB arrangements are
concerned. Such complex FOB arrangements (in which buyers send samples and the
Vietnamese firms find their suppliers or Vietnamese firms initiate garment production
based on their own designs) generally require significant financial costs to build and
organize their supply chain/design capabilities on their own but also take time to build.
Any abandonment of the CMT strategy, which is built on the solid labor cost and
productivity competitiveness, should therefore be taken with extreme caution and not
without careful measurement of costs associated with own supply chain management that
is required under most FOB modalities.
41
‗CMT‘ refers to a production modality where Vietnamese firms are provided all input materials from
foreign buyers. ‗FOB‘ refers to a production modality where Vietnamese firms purchase all input material.
In this context, ‗FOB‘ implies a form of garment production/distribution and does not have any practical
relationship with FOB as defined under Incoterm (Free on Board). 42
The operations which Vietnamese and other firms call FOB vary significantly in the forms of the actual
contractual relationships with foreign buyers, and they can be classified into the following three types. The
first type is where Vietnamese firms purchase input materials for processing from suppliers that are
designated by foreign buyers (FOB Type I). The second type is where Vietnamese firms receive garment
samples from foreign buyers (FOB Type II). The third type is where the Vietnamese firms initiate
production of garments based on their own design, with no prior commitment of any kind from foreign
buyers (FOB Type III). For this example, FOB Type I is considered. 43
This production cost estimation is based on the assumption that Vietnamese firms are required by their
clients to source fabric and other materials from Chinese suppliers similar to those supplying to Chinese
firms analyzed in the VCA. This is a hypothetical case and should not be used for investment decisions
especially in regard to the price of fabric: dedicated suppliers (those that qualify as ‗choice suppliers‘ for
big brand retailers) generally charge a premium for their materials as a result of them being part of an
existing supply chain of big buyers, something left out of the current scenario.
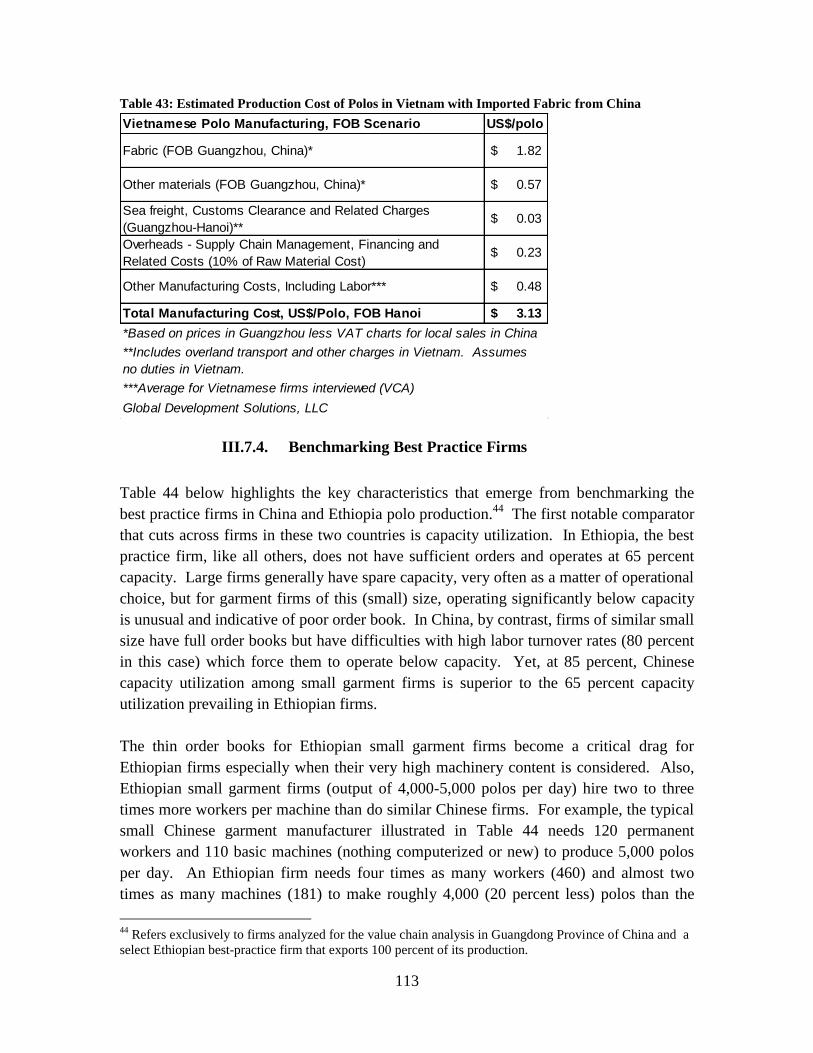
113
Table 43: Estimated Production Cost of Polos in Vietnam with Imported Fabric from China
Vietnamese Polo Manufacturing, FOB Scenario US$/polo
Fabric (FOB Guangzhou, China)* 1.82$
Other materials (FOB Guangzhou, China)* 0.57$
Sea freight, Customs Clearance and Related Charges
(Guangzhou-Hanoi)**0.03$
Overheads - Supply Chain Management, Financing and
Related Costs (10% of Raw Material Cost)0.23$
Other Manufacturing Costs, Including Labor*** 0.48$
Total Manufacturing Cost, US$/Polo, FOB Hanoi 3.13$
*Based on prices in Guangzhou less VAT charts for local sales in China
**Includes overland transport and other charges in Vietnam. Assumes
no duties in Vietnam.
***Average for Vietnamese firms interviewed (VCA)
Global Development Solutions, LLC
III.7.4. Benchmarking Best Practice Firms
Table 44 below highlights the key characteristics that emerge from benchmarking the
best practice firms in China and Ethiopia polo production.44
The first notable comparator
that cuts across firms in these two countries is capacity utilization. In Ethiopia, the best
practice firm, like all others, does not have sufficient orders and operates at 65 percent
capacity. Large firms generally have spare capacity, very often as a matter of operational
choice, but for garment firms of this (small) size, operating significantly below capacity
is unusual and indicative of poor order book. In China, by contrast, firms of similar small
size have full order books but have difficulties with high labor turnover rates (80 percent
in this case) which force them to operate below capacity. Yet, at 85 percent, Chinese
capacity utilization among small garment firms is superior to the 65 percent capacity
utilization prevailing in Ethiopian firms.
The thin order books for Ethiopian small garment firms become a critical drag for
Ethiopian firms especially when their very high machinery content is considered. Also,
Ethiopian small garment firms (output of 4,000-5,000 polos per day) hire two to three
times more workers per machine than do similar Chinese firms. For example, the typical
small Chinese garment manufacturer illustrated in Table 44 needs 120 permanent
workers and 110 basic machines (nothing computerized or new) to produce 5,000 polos
per day. An Ethiopian firm needs four times as many workers (460) and almost two
times as many machines (181) to make roughly 4,000 (20 percent less) polos than the
44
Refers exclusively to firms analyzed for the value chain analysis in Guangdong Province of China and a
select Ethiopian best-practice firm that exports 100 percent of its production.
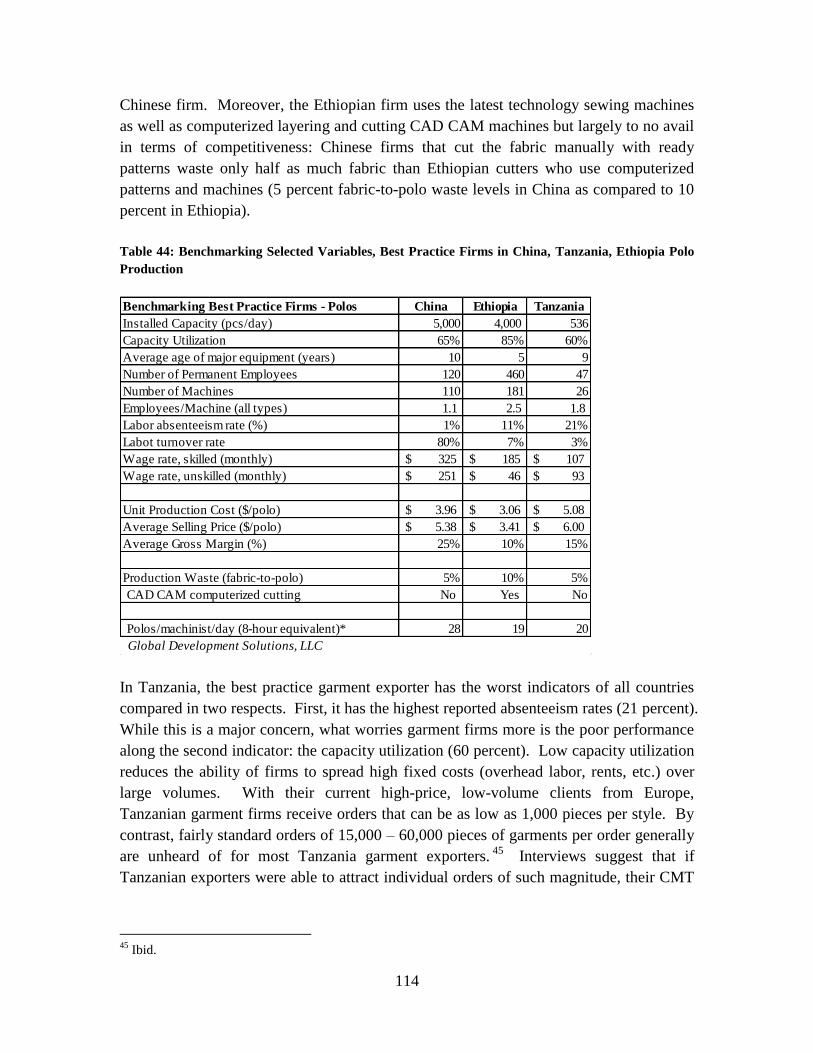
114
Chinese firm. Moreover, the Ethiopian firm uses the latest technology sewing machines
as well as computerized layering and cutting CAD CAM machines but largely to no avail
in terms of competitiveness: Chinese firms that cut the fabric manually with ready
patterns waste only half as much fabric than Ethiopian cutters who use computerized
patterns and machines (5 percent fabric-to-polo waste levels in China as compared to 10
percent in Ethiopia).
Table 44: Benchmarking Selected Variables, Best Practice Firms in China, Tanzania, Ethiopia Polo
Production
Benchmarking Best Practice Firms - Polos China Ethiopia Tanzania
Installed Capacity (pcs/day) 5,000 4,000 536
Capacity Utilization 65% 85% 60%
Average age of major equipment (years) 10 5 9
Number of Permanent Employees 120 460 47
Number of Machines 110 181 26
Employees/Machine (all types) 1.1 2.5 1.8
Labor absenteeism rate (%) 1% 11% 21%
Labot turnover rate 80% 7% 3%
Wage rate, skilled (monthly) 325$ 185$ 107$
Wage rate, unskilled (monthly) 251$ 46$ 93$
Unit Production Cost ($/polo) 3.96$ 3.06$ 5.08$
Average Selling Price ($/polo) 5.38$ 3.41$ 6.00$
Average Gross Margin (%) 25% 10% 15%
Production Waste (fabric-to-polo) 5% 10% 5%
CAD CAM computerized cutting No Yes No
Polos/machinist/day (8-hour equivalent)* 28 19 20
Global Development Solutions, LLC
In Tanzania, the best practice garment exporter has the worst indicators of all countries
compared in two respects. First, it has the highest reported absenteeism rates (21 percent).
While this is a major concern, what worries garment firms more is the poor performance
along the second indicator: the capacity utilization (60 percent). Low capacity utilization
reduces the ability of firms to spread high fixed costs (overhead labor, rents, etc.) over
large volumes. With their current high-price, low-volume clients from Europe,
Tanzanian garment firms receive orders that can be as low as 1,000 pieces per style. By
contrast, fairly standard orders of 15,000 – 60,000 pieces of garments per order generally
are unheard of for most Tanzania garment exporters.45
Interviews suggest that if
Tanzanian exporters were able to attract individual orders of such magnitude, their CMT
45
Ibid.
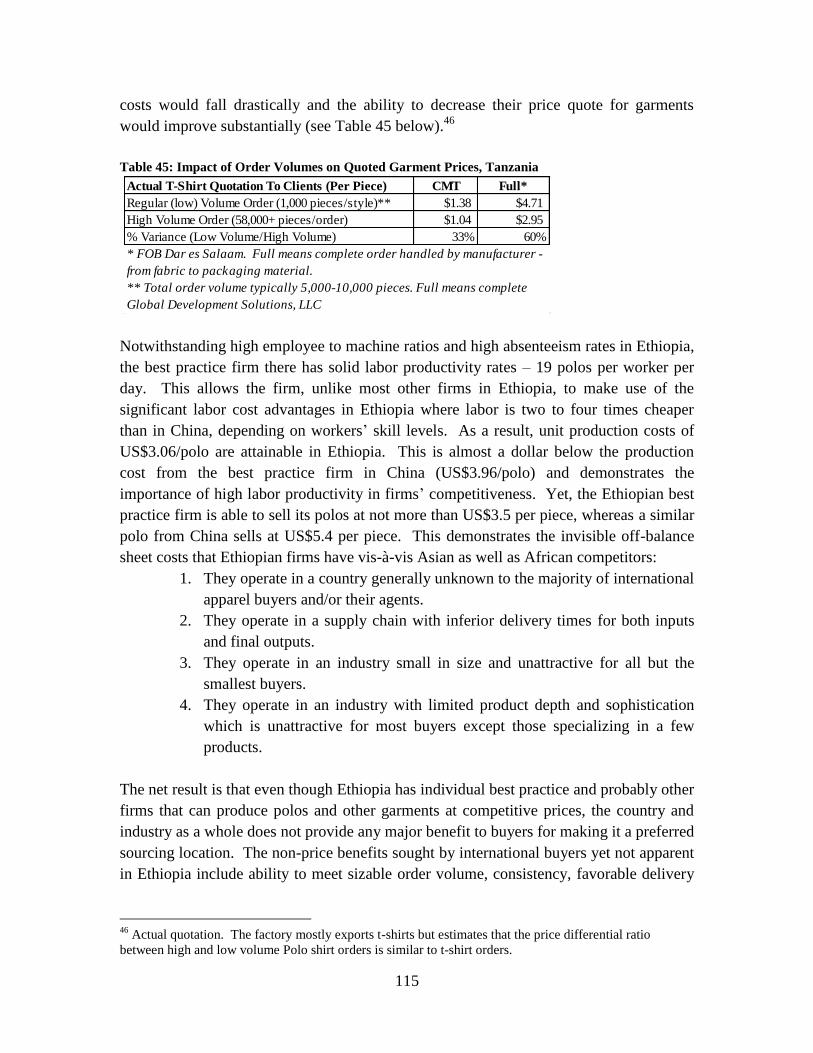
115
costs would fall drastically and the ability to decrease their price quote for garments
would improve substantially (see Table 45 below).46
Table 45: Impact of Order Volumes on Quoted Garment Prices, Tanzania
Actual T-Shirt Quotation To Clients (Per Piece) CMT Full*
Regular (low) Volume Order (1,000 pieces/style)** $1.38 $4.71
High Volume Order (58,000+ pieces/order) $1.04 $2.95
% Variance (Low Volume/High Volume) 33% 60%
* FOB Dar es Salaam. Full means complete order handled by manufacturer -
from fabric to packaging material.
** Total order volume typically 5,000-10,000 pieces. Full means complete
Global Development Solutions, LLC
Notwithstanding high employee to machine ratios and high absenteeism rates in Ethiopia,
the best practice firm there has solid labor productivity rates – 19 polos per worker per
day. This allows the firm, unlike most other firms in Ethiopia, to make use of the
significant labor cost advantages in Ethiopia where labor is two to four times cheaper
than in China, depending on workers‘ skill levels. As a result, unit production costs of
US$3.06/polo are attainable in Ethiopia. This is almost a dollar below the production
cost from the best practice firm in China (US$3.96/polo) and demonstrates the
importance of high labor productivity in firms‘ competitiveness. Yet, the Ethiopian best
practice firm is able to sell its polos at not more than US$3.5 per piece, whereas a similar
polo from China sells at US$5.4 per piece. This demonstrates the invisible off-balance
sheet costs that Ethiopian firms have vis-à-vis Asian as well as African competitors:
1. They operate in a country generally unknown to the majority of international
apparel buyers and/or their agents.
2. They operate in a supply chain with inferior delivery times for both inputs
and final outputs.
3. They operate in an industry small in size and unattractive for all but the
smallest buyers.
4. They operate in an industry with limited product depth and sophistication
which is unattractive for most buyers except those specializing in a few
products.
The net result is that even though Ethiopia has individual best practice and probably other
firms that can produce polos and other garments at competitive prices, the country and
industry as a whole does not provide any major benefit to buyers for making it a preferred
sourcing location. The non-price benefits sought by international buyers yet not apparent
in Ethiopia include ability to meet sizable order volume, consistency, favorable delivery
46
Actual quotation. The factory mostly exports t-shirts but estimates that the price differential ratio
between high and low volume Polo shirt orders is similar to t-shirt orders.
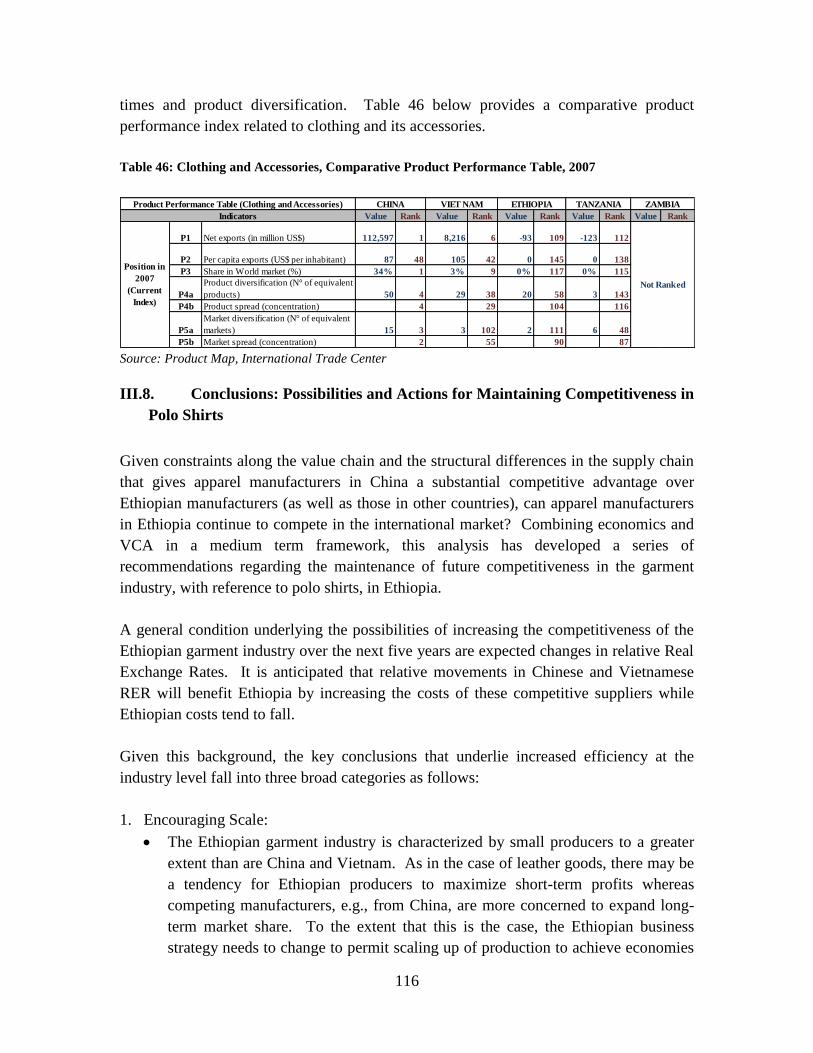
116
times and product diversification. Table 46 below provides a comparative product
performance index related to clothing and its accessories.
Table 46: Clothing and Accessories, Comparative Product Performance Table, 2007
Value Rank Value Rank Value Rank Value Rank Value Rank
P1 112,597 1 8,216 6 -93 109 -123 112
P2 87 48 105 42 0 145 0 138
P3 34% 1 3% 9 0% 117 0% 115
P4a 50 4 29 38 20 58 3 143
P4b 4 29 104 116
P5a 15 3 3 102 2 111 6 48
P5b 2 55 90 87
ZAMBIAProduct Performance Table (Clothing and Accessories) CHINA VIET NAM ETHIOPIA TANZANIA
Indicators
Position in
2007
(Current
Index)
Net exports (in million US$)
Not Ranked
Per capita exports (US$ per inhabitant)
Share in World market (%)
Product diversification (N° of equivalent
products)
Product spread (concentration)
Market diversification (N° of equivalent
markets)
Market spread (concentration) Source: Product Map, International Trade Center
III.8. Conclusions: Possibilities and Actions for Maintaining Competitiveness in
Polo Shirts
Given constraints along the value chain and the structural differences in the supply chain
that gives apparel manufacturers in China a substantial competitive advantage over
Ethiopian manufacturers (as well as those in other countries), can apparel manufacturers
in Ethiopia continue to compete in the international market? Combining economics and
VCA in a medium term framework, this analysis has developed a series of
recommendations regarding the maintenance of future competitiveness in the garment
industry, with reference to polo shirts, in Ethiopia.
A general condition underlying the possibilities of increasing the competitiveness of the
Ethiopian garment industry over the next five years are expected changes in relative Real
Exchange Rates. It is anticipated that relative movements in Chinese and Vietnamese
RER will benefit Ethiopia by increasing the costs of these competitive suppliers while
Ethiopian costs tend to fall.
Given this background, the key conclusions that underlie increased efficiency at the
industry level fall into three broad categories as follows:
1. Encouraging Scale:
The Ethiopian garment industry is characterized by small producers to a greater
extent than are China and Vietnam. As in the case of leather goods, there may be
a tendency for Ethiopian producers to maximize short-term profits whereas
competing manufacturers, e.g., from China, are more concerned to expand long-
term market share. To the extent that this is the case, the Ethiopian business
strategy needs to change to permit scaling up of production to achieve economies
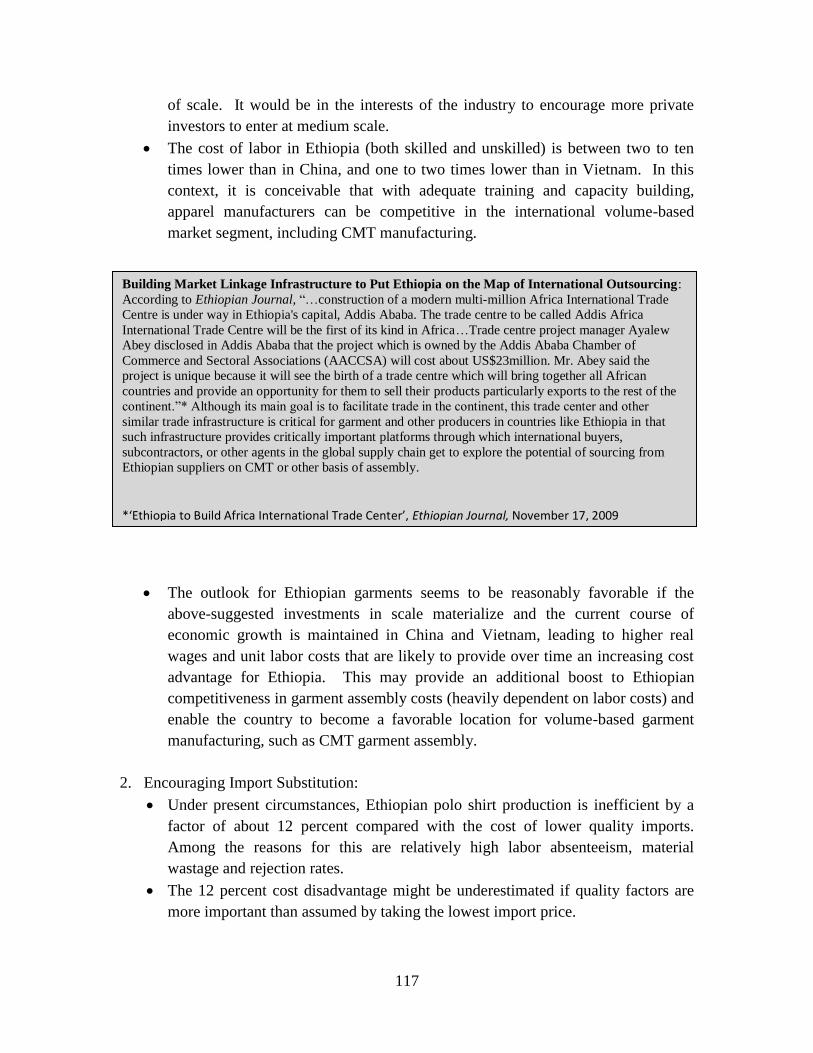
117
of scale. It would be in the interests of the industry to encourage more private
investors to enter at medium scale.
The cost of labor in Ethiopia (both skilled and unskilled) is between two to ten
times lower than in China, and one to two times lower than in Vietnam. In this
context, it is conceivable that with adequate training and capacity building,
apparel manufacturers can be competitive in the international volume-based
market segment, including CMT manufacturing.
The outlook for Ethiopian garments seems to be reasonably favorable if the
above-suggested investments in scale materialize and the current course of
economic growth is maintained in China and Vietnam, leading to higher real
wages and unit labor costs that are likely to provide over time an increasing cost
advantage for Ethiopia. This may provide an additional boost to Ethiopian
competitiveness in garment assembly costs (heavily dependent on labor costs) and
enable the country to become a favorable location for volume-based garment
manufacturing, such as CMT garment assembly.
2. Encouraging Import Substitution:
Under present circumstances, Ethiopian polo shirt production is inefficient by a
factor of about 12 percent compared with the cost of lower quality imports.
Among the reasons for this are relatively high labor absenteeism, material
wastage and rejection rates.
The 12 percent cost disadvantage might be underestimated if quality factors are
more important than assumed by taking the lowest import price.
Building Market Linkage Infrastructure to Put Ethiopia on the Map of International Outsourcing:
According to Ethiopian Journal, ―…construction of a modern multi-million Africa International Trade
Centre is under way in Ethiopia's capital, Addis Ababa. The trade centre to be called Addis Africa
International Trade Centre will be the first of its kind in Africa…Trade centre project manager Ayalew
Abey disclosed in Addis Ababa that the project which is owned by the Addis Ababa Chamber of
Commerce and Sectoral Associations (AACCSA) will cost about US$23million. Mr. Abey said the
project is unique because it will see the birth of a trade centre which will bring together all African
countries and provide an opportunity for them to sell their products particularly exports to the rest of the
continent.‖* Although its main goal is to facilitate trade in the continent, this trade center and other
similar trade infrastructure is critical for garment and other producers in countries like Ethiopia in that
such infrastructure provides critically important platforms through which international buyers,
subcontractors, or other agents in the global supply chain get to explore the potential of sourcing from
Ethiopian suppliers on CMT or other basis of assembly.
*‘Ethiopia to Build Africa International Trade Center’, Ethiopian Journal, November 17, 2009

118
Ethiopian cotton is, however, of high quality and improving the competitiveness
of the local textile industry would lower domestic costs of good quality fabric and
enable garment manufactures to compete and increase penetration in the domestic
apparel market.
As textile and an garment manufacturers increase their ability to serve the needs
of the domestic textile/apparel market, this could provide a key stepping stone
towards increasing product quality and factory efficiencies necessary to compete
in international markets.
3. Improving Productivity:
The success of any sector growth strategy, including 1 and 2 above, is contingent
upon productivity growth in the sector.
Reductions in wastage rates and reject rates, through improvements in factory
material workflow and other training, are necessary.
Competitiveness also could be improved through reduced absenteeism and labor
turnover, especially among skilled workers.
Improvements in delivery times are necessary.
Should Ethiopia be able to affect changes in the sector along this three-pronged
approach, it is likely that an additional key ingredient will slowly emerge in the
country: textile/garment firms will begin to gravitate and cluster around common
industry interests. Under current conditions, there is very little, if anything, around
which the 13 textile and 39 mid-to-large garment firms can cooperate or cluster. Also,
the number of producers is limited to allow for any trading/specialized agent network
to emerge in the short-term. In this context, it is important that cluster formation be
encouraged from outside the industry until a sufficient mass of
producer/suppliers/agents emerges and the cluster can sustain itself.