Comparative Transcriptome Analysis of Two Oysters ... · Comparative Transcriptome Analysis of Two...
11
Comparative Transcriptome Analysis of Two Oysters, Crassostrea gigas and Crassostrea hongkongensis Provides Insights into Adaptation to Hypo-Osmotic Conditions Xuelin Zhao, Hong Yu, Lingfeng Kong, Shikai Liu, Qi Li* Key Laboratory of Mariculture, Ministry of Education, Ocean University of China, Qingdao, 266003, China Abstract Environmental salinity creates a key barrier to limit the distribution of most aquatic organisms. Adaptation to osmotic fluctuation is believed to be a factor facilitating species diversification. Adaptive evolution often involves beneficial mutations at more than one locus. Bivalves hold great interest, with numerous species living in waters, as osmoconformers, who maintain the osmotic pressure balance mostly by free amino acids. In this study, 107,076,589 reads from two groups of Crassostrea hongkongensis were produced and the assembled into 130,629 contigs. Transcripts putatively involved in stress- response, innate immunity and cell processes were identified according to Gene ontology and KEGG pathway analyses. Comparing with the transcriptome of C. gigas to characterize the diversity of transcripts between species with osmotic divergence, we identified 182,806 high-quality single nucleotide polymorphisms (SNPs) for C. hongkongensis, and 196,779 SNPs for C. gigas. Comparison of 11,602 pairs of putative orthologs allowed for identification of 14 protein-coding genes that experienced strong positive selection (Ka/Ks.1). In addition, 45 genes that may show signs of moderate positive selection (1$Ka/Ks.0.5) were also identified. Based on Ks ratios and divergence time between the two species published previously, we estimated a neutral transcriptome-wide substitution mutation rate of 1.39 6 10 29 per site per year. Several genes were differentially expressed across the control and treated groups of each species. This is the first time to sequence the transcriptome of C. hongkongensis and provide the most comprehensive transcriptomic resource available for it. The increasing amount of transcriptome data on Crassostrea provides an excellent resource for phylogenetic analysis. A large number of SNPs identified in this work are expected to provide valuable resources for future marker and genotyping assay development. The analysis of natural selection provides an innovative view on the adaptation within species and sets the basis for future genetic and evolutionary studies. Citation: Zhao X, Yu H, Kong L, Liu S, Li Q (2014) Comparative Transcriptome Analysis of Two Oysters, Crassostrea gigas and Crassostrea hongkongensis Provides Insights into Adaptation to Hypo-Osmotic Conditions. PLoS ONE 9(11): e111915. doi:10.1371/journal.pone.0111915 Editor: Andreas Hejnol, Sars International Centre for Marine Molecular Biology, Norway Received June 30, 2014; Accepted October 1, 2014; Published November 4, 2014 Copyright: ß 2014 Zhao et al. This is an open-access article distributed under the terms of the Creative Commons Attribution License, which permits unrestricted use, distribution, and reproduction in any medium, provided the original author and source are credited. Data Availability: The authors confirm that all data underlying the findings are fully available without restriction. All relevant data are available from the NCBI database (accession number GSE51157). Funding: This study was supported by the grants from 973 Program (2010CB126406), National High Technology Research and Development Program (2012AA10A405-6), and National Natural Science Foundation of China (31372524). The funders had no role in study design, data collection and analysis, decision to publish, or preparation of the manuscript. Competing Interests: The authors have declared that no competing interests exist. * Email: [email protected] Introduction Mollusca is one of the most species phyla of invertebrates and possess a global-scale increase in species richness from the poles to the equator [1]. As its main class, bivalves can adapt to many kinds of hostile environments, such as intertidal zones with drastic fluctuations of environmental factors and deep sea vents with extreme cold, high pressure and darkness [2,3]. Bivalves, as one of the most important inhabitants of water bodies, take part in the maintenance of ecosystem stability and biodiversity [4,5]. How- ever, how bivalves possess the adaptations in response to the complex and changeable living conditions, such as salinity, temperature and pH, is still a mystery on a genetic basis. The advances of adaptation studies would facilitate progress in many fields of biology [6], therefore, elucidating the process of adaptation and understanding its genetic basis are the main objectives of evolutionary biology [7]. Despite tremendous advances in genetic studies, a link between adaptive phenotypes and genotypes has been made for only a small number of traits in an even smaller number of organisms [8–10]. These studies mainly focused on model organisms and a few candidate genes, while understanding of the molecular basis of adaptation in non-model species remains largely unknown. Recent development of next generation sequencing (NGS) technology and bioinformatic tools enable us to analyze massive sequence data efficiently and cost-effectively [11,12]. The NGS based approaches hold great potential to expand genomic resources for any non-model organism and allows large-scale comparative analysis with genomes or transcriptomes [13–18]. Transcriptome or genome sequencing have been conducted for various marine bivalves, such as clam [19], mussels [2,20], and oysters [15,21]. In addition to candidate gene discovery from PLOS ONE | www.plosone.org 1 November 2014 | Volume 9 | Issue 11 | e111915
Transcript of Comparative Transcriptome Analysis of Two Oysters ... · Comparative Transcriptome Analysis of Two...
Comparative Transcriptome Analysis of Two Oysters,Crassostrea gigas and Crassostrea hongkongensisProvides Insights into Adaptation to Hypo-OsmoticConditionsXuelin Zhao, Hong Yu, Lingfeng Kong, Shikai Liu, Qi Li*
Key Laboratory of Mariculture, Ministry of Education, Ocean University of China, Qingdao, 266003, China
Abstract
Environmental salinity creates a key barrier to limit the distribution of most aquatic organisms. Adaptation to osmoticfluctuation is believed to be a factor facilitating species diversification. Adaptive evolution often involves beneficialmutations at more than one locus. Bivalves hold great interest, with numerous species living in waters, as osmoconformers,who maintain the osmotic pressure balance mostly by free amino acids. In this study, 107,076,589 reads from two groups ofCrassostrea hongkongensis were produced and the assembled into 130,629 contigs. Transcripts putatively involved in stress-response, innate immunity and cell processes were identified according to Gene ontology and KEGG pathway analyses.Comparing with the transcriptome of C. gigas to characterize the diversity of transcripts between species with osmoticdivergence, we identified 182,806 high-quality single nucleotide polymorphisms (SNPs) for C. hongkongensis, and 196,779SNPs for C. gigas. Comparison of 11,602 pairs of putative orthologs allowed for identification of 14 protein-coding genesthat experienced strong positive selection (Ka/Ks.1). In addition, 45 genes that may show signs of moderate positiveselection (1$Ka/Ks.0.5) were also identified. Based on Ks ratios and divergence time between the two species publishedpreviously, we estimated a neutral transcriptome-wide substitution mutation rate of 1.3961029 per site per year. Severalgenes were differentially expressed across the control and treated groups of each species. This is the first time to sequencethe transcriptome of C. hongkongensis and provide the most comprehensive transcriptomic resource available for it. Theincreasing amount of transcriptome data on Crassostrea provides an excellent resource for phylogenetic analysis. A largenumber of SNPs identified in this work are expected to provide valuable resources for future marker and genotyping assaydevelopment. The analysis of natural selection provides an innovative view on the adaptation within species and sets thebasis for future genetic and evolutionary studies.
Citation: Zhao X, Yu H, Kong L, Liu S, Li Q (2014) Comparative Transcriptome Analysis of Two Oysters, Crassostrea gigas and Crassostrea hongkongensis ProvidesInsights into Adaptation to Hypo-Osmotic Conditions. PLoS ONE 9(11): e111915. doi:10.1371/journal.pone.0111915
Editor: Andreas Hejnol, Sars International Centre for Marine Molecular Biology, Norway
Received June 30, 2014; Accepted October 1, 2014; Published November 4, 2014
Copyright: � 2014 Zhao et al. This is an open-access article distributed under the terms of the Creative Commons Attribution License, which permitsunrestricted use, distribution, and reproduction in any medium, provided the original author and source are credited.
Data Availability: The authors confirm that all data underlying the findings are fully available without restriction. All relevant data are available from the NCBIdatabase (accession number GSE51157).
Funding: This study was supported by the grants from 973 Program (2010CB126406), National High Technology Research and Development Program(2012AA10A405-6), and National Natural Science Foundation of China (31372524). The funders had no role in study design, data collection and analysis, decisionto publish, or preparation of the manuscript.
Competing Interests: The authors have declared that no competing interests exist.
* Email: [email protected]
Introduction
Mollusca is one of the most species phyla of invertebrates and
possess a global-scale increase in species richness from the poles to
the equator [1]. As its main class, bivalves can adapt to many kinds
of hostile environments, such as intertidal zones with drastic
fluctuations of environmental factors and deep sea vents with
extreme cold, high pressure and darkness [2,3]. Bivalves, as one of
the most important inhabitants of water bodies, take part in the
maintenance of ecosystem stability and biodiversity [4,5]. How-
ever, how bivalves possess the adaptations in response to the
complex and changeable living conditions, such as salinity,
temperature and pH, is still a mystery on a genetic basis.
The advances of adaptation studies would facilitate progress in
many fields of biology [6], therefore, elucidating the process of
adaptation and understanding its genetic basis are the main
objectives of evolutionary biology [7]. Despite tremendous
advances in genetic studies, a link between adaptive phenotypes
and genotypes has been made for only a small number of traits in
an even smaller number of organisms [8–10]. These studies mainly
focused on model organisms and a few candidate genes, while
understanding of the molecular basis of adaptation in non-model
species remains largely unknown.
Recent development of next generation sequencing (NGS)
technology and bioinformatic tools enable us to analyze massive
sequence data efficiently and cost-effectively [11,12]. The NGS
based approaches hold great potential to expand genomic
resources for any non-model organism and allows large-scale
comparative analysis with genomes or transcriptomes [13–18].
Transcriptome or genome sequencing have been conducted for
various marine bivalves, such as clam [19], mussels [2,20], and
oysters [15,21]. In addition to candidate gene discovery from
PLOS ONE | www.plosone.org 1 November 2014 | Volume 9 | Issue 11 | e111915
massive sequencing data, many studies have demonstrated that
this is an efficient way to discover genetic variations [22–24],
perform transcriptome profiling [25–27], and identify adaptive
genes [28,29] to provide important insights into the process of
adaptive evolution.
Oysters (Crassostrea sp.) are one of the most important species
in bivalves for their economic importance as an aquaculture
species, global distribution and wide use for research. They are
benthic, sessile filter-feeders, and are widely distributed in the
world estuaries and coastal zones [30]. There are mainly five
Crassostrea species along China’s coasts [31]. Of which, C. gigasand C. hongkongensis contribute to different fauna assemblages.
The oyster C. gigas is a eurythermal and euryhaline species which
widely spreads around the world and inhabits the northern and
southern intertidal zones in China. The optimal salinity for C.gigas is above 20% [32]. The oyster C. hongkongensis lives under
estuarine conditions around southern China [33], and grows in
salinity from 10% to 20% [34]. Due to the differences in salinity
adaptation, C. gigas and C. hongkongensis provide an excellent
model system to study how bivalves adapt to hypo-osmotic
conditions.
In this study, we conducted transcriptome sequencing of C.hongkongensis gill tissues using the Illumina sequencing platform.
By revisiting the transcriptomic data of C. gigas that has been
reported previously [27], we are aiming to perform a genome-wide
analysis for genes that may be involved in adaptation to hypo-
osmotic environments.
Results and Discussion
Sequencing and assemblyThe two cDNA libraries prepared used RNA from the two
groups of C. hongkongensis, which included one group accumu-
lated in filtered seawater with optimal salinity (HC group) and
another group accumulated in that with low salinity (HT group). A
total of 62,643,682 sequence reads from HC group, and
61,096,062 sequence reads from HT group were generated by
Illumina sequencing, respectively. These reads have been depos-
ited in the NCBI GEO database with the accession number of
GSE51157. After trimming, a total of 54,032,237 and 53,044,352
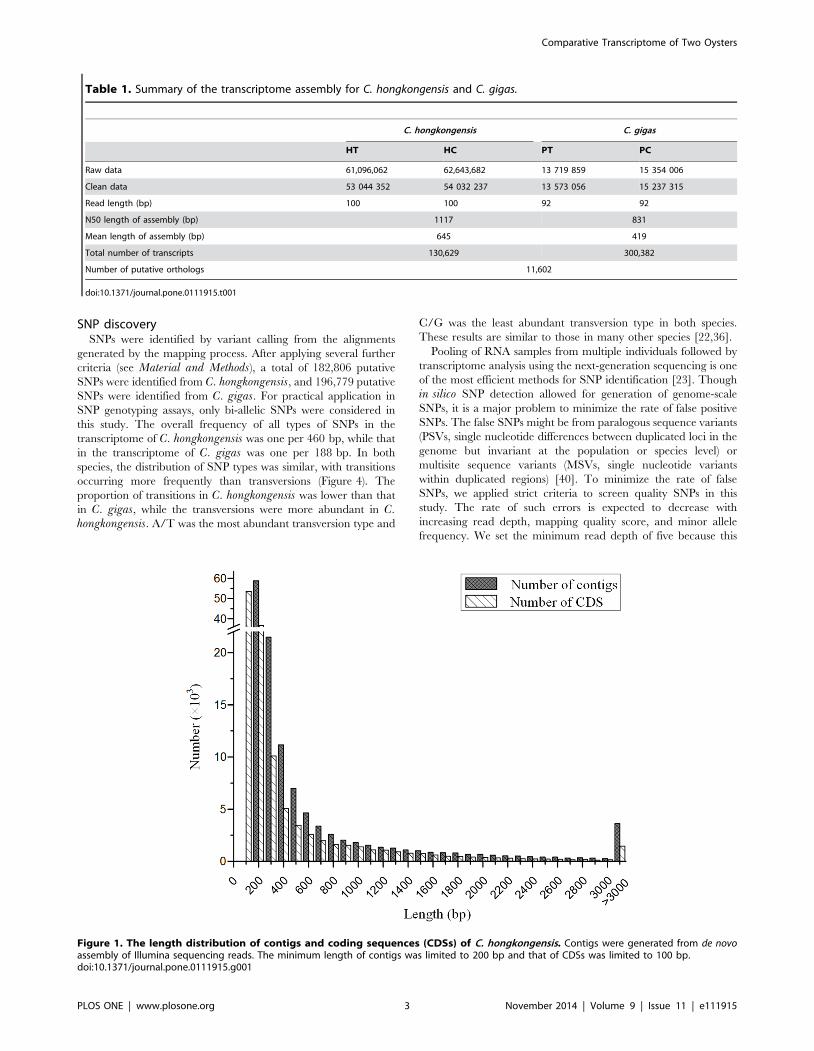
clean reads were obtained, respectively (Table 1). Assembly of
these reads generated 130,629 unique transcript sequences, with
the lengths ranging from 201 to 21,597 bp and an average length
of 645 bp (Figure 1). Similarly, we performed the de novoassembly with the transcriptomic data from C. gigas [27].
Apparently, the lower throughput sequencing in C. gigas resulted
in the assembly of shorter contiguous sequences as compared to C.hongkongensis. The de novo assembly generated 300,382 unique
transcript sequences for C. gigas, with the average length of
419 bp (Table 1).
Obviously, the assembled transcript sequences drastically
outnumbered the protein coding genes in both species, and a
large portion of sequences were short with the length of 200–
300 bp (Figure 1). One of the reason could be that different
isoforms of same genes produced from alternative splicing
processes were assembled into separate transcript sequences.
However, we should acknowledge that a large proportion of
transcripts were not assembled into full-length sequences due to
insufficient sequencing coverage. This was supported by the
observation in C. gigas where the assembly with 28.8 million reads
was much poorer than that in C. hongkongensis with over 107
million reads (Table 1). Additionally, the high levels of heterozy-
gosity and allelic variations in oysters would also make the de novoassembly difficult, resulting in short fragmented sequences.
Gene annotationThe annotation was conducted first based on the ab initio
prediction of protein coding sequences. Of the 130,629 assembled
transcript sequences from C. hongkongensis, 128,481 sequences
were predicted to contain CDSs with the minimum length of
100 bp. The lengths of CDSs ranged from 102 bp to 21,594 bp
with an average length of 423 bp (Figure 1). Then, the predicted
protein-coding sequences were searched against the public protein
databases with an E-value cut-off of 1e–5 using Blastp. Of the
128,481 transcript sequences with CDSs, a total of 41,776 were
annotated with inferred gene identities and 23,916 were remained
after removing redundancy. Among them, 15,626 sequences
(65.3%) were annotated based on the genome of C. gigas [15].
Taken together, only ,32% (41 776/130 629) transcript
sequences with unique putative CDSs were successfully annotated
in this study. The annotation efficiency was comparable with those
reported in other de novo transcriptome sequencing studies for
non-model organisms [2,22,35–37]. This could be largely due to
the incomplete assembly and the lack of genomic information in
public databases for bivalves.
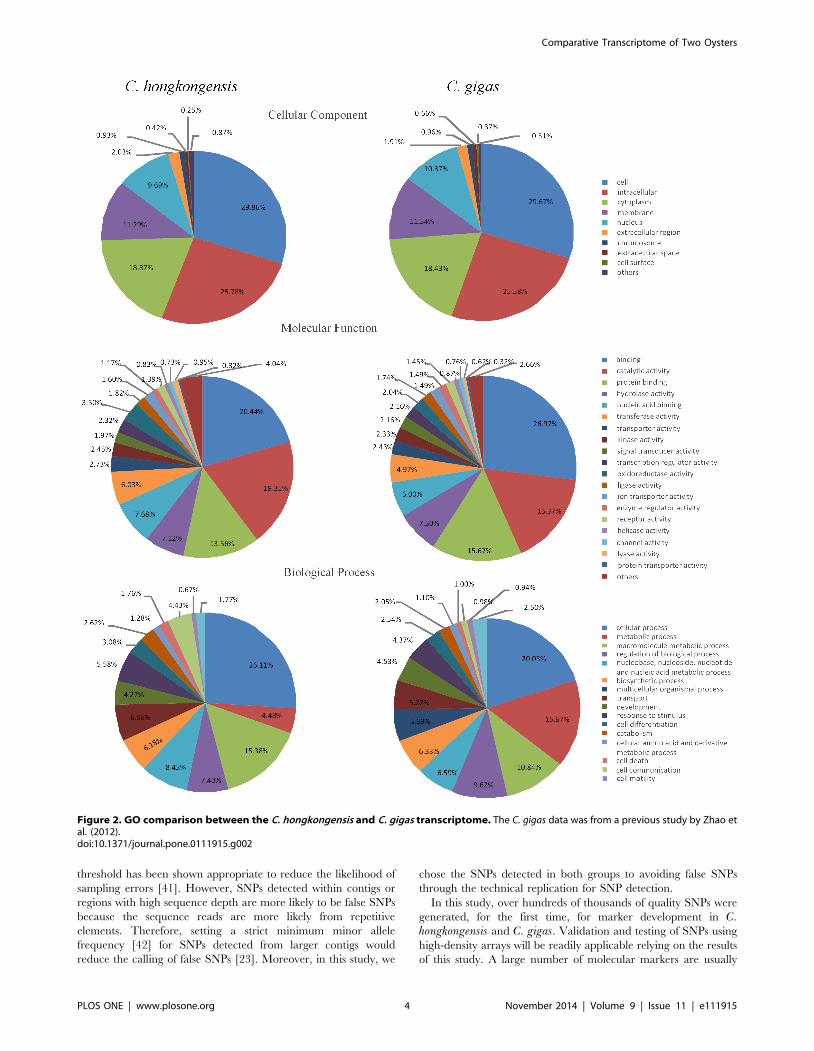
Gene ontology and pathway analysisGene Ontology (GO) analysis was widely used to classify gene
functions in terms of biological process, molecular function and
cellular component [38]. As shown in Figure 2, a total of 9,724
transcripts were assigned with at least one GO term for a total of
57,185 GO assignments. The distribution of assignments of
proteins to more specialized GO terms further indicated that C.hongkongensis transcripts represent proteins from a diverse range
of functional classes (Figure 2). Transport and response to stimulus
in biological process may be related to osmotic stress directly.
Overall, equal percentages of the transcripts for C. gigas and C.hongkongensis had GO assignments relating to the three major
categories (Figure 2). However, there were some categories that
were different between the two species, such as metabolic process
and macromolecule metabolic process. This implies that a
difference in regulation of metabolic mechanism may exist
between the two species in response to low salinity.
KEGG pathway analysis based on enzyme commission (EC)
numbers was performed for all annotated sequences using the
KEGG Automatic Annotation Server (KAAS) [39]. The analysis
showed that 4,017 sequences were mapped to 273 pathways. The
isogroups involved in these pathways are summarized in Figure 3.
Signal transduction and translation were two of the well-
represented isogroups. With the increasing environmental pressure
on the survival of oysters, salinity becomes one of the considerable
factors to threaten the living of the oysters. In this KEGG analysis,
12.0% of the isogroups belonged to environmental information
processing, which included the most abundant isogroup, signal
transduction (634). In addition, several pathways involving
immune systems were observed, which are clearly associated with
immune response; genes involved in amino acid metabolism may
participate in the osmotic regulation were also observed (Figure 3).
Comparison of the two oyster species on KEGG pathways showed
equal percentages of transcripts assigned to isogroups except
immune system, translation and energy metabolism (Figure 3). It
might indicate genes related to these three isogroups were the key
to adapt to salinity fluctuation. These results will provide a basis
for future studies to understand the genetic basis underlying
oysters’ adaptation to low salinity and identify gene-associated
markers.
Comparative Transcriptome of Two Oysters
PLOS ONE | www.plosone.org 2 November 2014 | Volume 9 | Issue 11 | e111915
SNP discoverySNPs were identified by variant calling from the alignments
generated by the mapping process. After applying several further
criteria (see Material and Methods), a total of 182,806 putative
SNPs were identified from C. hongkongensis, and 196,779 putative
SNPs were identified from C. gigas. For practical application in
SNP genotyping assays, only bi-allelic SNPs were considered in
this study. The overall frequency of all types of SNPs in the
transcriptome of C. hongkongensis was one per 460 bp, while that
in the transcriptome of C. gigas was one per 188 bp. In both
species, the distribution of SNP types was similar, with transitions
occurring more frequently than transversions (Figure 4). The
proportion of transitions in C. hongkongensis was lower than that
in C. gigas, while the transversions were more abundant in C.hongkongensis. A/T was the most abundant transversion type and
C/G was the least abundant transversion type in both species.
These results are similar to those in many other species [22,36].
Pooling of RNA samples from multiple individuals followed by
transcriptome analysis using the next-generation sequencing is one
of the most efficient methods for SNP identification [23]. Though
in silico SNP detection allowed for generation of genome-scale
SNPs, it is a major problem to minimize the rate of false positive
SNPs. The false SNPs might be from paralogous sequence variants
(PSVs, single nucleotide differences between duplicated loci in the
genome but invariant at the population or species level) or
multisite sequence variants (MSVs, single nucleotide variants
within duplicated regions) [40]. To minimize the rate of false
SNPs, we applied strict criteria to screen quality SNPs in this
study. The rate of such errors is expected to decrease with
increasing read depth, mapping quality score, and minor allele
frequency. We set the minimum read depth of five because this
Table 1. Summary of the transcriptome assembly for C. hongkongensis and C. gigas.
C. hongkongensis C. gigas
HT HC PT PC
Raw data 61,096,062 62,643,682 13 719 859 15 354 006
Clean data 53 044 352 54 032 237 13 573 056 15 237 315
Read length (bp) 100 100 92 92
N50 length of assembly (bp) 1117 831
Mean length of assembly (bp) 645 419
Total number of transcripts 130,629 300,382
Number of putative orthologs 11,602
doi:10.1371/journal.pone.0111915.t001
Figure 1. The length distribution of contigs and coding sequences (CDSs) of C. hongkongensis. Contigs were generated from de novoassembly of Illumina sequencing reads. The minimum length of contigs was limited to 200 bp and that of CDSs was limited to 100 bp.doi:10.1371/journal.pone.0111915.g001
Comparative Transcriptome of Two Oysters
PLOS ONE | www.plosone.org 3 November 2014 | Volume 9 | Issue 11 | e111915
threshold has been shown appropriate to reduce the likelihood of
sampling errors [41]. However, SNPs detected within contigs or
regions with high sequence depth are more likely to be false SNPs
because the sequence reads are more likely from repetitive
elements. Therefore, setting a strict minimum minor allele
frequency [42] for SNPs detected from larger contigs would
reduce the calling of false SNPs [23]. Moreover, in this study, we
chose the SNPs detected in both groups to avoiding false SNPs
through the technical replication for SNP detection.
In this study, over hundreds of thousands of quality SNPs were
generated, for the first time, for marker development in C.hongkongensis and C. gigas. Validation and testing of SNPs using
high-density arrays will be readily applicable relying on the results
of this study. A large number of molecular markers are usually
Figure 2. GO comparison between the C. hongkongensis and C. gigas transcriptome. The C. gigas data was from a previous study by Zhao etal. (2012).doi:10.1371/journal.pone.0111915.g002
Comparative Transcriptome of Two Oysters
PLOS ONE | www.plosone.org 4 November 2014 | Volume 9 | Issue 11 | e111915
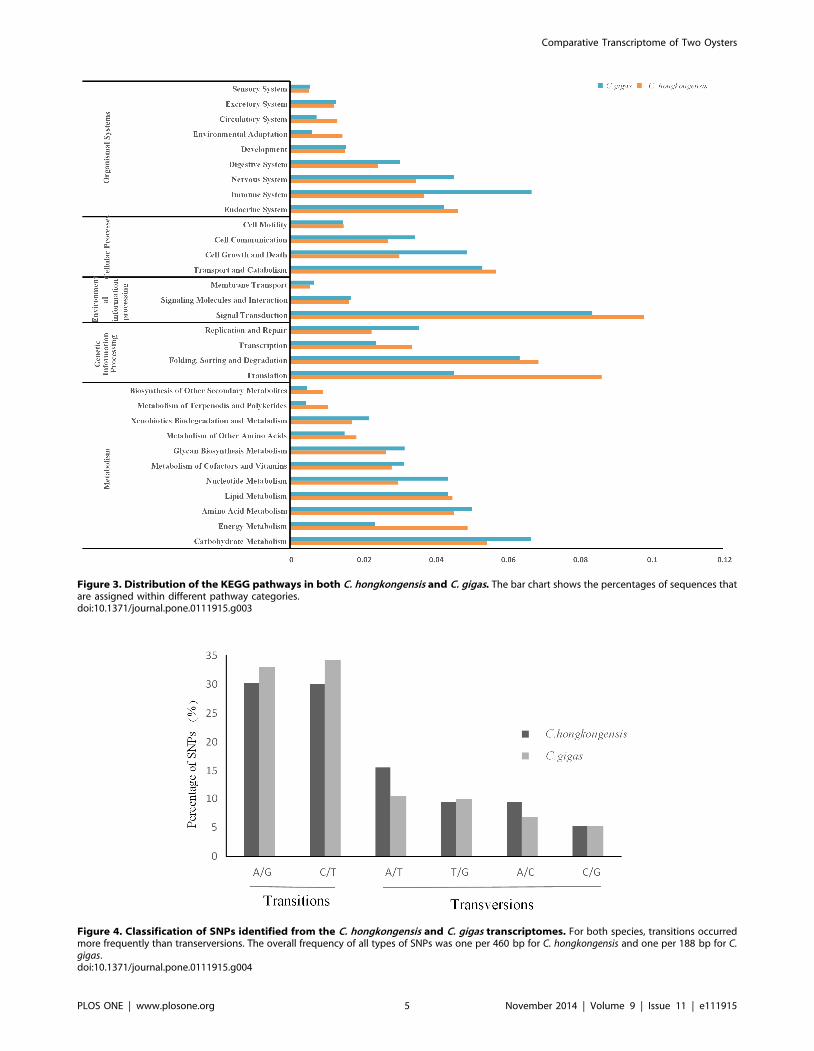
Figure 3. Distribution of the KEGG pathways in both C. hongkongensis and C. gigas. The bar chart shows the percentages of sequences thatare assigned within different pathway categories.doi:10.1371/journal.pone.0111915.g003
Figure 4. Classification of SNPs identified from the C. hongkongensis and C. gigas transcriptomes. For both species, transitions occurredmore frequently than transerversions. The overall frequency of all types of SNPs was one per 460 bp for C. hongkongensis and one per 188 bp for C.gigas.doi:10.1371/journal.pone.0111915.g004
Comparative Transcriptome of Two Oysters
PLOS ONE | www.plosone.org 5 November 2014 | Volume 9 | Issue 11 | e111915
required for fine QTL mapping and marker-assisted selection.
More specifically, SNP markers occur in protein-coding regions
are beneficial for assessing the polymorphisms that directly affect
the phenotypes. In addition, the polymorphisms that are
associated with adaptive fitness might imply the signatures of
natural selection on the genome.
Identification of putative orthologsWe performed blast searches with the predicted CDSs from C.
hongkongensis against the C. gigas genome to identify the putative
orthologs between the two species. A total of 11,602 pairs of
putative orthologs were identified. After removing the sequences
with Ks.0.1 and the sequences with all nonsynonymous
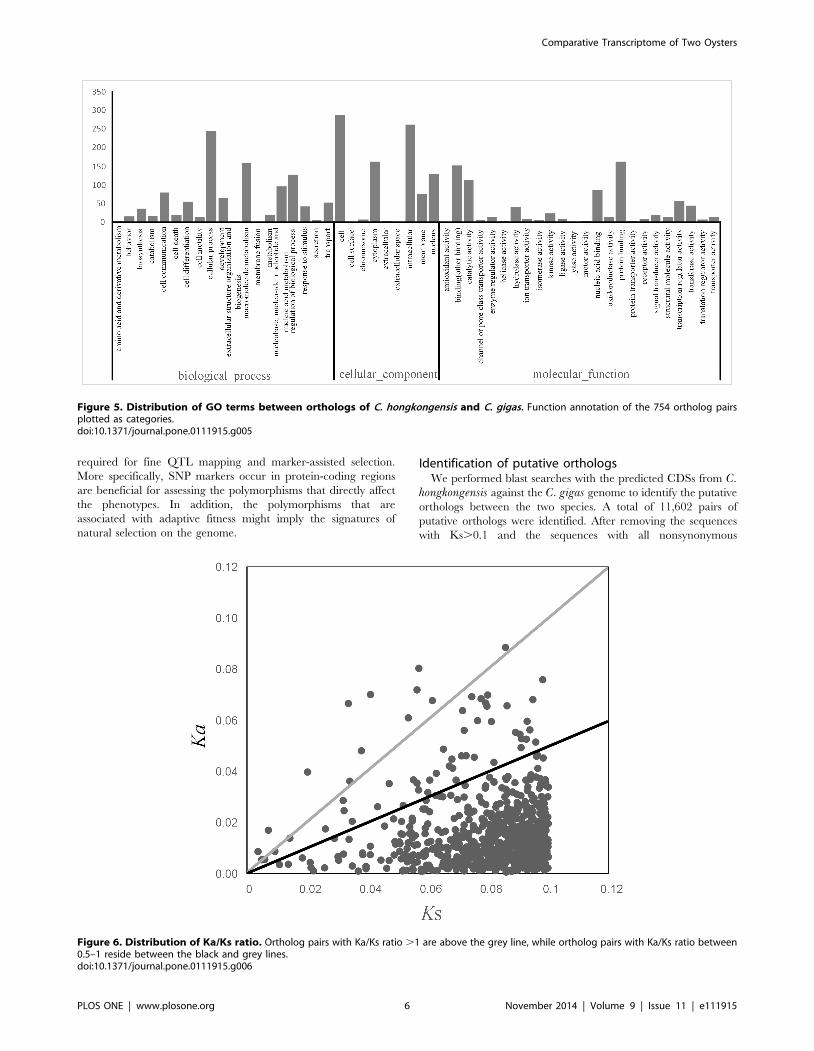
Figure 5. Distribution of GO terms between orthologs of C. hongkongensis and C. gigas. Function annotation of the 754 ortholog pairsplotted as categories.doi:10.1371/journal.pone.0111915.g005
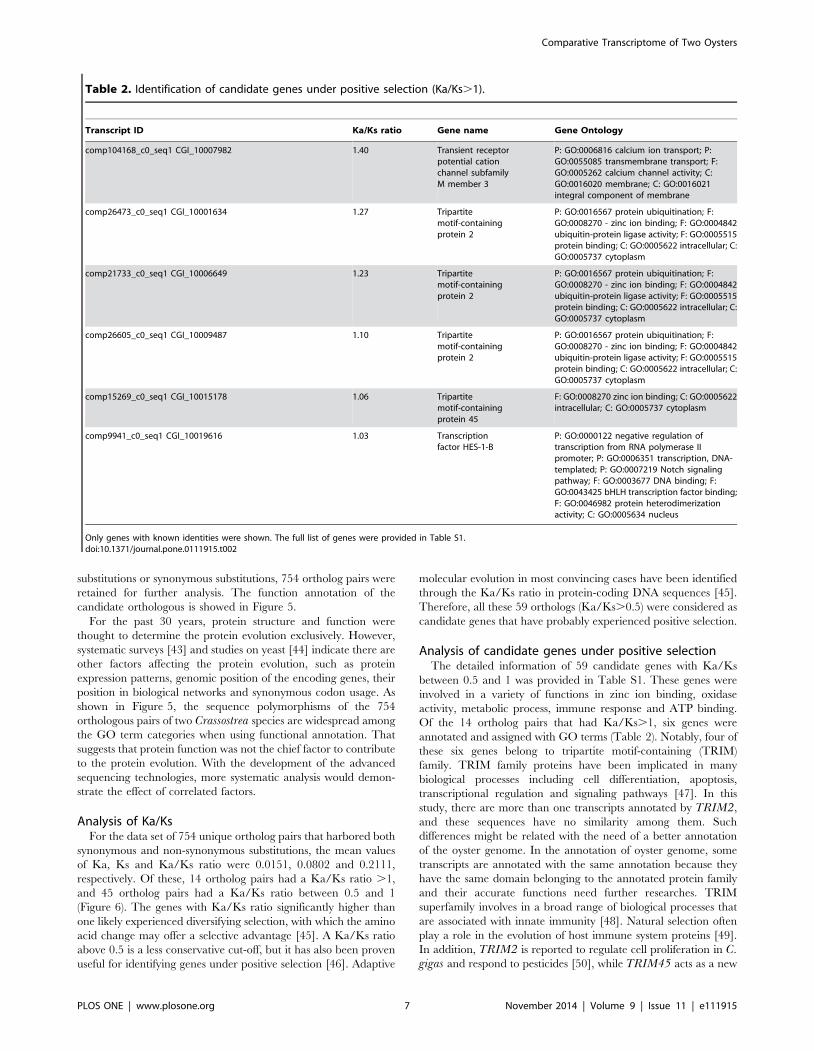
Figure 6. Distribution of Ka/Ks ratio. Ortholog pairs with Ka/Ks ratio .1 are above the grey line, while ortholog pairs with Ka/Ks ratio between0.5–1 reside between the black and grey lines.doi:10.1371/journal.pone.0111915.g006
Comparative Transcriptome of Two Oysters
PLOS ONE | www.plosone.org 6 November 2014 | Volume 9 | Issue 11 | e111915
substitutions or synonymous substitutions, 754 ortholog pairs were
retained for further analysis. The function annotation of the
candidate orthologous is showed in Figure 5.
For the past 30 years, protein structure and function were
thought to determine the protein evolution exclusively. However,
systematic surveys [43] and studies on yeast [44] indicate there are
other factors affecting the protein evolution, such as protein
expression patterns, genomic position of the encoding genes, their
position in biological networks and synonymous codon usage. As
shown in Figure 5, the sequence polymorphisms of the 754
orthologous pairs of two Crassostrea species are widespread among
the GO term categories when using functional annotation. That
suggests that protein function was not the chief factor to contribute
to the protein evolution. With the development of the advanced
sequencing technologies, more systematic analysis would demon-
strate the effect of correlated factors.
Analysis of Ka/KsFor the data set of 754 unique ortholog pairs that harbored both
synonymous and non-synonymous substitutions, the mean values
of Ka, Ks and Ka/Ks ratio were 0.0151, 0.0802 and 0.2111,
respectively. Of these, 14 ortholog pairs had a Ka/Ks ratio .1,
and 45 ortholog pairs had a Ka/Ks ratio between 0.5 and 1
(Figure 6). The genes with Ka/Ks ratio significantly higher than
one likely experienced diversifying selection, with which the amino
acid change may offer a selective advantage [45]. A Ka/Ks ratio
above 0.5 is a less conservative cut-off, but it has also been proven
useful for identifying genes under positive selection [46]. Adaptive
molecular evolution in most convincing cases have been identified
through the Ka/Ks ratio in protein-coding DNA sequences [45].
Therefore, all these 59 orthologs (Ka/Ks.0.5) were considered as
candidate genes that have probably experienced positive selection.
Analysis of candidate genes under positive selectionThe detailed information of 59 candidate genes with Ka/Ks
between 0.5 and 1 was provided in Table S1. These genes were
involved in a variety of functions in zinc ion binding, oxidase
activity, metabolic process, immune response and ATP binding.
Of the 14 ortholog pairs that had Ka/Ks.1, six genes were
annotated and assigned with GO terms (Table 2). Notably, four of
these six genes belong to tripartite motif-containing (TRIM)
family. TRIM family proteins have been implicated in many
biological processes including cell differentiation, apoptosis,
transcriptional regulation and signaling pathways [47]. In this
study, there are more than one transcripts annotated by TRIM2,
and these sequences have no similarity among them. Such
differences might be related with the need of a better annotation
of the oyster genome. In the annotation of oyster genome, some
transcripts are annotated with the same annotation because they
have the same domain belonging to the annotated protein family
and their accurate functions need further researches. TRIM
superfamily involves in a broad range of biological processes that
are associated with innate immunity [48]. Natural selection often
play a role in the evolution of host immune system proteins [49].
In addition, TRIM2 is reported to regulate cell proliferation in C.gigas and respond to pesticides [50], while TRIM45 acts as a new
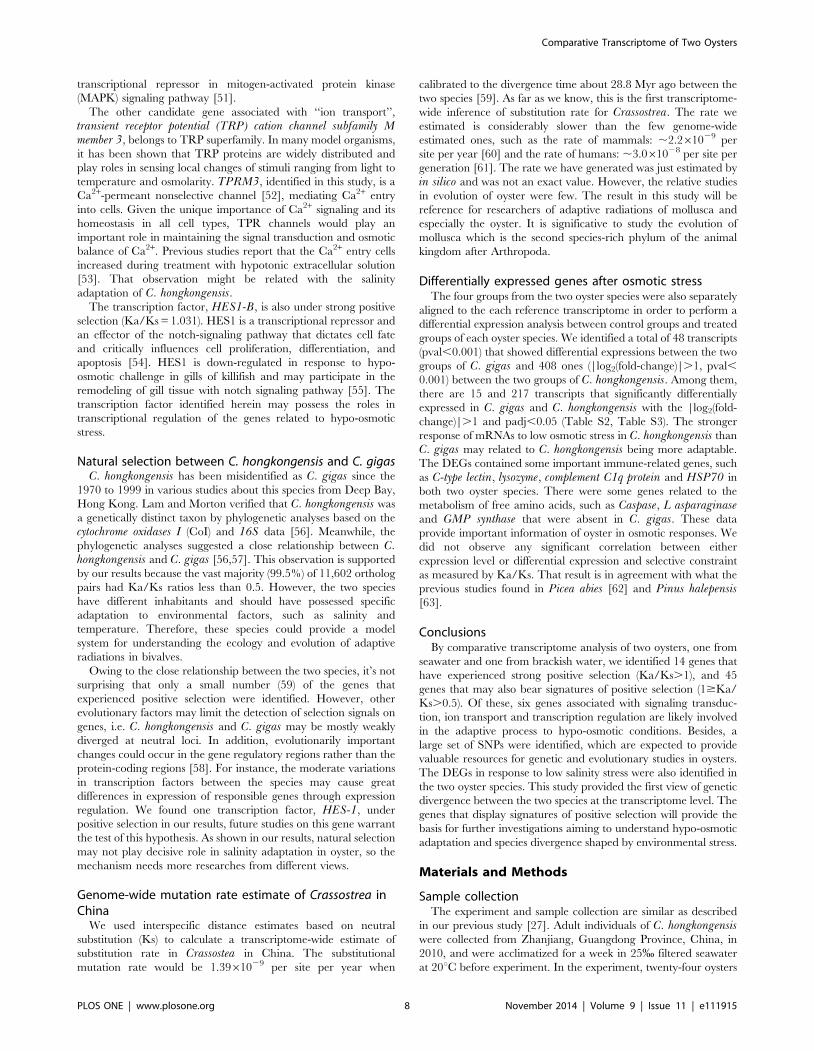
Table 2. Identification of candidate genes under positive selection (Ka/Ks.1).
Transcript ID Ka/Ks ratio Gene name Gene Ontology
comp104168_c0_seq1 CGI_10007982 1.40 Transient receptorpotential cationchannel subfamilyM member 3
P: GO:0006816 calcium ion transport; P:GO:0055085 transmembrane transport; F:GO:0005262 calcium channel activity; C:GO:0016020 membrane; C: GO:0016021integral component of membrane
comp26473_c0_seq1 CGI_10001634 1.27 Tripartitemotif-containingprotein 2
P: GO:0016567 protein ubiquitination; F:GO:0008270 - zinc ion binding; F: GO:0004842ubiquitin-protein ligase activity; F: GO:0005515protein binding; C: GO:0005622 intracellular; C:GO:0005737 cytoplasm
comp21733_c0_seq1 CGI_10006649 1.23 Tripartitemotif-containingprotein 2
P: GO:0016567 protein ubiquitination; F:GO:0008270 - zinc ion binding; F: GO:0004842ubiquitin-protein ligase activity; F: GO:0005515protein binding; C: GO:0005622 intracellular; C:GO:0005737 cytoplasm
comp26605_c0_seq1 CGI_10009487 1.10 Tripartitemotif-containingprotein 2
P: GO:0016567 protein ubiquitination; F:GO:0008270 - zinc ion binding; F: GO:0004842ubiquitin-protein ligase activity; F: GO:0005515protein binding; C: GO:0005622 intracellular; C:GO:0005737 cytoplasm
comp15269_c0_seq1 CGI_10015178 1.06 Tripartitemotif-containingprotein 45
F: GO:0008270 zinc ion binding; C: GO:0005622intracellular; C: GO:0005737 cytoplasm
comp9941_c0_seq1 CGI_10019616 1.03 Transcriptionfactor HES-1-B
P: GO:0000122 negative regulation oftranscription from RNA polymerase IIpromoter; P: GO:0006351 transcription, DNA-templated; P: GO:0007219 Notch signalingpathway; F: GO:0003677 DNA binding; F:GO:0043425 bHLH transcription factor binding;F: GO:0046982 protein heterodimerizationactivity; C: GO:0005634 nucleus
Only genes with known identities were shown. The full list of genes were provided in Table S1.doi:10.1371/journal.pone.0111915.t002
Comparative Transcriptome of Two Oysters
PLOS ONE | www.plosone.org 7 November 2014 | Volume 9 | Issue 11 | e111915
transcriptional repressor in mitogen-activated protein kinase
(MAPK) signaling pathway [51].
The other candidate gene associated with ‘‘ion transport’’,
transient receptor potential (TRP) cation channel subfamily Mmember 3, belongs to TRP superfamily. In many model organisms,
it has been shown that TRP proteins are widely distributed and
play roles in sensing local changes of stimuli ranging from light to
temperature and osmolarity. TPRM3, identified in this study, is a
Ca2+-permeant nonselective channel [52], mediating Ca2+ entry
into cells. Given the unique importance of Ca2+ signaling and its
homeostasis in all cell types, TPR channels would play an
important role in maintaining the signal transduction and osmotic
balance of Ca2+. Previous studies report that the Ca2+ entry cells
increased during treatment with hypotonic extracellular solution
[53]. That observation might be related with the salinity
adaptation of C. hongkongensis.The transcription factor, HES1-B, is also under strong positive
selection (Ka/Ks = 1.031). HES1 is a transcriptional repressor and
an effector of the notch-signaling pathway that dictates cell fate
and critically influences cell proliferation, differentiation, and
apoptosis [54]. HES1 is down-regulated in response to hypo-
osmotic challenge in gills of killifish and may participate in the
remodeling of gill tissue with notch signaling pathway [55]. The
transcription factor identified herein may possess the roles in
transcriptional regulation of the genes related to hypo-osmotic
stress.
Natural selection between C. hongkongensis and C. gigasC. hongkongensis has been misidentified as C. gigas since the
1970 to 1999 in various studies about this species from Deep Bay,
Hong Kong. Lam and Morton verified that C. hongkongensis was
a genetically distinct taxon by phylogenetic analyses based on the
cytochrome oxidases I (CoI) and 16S data [56]. Meanwhile, the
phylogenetic analyses suggested a close relationship between C.hongkongensis and C. gigas [56,57]. This observation is supported
by our results because the vast majority (99.5%) of 11,602 ortholog
pairs had Ka/Ks ratios less than 0.5. However, the two species
have different inhabitants and should have possessed specific
adaptation to environmental factors, such as salinity and
temperature. Therefore, these species could provide a model
system for understanding the ecology and evolution of adaptive
radiations in bivalves.
Owing to the close relationship between the two species, it’s not
surprising that only a small number (59) of the genes that
experienced positive selection were identified. However, other
evolutionary factors may limit the detection of selection signals on
genes, i.e. C. hongkongensis and C. gigas may be mostly weakly
diverged at neutral loci. In addition, evolutionarily important
changes could occur in the gene regulatory regions rather than the
protein-coding regions [58]. For instance, the moderate variations
in transcription factors between the species may cause great
differences in expression of responsible genes through expression
regulation. We found one transcription factor, HES-1, under
positive selection in our results, future studies on this gene warrant
the test of this hypothesis. As shown in our results, natural selection
may not play decisive role in salinity adaptation in oyster, so the
mechanism needs more researches from different views.
Genome-wide mutation rate estimate of Crassostrea inChina
We used interspecific distance estimates based on neutral
substitution (Ks) to calculate a transcriptome-wide estimate of
substitution rate in Crassostea in China. The substitutional
mutation rate would be 1.3961029 per site per year when
calibrated to the divergence time about 28.8 Myr ago between the
two species [59]. As far as we know, this is the first transcriptome-
wide inference of substitution rate for Crassostrea. The rate we
estimated is considerably slower than the few genome-wide
estimated ones, such as the rate of mammals: ,2.261029 per
site per year [60] and the rate of humans: ,3.061028 per site per
generation [61]. The rate we have generated was just estimated by
in silico and was not an exact value. However, the relative studies
in evolution of oyster were few. The result in this study will be
reference for researchers of adaptive radiations of mollusca and
especially the oyster. It is significative to study the evolution of
mollusca which is the second species-rich phylum of the animal
kingdom after Arthropoda.
Differentially expressed genes after osmotic stressThe four groups from the two oyster species were also separately
aligned to the each reference transcriptome in order to perform a
differential expression analysis between control groups and treated
groups of each oyster species. We identified a total of 48 transcripts
(pval,0.001) that showed differential expressions between the two
groups of C. gigas and 408 ones (|log2(fold-change)|.1, pval,
0.001) between the two groups of C. hongkongensis. Among them,
there are 15 and 217 transcripts that significantly differentially
expressed in C. gigas and C. hongkongensis with the |log2(fold-
change)|.1 and padj,0.05 (Table S2, Table S3). The stronger
response of mRNAs to low osmotic stress in C. hongkongensis than
C. gigas may related to C. hongkongensis being more adaptable.
The DEGs contained some important immune-related genes, such
as C-type lectin, lysozyme, complement C1q protein and HSP70 in
both two oyster species. There were some genes related to the
metabolism of free amino acids, such as Caspase, L asparaginaseand GMP synthase that were absent in C. gigas. These data
provide important information of oyster in osmotic responses. We
did not observe any significant correlation between either
expression level or differential expression and selective constraint
as measured by Ka/Ks. That result is in agreement with what the
previous studies found in Picea abies [62] and Pinus halepensis[63].
ConclusionsBy comparative transcriptome analysis of two oysters, one from
seawater and one from brackish water, we identified 14 genes that
have experienced strong positive selection (Ka/Ks.1), and 45
genes that may also bear signatures of positive selection (1$Ka/
Ks.0.5). Of these, six genes associated with signaling transduc-
tion, ion transport and transcription regulation are likely involved
in the adaptive process to hypo-osmotic conditions. Besides, a
large set of SNPs were identified, which are expected to provide
valuable resources for genetic and evolutionary studies in oysters.
The DEGs in response to low salinity stress were also identified in
the two oyster species. This study provided the first view of genetic
divergence between the two species at the transcriptome level. The
genes that display signatures of positive selection will provide the
basis for further investigations aiming to understand hypo-osmotic
adaptation and species divergence shaped by environmental stress.
Materials and Methods
Sample collectionThe experiment and sample collection are similar as described
in our previous study [27]. Adult individuals of C. hongkongensiswere collected from Zhanjiang, Guangdong Province, China, in
2010, and were acclimatized for a week in 25% filtered seawater
at 20uC before experiment. In the experiment, twenty-four oysters
Comparative Transcriptome of Two Oysters
PLOS ONE | www.plosone.org 8 November 2014 | Volume 9 | Issue 11 | e111915
were individually tagged and randomly divided into two groups.
One was the control group (HC) which was kept in optimal salinity
filtered seawater (25%); the other was the treatment group (HT)
which was exposed to the simulated conditions of increased fresh
water input (8%). In order to ensure the free exchange of seawater
between the inside and outside of the shell, a part of the shell edge
(about 10 mm long and 5 mm wide) of each specimen was
chipped away. After 8 hours, six oysters from each group were
randomly selected for sample collection. The gill tissues from two
groups were dissected and saved in RNA store (Dongsheng
Biotech) for RNA extraction, respectively.
RNA isolationTotal RNA was extracted using the TRIzol reagent according
to the manufacturer’s instructions (Invitrogen). The quantity and
quality of total RNA were assessed using NanoDrop (Thermo
Fisher Scientific) and Agilent 2100 BioAnalyzer (Agilent Technol-
ogies). After that, the total RNA was treated with Dnase I
(Ambion) following the manufacturer’s protocol. The Poly (A)
mRNA was enriched from each total RNA sample using
MicroPoly(A)-PuristTM Kit (Ambion) according to manufacturer’s
instructions. Equal amount of high-quality mRNA from each
individual of the same group were pooled for sequencing.
High-throughput sequencingcDNA libraries were prepared following the protocol described
in [64]. Briefly, first-strand cDNAs were synthesized using
SuperScript II reverse transcriptase (Invitrogen) with an oli-
go(dT)-adapter primer. Second-strand synthesis was performed
with Ex Taq polymerase (Takara). The synthetic cDNA was
fragmented to 300–500 bp by a UTR200 sonication device
(Hielscher Ultrasonics GmbH), and was purified using AMpure
beads (Agencourt). This was followed by amplifying with TruSeq
PE cluster kit v3-cBot-HS (Illumina) and constructing libraries
with TruSeqTM DNA sample prep kit-set A (Illumina) according
to the manufacturer’s instructions. High-throughput sequencing
was conducted using Illumina HiSeqTM 2000 platform to generate
100-bp paired-end reads.
Transcriptome analysisRaw data generated from Illumina sequencing were trimmed by
removing adapter sequences, reads with unknown base calls (Ns)
more than 5%, low quality reads (the proportion of low-quality
bases (Q,5) more than 50%), and reads with length less than
20 bp. The de novo transcriptome assembly was carried out with
Trinity program, a short read assembler [65]. These high-quality
reads have been deposited in the NCBI GEO database with the
accession number GSE51157.
The protein-coding sequences were predicted from the assem-
bled sequences by getorf program from EMBOSS package [66].
For the gene annotation, the predicted protein-coding sequences
were searched against the C. gigas genome, the Swiss-Prot
database and the NCBI no-redundant (Nr) protein database using
Blastp with an E-value of 1e–5. To increase computational speed,
all Blast searches were limited to the top 10 significant hits for each
query. Gene identity was assigned to each protein sequence based
on the best BLAST hit (with highest bit-score).
For gene ontology analysis, the outputs from the Blastp were
imported into GoPipe software [67] to retrieve GO terms at level
2. These GO terms assigned to query protein sequences provide a
broad view of genes cataloged with each of the three ontology
vocabularies, including biological processes, molecular functions
and cellular components. KEGG pathways were analyzed using
the online KEGG Automatic Annotation Sever (Kyoto encyclo-
pedia of genes and genomes, http://www.genome.jp/kegg/kaas/)
using bi-directional best-hit method (BBH) [13].
SNP discoveryTo identify SNPs from C. hongkongensis transcriptome, the
clean data from HC and HT groups were mapped against the
de novo assembled transcript sequences using the program BWA
[68] with default setting. Similarly, the clean data from C. gigaswere mapped against the genome of C. gigas [15] using the
program BWA for identification of SNPs from C. gigas. The
alignment output from read mapping was then sorted and
removed duplicate reads using Picard (http://picard.sourceforge.
net/) command line tools. The alignment files were indexed with
SAMtools [69] and the dictionary of reference sequences were
made using the Picard. The SNP calling was performed with the
Genome Analysis Toolkit (GATK 2.7) [70]. High-quality variants
were called with Unified Genotyper using a minimum Phred
quality score of 30 [71]. The identified SNPs were further filtered
using the following criteria: (1) the SNPs were discovered from
both groups; (2) the read coverage was at least 5 reads; (3) the
minor allele frequency was at least 20%.
Identification of orthologsWe used the bidirectional best hit method to identify putative
orthologs between the two species using tblastx with the bit-score
threshold of 300 [46]. To avoid the inclusion of paralogs, we only
retained those ortholog pairs that matched the same proteins by
BlastX searches. Coding sequences (CDSs) of the filtered
orthologous gene pairs were determined based on the prediction
output of getorf as mentioned above after removal of CDSs with
unexpected stop codons. The filtered CDSs of orthologous gene
pairs were then aligned by ClustalW 2.1 [72] for downstream
analysis.
Test for positive selectionsThe ratio of the number of nonsynonymous substitutions per
nonsynonymous site (Ka) to the number of synonymous substitu-
tions per synonymous site (Ks) was used to test for positive
selection. We estimated the rate of Ka to Ks between putatively
orthologous coding regions based on the maximum-likelihood
method [73] using KaKs_Calculator 2.0 with the YN model [74].
The orthologs with a Ks rate .0.1 were excluded from further
analysis to avoid inclusion of paralogs [46].
Estimating the overall substitutional mutation rateWe estimated an overall substitutional mutation rate for the
Crassostrea based on divergence between orthologous pairs and
synonymous mutations calibrated with the estimated divergence
time [59]. The rate (r) (in substitutions/site/year) is calculated
from the mean genetic distance (d) between two species (2t), while
d for coding regions is based on the Ks rate [46].
Differentially expressed genesThe unigene expression was calculated using RSEM [75]. Then
the DESeq R package [76] was employed to identify up-regulated
and down-regulated genes between the control and treated groups
of both two oyster species. As only two groups of each species were
used in analysis of differential expression (no biological replicates),
results have to be interpreted with caution. Normalization was
made using size factors after calculation of relative library sizes as
manual suggestion.
Comparative Transcriptome of Two Oysters
PLOS ONE | www.plosone.org 9 November 2014 | Volume 9 | Issue 11 | e111915
Supporting Information
Table S1 Putative orthologous genes with Ka/Ks.0.5.
(XLSX)
Table S2 Differentially expressed genes with annotation of
Crassostrea hongkongensis. HT: genes were only found in the HT
group; HC: genes were only found in the HC group; *: padj.0.05.
(XLSX)
Table S3 Differentially expressed genes with annotation of
Crassostrea gigas. PT: genes were only found in the PT group; PC:
genes were only found in the PC group; *: padj.0.05.
(XLSX)
Author Contributions
Conceived and designed the experiments: XZ QL HY. Performed the
experiments: XZ. Analyzed the data: XZ. Contributed reagents/materials/
analysis tools: XZ QL HY LK. Contributed to the writing of the
manuscript: XZ SL QL.
References
1. Linse K, Griffiths HJ, Barnes DKA, Clarke A (2006) Biodiversity and
biogeography of Antarctic and sub-Antarctic mollusca. Deep Sea ResearchPart II: Topical Studies in Oceanography 53: 985–1008.
2. Bettencourt R, Pinheiro M, Egas C, Gomes P, Afonso M, et al. (2010) High-throughput sequencing and analysis of the gill tissue transcriptome from the
deep-sea hydrothermal vent mussel Bathymodiolus azoricus. BMC genomics 11:
559.
3. Li Q, Zhao X, Kong L, Yu H (2013) Transcriptomic response to stress in marine
bivalves. ISJ 10: 84–93.
4. Warwick RM, Turk SM (2002) Predicting climate change effects on marinebiodiversity: comparison of recent and fossil molluscan death assemblages. J Mar
Biol Assoc UK 82: 847–850.
5. Brandt A, Gooday AJ, Brandao SN, Brix S, Brokeland W, et al. (2007) First
insights into the biodiversity and biogeography of the Southern Ocean deep sea.
Nature 447: 307–311.
6. Williams GC (2008) Adaptation and natural selection: a critique of some current
evolutionary thought. USA: Princeton University Press.
7. Smith NGC, Eyre-Walker A (2002) Adaptive protein evolution in Drosophila.Nature 415: 1022–1024.
8. Colosimo PF, Hosemann KE, Balabhadra S, Villarreal G, Dickson M, et al.(2005) Widespread parallel evolution in sticklebacks by repeated fixation of
ectodysplasin alleles. Science 307: 1928–1933.
9. Hoekstra HE, Hirschmann RJ, Bundey RA, Insel PA, Crossland JP (2006) Asingle amino acid mutation contributes to adaptive beach mouse color pattern.
Science 313: 101–104.
10. Miller CT, Beleza S, Pollen AA, Schluter D, Kittles RA, et al. (2007) cis-
Regulatory changes in kit ligand expression and parallel evolution of
pigmentation in sticklebacks and humans. Cell 131: 1179–1189.
11. Schuster SC (2007) Next-generation sequencing transforms today’s biology. Nat
Methods 200: 16–18.
12. Wang Z, Gerstein M, Snyder M (2009) RNA-Seq: a revolutionary tool fortranscriptomics. Nat Rev Genet 10: 57–63.
13. Kanehisa M, Goto S, Furumichi M, Tanabe M, Hirakawa M (2010) KEGG forrepresentation and analysis of molecular networks involving diseases and drugs.
Nucleic Acids Res 38: D355–D360.
14. Kobayashi MJ, Takeuchi Y, Kenta T, Kume T, Diway B, et al. (2013) Massflowering of the tropical tree Shorea beccariana was preceded by expression
changes in flowering and drought-responsive genes. Mol Ecol 22: 4767–4782.
15. Zhang G, Fang X, Guo X, Li L, Luo R, et al. (2012) The oyster genome reveals
stress adaptation and complexity of shell formation. Nature 490: 40–54.
16. Hanelt B, Lun CM, Adema CM (2008) Comparative ORESTES-sampling oftranscriptomes of immune-challenged Biomphalaria glabrata snails. J Invertebr
Pathol 99: 192–203.
17. Ewen-Campen B, Shaner N, Panfilio KA, Suzuki Y, Roth S, et al. (2011) Thematernal and early embryonic transcriptome of the milkweed bug Oncopeltusfasciatus. BMC Genomics 12: 61.
18. Riesgo A, Andrade SCS, Sharma PP, Novo M, Perez-Porro AR, et al. (2012)
Comparative description of ten transcriptomes of newly sequenced invertebrates
and efficiency estimation of genomic sampling in non-model taxa. Front Zool 9:33.
19. Huan P, Wang H, Liu B (2012) Transcriptomic analysis of the clam Meretrixmeretrix on different larval stages. Mar Biotechnol 14: 69–78.
20. Lockwood BL, Sanders JG, Somero GN (2010) Transcriptomic responses to heat
stress in invasive and native blue mussels (genus Mytilus): molecular correlates ofinvasive success. J Exp Biol 213: 3548–3558.
21. Chapman RW, Mancia A, Beal M, Veloso A, Rathburn C, et al. (2011) Thetranscriptomic responses of the eastern oyster, Crassostrea virginica, to
environmental conditions. Mol Ecol 20: 1431–1449.
22. Zhou ZC, Dong Y, Sun HJ, Yang AF, Chen Z, et al. (2013) Transcriptomesequencing of sea cucumber (Apostichopus japonicus) and the identification of
gene-associated markers. Mol Ecol Resour 14: 127–138.
23. Liu S, Zhou Z, Lu J, Sun F, Wang S, et al. (2011) Generation of genome-scalegene-associated SNPs in catfish for the construction of a high-density SNP array.
BMC Genomics 12: 53.
24. Montes I, Conklin D, Albaina A, Creer S, Carvalho GR, et al. (2013) SNP
discovery in European anchovy (Engraulis encrasicolus, L) by high-throughput
transcriptome and genome sequencing. Plos One 8: e70051.
25. Avarre JC, Dugue R, Alonso P, Diombokho A, Joffrois C, et al. (2013) Analysis
of the black-chinned tilapia Sarotherodon melanotheron heudelotii reproducing
under a wide range of salinities: from RNA-seq to candidate genes. Mol Ecol
Resour 14: 139–149.
26. Liu S, Zhang Y, Zhou Z, Waldbieser G, Sun F, et al. (2012) Efficient assembly
and annotation of the transcriptome of catfish by RNA-Seq analysis of a doubled
haploid homozygote. BMC Genomics 13: 595.
27. Zhao X, Yu H, Kong L, Li Q (2012) Transcriptomic Responses to Salinity Stress
in the Pacific Oyster Crassostrea gigas. Plos One 7: e46244.
28. Hendre PS, Kamalakannan R, Varghese M (2012) High-throughput and
parallel SNP discovery in selected candidate genes in Eucalyptus camaldulensisusing Illumina NGS platform. Plant Biotechnology J 10: 646–656.
29. Limborg MT, Helyar SJ, de Bruyn M, Taylor MI, Nielsen EE, et al. (2012)
Environmental selection on transcriptome-derived SNPs in a high gene flow
marine fish, the Atlantic herring (Clupea harengus). Mol Ecol 21: 3686–3703.
30. Guo XM, Wang YP, Wang LL, Lee J (2008) Oysters. In Genome mapping and
genomics in fishes and aquatic animals. Edited by Kocher TD and Kole C.
USA: Springer 163–175.
31. Wang H, Guo X (2008) Identification of Crassostrea ariakensis and related
oysters by multiplex species-specific PCR. J Shellfish Res 27: 481–487.
32. Pauley GB, Van Der Raay B, Troutt D (1988) Species profiles: life histories and
environmental requirements of coastal fishes and invertebrates (Pacific
Northwest), Pacific oyster. In Fish and Wildlife Service Biological Report. San
Francisco: US Fish and Wildlife Service.
33. Lam K, Morton B (2004) The oysters of Hong Kong (Bivalvia: Ostreidae and
Gryphaeidae). Raffles B Zool 52: 11–28.
34. Liu F, Rainbow PS, Wang W (2013) Inter-site differences of zinc susceptibility of
the oyster Crassostrea hongkongensis. Aquat Toxicol 132: 26–33.
35. Qin J, Huang Z, Chen J, Zou Q, You W, et al. (2012) Sequencing and de novo
analysis of Crassostrea angulata (Fujian Oyster) from 8 different developing
phases using 454 GSFlx. PloS one 7: e43653.
36. Wang S, Hou R, Bao Z, Du H, He Y, et al. (2013) Transcriptome sequencing of
Zhikong Scallop (Chlamys farreri) and comparative transcriptome analysis with
Yesso Scallop (Patinopecten yessoensis). Plos One 8: e63927.
37. Liu S, Wang X, Sun F, Zhang J, Feng J, et al. (2013) RNA-Seq reveals
expression signatures of genes involved in oxygen transport, protein synthesis,
folding, and degradation in response to heat stress in catfish. Physiol Genomics
45: 462–476.
38. Ashburner M, Ball CA, Blake JA, Botstein D, Butler H, et al. (2000) Gene
Ontology: tool for the unification of biology. Nat Genet 25: 25–29.
39. Kanehisa M, Goto S (2000) KEGG: kyoto encyclopedia of genes and genomes.
Nucleic Acids Res 28: 27–30.
40. Gut IG, Lathrop GM (2004) Duplicating SNPs. Nat Genet 36: 789–790.
41. Trick M, Long Y, Meng J, Bancroft I (2009) Single nucleotide polymorphism
(SNP) discovery in the polyploid Brassica napus using Solexa transcriptome
sequencing. Plant Biotechnol J 7: 334–346.
42. Tassell CPV, Smith TPL, Matukumalli LK, Taylor JF, Schnabel RD, et al.
(2008) SNP discovery and allele frequency estimation by deep sequencing of
reduced representation libraries. Nature 5: 247–252.
43. Pal C, Papp B, Lercher MJ (2006) An integrated view of protein evolution. Nat
Rev Genet 7: 337–348.
44. McInerney JO (2006) The causes of protein evolutionary rate variation. Trends
Ecol Evol 21: 230–232.
45. Yang Z, Bielawski JP (2000) Statistical methods for detecting molecular
adaptation. Trends Ecol Evol 15: 496–503.
46. Elmer KR, Fan S, Gunter HM, Jones JC, Boekhoff S, et al. (2010) Rapid
evolution and selection inferred from the transcriptomes of sympatric crater lake
cichlid fishes. Mol Ecol 19 Suppl 1: 197–211.
47. Ozato K, Shin DM, Chang T-H, Morse HC (2008) TRIM family proteins and
their emerging roles in innate immunity. Nat Rev Immunol 8: 849–860.
48. Rajsbaum R, Stoye J, O’Garra A (2008) Type I interferon-dependent and-
independent expression of tripartite motif proteins in immune cells. Eur -
J Immunol 38: 619–630.
49. Schlenke TA, Begun DJ (2003) Natural selection drives Drosophila immune
system evolution. Genetics 164: 1471–1480.
Comparative Transcriptome of Two Oysters
PLOS ONE | www.plosone.org 10 November 2014 | Volume 9 | Issue 11 | e111915
50. Tanguy A, Boutet I, Laroche J, Moraga D (2005) Molecular identification and
expression study of differentially regulated genes in the Pacific oyster Crassostreagigas in response to pesticide exposure. FEBS J 272: 390–403.
51. Wang Y, Li Y, Qi X, Yuan W, Ai J, et al. (2004) TRIM45, a novel human
RBCC/TRIM protein, inhibits transcriptional activities of ElK-1 and AP-1.Biochem Bioph Res Co 323: 9–16.
52. Clapham DE, Montell C, Schultz G, Julius D (2003) International Union ofPharmacology. XLIII. Compendium of voltage-gated ion channels: transient
receptor potential channels. Pharmacol Rev 55: 591–596.
53. Grimm C, Kraft R, Sauerbruch S, Schultz G, Harteneck C (2003) Molecularand functional characterization of the melastatin-related cation channel
TRPM3. J Biol Chem 278: 21493–21501.54. Iso T, Kedes L, Hamamori Y (2003) HES and HERP families: multiple effectors
of the Notch signaling pathway. J Cell Physiol 194: 237–255.55. Whitehead A, Roach JL, Zhang S, Galvez F (2012) Salinity-and population-
dependent genome regulatory response during osmotic acclimation in the
killifish (Fundulus heteroclitus) gill. J Exp Biol 215: 1293–1305.56. Lam K, Morton B (2003) Mitochondrial DNA and morphological identification
of a new species of Crassostrea (Bivalvia: Ostreidae) cultured for centuries in thePearl River Delta, Hong Kong, China. Aquaculture 228: 1–13.
57. Wang H, Guo X, Zhang G, Zhang F (2004) Classification of jinjiang oysters
Crassostrea rivularis (Gould, 1861) from China, based on morphology andphylogenetic analysis. Aquaculture 242: 137–155.
58. Prud’homme B, Gompel N, Carroll SB (2007) Emerging principles of regulatoryevolution. P Natl Acad Sci 104: 8605–8612.
59. Ren J, Liu X, Jiang F, Guo X, Liu B (2010) Unusual conservation ofmitochondrial gene order in Crassostrea oysters: evidence for recent speciation in
Asia. BMC Evol Biol 10: 394.
60. Kumar S, Subramanian S (2002) Mutation rates in mammalian genomes. P NatlAca Sci 99: 803–808.
61. Xue Y, Wang Q, Long Q, Ng BL, Swerdlow H, et al. (2009) Human Ychromosome base-substitution mutation rate measured by direct sequencing in a
deep-rooting pedigree. Curr Biol 19: 1453–1457.
62. Chen J, Uebbing S, Gyllenstrand N, Lagercrantz U, Lascoux M, et al. (2012)Sequencing of the needle transcriptome from Norway spruce (Picea abies Karst
L.) reveals lower substitution rates, but similar selective constraints ingymnosperms and angiosperms. BMC Genomics 13: 589.
63. Pinosio S, Gonzalez-Martınez S, Bagnoli F, Cattonaro F, Grivet D, et al. (2014)
First insights into the transcriptome and development of new genomic tools of a
widespread circum-Mediterranean tree species, Pinus halepensis Mill. Mol Ecol
Res 14: 846–856.
64. Ng P, Wei CL, Sung WK, Chiu KP, Lipovich L, et al. (2005) Gene identification
signature (GIS) analysis for transcriptome characterization and genome
annotation. Nat Methods 2: 105–111.
65. Grabherr MG, Haas BJ, Yassour M, Levin JZ, Thompson DA, et al. (2011) Full-
length transcriptome assembly from RNA-Seq data without a reference genome.
Nat Biotechnol 29: 644–652.
66. Rice P, Longden I, Bleasby A (2000) EMBOSS: the European molecular biology
open software suite. Trends in Genetics 16: 276–277.
67. Chen Z, Xue C, Zhu S, Zhou F, Ling XB, et al. (2005) GoPipe: streamlined gene
ontology annotation for batch anonymous sequences with statistics. Prog
Biochem and Biophys 32: 187–190.
68. Li H, Durbin R (2009) Fast and accurate short read alignment with Burrows–
Wheeler transform. Bioinformatics 25: 1754–1760.
69. Li H, Handsaker B, Wysoker A, Fennell T, Ruan J, et al. (2009) The sequence
alignment/map format and SAMtools. Bioinformatics 25: 2078–2079.
70. DePristo MA, Banks E, Poplin R, Garimella KV, Maguire JR, et al. (2011) A
framework for variation discovery and genotyping using next-generation DNA
sequencing data. Nat Genet 43: 491–498.
71. Schunter C, Garza JC, Macpherson E, Pascual M (2013) SNP development
from RNA-seq data in a nonmodel fish: how many individuals are needed for
accurate allele frequency prediction? Mol Ecol Resour 14: 157–165.
72. Larkin M, Blackshields G, Brown N, Chenna R, McGettigan PA, et al. (2007)
Clustal W and Clustal X version 2.0. Bioinformatics 23: 2947–2948.
73. Yang Z, Nielsen R (2000) Estimating synonymous and nonsynonymous
substitution rates under realistic evolutionary models. Mol Biol Evol 17: 32–43.
74. Wang D, Zhang Y, Zhang Z, Zhu J, Yu J (2010) KaKs_Calculator 2.0: a toolkit
incorporating gamma-series methods and sliding window strategies. Genomics,
Proteomics & Bioinformatics 8: 77–80.
75. Li B, Dewey CN (2011) RSEM: accurate transcript quantification from RNA-
Seq data with or without a reference genome. BMC bioinformatics 12: 323.
76. Anders S, Huber W (2010) Differential expression analysis for sequence count
data. Genome Biol 11: R106.
Comparative Transcriptome of Two Oysters
PLOS ONE | www.plosone.org 11 November 2014 | Volume 9 | Issue 11 | e111915

![Evaluating the impact of oyster (Crassostrea virginica ......sediment N cycling, oyster-free cages and cages with adult or juvenile oysters [Crassostrea virginica (Gmelin, 1791)] were](https://static.fdocuments.in/doc/165x107/60c4a8704d94be71f945d9dd/evaluating-the-impact-of-oyster-crassostrea-virginica-sediment-n-cycling.jpg)