Comparative Study of Kinetics of Removal of Fuchsin Basic from Aqueous Solutions Using Biosorbents
13
IOSR Journal of Environmental Science, Toxicology and Food Technology (IOSR-JESTFT) e-ISSN: 2319-2402,p- ISSN: 2319-2399.Volume 9, Issue 4 Ver. I (Apr. 2015), PP 08-20 www.iosrjournals.org DOI: 10.9790/2402-09410820 www.iosrjournals.org 8 | Page Comparative Study of Kinetics of Removal of Fuchsin Basic from Aqueous Solutions Using Biosorbents Satish Patil 1 , Jayesh Patil 2 , Naseema Patel 3 1,2 Department of Chemistry, A.P.ScienceCollege,Nagothane – 402106 (MS), India 3 Department of Chemistry, Yeshwant College, Nanded – 431602 (MS), India. Abstract: Adsorption studies of Fuchsin Basic (FB) on six different agricultural wastes / natural materials were carried out by batch experiments. The parameters studied include initial dye concentration, adsorbent dose, pH, agitation time, agitation speed, particle size of adsorbent and temperature. The best fitting isotherm models were found to be Langmuir and Temkin. The monolayer (maximum) adsorption capacities (q m ) were found between 166.667 to 250 mg/g for adsorbents under study. Among the kinetic models, Lagergen pseudo - second order model best fits the kinetics of adsorption. Intra particle diffusion plot showed boundary layer effect and larger intercepts indicates greater contribution of surface sorption in rate determining step. Adsorption was found to increase on increasing pH, increasing temperature, increasing agitation speed and decreasing particle size. Thermodynamic analysis showed negative values of free energy change indicating adsorption was favourable and spontaneous, small positive values below 40 KJ/mole of enthalpy change indicating endothermic physical adsorption and positive values of entropy change indicating increased disorder and randomness at the solid- solution interface of FB with biosorbents. Adsorption capacity of pineapple peel powder towards FB was found to be more than other adsorbents under study. Keywords:Adsorption isotherm, FuchsinBasic,biosorbents, kinetic and thermodynamic parameters. I. Introduction The discharge of synthetic dyes into wastewaters from the textile industries has raised much concern because of potential health hazards associated with entry of toxic components into the food chains of human and animals. Over 10,000 dyes with an annual production of over 7 × 10 5 metric tons worldwide are commercially available and 5–10% of the dye stuff is lost in the industrial effluents. The coloration of water by the dyes may have an inhibitory effect on photosynthesis, thus affecting aquatic eco-systems. Dyes may also be problematic if they are broken down anaerobically in the sediment as toxic amines which are often produced due to incomplete degradation by bacteria. Some of the dyes or their metabolites are either toxic or mutagenic and carcinogenic. The most popular treatment methods for textile wastewater are combinations of biological treatment, chemical coagulation and activated carbon adsorption [1-2]. Adsorption onto activated carbon is proven to be very effective in treating textile wastes. However, in view of the high cost and associated problems of regeneration, there is a constant search for alternate low cost adsorbents. Such types of adsorbents include coir pith [3], modified clays[4], oxihumolite [5]and fly ash [6]. In the present study removal of fuchsin basic from aqueous solution using some agricultural wastes / solids as adsorbents were investigated. II. Material And Methods 1.1 Adsorbent Adsorbents used in the present study are: 1. Pineapple (Ananascomosus) peel powder(PPP) 2. Mangrove plant (Sonneratiaapetala) fruit powder ( MPFP) 3. Coconut (Cocosnucifera)coir pith (CCP) 4. Mango (Mangiferaindica) leaf powder (MLP) 5. Toor plant (Pisumsativum) leaf powder ( TPLP) 6. Tamarind (Tamarindusindica) fruit shell powder (TFSP) Mature materials of all above biosorbents were collected from Konkan region of Maharashtra state in India and washed thoroughly with distilled water to remove dust and other impurities. Washed materials were dried for 10 days in sunlight. Dried materials were grounded in a domestic mixer- grinder after removing non required parts separately. After grinding, the powders were again washed and dried. Different sized powders of each adsorbent were sieved through Jayant’s sieves and stored in plastic bottle containers for further use.
-
Upload
iosrjournal -
Category
Documents
-
view
14 -
download
3
description
IOSR Journal of Environmental Science, Toxicology And Food Technology (IOSR-JESTFT) volume.9 issue.4 version.1
Transcript of Comparative Study of Kinetics of Removal of Fuchsin Basic from Aqueous Solutions Using Biosorbents

IOSR Journal of Environmental Science, Toxicology and Food Technology (IOSR-JESTFT)
e-ISSN: 2319-2402,p- ISSN: 2319-2399.Volume 9, Issue 4 Ver. I (Apr. 2015), PP 08-20 www.iosrjournals.org
DOI: 10.9790/2402-09410820 www.iosrjournals.org 8 | Page
Comparative Study of Kinetics of Removal of Fuchsin Basic from
Aqueous Solutions Using Biosorbents
Satish Patil1, Jayesh Patil
2, Naseema Patel
3
1,2Department of Chemistry, A.P.ScienceCollege,Nagothane – 402106 (MS), India 3Department of Chemistry, Yeshwant College, Nanded – 431602 (MS), India.
Abstract: Adsorption studies of Fuchsin Basic (FB) on six different agricultural wastes / natural materials
were carried out by batch experiments. The parameters studied include initial dye concentration, adsorbent
dose, pH, agitation time, agitation speed, particle size of adsorbent and temperature. The best fitting isotherm
models were found to be Langmuir and Temkin. The monolayer (maximum) adsorption capacities (qm) were
found between 166.667 to 250 mg/g for adsorbents under study. Among the kinetic models, Lagergen pseudo -
second order model best fits the kinetics of adsorption. Intra particle diffusion plot showed boundary layer effect
and larger intercepts indicates greater contribution of surface sorption in rate determining step. Adsorption was
found to increase on increasing pH, increasing temperature, increasing agitation speed and decreasing particle
size. Thermodynamic analysis showed negative values of free energy change indicating adsorption was
favourable and spontaneous, small positive values below 40 KJ/mole of enthalpy change indicating endothermic
physical adsorption and positive values of entropy change indicating increased disorder and randomness at the solid- solution interface of FB with biosorbents. Adsorption capacity of pineapple peel powder towards FB was
found to be more than other adsorbents under study.
Keywords:Adsorption isotherm, FuchsinBasic,biosorbents, kinetic and thermodynamic parameters.
I. Introduction The discharge of synthetic dyes into wastewaters from the textile industries has raised much concern
because of potential health hazards associated with entry of toxic components into the food chains of human and
animals. Over 10,000 dyes with an annual production of over 7 × 10⁵ metric tons worldwide are commercially
available and 5–10% of the dye stuff is lost in the industrial effluents. The coloration of water by the dyes may
have an inhibitory effect on photosynthesis, thus affecting aquatic eco-systems. Dyes may also be problematic if they are broken down anaerobically in the sediment as toxic amines which are often produced due to incomplete
degradation by bacteria. Some of the dyes or their metabolites are either toxic or mutagenic and carcinogenic.
The most popular treatment methods for textile wastewater are combinations of biological treatment,
chemical coagulation and activated carbon adsorption [1-2]. Adsorption onto activated carbon is proven to be
very effective in treating textile wastes. However, in view of the high cost and associated problems of
regeneration, there is a constant search for alternate low cost adsorbents. Such types of adsorbents include coir
pith [3], modified clays[4], oxihumolite [5]and fly ash [6].
In the present study removal of fuchsin basic from aqueous solution using some agricultural wastes /
solids as adsorbents were investigated.
II. Material And Methods 1.1 Adsorbent
Adsorbents used in the present study are:
1. Pineapple (Ananascomosus) peel powder(PPP)
2. Mangrove plant (Sonneratiaapetala) fruit powder ( MPFP)
3. Coconut (Cocosnucifera)coir pith (CCP)
4. Mango (Mangiferaindica) leaf powder (MLP)
5. Toor plant (Pisumsativum) leaf powder ( TPLP)
6. Tamarind (Tamarindusindica) fruit shell powder (TFSP)
Mature materials of all above biosorbents were collected from Konkan region of Maharashtra state in India and washed thoroughly with distilled water to remove dust and other impurities. Washed materials were
dried for 10 days in sunlight. Dried materials were grounded in a domestic mixer- grinder after removing non
required parts separately. After grinding, the powders were again washed and dried. Different sized powders of
each adsorbent were sieved through Jayant’s sieves and stored in plastic bottle containers for further use.

Comparative study of kinetics of removal of fuchsin basic from aqueous solutions using biosorbents
DOI: 10.9790/2402-09410820 www.iosrjournals.org 9 | Page
2.2 Dye solution Fuchsin Basic (FB), a basic dye which is mixture of rosaniline and pararoseaniline hydrochlorides. It is
Benzenamine,4-[(4-aminophenyl)(4-amino-2,5-cyclohexadien-1-ylidene)methyl-2-methyl],monohydrochloride. It contains the equivalent of not less than 88 % of rosaniline hydrochloride with molecular formula
C20H19N3.HCl. In dye classification it is classified as C.I.Basic Violet 14 monohydrochoride [632-99-5].
A stock solution of 1000 mg/lwas prepared in double- distilled water and the experimental solutions of
the desired concentration were obtained by successive dilutions.
2.3 Methods:
Standard solution (8 mg/l) of the FB was taken and absorbance was determined at different
wavelengths using Equiptronics single beam u.v. visible spectrophotometer to obtain a plot of absorbance verses
wavelength. The wavelength corresponding to the maximum absorbance (λmax= 550 nm) as determined from
the plot, was noted and this wavelength was used for measuring the absorbance in the present study. pH of
solutions were adjusted using 1M HCl and 1M NaOH by Equiptronics pH- meter.
The efficiency of adsorbents is evaluated by conducting laboratory batch mode studies. Specific
amounts (25mg) of adsorbents were shaken in 25 ml aqueous solution of dye of varying concentration for
different time periods at natural pH (≈ 7) and temperature (≈ 303K). At the end of pre-determined time intervals,
adsorbent was removed by centrifugation at 10000 rpm and supernant was analyzed for the residual
concentration of FB, spectrophotometrically at 550 nm wavelength. Also variation in pH, adsorbent dose, particle size, agitation speed and temperature were studied.
The values of percentage removal and amount of dye adsorbed were calculated using following
relationships:
Percentage removal = [(Ci – Cf) / Ci] × 100
Amount adsorbed = (Ci – Cf )/ m
Where, Ci = Initial dye concentration, Cf = Final dye concentration, m = Mass of adsorbent in g/l.
2.3.1 Effect of contact time
25 mg of adsorbent of ≥ 120 mesh size with 25 ml of dye solution was kept constant for batch
experiments with an initial dye concentration of 150 mg/l were performed at nearly 303K on a oscillator at 230
rpm for 5, 10, 15, 20, 30, 40, 50 and 60 minutes at pH = 7. Then optimum contact time was identified for further batch experimental study.
2.3.2 Effect of adsorbent dosage
Initial dye concentration of 500 mg/l were used in conjunction with adsorbent dose of 1, 2, 3, 4, 5, and
6 g/l. Contact time, pH, agitation speed, temperature and particle size of 30 minutes, 7, 230 rpm, 303K and ≥
120 mesh respectively were kept constant.
2.3.3 Effect of initial dye concentration
Initial dye concentration of 100, 125, 150, 175, 200, 225 and 250 mg/l were used in conjunction with
adsorbent dose of 1 g/l. Contact time, pH, agitation speed, temperature and particle size of 30 minutes, 7, 230
rpm, 303K and ≥ 120 mesh respectively were kept constant.
2.3.4 Effect of pH
Initial pH of dye solutions were adjusted to 3, 4, 6, 7, 8 and 11 for 200 mg/l concentration. Contact
time, adsorbent dose, agitation speed, temperature and particle size of 30 minutes, 1 g/l, 230 rpm, 303K and ≥
120 mesh respectively were kept constant.
2.3.5 Effect of particle size
Three different sized particles of ≥ 120, 120 ≤ 85 and 85 ≤ 60 meshes were used in conjunction with

Comparative study of kinetics of removal of fuchsin basic from aqueous solutions using biosorbents
DOI: 10.9790/2402-09410820 www.iosrjournals.org 10 | Page
200 mg/l dye concentration. Contact time, adsorbent dose, agitation speed, temperature and pH of 60 minutes, 1
g/l, 230 rpm, 303K and 7 respectively were kept constant.
2.3.6 Effect of temperature
303K, 313K and 323K temperatures were used in conjunction with 250 mg/l dye concentration.
Contact time, adsorbent dose, agitation speed, particle size and pH of 60 minutes, 1 g/l, 230 rpm, ≥ 120 mesh
and 7 respectively were kept constant.
2.3.7 Effect of agitation speed
100, 170 and 230 rpm agitation speeds were used in conjunction with initial dye concentration of 175
mg/l. Adsorbent dose, pH, temperature, contact time and particle size of 1 g/l, 7, 303K,60 minutes and ≥ 120
mesh respectively were kept constant.
2.4 Desorption Studies: After adsorption, the adsorbates – loaded adsorbent were separated from the solution by centrifugation
and the supernatant was drained out. The adsorbent was gently washed with water to remove any
unadsorbedadsorbate. Regeneration of adsorbate from the adsorbate – laden adsorbent was carried out using the
desorbing media – distilled water at pH 3, 7 and 11 using dilute solutions of NaOH and HCl. Then they were
agitated for the equilibrium time of respective adsorbate. The desorbed adsorbate in the solution was separated
and analyzed for the residual dyes.
For the desorption studies, dye loaded adsorbents from 100mg/l initial dye concentration were
used.
2.5 COD Determination Studies
COD of each dye before and after adsorption was determined for 100 mg/l initial dye concentration for
the adsorbent with highest adsorbent capacity. Reduction in COD due to removal of dye after adsorption is then tabulated.
III. Results And Discussion 3.1 Effect of contact time
Effect of contact time on adsorption of FB is presented in Fig. 1. Uptake of FB was rapid in first 5
minutes and after 30 minutes amount of dye adsorbed was almost constant. Therefore, further batch experiments
were carried out at 30 minutes optimum contact time.
In first 5 minutes nearly 69.66 to 92.53% of total dye uptake appears to have been adsorbed in this
duration depending upon the adsorption ability of different adsorbents. Later on the process becomes relatively slower and equilibrium conditions are reached within 20 to 30 minutes. Therefore, further batch experiments
were carried out at 30 minutes optimum contact time. At equilibrium % removal increased 81.47 to 96.93 %
depending upon the adsorption ability of different adsorbents. The adsorption capacity of adsorbents was found
to be of the order of PPP > MPFP > CCP > MLP > TPLP > TFSP.
Fig. 1: Effect of contact time on adsorption of FB.
To investigate the mechanism of adsorption, pseudo - first order, pseudo- second order, Natarajan and
Khalaf first order, Bhattacharya and Venkobachar first order models were used.
The Lagergen pseudo- first order rate expression is given as
log (qe- qt) = log qe – (k1 / 2.303) t (1)
Where qe and qt are amounts of dye adsorbed (mg/g) on adsorbent at equilibrium and at time t
0
20
40
60
80
100
120
140
160
0 10 20 30 40 50 60
qt(
mg/g
)
Time (min)
PPPMPFPCCPMLPTPLPTFSP
Comparative study of kinetics of removal of fuchsin basic from aqueous solutions using biosorbents
DOI: 10.9790/2402-09410820 www.iosrjournals.org 11 | Page
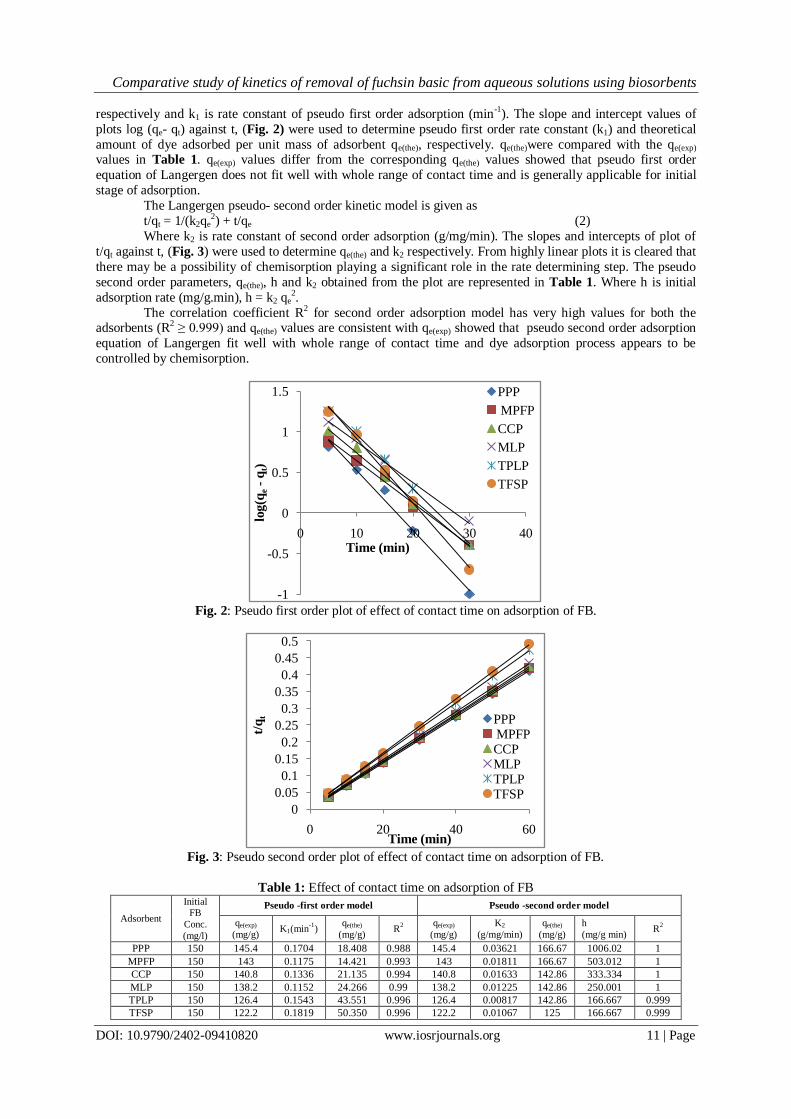
respectively and k1 is rate constant of pseudo first order adsorption (min-1). The slope and intercept values of
plots log (qe- qt) against t, (Fig. 2) were used to determine pseudo first order rate constant (k1) and theoretical
amount of dye adsorbed per unit mass of adsorbent qe(the), respectively. qe(the)were compared with the qe(exp) values in Table 1. qe(exp) values differ from the corresponding qe(the) values showed that pseudo first order
equation of Langergen does not fit well with whole range of contact time and is generally applicable for initial
stage of adsorption.
The Langergen pseudo- second order kinetic model is given as
t/qt = 1/(k2qe2) + t/qe (2)
Where k2 is rate constant of second order adsorption (g/mg/min). The slopes and intercepts of plot of
t/qt against t, (Fig. 3) were used to determine qe(the) and k2 respectively. From highly linear plots it is cleared that
there may be a possibility of chemisorption playing a significant role in the rate determining step. The pseudo
second order parameters, qe(the), h and k2 obtained from the plot are represented in Table 1. Where h is initial
adsorption rate (mg/g.min), h = k2 qe2.
The correlation coefficient R2 for second order adsorption model has very high values for both the adsorbents (R2 ≥ 0.999) and qe(the) values are consistent with qe(exp) showed that pseudo second order adsorption
equation of Langergen fit well with whole range of contact time and dye adsorption process appears to be
controlled by chemisorption.
Fig. 2: Pseudo first order plot of effect of contact time on adsorption of FB.
Fig. 3: Pseudo second order plot of effect of contact time on adsorption of FB.
Table 1: Effect of contact time on adsorption of FB
Adsorbent
Initial FB
Conc.
(mg/l)
Pseudo -first order model Pseudo -second order model
qe(exp)
(mg/g) K1(min
-1)
qe(the)
(mg/g) R
2
qe(exp)
(mg/g)
K2
(g/mg/min)
qe(the)
(mg/g)
h
(mg/g min) R
2
PPP 150 145.4 0.1704 18.408 0.988 145.4 0.03621 166.67 1006.02 1
MPFP 150 143 0.1175 14.421 0.993 143 0.01811 166.67 503.012 1
CCP 150 140.8 0.1336 21.135 0.994 140.8 0.01633 142.86 333.334 1
MLP 150 138.2 0.1152 24.266 0.99 138.2 0.01225 142.86 250.001 1
TPLP 150 126.4 0.1543 43.551 0.996 126.4 0.00817 142.86 166.667 0.999
TFSP 150 122.2 0.1819 50.350 0.996 122.2 0.01067 125 166.667 0.999
-1
-0.5
0
0.5
1
1.5
0 10 20 30 40
log
(qe
-q
t)
Time (min)
PPP
MPFP
CCP
MLP
TPLP
TFSP
0
0.05
0.1
0.15
0.2
0.25
0.3
0.35
0.4
0.45
0.5
0 20 40 60
t/q
t
Time (min)
PPPMPFPCCPMLPTPLPTFSP

Comparative study of kinetics of removal of fuchsin basic from aqueous solutions using biosorbents
DOI: 10.9790/2402-09410820 www.iosrjournals.org 12 | Page
The linearized form of Natarajan and Khalaf first order kinetic equation is presented as
log (Co/Ct) = (K /2.303) t (3)
Where Co and Ct are concentrations of FB (mg/l) at time zero and time t respectively. K is first order adsorption rate constant (min-1) which was calculated from slope of plotlog (Co/Ct) against t, (Fig. 4, Table 2).
The lineaized form of Bhattacharya and Venkobachar first order kinetic equation is presented as
log [ 1 – U(T) ] = - (k /2.303) t (4)
Where U (T) = [(Co-Ct) / (Co-Ce)]
Ce is equilibrium FB concentration (mg/l)
K is first order adsorption rate constant (min-1) which was calculated from slope of plot log [1 –
U(T)]against t, (Fig. 5, Table 2).
Fig. 4: Natarajan and Khalaf first order plot of effect of contact time on adsorption of FB.
Fig. 5: Bhattacharya and Venkobachar first order plot of effect of contact time on adsorption of FB.
Correlation coefficient values were not high for Natarajan and Khalaf first order equation (R2 = 0.818 to 0.92) and does not fit well but for Bhattacharya and Venkobachar first order equation (R2 = 0.98 to 0.996)
values were found high enough and does not fit well at least till attending the equilibrium for adsorption of
FB.Steps involved in sorption of the dye by adsorbent includes transport of solute from aqueous to surface of
solid and diffusion of solute into the interior of pores, which is generally a slow process.According to Weber
and Morris, the intra particle diffusion rate constant (Ki) is given by the following equation
qt = Ki t 1/2 (5)
Ki (mg g-1 min-1/2) values can be determined from the slope of the plots qt against t ½.Fig. 6 showed a
linear relationship after certain time but they do not pass through origin. This is due boundary layer effect. The
larger the intercept, the greater the contribution of surface sorption in rate determining step. The intercepts and
Ki values of plot qt against t 1/2 increased with increase in the initial concentration of dye, (Table 2). Initial
portion is attributed to the liquid film mass transfer and linear portion to the intra particle diffusion. The linearized form of Elovich kinetic equation is presented as
qt =1/ [β ln(αβ)] + ln t /β (6)
Where α and β are the constants calculated from the intercepts and slopes of plots qt against lnt, (Fig.
7, Table 2). α and β values are found to be according to the adsorption capacity of the adsorbent. The better
adsorption has highest value of initial adsorption rate (α) and lowest value of desorption constant (β) and vice
versa. Thus Elovich model also fit well.
0.4
0.6
0.8
1
1.2
1.4
1.6
0 10 20 30 40
log
(Co
/ C
t)
Time (min)
PPP
MPFP
CCP
MLP
TPLP
TFSP
-3.5
-3
-2.5
-2
-1.5
-1
-0.5
0
0 10 20 30 40
log[
1-U
(T)]
Time (min)PPP
MPFP
CCP
MLP
TPLP
TFSP

Comparative study of kinetics of removal of fuchsin basic from aqueous solutions using biosorbents
DOI: 10.9790/2402-09410820 www.iosrjournals.org 13 | Page
Fig. 6: Intra particle diffusion plot of effect of contact time on adsorption of FB.
Fig. 7: Elovich plot of effect of contact time on adsorption of FB.
Table 2: Effect of contact time on adsorption of FB
Adsorbent
Initial
FB
Conc.
(mg/l)
Intra particle diffusion model Elovich Model Natarajan and
Khalaf model
Bhattacharya and
Venkobachar
model
Ki
(mg/g/min1/2
)
A
(mg/g) R
2
Α
(mg/g/min)
β
(g.mg-1
) R
2
K
(min-1
) R
2
K
(min-1) R
2
PPP 150 2.018 135.1 0.91 3.8678 0.2659 0.972 0.0322 0.892 0.1704 0.98
MPFP 150 2.22 131.2 0.944 4.2153 0.2443 0.987 0.0253 0.92 0.1175 0.993
CCP 150 3.143 124.5 0.92 6.1058 0.1718 0.97 0.0276 0.885 0.1336 0.994
MLP 150 3.969 117.1 0.935 7.8097 0.1366 0.979 0.0276 0.905 0.1152 0.99
TPLP 150 5.486 98.31 0.914 11.3845 0.0980 0.972 0.0207 0.869 0.1543 0.996
TFSP 150 5.469 94.79 0.879 11.5123 0.0975 0.952 0.0184 0.818 0.1819 0.996
3.2 Effect of adsorbent dosage
Adsorption of FB was studied by varying the adsorbent dosage. The percentage of adsorption increased
(Fig. 8)but amount adsorbed per unit mass of adsorbent decreased (Fig. 9)with increase in dosage of adsorbent
from 1 to 6 g/l. For above 95% removal of FB from 500 mg/linitial FB concentration, adsorbent dosage of 3, 4,
4, 5 and 6 g/l were needed for PPP, MPFP, CCP, MLP and TPLP respectively, but for TFSP even for 6 g/l
adsorbent dose 95% removal of FB was not observed. It was found that % removal of dye increased but amount of dye adsorbed per unit mass of adsorbent decreased with increased in adsorbent dose from 1 to 6 g/l. As
amount of adsorbent increases, number of active sides available for adsorption also increases thus % removal
also increases but as all active sides may not be available during adsorption due to overlapping between the
active sides themselves and thus amount adsorbed mg/g of adsorbent decreases. The adsorption of dye increased
with the sorbent dosage and reached an equilibrium value after certain sorbent dosage.
90
100
110
120
130
140
150
2 3 4 5 6
qt(m
g/g)
t1/2
PPP MPFPCCP MLPTPLP TFSP
100
110
120
130
140
150
1.5 2 2.5 3 3.5
qt(m
g/g)
ln t
PPP MPFP CCP
MLP TPLP TFSP

Comparative study of kinetics of removal of fuchsin basic from aqueous solutions using biosorbents
DOI: 10.9790/2402-09410820 www.iosrjournals.org 14 | Page
Fig. 8: Effect of adsorbent dosage on adsorption of FB.
Fig. 9: Effect of adsorbent dosage on amount adsorbed of FB (mg/g)
3.3 Effect of initial dye concentration
Amount of FB adsorbed per unit mass of adsorbent increased (Fig. 10) but % removal decreased
(Fig. 11) with increase in initial FB concentration from 100 to 250 mg/ l.
Fig. 10: Effect of initial dye concentration on adsorption of FB.
Fig. 11: Effect of initial dye concentration on % removal of FB.
30405060708090
100
0 1 2 3 4 5 6
% R
em
ova
lDose of adsorbent (g/l)
PPPMPFPCCPMLPTPLPTFSP
0
100
200
300
400
500
0 1 2 3 4 5 6
qe
(mg/
g)
Dose of adsorbent (g/l)
PPPMPFPCCPMLPTPLPTFSP
80
100
120
140
160
180
200
220
50 100 150 200 250
qe
(mg/
g)
Conc. of FB (mg/l)
PPPMPFPCCPMLPTPLPTFSP
50
60
70
80
90
100
50 100 150 200 250
% R
emo
val
Conc. of FB (mg/l)
PPPMPFPCCPMLPTPLPTFSP

Comparative study of kinetics of removal of fuchsin basic from aqueous solutions using biosorbents
DOI: 10.9790/2402-09410820 www.iosrjournals.org 15 | Page
The Freundlich equation was employed for the adsorption of FB onto the adsorbent. The isotherm was
represented by
Log qe = log Kf + 1/n log Ce (7)
Where qe is amount of FB adsorbed at equilibrium (mg/g), Ce is the equilibrium concentration of FB in
solution (mg/l),Kf and n are constant incorporating factors affecting the adsorption capacity and intensity of
adsorption respectively. The plots of log qeagainst log Ce showed good linearity (R2 = 0.976 to 0.989) indicating
the adsorption of FB obeys the Freundlich adsorption isotherm, (Fig. 12). The values of Kf and n are given in
the Table 3.Values of n between 1 to 10 indicate an effective adsorption[10] while higher values of Kf represent
an easy uptake of adsorbate from the solution[9].
The Langmuir isotherm was represented by the following equation
Ce / qe = 1/ (qm b) + Ce /qm (8)
Where qm is monolayer (maximum) adsorption capacity (mg/g) and b is Langmuir constant related to energy of adsorption (1/mg). Linear plots of Ce / qeagainst Ce(R
2= 0.997 to 0.999) suggest the applicability of
the Langmuir isotherms,(Fig. 13). The values of qm and b were determined from slopes and intercepts of the
plot,(Table 3). The essential features of the Langmuir isotherm can be expressed in terms of dimensionless
constant separation factor, RL, which is defined by the following relation given by Hall[11]
RL = 1/ (1+bCo) (9)
Where Co is initial FB concentration (mg/l). RL values lies between 0 to 1 indicates favourable
adsorption,(Table 4).
The Temkin isotherm is given as
qe = B ln A + BlnCe (10)
Where A (1/g) is the equilibrium binding constant, corresponding to the maximum binding energy and constant B is related to heat of adsorption. A linear plots of qe against lnCe, (R
2= 0.992 to 0.999) enables the
determination of the constants B and A from the slope and intercept, (Fig. 14). The results of the plot are given
in Table 3. All the adsorption isotherms fit well for adsorption of FB on the adsorbents under study.
Fig. 12: Freundlich isotherm plot of effect of initial dye concentration on adsorption of FB.
Fig. 13: Langmuir isotherm plot of effect of initial dye concentration on adsorption of FB.

Comparative study of kinetics of removal of fuchsin basic from aqueous solutions using biosorbents
DOI: 10.9790/2402-09410820 www.iosrjournals.org 16 | Page
Fig. 14: Temkin isotherm plot of effect of initial dye concentration on adsorption of FB.
Table 3: Effect of initial dye concentration on adsorption of FB
Adsorbent Freundlich isotherm parameters Langmuir isotherm parameters Temkin isotherm parameters
Kf n R2 qm b R
2 A B R
2
PPP 94.189 3.953 0.989 250 0.364 0.997 8.812 38.84 0.998
MPFP 70.632 3.012 0.98 250 0.19 0.999 2.299 50.2 0.997
CCP 62.517 2.941 0.983 250 0.143 0.998 1.673 50.31 0.998
MLP 54.45 2.857 0.983 250 0.105 0.999 1.197 50.46 0.999
TPLP 51.05 3.676 0.977 200 0.085 0.999 1.543 34.33 0.994
TFSP 55.976 4.525 0.976 166.667 0.107 0.999 3.232 26.47 0.992
Table 4: Dimensionless separation factor (RL) calculated from Langmuir constant (b)
Initial FB
Conc. (mg/l) PPP MPFP CCP MLP TPLP TFSP
100 0.026764 0.04988 0.065419 0.08676 0.105541 0.085368
125 0.021526 0.040306 0.053029 0.070634 0.086253 0.069481
150 0.018003 0.033816 0.044585 0.059563 0.072926 0.058579
175 0.015471 0.029126 0.038461 0.051492 0.063166 0.050634
200 0.013563 0.025578 0.033816 0.045347 0.05571 0.044587
225 0.012075 0.022801 0.030172 0.040513 0.049829 0.03983
250 0.01088 0.02057 0.02724 0.03661 0.04507 0.03599
3.4 Effect of pH
pH is an important factor in controlling the adsorption of dye onto adsorbent. The adsorption of FB
from 200 mg/l concentration on different was studied by varying the pH from 3 to 11. The % removal of FB
increased with increase in pH from 3 to 11, (Fig. 15).
Fig. 15: Effect of pH on adsorption of FB from initial concentration of 200 mg/l.
80
120
160
200
240
0 1 2 3 4 5
qe
(mg/
g)
ln Ce
PPP
MPFP
CCP
MLP
TPLP
TFSP

Comparative study of kinetics of removal of fuchsin basic from aqueous solutions using biosorbents
DOI: 10.9790/2402-09410820 www.iosrjournals.org 17 | Page
3.5 Effect of particle size
Adsorption of FB on three sized particles ≥ 120, 120 ≤ 85 and 85 ≤ 60 mesh of adsorbent was studied
for 200 mg/l concentrations of FB. The results of variation of these particle sizes on dye adsorption are shown in Fig. 16. It can be observed that as the particle size increases the adsorption of dye decreases and hence the
percentage removal of dye also decreases. This is due to larger surface area that is associated with smaller
particles. For larger particles, the diffusion resistance to mass transfer is higher and most of the internal surface
of the particle may not be utilized for adsorption and consequently amount of dye adsorbed is small.
Fig. 16: Effect of particle size on % removal of FB.
3.6 Effect of agitation speed
Sorption is influenced by mass transfer parameters. Fig. 17 illustrates the sorption kinetics of FB from
175 mg/ l initial FB solution by biosorbents for different agitation speeds. The amounts adsorbed at equilibrium
(qe) in mg/g were found to increase with increased in agitation speed from 100, 170 and 230 rpm of an
oscillator. This is because with low agitation speed the greater contact time is required to attend the equilibrium.
With increasing the agitation speed , the rate of diffusion of dye molecules from bulk liquid to the liquid
boundary layer surrounding the particle become higher because of an enhancement of turbulence and a decrease
of thickness of the liquid boundary layer.
Fig. 17: Effect of agitation speed on adsorption of FB.
3.7 Effect of temperature Temperature has important effects on adsorption process. Adsorption of FB at three different
temperatures (303K, 313K and 323K) onto different biosorbents was studied for 250 mg/l initial FB
concentration. The results variations in temperatures on dye adsorption are shown in Fig. 18. It is observed that as the experimental temperature increases from 303K to 323K, the dye adsorption also increases. As the
temperature increases, rate of diffusion of adsorbate molecules across external boundary layer and internal pores
of adsorbent particle increases [7]. Changing the temperature will change the equilibrium capacity of the
adsorbent for particular adsorbate[7-8].
40
50
60
70
80
90
100
PPP MPFP CCP MLP TPLP TFSP
% R
em
ova
l
Adsorbent
≥120 mesh
120≤85mesh
85≤60mesh
40
50
60
70
80
90
100
PPP MPFP CCP MLP TPLP TFSP
% R
em
ova
l
Adsorbent
100 rpm170 rpm230 rpm

Comparative study of kinetics of removal of fuchsin basic from aqueous solutions using biosorbents
DOI: 10.9790/2402-09410820 www.iosrjournals.org 18 | Page
Fig. 18: Effect of temperature on adsorption of FB
Thermodynamic analysis:
Thermodynamic parameters such as change in free energy (∆G) (kJ/mole), enthalpy (∆H) (kJ/mole)
and entropy (∆S) (J/K/mole) were determined using following equations
Ko = Csolid /Cliquid (11)
∆G = -RTlnKo (12)
∆G = ∆H - T∆S
lnKo = -∆G/RT
lnKo = ∆S/R - ∆H/RT (13)
Where Ko is equilibrium constant, Csolid is solid phase concentration at equilibrium (mg/l), Csolid is
liquid phase concentration at equilibrium (mg/l), T is absolute temperature in Kelvin and R is gas constant. ∆G
values obtained from equation (12), ∆H and ∆S values obtained from the slope and intercept of plot lnKo against
1/T,Fig. 19 presented in Table 5. The negative value of ∆G indicates the adsorption is favourable and
spontaneous. ∆G values increased with increase in temperature and decreased with increase in initial concentration of FB. The low positive values of ∆H indicates endothermic nature of adsorption ∆H values were
lie between 11.947 to 26.522 KJ/mole indicates physical adsorption .. The positive values of ∆S indicate the
increased disorder and randomness at the solid solution interface of FB with the adsorbent. The adsorbed water
molecules, which were displaced by adsorbate molecules, gain more translational energy than is lost by the
adsorbate molecules, thus allowing prevalence of randomness in the system. The increase of adsorption capacity
of the adsorbent at higher temperatures was due to enlargement of pore size and activation of adsorbent surface.
Fig. 19: Von’t Hoff plot of effect of temperature on adsorption of FB.
Table 5: Equilibrium constants and thermodynamic parameters for the adsorption of FB
Adsorbent Ko ∆G (kJ/mole)
∆H (kJ/mole) ∆S (J/K/mole) 303K 313K 323K 303K 313K 323K
PPP 6.911 9 13.286 -4.870 -5.718 -6.946 26.522 103.343
MPFP 6.353 7.929 10.364 -4.658 -5.388 -6.279 19.879 80.90353
CCP 5.25 6.44 9.417 -4.177 -4.847 -6.022 23.678 91.62028
MLP 4.23 5.25 7.333 -3.633 -4.315 -5.351 22.323 85.46792
TPLP 1.941 2.125 2.448 -1.671 -1.962 -2.405 9.411 36.51509
TFSP 1.513 1.703 2.03 -1.042 -1.385 -1.902 11.947 42.77553
6065707580859095
PPP MPFP CCP MLP TPLP TFSP%
Re
mo
val
Adsorbent
303 K
313 K
323 K
0
0.5
1
1.5
2
2.5
3
0.003 0.0031 0.0032 0.0033 0.0034
ln K
o
1/T
PPP MPFP CCP
MLP TPLP TFSP
Comparative study of kinetics of removal of fuchsin basic from aqueous solutions using biosorbents
DOI: 10.9790/2402-09410820 www.iosrjournals.org 19 | Page
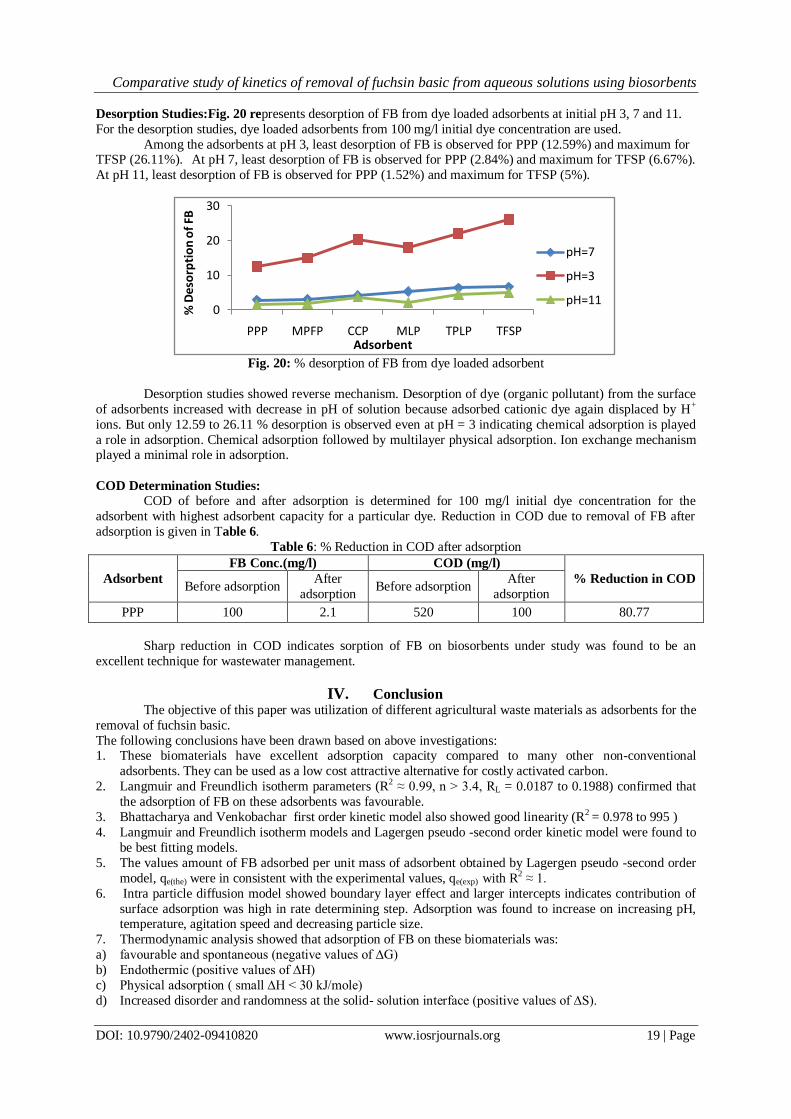
Desorption Studies:Fig. 20 represents desorption of FB from dye loaded adsorbents at initial pH 3, 7 and 11.
For the desorption studies, dye loaded adsorbents from 100 mg/l initial dye concentration are used.
Among the adsorbents at pH 3, least desorption of FB is observed for PPP (12.59%) and maximum for TFSP (26.11%). At pH 7, least desorption of FB is observed for PPP (2.84%) and maximum for TFSP (6.67%).
At pH 11, least desorption of FB is observed for PPP (1.52%) and maximum for TFSP (5%).
Fig. 20: % desorption of FB from dye loaded adsorbent
Desorption studies showed reverse mechanism. Desorption of dye (organic pollutant) from the surface
of adsorbents increased with decrease in pH of solution because adsorbed cationic dye again displaced by H+
ions. But only 12.59 to 26.11 % desorption is observed even at pH = 3 indicating chemical adsorption is played
a role in adsorption. Chemical adsorption followed by multilayer physical adsorption. Ion exchange mechanism played a minimal role in adsorption.
COD Determination Studies:
COD of before and after adsorption is determined for 100 mg/l initial dye concentration for the
adsorbent with highest adsorbent capacity for a particular dye. Reduction in COD due to removal of FB after
adsorption is given in Table 6.
Table 6: % Reduction in COD after adsorption
Adsorbent
FB Conc.(mg/l) COD (mg/l)
% Reduction in COD Before adsorption
After
adsorption Before adsorption
After
adsorption
PPP 100 2.1 520 100 80.77
Sharp reduction in COD indicates sorption of FB on biosorbents under study was found to be an
excellent technique for wastewater management.
IV. Conclusion The objective of this paper was utilization of different agricultural waste materials as adsorbents for the
removal of fuchsin basic.
The following conclusions have been drawn based on above investigations: 1. These biomaterials have excellent adsorption capacity compared to many other non-conventional
adsorbents. They can be used as a low cost attractive alternative for costly activated carbon.
2. Langmuir and Freundlich isotherm parameters (R2 ≈ 0.99, n > 3.4, RL = 0.0187 to 0.1988) confirmed that
the adsorption of FB on these adsorbents was favourable.
3. Bhattacharya and Venkobachar first order kinetic model also showed good linearity (R2 = 0.978 to 995 )
4. Langmuir and Freundlich isotherm models and Lagergen pseudo -second order kinetic model were found to
be best fitting models.
5. The values amount of FB adsorbed per unit mass of adsorbent obtained by Lagergen pseudo -second order
model, qe(the) were in consistent with the experimental values, qe(exp) with R2 ≈ 1.
6. Intra particle diffusion model showed boundary layer effect and larger intercepts indicates contribution of
surface adsorption was high in rate determining step. Adsorption was found to increase on increasing pH, temperature, agitation speed and decreasing particle size.
7. Thermodynamic analysis showed that adsorption of FB on these biomaterials was:
a) favourable and spontaneous (negative values of ∆G)
b) Endothermic (positive values of ∆H)
c) Physical adsorption ( small ∆H < 30 kJ/mole)
d) Increased disorder and randomness at the solid- solution interface (positive values of ∆S).
0
10
20
30
PPP MPFP CCP MLP TPLP TFSP
% D
eso
rpti
on
of
FB
Adsorbent
pH=7
pH=3
pH=11

Comparative study of kinetics of removal of fuchsin basic from aqueous solutions using biosorbents
DOI: 10.9790/2402-09410820 www.iosrjournals.org 20 | Page
8. Adsorption ability of .biosorbents towards FB was found to be PPP > MPFP > CCP > MLP > TPLP >
TFSP
9. Desorption studies showed chemical adsorption also played a role. 10. Nearly 80% COD reduction showed an excellent method of removal of organic pollutants from waste water
using biosorbents.
References [1] N. Kannan, M.M. Sundaram, Kinetics and mechanism of removal of methylene blue by adsorption of various carbons- a
comparative study, Dyes and pigments, 51,2001, 25-40.
[2] K.G.Bhattacharyya and A.Sharma, Kinetics and thermodynamics of methylene blue adsorption on Neem(AzadirachtaIndica)leaf
powder, Dyes and pigments, 65,2005,51-59.
[3] C. Namasivayam, D.Kavitha, Removal of Congo red from water by adsorption onto activated carbon prepared from coir pith, J.
Dyes Pigments, 54,2002,47-58.
[4] Z Bouberka, S. Kacha, M, Kameche, S. Elmaleh, Z .Derriche , Sorption study of an acid dye from aqueous solutions using modified
clays. J. Hazard. Mater. B. 119,2005, 117-124.
[5] P.Janos, P.Sedivy, M .Ryznarova, Sorption of basic and acid dyes from aqueous solutions onto oxihumolite, Chemosphere;
119,2005,881-886.
[6] S. Wang., Y.Boyjoo , A.Choueib , Z. H.Zhu , Removal of dyes from aqueous solution using fly ash and red mud, Water Res.,
39,2005, 129–138.
[7] S.H.Lin, “Adsorption of disperse dye on various adsorbents”, J.Chem. Tech. Biotechnol., 58, 1993,159-162.
[8] A.K.Singh, D.P.Singh, K.K.Pandey,V. N.Singh, “Wollastonite as adsorbent for removal of Fe(II) from water,” J. Chem. Technol.,
42, 1988,39.
[9] A.H.Mahvi, A.Maleki,A.Eslami, Potential of rice husk and rice husk ash for phenol removal in aqueous system. Am. J. Appl. Sci.,
1 (4),2004,321-326.
[10] J.Potgeiter, S.Vermaak, P.Kalibatonga, Heavy metals removal from solution by Palygorskite clay. Minerals Engineering. 2005.
[11] K. R.Hall,L.C.Eagleton,A.Acrivos, T.Vermeulen, ,Ind. Eng. Chem. Fund., 5, 1966
[12] W.J.Weber , Principle and Application of Water Chemistry, edited by Faust S.D. and Hunter J. V. Wiley, New York, 1967.