Comparative Study of Building Environmental … Rating System, LEED and BREEAM A Case Study Building...
177
Comparative Study of Building Environmental Assessment Systems: Pearl Rating System, LEED and BREEAM A Case Study Building in Abu Dhabi, United Arab Emirates ﻣﻘﺎرﻧﺔ ﺑﻴﻦﻢѧѧ ﻧﻈ ا ﻟﻠﻤﺒﺎﻧﻲ اﻟﺒﻴﺌﻲ ﻟﺘﻘﻴﻴﻢ: ﻧ اﻟﻠﺆﻟﺆ درﺟﺎت ﻈﺎم وﻧﻈﺎﻣﻲ(LEED) ) و(BREEAM By: Ahmed Effat Moktar Student ID: 90017 Dissertation Submitted in partial fulfillment of MSc in Sustainable Design of the Built Environment March 2012 The British University in Dubai Supervisor: Prof. Bassam Abu-Hijleh
Transcript of Comparative Study of Building Environmental … Rating System, LEED and BREEAM A Case Study Building...

Comparative Study of Building Environmental Assessment Systems:
Pearl Rating System, LEED and BREEAM
A Case Study Building in Abu Dhabi, United Arab Emirates
مبين مقارنة ونظامي ظام درجات اللؤلؤن :لتقييم البيئي للمبانيا نظ
(LEED) ) و(BREEAM
By:
Ahmed Effat Moktar Student ID: 90017
Dissertation Submitted in partial fulfillment of
MSc in Sustainable Design of the Built Environment
March 2012
The British University in Dubai
Supervisor:
Prof. Bassam Abu-Hijleh

I
Acknowledgments
I would like to thank my Supervisor Prof. Bassam Abu Hijleh for his comments,
support and guidance throughout my dissertation work, I am equally grateful for the
British University in Dubai for the online resources, library and its continuous support
from its staff which helped throughout the time of my study.
I would like especially thank my family for their support, reassurance, and for making
this MSc possible.
Special thanks to IESVE and especially Mr. Rohan Rawte "the country manager of
IES in India" for their support and guidance in completing and auditing the energy
model, also all the Architects, Engineers and sustainability professionals who had
provided guidance and information in this research.
Finally I would like to thank all my friends for their useful inputs and patience which
enabled me to finish this dissertation.

II
الخالصة:
ة ة ورفاهي ة الطبيعي ى البيئ لبية عل أثيرات الس اة ،الت اط الحي ريع ألنم ور الس دن والتط ل للم و المتواص إن النم
ة ى ضرورة حيوي ك أعط ل ذل ة . آ وارد الطبيعي اد الم اخ ونف رات المن دة لتغي ارات المتزاي ات ، واإلش المجتمع
ة لتقييم البيئي التي تهدف إلى التخفيف للتطوير أنظمة ة العمراني لبية للبيئ ار الس ة دون من اآلث ة الطبيعي ى البيئ عل
أنماط الحياة لدى المجتمعات المحلية. بجودة المساس
اني ية لتطوير صناعة المب م الحوافز الرئيس ا أظهرت الخضراء وتعتبر أنظمة التقييم البيئي واحدة من أه ، وآله
ر بعضها هذه لعديد منظهر ا ,في توجيه صناعة البناء والتشييددورا هاما دين الماضيين ، يعتب التقييمات في العق
ل BREEAM) أو (LEEDدوليا مثل ( ؤ ) وبعضها محلي مث درجات اللؤل يم ب ه PRS( نظام التقي ول ب ) والمعم
ى تصاميم وعلى .في إمارة أبوظبي الرغم من أن جميع طرق التقييم مشترآة في االهداف التي يمكن أن تؤدي إل
ى ءخضراأبنية ات إل ذه االختالف د أدت ه ة . وق ه التنفيذي اييره وإجراءات ، إال أنه ال يزال لكل أسلوب قواعده ومع
.الخضراءصورة متوقعة للمباني ال تحقيقفي ظهور بعض محوالت لتقييم هذه االساليب و بحث مدى نجاحها
د مق و عق ة ه ذه الدراس ة نطاق ه ر المخططات الدولي ين أآث ة ب تخداما ارن ين ) BREEAM) و (LEED(اس وب
ؤ درجات اللؤل يم ب ام التقي ات البحث , ونظ تخدمة منهجي ىالمس اة ه ة ومحاآ ة حال ات ودراس تعراض للمؤلف اس
إجراء يم محددة ويسمح ب ى خطط تقي املة عل ى أن يلقي نظرة ش بالكمبيوتر ، هذه المنهجيات ساعدت الباحث عل
المقارنات المطلوبة.
د أن ن ام ، وج ي الخت م وف ين معظ ع ب تقل يجم د مس ام فري و نظ ؤ ه يم اللؤل ام تقي اتظ ) و LEED( متطلب
)BREEAM ( أن نظامي و وجدستراتيجيات ، اال نفس، حيث أنه يحتوي على)LEED ( االآثر واللؤلؤ يعتبر
ابها ث تش ن حي قم رق التطبي ب ط ادالطل ا و االعتم ة ويمث ) BREEAM(، بينم ي المقارن ل ف ط أق ل المخط
ي االهتمام ب آما وجد أن .بين الثالثة األصعب وفير ف ا الت االستثمار في الطاقة متساويا في المخططات الثالثة بينم
ؤ. ي مخطط اللؤل ط ف ات أظهرت أن المياه يتضح فق ة المؤلف ة ومراجع نظم إن دراسة الحال ة ال ي و الثالث ى ف حت
ى المباني ،ب اء االنظمةو اد اختالفاتها جميعها أظهرت أثر إيجابي على آل من تصماميم و اثر ايجابى ايضا عل
الطبيعية. شاغلي المباني و البيئة

III
Abstract
The continuous growth of cities, the fast developing lifestyles, the negative impacts
on the natural environment and wellbeing of communities ,the increasing signs of
climate changing and running out of natural resources. All that gave vital necessity for
developing environmental assessment schemes that aims to mitigate the negative
impacts of our built environment on the natural environment without compromising
the quality of the lifestyles of the communities.
Environmental Assessment Schemes are considered to be one of the main catalysts for
the generation and development of the industry green buildings. Varies Schemes had
appeared in the last two decades, part of them considered to be international such as
LEED or BREEAM and some local such Esitdama Pearl Rating systems (PRS) of the
Emirate of Abu Dhabi, all had shown an important role in guiding the construction
industry.
Although almost all of the assessment methods share goals that can lead to; green
building design and construction or improving the performance of existing
conventional buildings, still every method has its own structure, certification process
and weighting criteria. These differences led to the generation of multiple questions
such as which assessment schemes succeeded more in the anticipated image of a
green building.
The scope of this study is to compare two of the most representative international
schemes which are LEED and BREEAM against the PRS. The aim is to benchmark
the performance of buildings developed under the PRS against international level
schemes.
The used methodology for the research is literature review, case study and computer
simulation, these methodologies helped the researcher to have a comprehensive look
on a selected assessment schemes and allowed to make the required comparisons.
In conclusion, it was found that PRS is standalone system that combines most of
LEED and BREEAM schemes, and that they have big overall laps in terms of
sustainability strategies but from an application and certification levels side, LEED
and PRS are more comparable especially in the higher certification levels while
BREEAM is less comparable and presents the hardest scheme of the three to score
under.

IV
It was also found that investment in energy related credits has the mose significant
impact in all the three schemes while water credit only impacts PRS.
The study of the literature review and the case study had showed that the three
environmental assessment schemes even with its differences; all showed in overall a
definite positive impact on the building design, performance, a positive impact on the
occupants of the rated buildings and positive impact on the environment.

V
List of Figures
Fig. 1.1 The ecological footprint per capita (NEF, 2005) .............................................4
Fig. 1.2 Life Satisfaction levels (NEF, 2005) ................................................................4
Fig. 1.3 A graph showing how would be a relation between an Environmental
assessment Scheme and the regulatory minimum (BRE 2011) ...................................13
Fig. 2.1 Estidama UPC Assessment and Certification Flowchart (Estidama website,
2011) ............................................................................................................................22
Fig. 2.2 GBCI’s Project Certification Overview (GBCI, 2011) ..................................23
Fig. 2.3 BREEAM Assessment and Certification Stages (BREEAM, 2011) ..............25
Fig. 2.4 BREEAM Assessment and Certification Stages (BREEAM, 2011). .............26
Fig. 2.5 Overlaps between the credits of LEED and BREEAM (Inbuilt, 2010) .........34
Fig. 2.6 Performance criteria of the schemes ..............................................................37
Fig. 2.7 Credit scales of PRS, LEED and BREEAM ..................................................37
Fig. 2.8 The Cost of Green Buildings (Langdon, 2007) ..............................................44
Fig. 2.9 The Cost Impact of the application of Pearls Rating Schemes (Langdon,
2010) ............................................................................................................................45
Fig. 3.1 The Map of the United Arab Emirates (UAE) (Google Earth) ......................55
Fig. 3.2 Abu Dhabi Map (Google Earth) .....................................................................56
Fig. 3.3 Waterfront of Abu Dhabi ..............................................................................57
Fig. 3.4 Forecast for energy peak demand for Abu Dhabi (ADWEA, 2010) ..............58
Fig. 3.5 Forecast for Water peak demand for Abu Dhabi (ADWEA, 2010) ...............58
Fig. 3.6 Psychometric Charts for Abu Dhabi (Generated from Ecotect 2011) ............59
Fig. 3.7 Prevailing Wind-All Year for Abu Dhabi (Generated from Ecotect 2011) ...60
Fig. 3.8 Prevailing Wind- Temperature-All Year for Abu Dhabi (Generated from
Ecotect 2011) ...............................................................................................................60
Fig. 3.9 Climate Summary Metrics (Generated from IESVE 2011) ...........................61
Fig. 4.1 Project floor Plan before simplification ........................................................64
Fig. 4.2 Project floor Plan after simplification ...........................................................64

VI
Fig. 4.3 IES-Sketchup Plugin .....................................................................................65
Fig. 4.4 Actual System Schematic from ApacheHVAC .............................................67
Fig. 4.5 HVAC LEED Baseline Schematic from IES ................................................68
Fig. 4.6 Actual Orientation .........................................................................................69
Fig. 4.7 Daily operational profile (8am to 6pm with lunch break) ............................70
Fig. 4.8 Sketch up Model of the Case Study ..............................................................71
Fig. 4.9 IES Model of the Case Study ........................................................................72
Fig. 4.10 The validation sample space……………………………………………….72
Fig. 6.1 Illustration showing the relation between the mandatory part in three
assessment schemes ...................................................................................................113
Fig. 6.2 Illustration showing the overlaps between the three assessment schemes ...114

VII
List of Tables
Table 2.1 Different Categories of PRS, LEED and BREEAM ..................................27
Table 2.2 The Mandatory Credits of PRS, LEED and BREEAM .............................31
Table 2.3 Minimum BREEAM standards by rating level (BREEAM, 2011) ............33
Table 2.4 Comparison between the major categories in LEED, BREEAM and PRS
(Elgendy, 2010)............................................................................................................35
Table 2.5 Comparison between the major categories in LEED, BREEAM and PRS .35
Table 2.6 General Comparison for Energy Performance assessment criteria between
LEED, BREEAM and HK-BEAM (Lee and Burnett, 2008). ......................................40
Table 3.1 Simulation tool references in the three schemes .........................................54
Table 4.1 Case study Construction and finishes ........................................................66
Table 4.2 Strategies that contributes to potable water saving calculation per scheme ...
......................................................................................................................................74
Table 5.1 PRS assessment: non achievable required credits .......................................80
Table 5.2 PRS assessment: achieved required credits.................................................81
Table 5.3 PRS assessment: Categories with no points achieved.................................82
Table 5.4 LEED assessment: Non achievable Prerequisites .......................................83
Table 5.5 LEED assessment: points Achieved ............................................................83
Table 5.6 BREEAM assessment: achieved points ......................................................84
Table 5.7 Overall Points Comparisons ........................................................................86
Table 6.1 PRS assessment: achieved required credits.................................................91
Table 6.2 Phase 2 assessment through PRS assessment: achieved credits .................94
Table 6.3 PVWATTS calculator results ......................................................................98
Table 6.4 Phase 3 assessment through PRS assessment: achieved credits ...............100
Table 6.5 Phase 1 assessment through LEED assessment: Prerequisites .................102
Table 6.6 Phase 2 assessment through LEED assessment: Credits ...........................103
Table 6.7 Phase 3 assessment through LEED assessment: Credits ...........................105
Table 6.8 Phase 1 assessment through BREEAM assessment: Credits ....................106
VIII
Table 6.9 Phase 2 assessment through BREEAM assessment: Credits ....................108
Table 6.10 Phase 3 assessment through BREEAM assessment: Credits ..................110
Table 6.11 Benchmarking PRS against LEED and BREEAM based on the case study
building ......................................................................................................................112
IX
Table of Contents Acknowledgments ........................................................................................................ I
Abstract ........................................................................................................................ II
List of Figures .............................................................................................................. V
List of Tables ............................................................................................................ VII
Chapter 1: Introduction ................................................................................... 1
1.1 Introduction ............................................................................................................ 2
1.2 Sustainability .......................................................................................................... 5
1.3 Efforts around the world to be more sustainable? ............................................. 7
1.3.1 Educating the community ................................................................................ 7
1.3.2 Improving the built environment ..................................................................... 9
1.3.2.1 Negative effects of buildings on the environment ..................................... 9
1.3.2.2 Benefits of green and sustainable buildings ............................................ 10
1.4 Approaches of improving the built environment ............................................. 11
1.4.1 Educating the community .............................................................................. 11
1.4.2 Improving the Built Environment through voluntary and incentives schemes ..
................................................................................................................................. 12
1.4.3 Improving the Built Environment by mixed approaches .............................. 12
1.5 The Rise of Environmental Assessment Schemes ............................................ 12
1.6 User appreciation and market awareness ......................................................... 16
1.7 Significance of the study ……………………………………………………….16
1.8 Dissertation outline………………………………………………………..……17
Chapter 2: Literature Review ........................................................................ 17
2.1 Literature Review Introduction ......................................................................... 18
2.2 Estidama Pearl Rating System (PRS) vs. LEED and BREEAM .................... 18
2.3 Background ......................................................................................................... 19
2.4 The Creation of PRS, LEED and BREEAM .................................................... 20
2.5 Certification Process ........................................................................................... 21
2.6 Schemes’ Structure ............................................................................................. 26
2.6.1 Schemes’ Categories ...................................................................................... 26
2.6.2 Mandatory/Prerequisites/required Credits ..................................................... 31
2.6.3 Categories weightings ................................................................................... 34

X
2.7 The effectiveness of PRS, LEED and BREEAM .............................................. 39
2.7.1 Energy Consumption ..................................................................................... 40
2.7.2 Water ............................................................................................................. 41
2.7.3 Indoor Environmental Quality (IEQ) ............................................................. 41
2.7.4 The Impact of Environmental Assessment Schemes on Cost……….. .............. 43
2.8 Summary of Literature Review Findings ......................................................... 45
2.9 Research Aims and Objectives .......................................................................... 46
2.9.1 Aim of the Research ...................................................................................... 46
2.9.2 Objectives of the Research ............................................................................ 46
2.9.3 Expected Outcome ........................................................................................ 46
2.9.4 Developing Hypothesis.. ................................................................................ 47
Chapter 3: Methodology ................................................................................. 48
3.1 Reviews on Methodologies Selection ................................................................. 49
3.1.1 Methodologies used in papers comparing the overall of the assessment schemes ................................................................................................................... 49
3.1.2 Methodologies used in Energy performance comparison papers .................. 50
3.1.3 Methodologies used in Papers reviewing the Water Savings ........................ 51
3.1.4 Methodologies used in Papers reviewing the Indoor Environmental Quality (IEQ) ......................................................................................................................... 52
3.2 Approaches of improving the built environment ............................................. 53
3.2.1 Historical-Interpretive research ..................................................................... 53
3.2.2 Case Study building as a focus of the study .................................................. 53
3.2.3 Computational Simulation ............................................................................. 53
3.2.4 Social Survey ................................................................................................. 54
3.2.5 Conduct a set of Interviews with key industry professional ......................... 55
3.2.6 Overall Environmental Assessment of the case study building .................... 55
3.3 Case Study Introduction ..................................................................................... 55
3.3.1 Location United Arab Emirates (UAE) .......................................................... 55
3.3.2 Abu Dhabi Built Environment ...................................................................... 57
3.3.3 Current and future Green buildings codes and legislations in Abu Dhabi .... 58
3.3.4 Abu Dhabi Climate ........................................................................................ 59
3.3.5 Case study Building Description ................................................................... 61

XI
Chapter 4: Case Study: Configuration and Assessment Tools ................... 62
4.1 Overall Environmental Assessment of the case study building ...................... 63
4.1.1 Pearls rating system ....................................................................................... 63
4.1.2 LEED ............................................................................................................. 63
4.1.3 BREEAM ...................................................................................................... 63
4.2 Energy Model Setup and Validation ................................................................. 64
4.2.1 Model Description ......................................................................................... 64
4.2.2 Simulation configuration ............................................................................... 70
4.2.3 Modeling Process .......................................................................................... 71
4.2.4 Model Validation ........................................................................................... 72
4.3 Water Demand .................................................................................................... 72
4.3.1 Actual Input Data .......................................................................................... 72
4.3.2 Pearls Rating System Water Calculator and Baseline Input data .................. 73
4.3.3 LEED Water Calculator and Baseline Input data .......................................... 73
4.3.4 BREEAM Water Calculator and Baseline Input data ................................... 74
4.3.5 Benchmarking the potable water saving assessment process between PRS, LEED and BREEAM ............................................................................................... 74
Chapter 5: Case Study Assessment: Results and Discussion ...................... 75
5.1 The Assessment ................................................................................................... 76
5.2 Energy Simulation .............................................................................................. 76
5.2.1 Actual Design Model .................................................................................... 76
5.2.2 Pearls Rating System (PRS) .......................................................................... 76
5.2.3 LEED ............................................................................................................. 77
5.2.4 BREEAM ...................................................................................................... 77
5.3 Water Calculations ............................................................................................. 78
5.3.1 Pearls Rating System (PRS) ........................................................................... 78
5.3.2 LEED .............................................................................................................. 78
5.3.3 BREEAM ...................................................................................................... 79
5.4 Overall Assessment Results ................................................................................ 79
5.4.1 Pearls Rating System ..................................................................................... 80
5.4.2 LEED ............................................................................................................. 83
5.4.3 BREEAM ...................................................................................................... 84
5.5 The Assessment Conclusion ............................................................................... 85
XII
Chapter 6: Suggested Improvements in the Case Study: Assessment Results and Discussion .................................................................................... 87
6.1 Case Study Upgrading Phase 1: Getting the Case Study Building Certified through PRS ............................................................................................................... 88
6.2 Phase 1 Assessment through PRS ...................................................................... 90
6.3 Case Study Upgrading Phase 2: The Case Study Building Achieving 2 Pearls through PRS .............................................................................................................. 92
6.4 Phase 2 Assessments through PRS .................................................................... 94
6.5 Case Study Upgrading Phase 3: The Case Study Building Achieving the Maximum Rating in PRS which is 5 Pearls ............................................................ 95
6.6 Phase 3 Assessments through PRS .................................................................... 99
6.7 The Assessment of the three Phases of upgrades towards LEED ................ 101
6.7.1 (1) Pearl ....................................................................................................... 102
6.7.2 (2) Pearls ..................................................................................................... 103
6.7.3 (5) Pearls ..................................................................................................... 104
6.8 The Assessment of the three Phases of upgrades towards BREEAM .......... 106
6.8.1 (1) Pearl ....................................................................................................... 106
6.8.2 (2) Pearls ..................................................................................................... 108
6.8.3 (5) Pearls ..................................................................................................... 109
6.9 Benchmarking PRS against LEED and BREEAM based on the case study building ..................................................................................................................... 112
Chapter 7: Conclusion and Further Study ................................................. 116
References ...................................................................................................... 119
Appendices
Appendix 1: Environmental Assessments Scorecards……………………..……… A1
Appendix 2: Water Calculations……………………………………………………A2
Appendix 3: Energy Simulation Results……………………………………………A3
Appendix 4: Energy Model Validation with HAP………………………………….A4

1
Chapter 1 Introduction

2
1.1 INTRODUCTION
For decades, green movements and environmental scientists have been working
on showing the world the necessity of giving proper attention to the environment and
the natural fortune. They explained the expected problems which may happen in the
near future if we continued to survive with our current life styles. These
environmental problems became famous to the general public as a synonyms to a
phenomenon known as "climate change”, it was defined by the United Nations
Framework Convention on Climate Change (UNFCCC, 1992) as " a change of
climate which is attributed directly or indirectly to human activity that alters the
composition of the global atmosphere and which is in addition to natural climate
variability observed over comparable time periods.".
Due to climate change, scientists have warned of severe consequences on earth such
as an expected high frequency appearances of natural disasters such as Earth quakes,
Tsunamis and Floods which all took place. When these events started to take place as
anticipated, it showed the world the nature and scale of what may happen in future
and the importance of reconsidering their actions and life styles. In spite of these
appearances of natural disasters, still majority of world leaders did not guide their
countries towards solving the problem until another factor came in the equation which
is the energy then the economical crisis. The record breaking prices of energy where a
barrel of brent oil has reached more than 140 dollars (BBC News,11 July 2008), after
it was less than 20 dollars in the 90s (OPEC, 2011), this had made a clear statement to
the world that our current rate of energy consumption is not going to be sustainable
not only for the saving the planet but also for saving the economies world and that
gave a big momentum to the green movements.
In another look to the last decade, it didn't only bring the energy market into focus but
also brought some other markets such as Water and Food. The three markets had an
established importance throughout history, but lately the importance has growing to
alarming levels where severe clashes between demand and supply had started to take
place. The pace of development of the world economy especially that of the
developed countries has encouraged them to excessively consume these markets in an
unsustainable manner, that led the prices of the products to increase. This increase in
the food prices on the other hand had maximized problems for the poor side of the
world countries whom already are finding difficulties in having any growth in their
economies as they are trying just respond to the local needs of their communities with

3
its limited recourses and low income. And with high levels of corruption in these
countries, their poor communities were most negatively impacted due to this
economical crisis. Some argues that economical crisis will help to eased down the
record breaking prices of oil and food supplies, then pressures on begin more
sustainable for the world leaders will be less, this may be true, but as the wheel of
economy starts to move again, problems will start to show up again, simply because
what’s happing is not sustainable. Clashes of demand and supply for the markets of
(energy, water and food) have global consequences, where a high consumption of
resources can occur in one part of the world but the negative effects may appear in
other areas and mainly in the poor countries.
In 2011, multiple incidents took place around the world that can potentially be related
in a direct and indirect way to our current un-sustainable lifestyles from all the sides
“economical, social and environmental”, where Clashes of markets of Food, Water
and energy appeared severely in places such as shortage in water and food supplies in
the Horn of Africa which lead the region to starvation, where according to the BBC
News channel (2011) was recorded as the "Worst Drought in 60 years". As well as the
wave of social revolts that hit most of the Middle East where the people demanded
better living conditions. “High resources consuming” life style of the communities of
the developed countries are so far blamed as the sources of the majority of the current
global problems and tensions.
Misconception
Communities around the globe seem to have a theory that exaggerated use of
resources will lead to an increased level of satisfaction. The New Economic
Foundation (NEF) had tried to find a correlation on this issue. It had conducted a
study Fig. 1.1 that shows the ecological foot print per captia around the world, and
conducted another study Fig. 1.2 that shows the life satisfaction, from observing these
two figures, it seems that there is a true correlation between increasing the life
satisfaction with the ecological footprint, however there is a point where increasing
the footprint will not have any more increase in the happiness index. This means that
there is a point where resources consumption becomes a habit rather than a tool for
increasing happiness for communities.

4
As the negative impacts of a “High resources consuming” lifestyles will continue to
appear in the poor side of the world, new big emerging markets such as India and
China are coming in to the picture and will enlarge the scale of the problems by
continuing to follow the path of the developed countries in their rate of consumption
of resources and refusing to present a different sustainable example.
It’s now expected worldwide that in the near future there will be shortage in multiple
materials, water and energy, in addition to the impacts climate change. In this context
issue and before the end of 2011, World Summit on Climate Change was held in
Durban, South Africa, and highlight that there is an issue of how the world is reacting
to the global climate challenges and highlighted that still there is no solid agreement
Figure 1.1 the ecological footprint per capita (NEF, 2005)
Figure 1.2 Life Satisfaction levels (NEF, 2005)

5
on how to combat it and urged the necessity of finalizing this long awaited agreement
on cutting down emissions.
Historically these world summits on climate change were not much successful. On
one hand developing countries always highlights that they are not responsible for the
current global problems especially the environmental ones and demands more
commitment from the developed world in absorbing their carbon footprints which
they are responsible for. On the other hand developed countries such as USA and
China, agrees with this concept but refuses to commit under any agreement. To tackle
this disagreement and to increase cooperation, UNFCC had developed multiple
mechanisms under Kyoto protocol that will help developed countries meet their target
carbon emission either through direct national reduction or by help a developing
country to develop in a sustainable way, these mechanisms is named Clean
Development Mechanisms (CDM), the main aim of these mechanism are:
Stimulate sustainable development through technology transfer and
investment
Help countries with Kyoto commitments to meet their targets by reducing
emissions or removing carbon from the atmosphere in other countries in a
cost-effective way
Encourage the private sector and developing countries to contribute to
emission reduction efforts
Late in 2011, a BBC report on the world summit on climate change had shown that
still the developing countries are increasingly not appreciating the role of the
developed countries in cutting their carbon emissions and showed a concern that a
worldwide agreement seems to be very hard at this point, and as declared by the
Alliance of Small Island States (AOSIS) when describing what’s happening right now
between the world countries that its "reckless and irresponsible" from the world.
1.2 Sustainability
Initiatives have been taken around the world in order to guide the communities to
have more sustainable life styles to protect their future. Sustainability in it self has
different definitions which changes with its context, but in general it can be defined as
"a system or process is sustainable if it can be continued indefinitely, without
depleting any of the material or energy resources required to keep it running" (Wright,

6
2011). Different official declaration had been made worldwide to define the
components of sustainability; at the 2005 World Summit it stated that the three pillars
of Sustainability are "Economy, society and Environment". In Abu Dhabi, UAE the
country of the case study, the authorities' define sustainability with four pillars by
adding "culture" to the other three mentioned in the World Summit. This direction and
care from Abu Dhabi government about its not cultural heritage was clear in the Abu
Dhabi 2030 development plan, where Abu Dhabi Gov. had stated in the report that it
believes that cultural identity is something that could not be compromised to achieve
the other three pillars of "Economy, Society and Environment", and that if there is no
careful equal attention had been given to all the pillars, there is a great possibility that
whatever happening won’t be sustainable.
Sustainable Development
To celebrate our present and prepare for the future, world leaders and their
communities have aimed to achieve a development which is Sustainable, the term
"Sustainable Development" appeared to be the keyword of the current era. This term
was first used by the World Commission on Environment and Development (WCED)
which is a group formed by the United Nations (UN), it has defined sustainable
development as what "meets the needs of the present without compromising the
ability of future generations to meet their own needs".
Natural Environment
In order to have a Sustainable future, Countries around the world agreed on the
importance of continuing developing their communities while protecting the real
fortune of the planet earth "the Natural Environment" which is defined as " all the
natural surroundings that grow naturally without the involvement of human begins; it
is created as balanced and sustainable System for the humans so they can benefit
from." (Wright 2011). Ignoring the effect of our activities on the environment may
result with severe impacts such as Air Pollution, Water pollution, Climate change,
depletion of resources.
Built Environment
The ways we plan our cities, neighborhoods and build our building contributes to our
daily lifestyles and affect things like how we work and how we use our recourses. The
shaping of our life styles happens due to multiple factors such as "Economical,
Political, Social, Cultural and Environmental" and it's only in the hands of people the

7
will to change life styles to be more sustainable. The built environment is one of the
major contributors to the quality of life of people and at the same time it has a major
impact on the natural environment if not planned properly.
1.3 Efforts around the world to be more sustainable
In the 1992 Earth Summit, Rio de Janeiro, countries of the world met for the first time
to discuss the international cooperation on development and environmental issues,
they met with an understanding of the global nature of these issues and "Recognizing
that no nation could resolve global problems on their own, those attending the Summit
signed agreements on international cooperation for tackling development and
environment concerns" (Fien and Tilbury, 2002), the agreement aimed to find ways to
fight problems such as “the perpetuation of disparity between and within nations, a
worsening of poverty, hunger, ill health and illiteracy and a continuing deterioration
of the ecosystem on which we depend for our wellbeing, and agenda 21 “a global
partnership for sustainable development” (UNESCO, 1992).
Although world countries had agreed on some guidelines, still every country had to
formulate its own plan based on its local conditions, therefore Countries had
responded to its environmental, social and economical problems differently; however
there seem to be two approaches in guiding the communities into a sustainable future.
The two approaches are educating the community and the other is controlling their
actions.
1.3.1 Educating the community
Education is one of the main tools that are used to guide people into sustainability .In
The 1980 World Conservation Strategy had stated the important role of education and
argued that:
A new ethic, embracing plants and animals as well as people is
required for human societies to live in harmony with the natural world
on which they depend for survival and well-being. The long-term task
of environmental education is to foster or reinforce attitudes and
behaviors compatible with this new ethic.
(IUCN, UNEP & WWF 1980, sect. 13)

8
In Rio world Summit in 1992, among the signed agreements was (Agenda 21)
"through which countries committed themselves to promoting sustainability through a
great variety of means, including education." (Fien & Tilbury 2002).
Due to that clear importance of education, the United Nations (UN) in 2002 declared
a decade for education of sustainable development from 2005 to 2014 where the
United Nations Educational, Scientist and Cultural Organization (UNESCO) will take
the lead in it.
And in their book, Tilbury et al. (2002) had showed that Several Countries around the
globe "Developed and Developing Countries" had already developed educational
initiatives with specific and general nature such as:
1. Australia: The Australian Government action plan for education for
sustainability.
This is considered to be a general initiative aimed at all people, where it prepared
a plan for education of sustainability that included 4 strategies:
- Strategy 1: Demonstrating Australian Government leadership
- Strategy 2: Reorienting educational systems to sustainability
- Strategy 3: Fostering sustainability in business and industry
- Strategy 4: Harnessing community spirit to act
The Australian government tried to diversify the sources of education in order to
be able to reach most of its communities through schools, legislations, business
and community lectures.
2. India: The education for sustainability for the central Himalayas.
In this initiative, the Indian government found specific problems such as (loss of
biodiversity, soil erosion, water sacristy and excessive use of timber from forests
then turning it in to reserved areas preventing the people from entering it) and
with the population growth, the demand increased on wood, food and water. It
was felt that an educational intervention is required to change the people attitude
towards their village; the intervention was through local Non governmental
Organization and formal schools. The project team concluded that the most
important success was the emerge of "several groups and individuals who are
9
active in environmental issues and who therefore can act as agents of change in
the villages and schools" (Pande, 2002)
1.3.2 Improving the built Environment
The second approach is reshaping and upgrading the built environment to be more
environmentally responsive, hoping that this reshaping will inspire people to have a
more sustainable life “We shape our buildings, then our buildings shape us”
(Churchill, 1943).
1.3.2.1 Negative Effects of buildings on the environment:
We need buildings in our daily life; not only as a shelter but also as the controlled
environments we create to suite our different activities. Buildings allow us to things
that are not related to existing natural conditions, we can go skiing in the middle of
the desert, we can plant tropical vegetables in the North Pole, and whatever human
beings can imagine doing can be done through buildings. It’s considered as a mirror
for the life styles and degree of development of communities. The argument now is
the negative impacts of buildings construction in an irresponsible way on the
environment such as:
Energy Consumption
In the US, buildings are responsible for consuming 30% of the total energy and 60%
of the electricity annually (LEED, 2009) and as per Environmental Protection Agency
(EPA) (2011) “36 percent of total energy use and 65 percent of electricity
consumption, and are responsible of 40% of the energy consumption in Europe
(European Commission, 2011). Energy use is divided where the construction process
consumes around 20 % and the operation 80% of the total energy (UNEP, 2007).
Green House Gases GHG Emissions
Buildings participate by a big share in the greenhouse gases emissions whereas per
EPA (2011) Buildings contribute to 30 percent of greenhouse gas emissions to the
atmosphere where as per LEED (2009) “About ¼ of the increase in carbon dioxide is
due to the building sector” and as “The EPA estimates, the use of energy efficient
lighting alone would be the equivalent of getting 15 million cars off the road in terms
of carbon dioxide reduction.” (LEED, 2009).
10
Water Consumption
Buildings and built environment consumes 12 percent of potable water consumption
EPA (2011), this excessive water consumption is due to the use of items such as
inefficient fixtures. Whereas per LEED (2009) “Buildings consume 5 billion gallons
of potable water per day to flush toilets” and leaks with the system plumbing building
may lead to loss of a big amount of pure water.
1.3.2.2 The benefits of green and sustainable buildings
As per EPA (2011) Green Buildings (GB) are “the practice of creating and using
healthier and more resource-efficient models of construction, renovation, operation,
maintenance and demolition “. As per LEED (2009) GB proved to have multiple
benefits such as;
Environmental benefits
It can reduce or eliminate environmental effects such as (waste generation, air and
water pollution, heat islands, Enhance and protect biodiversity and ecosystems,
reduce storm water runoff , conserve green land and reduce noise generation) through
high performance & market leading designs. GBs also reduces the energy and water
consumption where electricity and water can be reduced by 60 % (Estidama PRS,
2011)
Economic benefits
GB can mainly reduce operational costs, increase the lifetime of the building systems
through proper maintenance and training of facility management teams, also
increasing marketability of buildings as it will have less operational costs and will be
recognized in the market through certification by its high efficient and ecofriendly
performance, improve employees’ productivity and Optimize life-cycle economic
performance. (EPA, 2011)
Social benefits
GBs in general seems to present a better working and living space for its occupants
than conventional buildings, where as per Abbaszadeh et al. (2006) occupants in
green buildings are more satisfied with thermal comfort and air quality in their
workspace, he highlight some features that helps the occupant satisfaction in green
buildings such as "improving ventilation, removing indoor pollutants, using green
materials, giving occupants personal control over operable windows, task air-

11
conditioning, or under floor air distribution systems, employing daylight, and
reducing ambient light levels by using task lighting".
1.4 Approaches of improving the built environment
In order to upgrade the built environment, initiatives had been taken to guide the new
and existing buildings stock towards more responsible practices. Three approaches
had been adopted by the world (Legislations, voluntary and Incentives and mixed).
1.4.1 Improving the Built Environment through law enforcement
This approach aims to control the built environment through legislations.
Municipalities enforce set of rules to be followed as minimum requirements in order
to issue a building permit.
Dubai has implemented this approach since 2007 when it issued a resolution that “all
owners of residential and commercial buildings and properties in the emirate of Dubai
must comply with the internationally recognized environment friendly specifications
to turn Dubai into a healthy city that meets the demands of best practices and
benchmarks of pollution-free sustainable development. " The Emirates News Agency
(2007). This approach was somehow appropriate for Dubai as most of the
professionals there already have the capabilities and knowhow of creating more
sustainable buildings and was only missing the will. The construction industry in
Dubai is market driven, owners and investors in some cases were caring only about
the initial costs and were willing to do cost cuts in the budgets even by avoiding
sustainable or green features which may have a high initial cost but lower operational
cost. In Dubai case the market was ready for being greener but just needed the spark
and the will, that’s what the resolution of green buildings has made. It had leaded the
construction market of Dubai to transform its operations and produce more green
products in a relatively short period of time.
In some other parts of the world this approach has been also adopted, in the US
several federal initiatives had been implemented mandating having LEED certified
buildings. On the states level, States such as Arizona, California and District of
Columbia, all had mandated that new or renovated state owned buildings to be built
on minimum LEED certified and in some cases minimum LEED Silver (USGBC
Website, 2012)
12
1.4.2 Improving the Built Environment through voluntary and incentives
schemes
The second approach is a total voluntary with incentives scheme, in this approach the
municipalities depend only on the will of the community on going green and award
their behavior with incentives. This approach seemed to be successful in highly
environmental aware communities rather than others.
Germany is one of the countries which used this approach through initiatives such as
"The German Renewable Energy Sources Act" (EEG) which came into effect in 2000,
in this initiative "Both private and institutional investors in photovoltaic systems
receive a guaranteed remuneration (feed-in tariff) for solar electricity fed into the
public grid. " Singapore also had adopted the same approach whereas per the green
business times (2011) “several funding and incentive schemes related to energy
efficiency, clean energy, green buildings, water and environmental technologies,
green transport, waste minimization, environmental management system,
environmental initiatives, clean development mechanism, and green IT”. Also the
Australian Government had developed multiple initiatives for the use of solar and
renewable energies which has incentives schemes through grants and funds included
inside these initiatives (Australian Government, department of climate change and
energy efficiency, 2012), similar to that in other countries such as UK, Spain and the
US.
1.4.3 Improving the Built Environment by a mixed approaches
The third approach is the mixed approach, where municipalities make a mandatory
minimum level then a voluntary higher scheme. Abu Dhabi is one of those who used
this kind of approach to direct its construction industry. USA is another example for
that system but on the state level and not on a federal level (USGBC Website, 2012)
The three schemes are acceptable but which one is more successful is still not clear as
it depends on the readiness, specifics of each community and how they will react to
the new sets of environmental codes.
1.5 The Rise of Environmental Assessment Schemes
In order to meet the demands of going green, and since green building definition is
very wide and can accept multiple interpretations, a need of assessment schemes that
demonstrates a commitment to sustainability and measured by a third parties had

13
immerged. As per Poveda (2011) the main role of assessment schemes is to “make a
progress towards a purpose”, as shown in Fig. 1.3 environmental assessment schemes
are meant to be an upgrade and higher standard compared to the local regulations.
These schemes started to appear early in the 90s as a tool for a systematic upgrading
for the built environment.
The first Environmental assessment scheme of buildings was developed by the British
Research Establishment (BRE) in 1990 which was BREEAM. (Lee, 2012)
And as per Inbuilt report comparing LEED and BREEAM (2010):" In order for any
scheme to retain value, it should be hard to achieve", so as shown in Fig. (1.3), most
of the schemes are designed as a step further than local legislations.
Types of Environmental Assessment Schemes.
In his research paper, Pavoda (2011) classified environmental assessment schemes in
to the following categories:
1. Environmental, Social and Economic Impact Analysis
Environmental Impact Analysis main aim is to assess the physical and social issues
related to the projects and to inform the stakeholders the environmental, social and
economical implications before proceedings with their decisions.
Figure 1.3 a graph showing how would be a relation between an Environmental Assessment Scheme and the regulatory minimum (BRE 2011)

14
2. Strategic Environmental Assessments (SEA)
This is similar to Environmental Impact Assessments (EIA), the only difference is
that EIA is on project level, while SEA is on a higher level of assessment for policies,
plans, and programmes (PPP).
3. Cost-Benefit Analysis (CBA)
As it’s stated in its name, this assessment is concerned with the cost and benefits of a
specific project and is meant to be applied in the early stages to determine the
viability of specific project.
4. Travel Cost Theory
Which as per Pavoda (2011) this theory “estimates economic use values related to
sites or ecosystems used for recreation” and “measures people’s willingness to pay to
visit the site, based on the number of trips that they make at different travel costs.”
5. Community Impact Evaluation
It presents an adaptation of cost-benefit analysis (CBA) for urban and regional
planning, in addition to providing the total costs and benefits of projects.
6. Contingent Valuation Method (CVM)
This assessment method considers “For environmental improvements, CVM
considers willingness to pay. For reduction in environmental quality, it assesses
willingness to accept.” (Pavoda, 2011)
7. Hedonic Pricing Method
This method is used to estimate the economical value of ecosystems and
environmental services; it was developed by Rosen (1974) and was based on
Lancaster’s consumer theory (1966).
8. Multi-Criteria Analysis (MCA)
Similar to CBA method but weights impacts in non monetary terms.
9. Material Intensity Per Service Unit (MIPS)
It relates the amount of materials moved or extracted to specific provided service.

15
10. Analytic Network Process (ANP)
It’s a multi criteria analysis that consists of “clusters, elements, interrelationships
between clusters, and interrelationships between elements” that helps in decision
making processes. (Pavoda, 2011)
11. Life Cycle Assessment (LCA)
This assessment examines a “product or service throughout its life cycle to assess its
environmental impacts”. (Pavoda, 2011)
12. Sustainability/Environmental Rating Systems
This type of assessment is focus of this study, these systems was designed to assess
different aspect of building construction industry from a social, economical and
environmental point of view through an integrative approach between all the design
teams, contractor and stakeholders related to a specific project.
Benefits of Environmental Rating systems
Assessment schemes are like building codes but performance based and depends on
the voluntary choices of the design teams with minor mandatory requirements, it
gives only the needed guidance to the industry professionals on how to make
buildings green with different standards and benchmarks such as (Energy and Water
conservation, Indoor Environmental quality and eco-friendly materials selection), it
also gives the end users the assurance by a third party qualified professionals review
and certification.
Disadvantages of Environmental Rating Systems
Mainly it was about time and cost of applying these schemes. Some arguments had
been made about the necessity of following Environmental assessment schemes such
as the famous Architect Frank Gehry who raised a concern when commenting on one
of his public speeches on 2010 about "LEED" which is one of the famous assessment
schemes by saying that "its just waste of time and money", but in a later commentary
on the same topic he clarified that he respects LEED but he just did not want it to turn
into an obsession. Increase in the initial cost of buildings is somehow true due to the
extra consultant fees plus fixation of high performance fixtures and equipments and to
achieve a high performance rated building the initial cost of the building is expected
to increase 12 to 14% (Abu Dhabi Urban Planning Council AD UPC, 2010).

16
1.6 User appreciation and market awareness.
The construction market readiness for accepting environmental assessment schemes
as an extra set of green specifications and the end user appreciation for its importance
are key issues in deciding which approach from the three above mentioned
approaches to follow. A voluntary with incentives assessment schemes can suit a
good educated community with high educated industry professional while a less
educated community would fit more in a scheme with mandatory minimum simple
sets of instructions.
Having a green sustainable built environment may have some extra initial cost, that is
the main perception for the end users and market professional about green buildings
and that is the main reason why having a green building is not so popular without an
incentive or a mandatory scheme. The awareness of the Users and market
stakeholders must be raised to a level of knowledge where the benefits of a green
sustainable built environment are more clear, and that its green buildings benefits are
beyond the initial cost and that its real value comes in the operational and lifetime
expenses.
Sustainability is not about the saving the environment only, the communities
appreciate the real value of it and to understand that having a sustainable green
building will not only have a positive environmental impact but also economical,
social and cultural impacts on their lives.
1.7 Significance of the study
This study will present a literature review for some of the current available
environmental schemes around the globe, it will provide the professionals related to
the construction industry and other who are interested in green buildings development
necessary information such as: a glance on the creation of environmental schemes,
how they got developed and how they are currently performing in the market
worldwide and especially in Abu Dhabi.
The main focus of the study is the local assessment scheme of Abu Dhabi which is
Pearl Rating system and will aim to benchmark it by an overall comparative analysis
against two of the most well established schemes worldwide which are LEED of US
and BREEAM of UK. By comparing and relating the Pearls system to these schemes,

17
the study will help relating the Pearl Rating Scheme and its buildings with a wider
scale of opportunities of being certified and recognized world wide as a high efficient
green building and not only in Abu Dhabi.
1.8 Dissertation outline
The dissertation is divided into 6 Chapters plus conclusion.
The first chapter is an introduction about the reasons behind the appearance of
environmental assessment schemes and how it got developed. The second chapter
focuses on providing literature review on the scientific work on assessment schemes
in general, how it performs and relates to each other. Then the third chapter reviews
and evaluates the methodologies used in comparing assessment schemes and then
justifies the methods to be used in this study. These first three chapters provides a
basis and the background knowledge required to perform the comparative analysis of
three assessment scheme using a case study building in Abu Dhabi which will be
explained in the following three chapters.
Chapter 4 introduces the case study building by providing necessary information such
as its location, design, parameters, modeling software, etc. The first actual assessment
is conducted in Chapter 5 and then is followed chapter 6 which includes the suggested
upgrades to achieve highest performance levels in the rating scheme.
The last chapter is 7 and represents a conclusion for the study and whether or no it
succeeded to fulfill its objectives.

18
Chapter 2
Literature Review

19
2.1 Literature Review Introduction
The Review is divided in to two parts, the first part is reviewing the three rating
schemes which are in focus and the scientific work done around the build up of
these systems, the second part is reviewing the scientific work done measuring
and evaluating the effectiveness of the these three rating schemes.
A wide research work had been done around the world on Environmental Assessment
schemes on sole basis; it was found that the majority of the available papers are
mainly focusing on the US LEED rating system and British BREEAM rating system.
(LEED) stands for Leadership in Energy and Environmental Design, and (BREEAM)
stands for British Research Establishment Environmental Assessment Method. Very
limited research work has been found on Estidama PRS probably because it’s a
relatively new rating system summary for the previous science work for
Environmental assessment. It was found the majority of papers who are testing or
comparing a local assessment or rating scheme use LEED and BREEAM as a
benchmark.
Rich and diverse research work on LEED / BREEAM was reviewed but a very
limited research work had been found comparing rating systems towards each others,
however the topic of reviewing LEED, BREEAM and Estidama PRS.
2.2 Estidama Pearl Rating System (PRS) vs LEED and BREEAM
LEED and BREEAM schemes where chosen to be compared against Estidama PRS
for two reasons, the first reason was as per Roderick (2009) that LEED and BREEAM
are "The most representative building environment assessment schemes that are in use
today", the second reason that they have been in operation for more than a decade for
LEED (LEED Reference Guide, 2009) and 2 decades for BREEAM and already have
successful buildings built according to their standards (BREEAM Technical
Manual,2011).
These two schemes are widely spread and accepted around the world as international
schemes due to their " wide coverage of the environmental issues; the range of
building types that are covered; and the significant difference in scope and assessment
criteria between schemes" (Lee and Burnett, 2008). In order to be able to compare the
three schemes towards one another it was important first to review (definitions and
background, aims and objectives, contents, Certification process) as a first step then
reviewing the product of these schemes by comparing (energy performance, water
saving, Indoor environmental quality) and its impact on cost.

20
2.3 Background
LEED
(LEED) is an environmental assessment scheme that had been developed by United
States Green Building Council (USGBC) and established on 2000, LEED provides"
building owners and operators with a framework for identifying and implementing
practical and measurable green building design, construction, operations and
maintenance solutions"(USGBC, 2011). As per the Green Building Certification
Institute (GBCI), LEED has grown to cover more than 8,000 buildings on the US
alone and more than 650 buildings outside the US (GBCI, 2011) due to its easiness
and the good marketing approach by USGBC. LEED had been used also as a
reference for other newer local or regional ratings schemes such as "LEED India, or
Estidama of Abu Dhabi".
LEED has several rating systems as per the development scale and use, it consists so
far of; New Construction (NC), Existing Buildings: Operations & Maintenance (EB:
O&M), Commercial Interiors (CI), Core & Shell (CS), Schools (SCH), Retail,
Healthcare (HC), Homes, Neighborhood Development (ND). This Research will be
studying in detail the LEED for New Construction and will be referred to as LEED
NC.
BREEAM
The other competing assessment scheme is BREEAM; which was developed the
British Research Establishment (BRE), this scheme is based in UK, operated by
BREEAM UK and was established before LEED in 1990. It's defined as the
assessment method which “sets the standard for best practice in sustainable building
design, construction and operation" (BREEAM, 2011). In 21 years BREEAM had
grown to cover " 200,000 buildings with certified BREEAM assessment ratings and
over a million registered for assessment since it was first launched in 1990"
(BREEAM, 2011).
BREEAM has different rating systems based on the location and building type
including; BREEAM New Construction, BREEAM Communities, BREEAM In-Use
and BREEAM EcoHomes. in this paper will be reviewing BREEAM New
Construction 2011.

21
PRS
In the growth plan of Abu Dhabi 2030 for the Emirate of Abu Dhabi, the government
had established a vision that sustainability must be the foundation of any development
in the emirate of Abu Dhabi and therefore they established "Estidama" which is the
Arabic word for "sustainability". One of the Estidama key initiatives is Pearl Rating
System (PRS) which was designed in such a way that combined components of LEED
and BREEAM and transformed it into a more localized code that can be implemented
in Abu Dhabi. As per PRS reference book (2010), the PRS system is a "design
guidance and detailed requirements for rating a project’s potential performance in
relation to the four pillars of Estidama.",
This Rating system has three versions to cover three types of developments (Villas,
Buildings and Community) with more rating systems to be released in future such as
the system which covers the Operation and maintenance (Estidama, 2011), the Pearl
Building Rating System (PBRS) will be the system in focus in this study.
2.4 The Creation of PRS, LEED and BREEAM
The aim of LEED as stated by the USGBC was creating a system that can "define and
measure “green buildings.” (LEED, 2009), and a system that can provide a "healthful,
durable, affordable, and environmentally sound practices in building design and
construction".
LEED Objectives are:
To define green building by establishing standards of measurement.
Promoting integrated design practices.
Recognizing environmental leadership in building industry.
To increase the awareness among customers by specifying the benefits of
green building.
BREEAM also has been very clear in stating its aims as: "To mitigate the life cycle
impacts of buildings on the environment, to enable buildings to be recognized
according to their environmental benefits, to provide a credible environmental label
for buildings, to stimulate demand for sustainable buildings", and the objectives are:
To provide market recognition of buildings with a low environmental impact.

22
To ensure best environmental practice is incorporated in building planning,
design, construction and operation.
To define a robust, cost-effective performance standard surpassing that
required by regulations.
To challenge the market to provide innovative, cost effective solutions that
minimizes the environmental impact of building.
To raise the awareness amongst owners, occupants, designers and operators of
the benefits of buildings with a reduced life cycle impact on the environment.
To allow organizations to demonstrate progress towards corporate
environmental objectives. (BREEAM NC, 2011).
The aim of PRS is "to address the sustainability of a given development throughout its
lifecycle from design through construction to operation.", and its objectives are:
Mitigating the negative impacts of buildings on the environment.
Providing healthy high performance buildings.
Increasing the awareness of the end users and construction market in Abu
Dhabi.
Providing credible "local" environmental label for buildings.
2.5 Certification Process
Elgendy (2010) describes Pearls systems as a “hybrid between BREEAM and LEED”.
In BREEAM, it depends on using assessors trained under a United Kingdom
Accreditation Service (UKAS) in an accredited competent person scheme (BREEAM,
2011). LEED doesn’t have an intermediate assessor and depends on a web based
online system where “project teams can manage project details, complete
documentation requirements for LEED credits and prerequisites, upload supporting
files, submit applications for review, receive reviewer feedback, and ultimately earn
LEED certification” (USGBC, 2011), this online system of LEED as per Elgendy
(2010) may “reduces interaction and dialogue between building professionals and the
USGBC to a minimum” which may be a downside. LEED had planned to overcome
this by encouraging the involvement of a LEED Accredited Professional (AP) within
the design team where projects will be awarded one point if there is a LEED AP
onboard, this AP will guide the team through the certification process. Pearls system

23
aimed to combine the merits of the two systems by having both a dedicated competent
assessor who reviews the project and a mandatory Pearl Qualified Professional (PQP)
within the design team.
Estidama Pearls Rating System
Different than LEED and BREEAM, pearls system was designed to be an integral part
of the local building regulations of Abu Dhabi, therefore as shown in fig. 2.1 the
certification will be issued from the government (Abu Dhabi Municipality ADM is
responsible for 1 pearls projects, and Urban Planning council for 2-5 pearls).
Fig. 2.1 shows the process as follows:
Appointing a Pearl Qualified Professional (PQP) and Registration: The project team
shall appoint a PQP as early as possible to guide the team through Estidama process,
register and follow-up the project with the Assessor from UPC or ADM.
Figure 2.1 Estidama UPC Assessment and Certification Flowchart (Estidama website, 2011).

24
Preparing and submitting the application: PQP with the project team will start the
process by deciding how many pearls will be targeted, then he will be responsible for
collating all the required data and calculations from the team to prove compliance
with the targeted certification level, the next step is Submitting the application by the
PQP to UPC/ADM for review.
Reviewing the application: one assessor will be appointed on the project and will
review the project on two steps, the first step is reviewing the documents for
completeness, a process that would take two working days and ends with a
notification of completeness or incompleteness of documents to the PQP, when the
documents are complete the assessor will start a detailed review for the documents
based on the targeted level of certification, this review takes from 5 to 15 days (5 for 1
pearl and 15 days for 2 pearls), review 3 to 5 pearls will require extra 4 weeks as per
Estidama website (2011).
Certification: if the project proved to be compiling with pearls, a “Notification of
Pearl Compliance (NOPC) will be issued to both the project PQP/PVRS Professional
and the respective Municipality” (Estidama, 2011). After construction the project
must resubmit a construction application with the same above procedure and the
design certificate will be expired.
LEED
GBCI divides the process into five stages: Registration, preparing application, submit
application, application review and certification.
Figure 2.2 GBCI’s Project Certification Overview (GBCI, 2011).

25
Fig. 2.2 shows the process as follows:
Registration: The process starts by registering the project online, the flat fees at the
present are 900$ for USGBC Members and 1200$ for Non-Members, the registration
gives the team access to a variety of tools and resources that help the projects go
through certification, then the project will be listed in the LEED online project
directory.
Preparing application: at this stage project team select the credits, then start
collecting data and make the calculation required for achieving the prerequisites and
optional credits, when the team finishes gathering information it uploads the
documents for review.
Submit application and review: LEED project administrator will submit the project
documents for review with the relevant fees which varies with the project area and the
review stage (Design or construction). There are two types of applications (split and
combined applications), split application is dividing it into design and construction
phase while combined is only one combined submittal, review process follows the
type of submission with the opportunity to appeal with 25 days of the result.
Certification: LEED has one Main construction certification stage and an option
design stage review, after the construction submittal review is finished and design
team accepts the result, GBCI will award the certified projects with “a formal
certificate of recognition”, “information on how to order plaque and certificates,
photo submissions, and marketing”, and with the owners discretion included in
“online LEED Project Directory of registered and certified projects” and in the US
department of energy high performance buildings database.
BREEAM
The process of BREEAM assessment promotes the dialogue between the design team
and a qualified independent assessor by mandating appointing the later in assessing
the project, BREEAM encourages the early appointment of this assessor in order to
ensure a smooth process, Saunders (2008) had outline BREEAM process as shown in
Fig 2.3.

26
Registration: Registering the development online or by post comes as a first step, and
then an “Assessment Reference Number” will be given to the team.
BREEAM Assessor: The Project team appoints an independent assessor who will
collates all required data that confirms compliance and conduct the required
assessments with the support of BREEAM customer support team.
Assessment Report Submitted: After the report is compiled the assessor submits the
report to the BREEAM office for Quality assurance which costs from 740 Euros to a
maximum of 1500 Euros for a standard BREEAM office report, this process takes 3
weeks to certification is the report passes from the first time.
Certification: Upon successful Quality Assurance a certification will be issued, after
design stage the team can apply for interim design stage BREEAM certification,
while the final one comes after construction.
Figure 2.3 BREEAM Assessment and Certification Stages (BREEAM, 2011).
Pre- Agreement
Pre- Agreement
Appraisal
Design Brief
Concept
Design Development
Technical Design
Production Info.
Tender Doc.
Tender Action
Mobilization
Const. to Practical Completion
Post Completion
Initial Occupation
Post Occupation Evaluation
Preparation
Design
Construction
Use
Pre-
Construction
Pre-Assessment
Stage
Design Stage
Assessment
Interim Design Stage
BREEAM Certification
Construction Stage
Assessment/ Review
Final Post Construction
Stage BREEAM
Certification
27
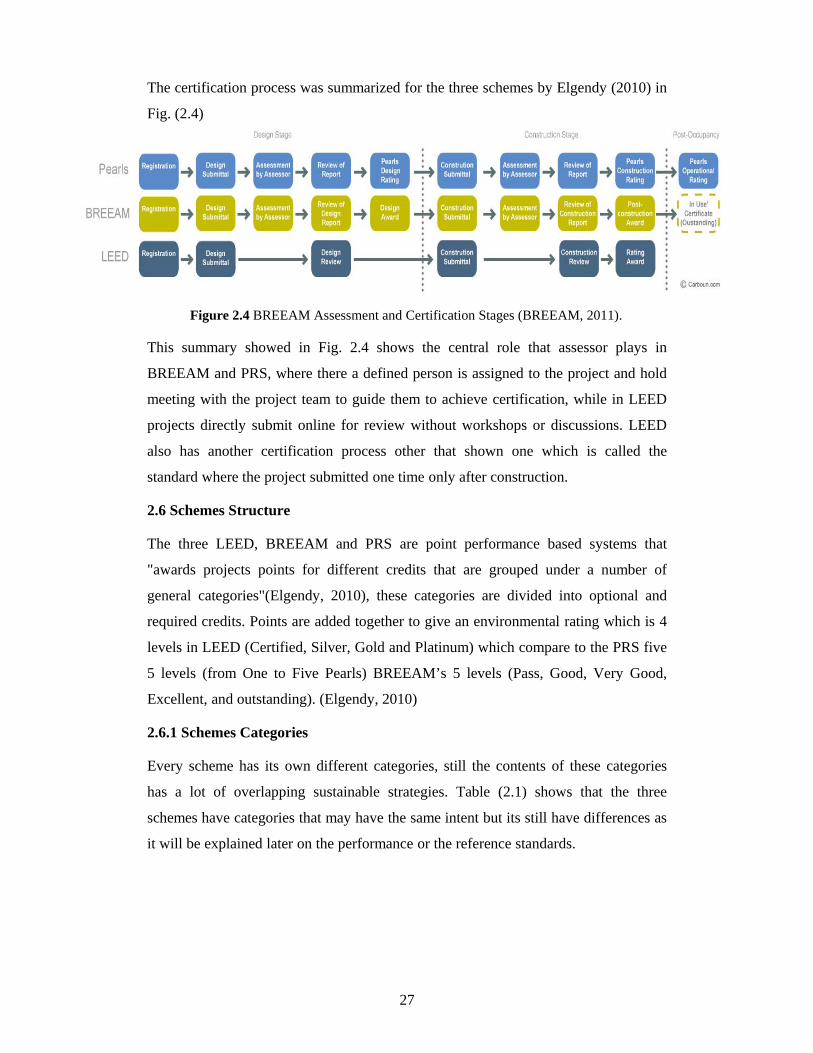
The certification process was summarized for the three schemes by Elgendy (2010) in
Fig. (2.4)
This summary showed in Fig. 2.4 shows the central role that assessor plays in
BREEAM and PRS, where there a defined person is assigned to the project and hold
meeting with the project team to guide them to achieve certification, while in LEED
projects directly submit online for review without workshops or discussions. LEED
also has another certification process other that shown one which is called the
standard where the project submitted one time only after construction.
2.6 Schemes Structure
The three LEED, BREEAM and PRS are point performance based systems that
"awards projects points for different credits that are grouped under a number of
general categories"(Elgendy, 2010), these categories are divided into optional and
required credits. Points are added together to give an environmental rating which is 4
levels in LEED (Certified, Silver, Gold and Platinum) which compare to the PRS five
5 levels (from One to Five Pearls) BREEAM’s 5 levels (Pass, Good, Very Good,
Excellent, and outstanding). (Elgendy, 2010)
2.6.1 Schemes Categories
Every scheme has its own different categories, still the contents of these categories
has a lot of overlapping sustainable strategies. Table (2.1) shows that the three
schemes have categories that may have the same intent but its still have differences as
it will be explained later on the performance or the reference standards.
Figure 2.4 BREEAM Assessment and Certification Stages (BREEAM, 2011).
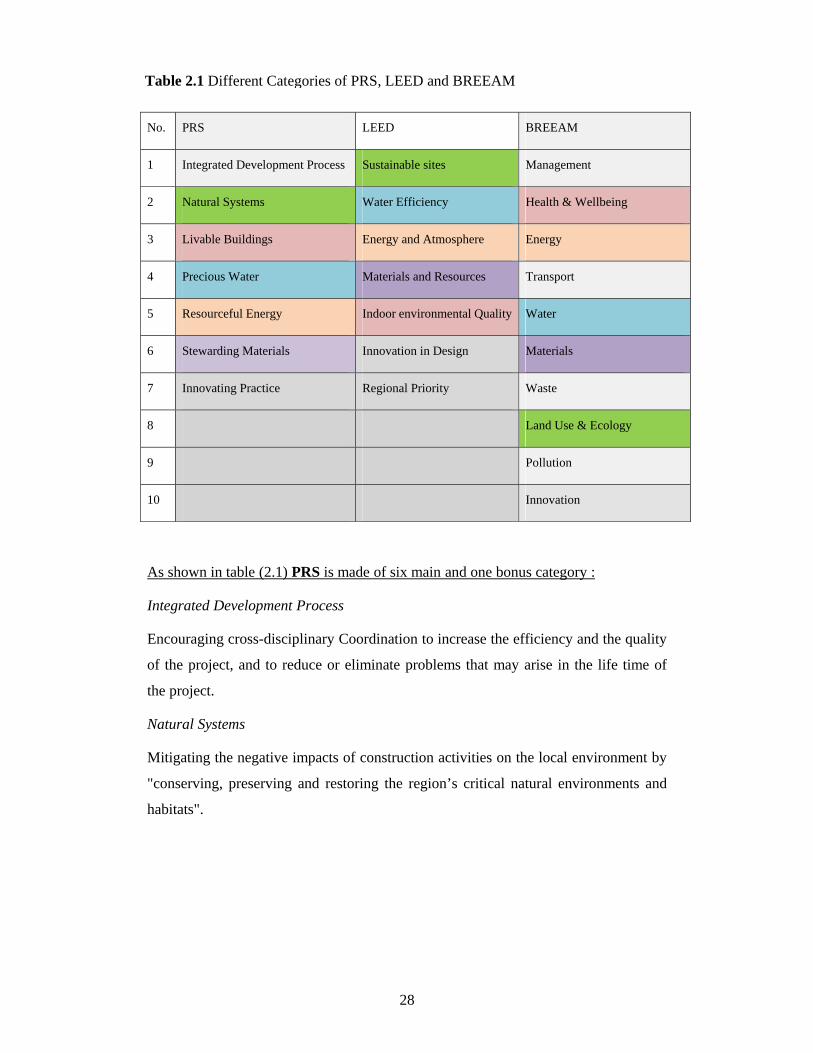
28
No. PRS LEED BREEAM
1 Integrated Development Process Sustainable sites Management
2 Natural Systems Water Efficiency Health & Wellbeing
3 Livable Buildings Energy and Atmosphere Energy
4 Precious Water Materials and Resources Transport
5 Resourceful Energy Indoor environmental Quality Water
6 Stewarding Materials Innovation in Design Materials
7 Innovating Practice Regional Priority Waste
8 Land Use & Ecology
9 Pollution
10 Innovation
As shown in table (2.1) PRS is made of six main and one bonus category :
Integrated Development Process
Encouraging cross-disciplinary Coordination to increase the efficiency and the quality
of the project, and to reduce or eliminate problems that may arise in the life time of
the project.
Natural Systems
Mitigating the negative impacts of construction activities on the local environment by
"conserving, preserving and restoring the region’s critical natural environments and
habitats".
Table 2.1 Different Categories of PRS, LEED and BREEAM

29
Livable Buildings
Improving the Indoor Environmental Quality (IEQ) quality, the outdoor comfort and
connectivity with the context.
Precious Water
Water is one of the major issues in the Middle East, PRS gave a great emphasis to
water saving, this category targets conserving and reducing the use of water by using
high efficient fixtures and minimizing the use of potable water.
Resourceful Energy
Energy conservation through "passive design measures, reduced demand, energy
efficiency and renewable sources".
Stewarding Materials
"Ensuring consideration of the ‘whole-of-life’ cycle when selecting and specifying
materials".
Innovating Practice
This category was placed as per LEED and BREEAM to give a bonus to innovations
in "building design and construction to facilitate market and industry transformation".
As appears in table 2.1 and as PRS, LEED NC also consists of seven sections:
Sustainable Sites
In this category LEED deals with the relation of building of study with it's
surrounding, such as reducing or eliminating the pollution resulting from construction
activity, site selection, community connectivity and development density,
transportation to the site, storm water design, reduction of heat islands and light
pollution.
Water Efficiency
In this one, it's mainly about reduction of potable water consumption by using high
performance water fixtures and using grey and black water where possible.
\

30
Energy and Atmosphere
This Category aims to reduce energy consumption and gas emissions by conducting
systems commissioning and the use of energy modeling to predict how a building
may operate in future and correct it early in the design phase, it aimed to achieve this
reduction also by introducing energy efficient equipments and the green power and
renewable resources.
Materials and Resources
40 % of the generated waste is from Construction activities, this category is all about
optimizing materials use to reduce the demand on new virgin materials and therefore
reduce pressure on the environment. Strategies such as building reuse and
construction waste management were used, also encouraging the use of reused,
recycled, rapidly renewable materials and certified wood "the wood which grows in
environmentally managed forests".
Indoor environmental Quality
As per LEED 2009, US citizens spend 90% of their time indoors; this shows the
importance of this category, it covers the ventilation rates, tobacco smoke control,
outdoor air delivery monitoring, increased ventilation, indoor air quality management
during and after construction, the use of low emitting materials such as (adhesives,
sealants, paints, coatings, flooring systems, composite wood and agrifiber products), it
also includes Indoor Chemical and Pollutant Source Control, encourages the
Controllability of Systems such as (lighting and thermal comfort), thermal comfort
design and verification and daylight and views.
Innovation in Design
This category aims to encourage the innovation by awarding extra bonus credits from
exemplary performance and involvement of a LEED accredit professional in the
project.
Regional Priority
In order to increase the spread of LEED around the world, this category had been
introduced in the LEED 2009; in this one extra incentive was introduced to specific
credits that changes according to the region in which the assessment is taking place.

31
BREEAM, consists of ten sections:
Management
Encouraging coordination between the project team with client, assuring the
implementation of best environmental practices in Design, Construction and operation
in a cost effective manner.
Health and Well being
Providing a healthy high quality Indoor Environmental Quality (IEQ)
Energy
Emissions reduction by energy and emissions monitoring, and the use of energy
efficient equipments.
Transport
Reducing the negative impacts of automobiles on the environment by providing
alternative green transportation.
Water
Reducing consumption through monitoring, leak detection and the use of water
efficient fixtures.
Materials
Ensuring taking the account of the life cycle of the materials.
Waste
Promoting reduction of waste generated during construction and operation through
management, use of recycled materials and the involvement of the end use in the
choice of materials.
Land use and Ecology
Reducing/Eliminating the negative impacts of construction on the environment
through proper site selection, mitigating impact and enhancing site ecology.
Pollution
Eliminating sources of air, water and noise pollution.
Innovation
Encouraging innovation in implementing best environmental practices.
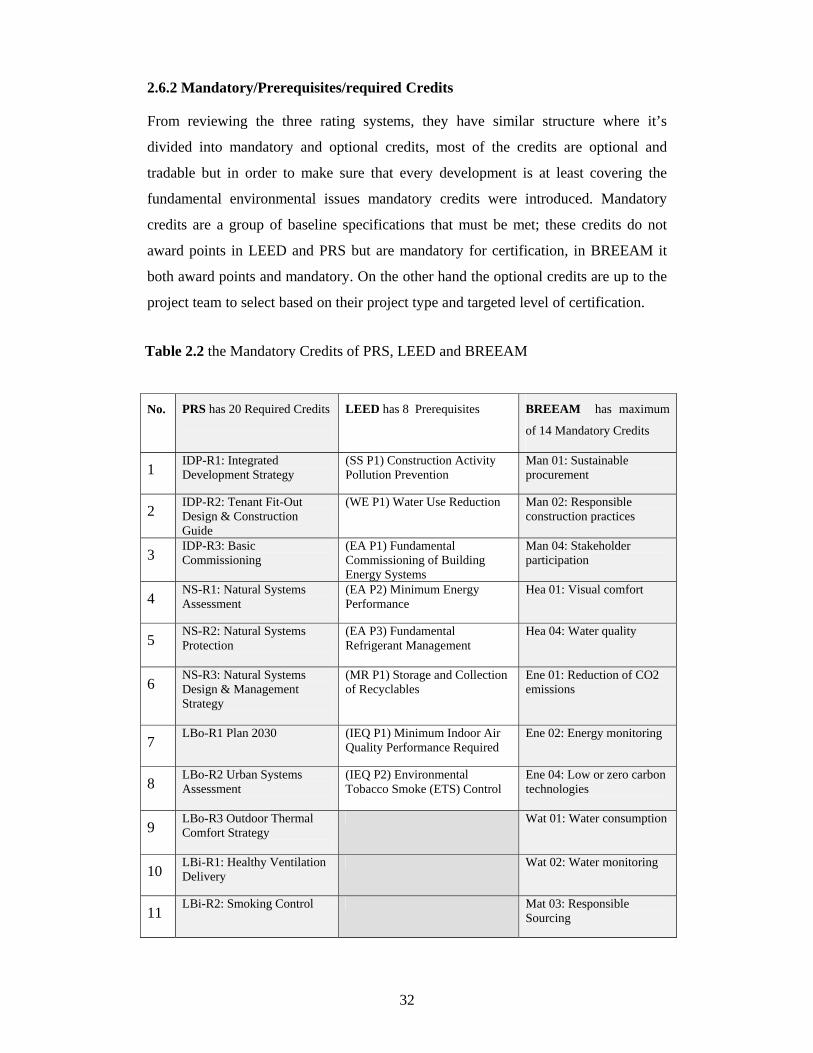
32
2.6.2 Mandatory/Prerequisites/required Credits
From reviewing the three rating systems, they have similar structure where it’s
divided into mandatory and optional credits, most of the credits are optional and
tradable but in order to make sure that every development is at least covering the
fundamental environmental issues mandatory credits were introduced. Mandatory
credits are a group of baseline specifications that must be met; these credits do not
award points in LEED and PRS but are mandatory for certification, in BREEAM it
both award points and mandatory. On the other hand the optional credits are up to the
project team to select based on their project type and targeted level of certification.
No. PRS has 20 Required Credits
LEED has 8 Prerequisites BREEAM has maximum
of 14 Mandatory Credits
1 IDP-R1: Integrated Development Strategy
(SS P1) Construction Activity Pollution Prevention
Man 01: Sustainable procurement
2 IDP-R2: Tenant Fit-Out Design & Construction Guide
(WE P1) Water Use Reduction Man 02: Responsible construction practices
3 IDP-R3: Basic Commissioning
(EA P1) Fundamental Commissioning of Building Energy Systems
Man 04: Stakeholder participation
4 NS-R1: Natural Systems Assessment
(EA P2) Minimum Energy Performance
Hea 01: Visual comfort
5 NS-R2: Natural Systems Protection
(EA P3) Fundamental Refrigerant Management
Hea 04: Water quality
6 NS-R3: Natural Systems Design & Management Strategy
(MR P1) Storage and Collection of Recyclables
Ene 01: Reduction of CO2 emissions
7 LBo-R1 Plan 2030 (IEQ P1) Minimum Indoor Air
Quality Performance Required Ene 02: Energy monitoring
8 LBo-R2 Urban Systems Assessment
(IEQ P2) Environmental Tobacco Smoke (ETS) Control
Ene 04: Low or zero carbon technologies
9 LBo-R3 Outdoor Thermal Comfort Strategy
Wat 01: Water consumption
10 LBi-R1: Healthy Ventilation Delivery
Wat 02: Water monitoring
11 LBi-R2: Smoking Control Mat 03: Responsible
Sourcing
Table 2.2 the Mandatory Credits of PRS, LEED and BREEAM

33
12 LBi-R3: Legionella Prevention
Wst 01: Construction waste management
13 PW-R1: Minimum Water Use Reduction
Wst 03: Operational waste
14 PW-R2: Exterior Water Monitoring
LE 03: Mitigating ecological impact
15 RE-R1: Minimum Energy Performance
16 RE-R2: Energy Monitoring & Reporting
17 RE-R3: Ozone Impacts of Refrigerants & Fire Suppression Systems
18 SM-R1: Hazardous Materials Elimination
19 SM-R2: Basic Construction Waste Management
20 SM-R3: Basic Operational Waste Management
As shown in Table 2.2, PRS has the highest number of mandatory credits (20 credits)
and includes almost all LEED Prerequisites except the construction activity pollution
prevention. Abu Dhabi Municipality had mandated all the new projects in the emirate
to achieve minimum this 20 required credits, and there is no new building permit can
be issued before a confirmation of compliance from the reviewing authority of PRS
which is AD UPC.
The “Required credits” of PRS and the Prerequisites of LEED are constant in all the
certification levels, the only difference is that in PRS a project can gain the lowest
certificate of compliance by only following only these required credits, while in
LEED any certification level is a combination between a mandatory and required
credits.
LEED and BREEAM are different than PRS and their lowest certification level
mandates a combination between mandatory and optional credits.
In BREEAM, Mandatory credits here are different as it increases with the certification
level as shown in the Table 2.3 from BREEAM.

34
From the reviewing the mandatory credits, LEED and Pearls have in common
mandating energy and water use reduction, reducing or eliminating refrigerants,
building commissioning and operational waste management. Pearls and BREEAM
share mandating the integrated design management process of the project in order to
ensure the production of a sustainable project.
Pearls is the system with the most mandatory requirements, reasons probably because
the mandatory credits are a building code mandated, while for LEED and BREEAM,
Table 2.3 Minimum BREEAM standards by rating level (BREEAM, 2011)
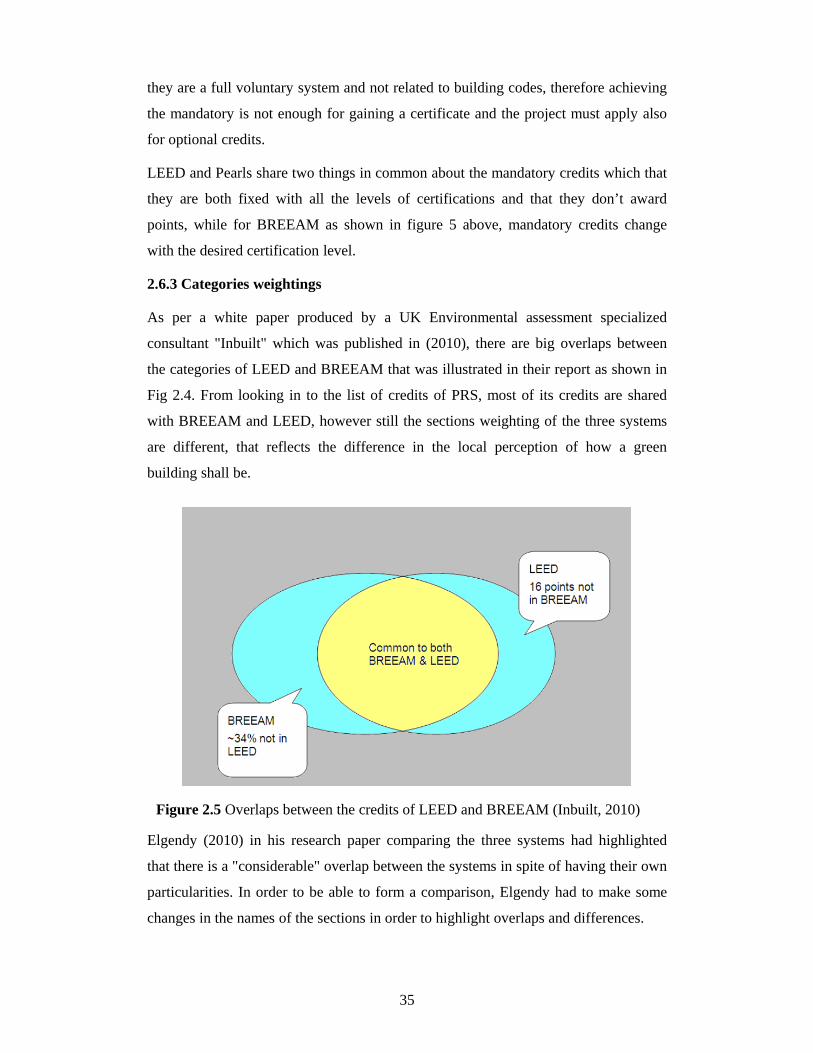
35
they are a full voluntary system and not related to building codes, therefore achieving
the mandatory is not enough for gaining a certificate and the project must apply also
for optional credits.
LEED and Pearls share two things in common about the mandatory credits which that
they are both fixed with all the levels of certifications and that they don’t award
points, while for BREEAM as shown in figure 5 above, mandatory credits change
with the desired certification level.
2.6.3 Categories weightings
As per a white paper produced by a UK Environmental assessment specialized
consultant "Inbuilt" which was published in (2010), there are big overlaps between
the categories of LEED and BREEAM that was illustrated in their report as shown in
Fig 2.4. From looking in to the list of credits of PRS, most of its credits are shared
with BREEAM and LEED, however still the sections weighting of the three systems
are different, that reflects the difference in the local perception of how a green
building shall be.
Elgendy (2010) in his research paper comparing the three systems had highlighted
that there is a "considerable" overlap between the systems in spite of having their own
particularities. In order to be able to form a comparison, Elgendy had to make some
changes in the names of the sections in order to highlight overlaps and differences.
Figure 2.5 Overlaps between the credits of LEED and BREEAM (Inbuilt, 2010)
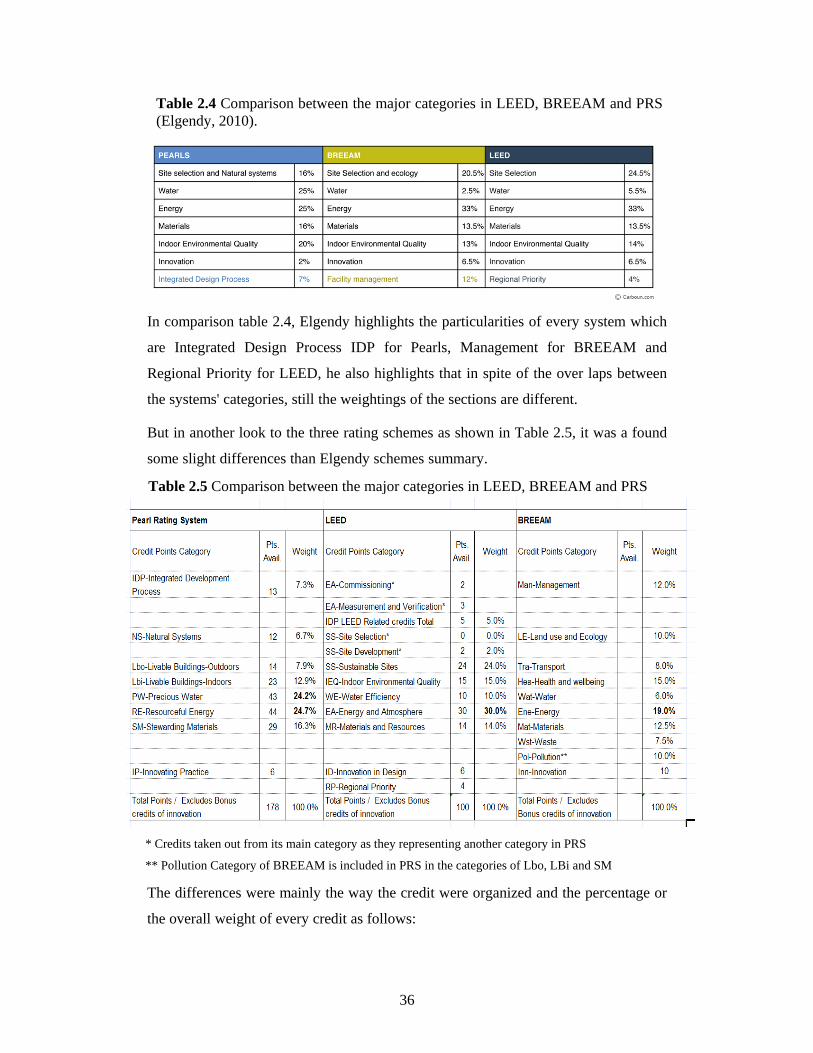
36
In comparison table 2.4, Elgendy highlights the particularities of every system which
are Integrated Design Process IDP for Pearls, Management for BREEAM and
Regional Priority for LEED, he also highlights that in spite of the over laps between
the systems' categories, still the weightings of the sections are different.
But in another look to the three rating schemes as shown in Table 2.5, it was a found
some slight differences than Elgendy schemes summary.
The differences were mainly the way the credit were organized and the percentage or
the overall weight of every credit as follows:
Table 2.4 Comparison between the major categories in LEED, BREEAM and PRS (Elgendy, 2010).
Table 2.5 Comparison between the major categories in LEED, BREEAM and PRS
* Credits taken out from its main category as they representing another category in PRS
** Pollution Category of BREEAM is included in PRS in the categories of Lbo, LBi and SM

37
Sustainable sites (SS) and Natural systems (NS)
In Elgendy (2010) comparison, sustainable sites category is mentioned as site
selection which is only one credit in LEED, the comparison shows that LEED and
BREEAM puts more emphases on site selection than in Pearls, however it seems
more appropriate to related the sustainable systems category of LEED to the Livable
outdoor category of PRS as it has similar topics.
Water
There are big differences between the three systems regarding "Water" credits, as per
Elgendy (2010) represents 25% in Pearls, represents only 2.5 % in BREEAM and
5.5% in LEED. This was found true when this was recalculated in this research but
the percentages was as follows: 25% in Pearls,6 % in BREEAM and 10% in LEED.
This high importance of water credits in PRS seems convenient especially when
looking to that fact that "the Emirates ranks third in the world in terms of the volume
of sea water desalinated daily, at 4.7million cubic meters every day", and since water
is not as major issue in UK and US as in the middle east, they put it with lower
weight, also it seems like Pearls cover more issues especially in the exterior water use
by adding credits for water use reduction for heat rejection and another credit for
water use reduction for in water features and swimming pools, plus awarding what
BREEAM and LEED awards also such as water use reduction, waste water recycling
and landscaping water use reduction .
Energy
As per Elgendy (2010) in table 2.4, energy represents the highest category in the
Pearls system (25%) but still lower than those of LEED and BREEAM (33%), this
was a direct category comparison, but when similar related credits of these schemes
are been compared together as shown in table 2.5, the percentages changes where
LEED leads the scene with the energy credits worth 30% then PRS comes second
with 25% then BREEAM with 19%, these percentages is a direct translation of how
important saving energy is for the three assessment schemes.
Energy performance credits of LEED and BREEAM are nearly same (14.5%) and
(14.7%) but less in Pearls systems around (8.4%), as shown in Fig. 2.5 and Fig 2.6 the
maximum percentage reduction energy use in PRS is (60%) and (48%) while
BREEAM aims for the zero
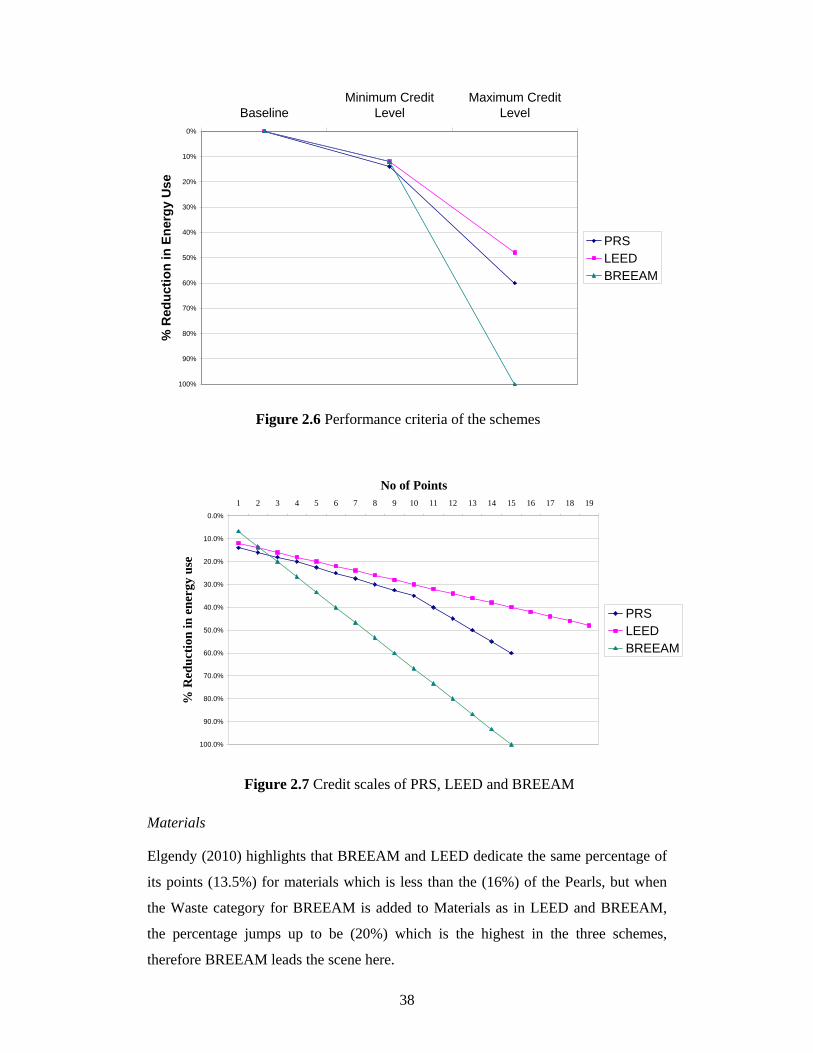
38
0.0%
10.0%
20.0%
30.0%
40.0%
50.0%
60.0%
70.0%
80.0%
90.0%
100.0%
1 2 3 4 5 6 7 8 9 10 11 12 13 14 15 16 17 18 19
No of Points
% R
edu
ctio
n in
en
ergy
use
PRSLEEDBREEAM
0%
10%
20%
30%
40%
50%
60%
70%
80%
90%
100%
BaselineMinimum Credit
LevelMaximum Credit
Level
% R
edu
ctio
n i
n E
ner
gy
Use
PRSLEEDBREEAM
Materials
Elgendy (2010) highlights that BREEAM and LEED dedicate the same percentage of
its points (13.5%) for materials which is less than the (16%) of the Pearls, but when
the Waste category for BREEAM is added to Materials as in LEED and BREEAM,
the percentage jumps up to be (20%) which is the highest in the three schemes,
therefore BREEAM leads the scene here.
Figure 2.7 Credit scales of PRS, LEED and BREEAM
Figure 2.6 Performance criteria of the schemes
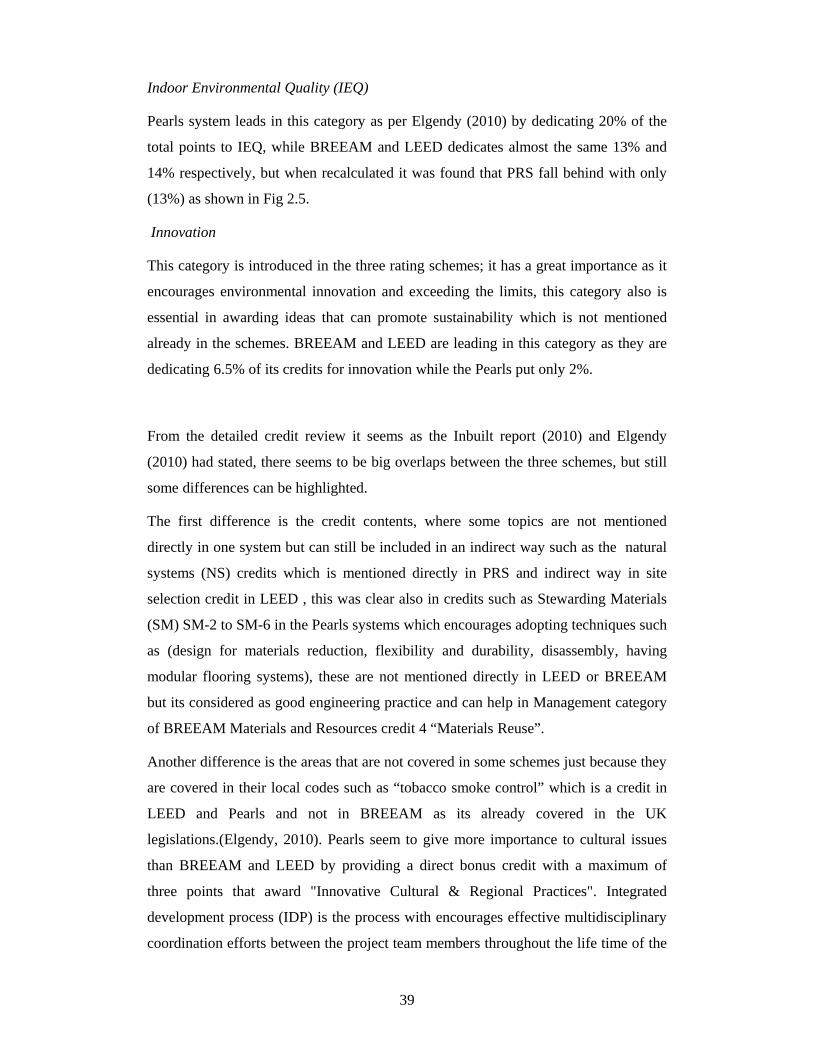
39
Indoor Environmental Quality (IEQ)
Pearls system leads in this category as per Elgendy (2010) by dedicating 20% of the
total points to IEQ, while BREEAM and LEED dedicates almost the same 13% and
14% respectively, but when recalculated it was found that PRS fall behind with only
(13%) as shown in Fig 2.5.
Innovation
This category is introduced in the three rating schemes; it has a great importance as it
encourages environmental innovation and exceeding the limits, this category also is
essential in awarding ideas that can promote sustainability which is not mentioned
already in the schemes. BREEAM and LEED are leading in this category as they are
dedicating 6.5% of its credits for innovation while the Pearls put only 2%.
From the detailed credit review it seems as the Inbuilt report (2010) and Elgendy
(2010) had stated, there seems to be big overlaps between the three schemes, but still
some differences can be highlighted.
The first difference is the credit contents, where some topics are not mentioned
directly in one system but can still be included in an indirect way such as the natural
systems (NS) credits which is mentioned directly in PRS and indirect way in site
selection credit in LEED , this was clear also in credits such as Stewarding Materials
(SM) SM-2 to SM-6 in the Pearls systems which encourages adopting techniques such
as (design for materials reduction, flexibility and durability, disassembly, having
modular flooring systems), these are not mentioned directly in LEED or BREEAM
but its considered as good engineering practice and can help in Management category
of BREEAM Materials and Resources credit 4 “Materials Reuse”.
Another difference is the areas that are not covered in some schemes just because they
are covered in their local codes such as “tobacco smoke control” which is a credit in
LEED and Pearls and not in BREEAM as its already covered in the UK
legislations.(Elgendy, 2010). Pearls seem to give more importance to cultural issues
than BREEAM and LEED by providing a direct bonus credit with a maximum of
three points that award "Innovative Cultural & Regional Practices". Integrated
development process (IDP) is the process with encourages effective multidisciplinary
coordination efforts between the project team members throughout the life time of the
40
project, this process is very important to produce a sustainable green and performance
efficient building as tends to tackle most of the obstacle as early as possible. One of
the things that differs Pearls from LEED and BREEAM is that it requests IDP clearly
and even mandates preparing and implementing an Integrated Development Strategy.
From the overall look at the credits selection and its weightings, its seems that every
rating scheme was designed as a response and under the influence of the local
problems/challenges in its country of origin, where for LEED, it is" geared towards
climates which use mechanical ventilation and air conditioning and where existing
infrastructure promotes the use of cars as is the case in much of the United States"
(Elgendy, 2010), while for BREEAM it " responds to a built environment where
natural ventilation is more prevalent and where a strong public transportation
infrastructure exists " (Elgendy, 2010), for Pearls it has also its special local
influences where it dedicates half of its points structure for saving water and energy
the two main challenges in the middle east region.
2.7 The effectiveness of PRS, LEED and BREEAM
Measuring the effectiveness of a rating scheme and whether or not it has succeeded to
achieve its aims and objectives has been the topic of some research papers especially
on LEED and BREEAM. PRS is a new born systems with no buildings constructed
yet, therefore wasn’t not possible to measure its effectiveness but its still possible to at
least predict or have some ideas from what happened with the two elder schemes
LEED and BREEAM.
There seem to be two main approaches in analyzing and comparing assessment
schemes, one is on the design phase and the other one is after completion as post
occupancy evaluation for an assessed building, both have their benefits. Comparing
schemes on the design phase can help on direct horizontal evaluation between the
assessment schemes, while on the other hand post occupancy can help creating a
vertical evaluation of the product against design intentions.
Most of the Reviewed research papers that chose to perform horizontal comparisons
between assessment schemes preferred to have wide comparison with no area of focus
while deep comparison chose to focus mainly in Energy consumption and Indoor
Environmental Quality.

41
2.7.1 Energy Consumption
Most of the research papers which are comparing environmental assessment schemes
are using energy performance as a basis for comparison, this seems understandable as
LEED and BREEAM puts the high percentage of the schemes points on Energy
related strategies.
In a comparison between LEED, BREEAM and the Australian scheme Green Star,
Roderick (2008) had aimed to compare how buildings energy performance is assessed
and awarded in the 3 schemes. He highlighted that the energy performance credits
weights are nearly the same in the compared schemes (between 14.1% to 14.7%), he
also stated that the unit of measuring the energy consumption is different were
BREEAM calculations are based on CO2, Green Star on green house gas emission
and dollars for LEED. The study had concluded that measuring the performance of a
building depends strongly on the used assessment scheme where “The case study
office building received a high energy rating score in the Green Star scheme, but a
low energy rating in BREEAM and it even failed to be certified in the LEED
scheme”. This result raises the concern that different assessment schemes are not
related and that a certified building under a specific scheme may not be good enough
when assessed by other standard, and therefore two of the main of objectives of
environmental assessment schemes which is defining green buildings and recognizing
it, had been compromised.
Table 2.6 General Comparison for Energy Performance assessment criteria between LEED, BREEAM and HK-BEAM (Lee and Burnett, 2008).

42
Lee and Burnett (2008), had another opinion when they compared BREEAM, LEED
and HK-BEAM (the local assessment scheme of Hong Kong), and although they
highlighted that the schemes are different in “scope and assessment criteria” as shown
in Table 2.6, they concluded that “The difference in energy use assessment methods,
baseline buildings, simulation tools and performance criteria do not affect the
assessment results” but they highlighted that its harder to score under BREEAM.
Another group of researchers aimed to evaluate a specific environmental assessment
scheme by comparing it with its product building after operations data, this approach
was adopted by Sabapathy et al. (2010) when they tried to benchmark the
performance of LEED rated buildings for "Information Technology facilities in
Bangalore, India", in the paper they concluded that on average "LEED rated buildings
outperform the other buildings" in terms of energy efficiency.
2.7.2 Water
There is very few research work done regarding water saving for green buildings and
the energy saving related to the reduction in water use, most of the work which was
done was just a direct comparison of the required water reduction percentages
between different assessment schemes. Elgendy (2010) has tackled the water issue
slightly in his comparison paper and highlighted that Pearls dedicates a large
percentage of its credits to water credits to overcome its high consumption problem
and there is also the Inbuilt report (2010), which highlight the differences between the
water credits in LEED and BREEAM.
2.7.3 Indoor Environmental Quality (IEQ)
IEQ consists of different components such as:
- Indoor Air Quality (IAQ)
- Thermal Comfort
- Daylight
- Views
- Acoustical Comfort
All of these components are related to the occupants' satisfaction and in order to
evaluate if assessment schemes had succeeded to achieve these components or no,
post occupancy evaluation must be conducted.

43
There have been an extensive research work around this topic, and it was done either
as direct brief credit by credit comparisons such as the Inbuilt report (2010) and
Elgendy (2010) research papers, or as post occupancy evaluations for the IEQ
performance in general of a specific building, where the researcher test the building
post occupancy against its design intent.
The majority of the research work on IEQ was conducted as post occupancy
evaluations such as the work of Clara et al. (2010) about the" Evaluation of Indoor
Environment Quality with a Web-based Occupant Satisfaction Survey" and Lee and
Kim (2008) who used a secondary data " the online database of the Occupant Indoor
Environmental Quality (IEQ) Survey from the Center for the Built Environment
(CBE) at the UC, Berkeley" to evaluate the IEQ in the LEED-certified buildings in
the US, these papers in addition to Heerwagen and Zagress (2005) research work have
all found evidence that there are actual real improvement in the LEED buildings in
terms of IEQ and that the only negative was acoustics. Acoustics are not covered in
LEED while it's covered in BREEAM/PRS systems.
On the other hand, there was another opinion which was less spread, that says that
green buildings are not better than conventional buildings in terms of IEQ and
especially in thermal comfort (Paul and Taylor, 2008) and Acoustics (Heerwagen and
Zagress, 2005).As per Heerwagen and Zagress (2005) it's widely believed that green
buildings has more comfortable environment than conventional but there is little
empirical evidence supporting that. Paul and Taylor (2008) also had investigated the
concept of green buildings by comparing it with a conventional building, the aim of
the study was to test the statement which says that “green buildings perform better
and have better IAQ than conventional”, and they concluded that there is no evidence
to believe that statement.
Between these two opinions the debate of whether green building provide more
comfortable indoor environment remains unresolved.
There were also another group of researches who focused on only a specific aspect
and not the general look of IEQ of green buildings. Huizenga et al. (2006) had studied
the air quality and thermal comfort only through post occupancy online survey for
215 buildings in US, Canada and Finland; they found that most of the buildings fail in
the thermal comfort and IAQ scores higher. Also there is Mardaljevi (2009) research
work, where he tried to relate the quality of day lighting in spaces with energy

44
savings, where he stressed on that " energy considerations should ideally make
account of the impact that daylight has on heating/cooling load as well as on electric
lighting usage" and that computer modeling for day lighting is an essential step in
predicting the day light levels but must be followed on a later stage after occupancy to
"both validate and calibrate the predictions obtained from daylight simulations, and
provide information that allows corrections for observed user behavior and system
performance."
It seems from the reviewed paper on the evaluation of IEQ that most of it depends on
post occupancy surveys to check whether or no the green buildings are performing as
per the design intent.
2.7.4 The Impact of Environmental Assessment Schemes on Cost
Since creation of environmental assessment schemes the question of how much does
it cost had always been raised, this created a debate because the actual savings in
green buildings are in the operational cost, but in a market driven building industry,
reduction in operational costs is not enough and that the initial cost has just the same
importance for the market.
The Increase on Demand of Green Buildings
Buildings are huge investment in time and cost, the demand of having a green
building is increasing with time whereas per McGraw Hill Construction in Green
outlook (2009), the overall value of green building market is estimated to be between
36 billion to $49 billion with an expected increase to reach of $96 billion to $140
billion by 2013.
Main obstacle
And although the interest in having green building is significantly increasing, still
there are some obstacles facing this increase. The main obstacle is that it all comes
down to the cost of having a green building and for some clients it all comes down to
only the "Initial cost", and since most of the green technologies especially on the side
of energy generation are still on research and development (R&D) process it do
impact the cost and requires an extra incentive. That is considered to be the major
obstacle of having outstanding buildings interims of green buildings standards.
Main opportunity
In Green buildings the main investment lies in the operational costs and the market
value whereas per Royal Institute of charted surveyors (RICS) report “there is an

45
observable link between the values achieved in the market place for commercial
properties and their sustainability credentials” and that the increase is around 6%.
Two opinions
Langdon (2004) had conducted a study on the cost of impact of LEED on Buildings
under the name "Costing Green: A Comprehensive Cost Database and Budget
Methodology", the study concluded the following:
1. Many projects are achieving LEED within their budgets and in the same cost range
as non-LEED projects.
2. Construction costs have risen dramatically, but projects are still achieving LEED.
3. The idea that green is an added feature continues to be a problem.
Davis Langdon had revisited the same topic three years later (2007) and had the same
conclusion that "...there is no significant difference in average cost for green buildings
as compared to non-green buildings".
On the other hand there are a lot research work claims that green buildings do actually
cost more than conventional building. Rawlinson (2007) of Davis Langdon had made
a case study on an office building designed to meet a BREEAM Excellent rating, he
concluded that there is a "6% premium is due to sustainable design features for the
building", Langdon (2007) also had conducted another study on the Australian
scheme "Green Stars", and as shown in the Fig 2.5 it actually shows a rise in the
construction costs for more green buildings which lead to direct increase in the initial
cost of buildings.
Figure 2.8 the Cost of Green Buildings (Langdon, 2007)

46
Langdon (2010) had conducted a study in conjunction with Abu Dhabi Urban
Planning Council (UPC) the creator of Estidama PRS, to measure the expected
impacts of the pearls on the costs of the buildings, as shown in the Fig 2.6, there seem
to be a linear increase in the initial cost with the increase in the targeted level with
minimum from 1 to 2% increase for 1 pearls to 6 to 14% when aiming for the 5
pearls.
2.8 Summary of Literature Review Findings
There is a considerable amount of research work done on Environmental Assessment
schemes especially on LEED and BREEAM, but most of it only covers the energy
performance aspects of the assessment, probably due to the high value of the energy
credits in most of schemes, another reason is the possibility of measuring the energy
performance before and after construction and the last is that its impact on the
operational cost of the building.
On the other hand research work on IEQ is mainly conducted as post occupancy
evaluations as it's mainly related to the occupant's satisfaction. Research work related
to water efficiency seems to be rare probably due to the less reduced weight of its
credits on the popular assessment schemes of LEED and BREEAM.
An observation was found is that there is a very limited research work on Estidama
PRS, probably because it’s a newly born assessment scheme and the fact that it’s on a
local scheme for the emirate of Abu Dhabi only. There is also what seems to be a
research gap found in conducting a detailed comparative analysis between credits of
different assessment schemes.
Figure 2.9 The Cost Impact of the application of Pearls Rating Schemes (Langdon, 2010)

47
2.9 Research Aims and Objectives
2.9.1 Aim of the Research
This study aim is to benchmark PRS certification levels against LEED, BREEAM.
This investigation will be based on comparing the three assessment scheme in terms
of energy, water consumption, overall assessment and the cost effectiveness.
A case study Office building located in Abu Dhabi, UAE, designed in 2007 on the
earlier local codes was chosen for the study. Office buildings are representative
sample as they are one of main components of the construction market and the
existing buildings stock of Abu Dhabi and it is predominantly characterized by being
a "glazed high rise tower" (Elgendy, 2011)
2.9.2 Objectives of the Research
To understand the concept behind the creation and development of every
chosen assessment scheme through a historical factual review for the
objectives and reasons behind the schemes development.
To benchmark the performance of the building which was designed as per the
buildings codes of Abu Dhabi prior to Estidama PRS against LEED,
BREEAM and PRS.
To examine the impact of selected upgrading approaches on the case study
building and the possible certification levels in these assessment schemes.
To Measure the certification levels of PRS towards relevant levels in other
chosen assessment schemes.
To evaluate the appropriateness of implementing these schemes on Abu
Dhabi.
2.9.3 Expected Outcome
This study is expected to provide a clear picture for the professionals involved in the
construction market of UAE of what's the pros and cons of applying three of most
used building environmental assessment schemes in Abu Dhabi; it will relate selected
certification levels of Estidama PRS towards the relevant levels in LEED/BREEAM
schemes.

48
2.9.4 Developing Hypothesis
LEED is a US based system and was developed by US professionals, same for
BREEAM, it’s a UK based system and was developed by UK Professionals, therefore
these two systems are expected to perform better in their home countries, a
customized Environmental assessment scheme which is developed in Abu Dhabi such
as the pearls system is expected to perform better than other imported systems by
producing more efficient buildings that are responsive to the local climate and with
lower cost impact.

49
Chapter 3
Methodology

50
3.1 Reviews on Methodologies Selection
Diverse and wide nature of the Environmental assessment schemes was reflected on
the methodologies that had been used on the reviewed research papers. Environmental
assessment schemes covers different aspects related to construction industry of Green
buildings such as energy, water, materials selection and IEQ, these topics have
different natures and require different approaches for studying as reviewed below.
3.1.1 Methodologies used in papers comparing the overall of the assessment
schemes
Comparing overall different assessment schemes were covered by following selected
research papers.
Elgendy (2010) compared LEED/BREEAM/PRS altogether, the aim of the study was
to find the overlaps and differences between these schemes, he had compared the
credits categories and its weightings, reviewed the assessment and certification
processes for the three assessment schemes, Elgendy used a direct overall credits
review methodology for his research paper.
Sanders (2008) had conducted a study reviewing a multiple international assessment
schemes for buildings, the aim was to review the most commonly used schemes
around the world and compare it to the UK based system BREEAM assessment
scheme, same like Elgendy, Sanders had used a direct Overall credits review
methodology for his research paper.
The UK origin sustainability consultant Inbuilt had published a white paper in (2010)
comparing LEED/BREEAM; they had followed the same methodology of the above
mentioned papers in reviewing LEED against BREEAM.
In the above reviewed papers it was clear the need for a wide review methodology to
be able to cover the all aspects of the schemes under study and the discussed topics
were general such as (Certification process, Credit Weightings and Certification
levels).
There were another set of research papers that are conducting a comparative analysis
between environmental assessment schemes but they were focusing in one or two
aspects only such as energy performance or Indoor Air Quality IAQ as it will be
explained the following sections.
51
3.1.2 Methodologies used in Energy performance comparison papers
Energy performance has a big importance in the environmental assessment schemes,
it is related to operational cost/natural resources saving and carbon emission
reductions which are the synonyms of green buildings, and as a result most of the
environmental schemes such as LEED, BREEAM and PRS give energy the highest
values in its schemes. The perception of the importance of energy was also reflected
in the amount of produced research work related to it, where the majority of research
work on assessment schemes was mainly studying the energy performance aspect of
it.
There were different methodologies used by the researches when they compare or
study assessment schemes in terms of energy performance;
Roderick et al (2009) had used computational simulation when they compared LEED,
BREEAM and Green Star in terms of energy performance, they used the energy
model to evaluate and assess their case study building towards the baselines of the
three schemes in study.
Also Tronchin and Fabri (2007) had taken the same approach in comparing
environmental assessment schemes through focusing on energy performance.
Lee and Burnett (2008) had compared LEED, BREEAM against the Hong Kong
based scheme HK-BEAM, they had also chosen energy performance as a basis of
comparison, but in this paper literature review methodology was the used in studying
and comparing the assessment schemes as the focus was only to compare the criteria
and the energy assessment process of the system.
In another paper Lee (2012) had compared five assessment schemes; LEED,
BREEAM, CASBEE, BEAM plus and the Chinese ESGB. His aim was also
benchmarking the energy use of building environmental assessment schemes. A
literature review approach was used; the study focus was in the five mentioned
assessment schemes are comparable towards each other in terms of energy
assessment.
Sabapathy et al. (2010) were only evaluating the energy performance of LEED
buildings Information Technology facilities in Bangalore, India, since the study focus
was specific the team of researchers had used a post occupancy survey to study the
actual energy performance of their case study buildings.

52
Best Methodology for Energy Performance Comparisons
Building Assessments methods requires a big input in design phase, Computational
Simulation Methodology is one of the main methodologies to study and evaluate
buildings which is still under design, it gives the chance to the researcher to simulate
the real life conditions that will be affecting the buildings in a relatively short time
especially if its compared to field measurement. Simulation programs can provide
users with "key building performance indicators such as energy use and demand,
temperature, humidity, and costs" Crawley et al (2008). In the three selected
assessment schemes, LEED assessment scheme recognizes the use of DOE-2 or
BLAST or approved equivalent as simulation tool, for BREEAM there is no specific
requirements and for PRS is following LEED standards in this area.
Lee and Burnett (2007), Roderick et al (2009) and Tronchin and Fabri (2007) research
papers were comparing different assessment methods towards one another in terms of
energy performance; the three papers used computational simulation in their research.
In the research of Lee and Burnett (2007) they had used HTB2 and BECON
simulation programs to study the effect of changing operational schedules on the
overall annual energy performance of the building, they also dedicated a part of the
research to compare between the results of the simulations programs itself and
compared it against the relevant standard ASHRAE Standard 140 Standard method of
Test (SMOT). In the paper of Roderick et al (2009), the aim was to compare three
assessment schemes which are Green Star, LEED and BREEAM; they used
computational simulation Integrated Environmental Solutions Virtual Enviroment
(IESVE) in their research to model the case study as a typical office building in
Dubai, they applied the requirements of the energy credits of every assessment
scheme on the model then compared the results altogether, while for Tronchin and
Fabri (2007) they used the environmental simulation softwares (Design Builder) and
(Best Class) for their computer simulations for evaluation study on energy
performance for building in Mediterranean countries.
3.1.3 Methodologies used in Papers reviewing the Water Savings
Research papers discussing water savings in green buildings seems to be rare,
probably due to its minor importance in LEED and BREEAM, most the papers which
had talked about water savings such as Elgendy (2010) paper and the Inbuilt report
(2010) were just direct comparison between water credits with no real measurement
53
for actual performance of green buildings, there is no dominant methodology covering
this field of study.
3.1.4 Methodologies used in Papers reviewing the Indoor Environmental Quality
(IEQ)
IEQ was put in environmental assessment schemes claiming that it will help transform
the IEQ of buildings to be healthier and safer for the occupants; this was expected to
lead to an increase in productivity and satisfaction levels. Most of the research work
on IEQ is questioning the real achievement on this claim that’s why most of the
research work on IEQ was mainly post occupancy evaluation. Field measurement and
experimental methodologies were sometimes used also to investigate this topic but the
most common was Correlational based researches and social surveys as it relates to
the occupants.
Best Methodology for Correlational based researches and social surveys
An important Part of evaluating the Indoor Environmental Quality of a building is the
occupant satisfaction; thermal, visual and acoustical comfort, these three are all
directly related to the occupants and depends on their activity and level of clothing. In
previous research works, there were some trials to have post occupancy evaluation to
make sure that buildings are performing as per design intentions. Hua et al (2010),
Lee and Guerin (2009) both have used correlational based researches such as Social
surveys in their studies to measure how much do green certified buildings satisfy the
occupants needs.
Hua et al (2010) were studying in their research only one aspect of (IEQ) which is
Daylight levels in a LEED Gold certified building, they conducted a social survey for
the building to find out the percentage of occupant satisfaction in this building, the
focus of this research was on one building only which allowed the researcher to back
up his study with other multiple methods. In the other study which was conducted by
Lee and Guerin (2009) , they aimed to compare three different and related aspects of
Indoor Environmental quality which were; Indoor Air Quality (IAQ) , thermal quality,
and lighting quality between 5 offices in different LEED certified buildings and the
effect of these aspects on the environmental satisfaction and performance of the
employees. To cover all of these aspects the researchers used secondary data
developed by (the Center for the Built Environment (CBE)) these data was online
surveys that was done by the mentioned center on the 5 selected buildings.
54
3.2 Methodologies selection and justification.
The research topic is wide and includes 6 variables, these variables are essential in
having a complete understanding of the topic and to be able to have a fruitful
evaluation of Pearls assessment scheme. A case study computer simulation method
will help in providing a good basis of comparison, using a secondary data may be
essential to be able to establish credible base for comparing the three assessment
schemes. Time, cost and appropriateness to the research topic are main three
limitations which the above mentioned methodologies had been selected and
reviewed; it appears that a case study computer simulation with multiple
methodologies can be an appropriate methodology for the research; multiple
methodologies will be Interpretive-historical, simulation, occupant satisfaction
surveys, interviews with key figures related to the field.
3.2.1 Historical-Interpretive research
This will be done for Assessment Methods in general then reviewing LEED-
BREEAM and Estidama Pearl Rating System in specific.
In order to have better understanding of the chosen assessment methods and concept
behind their credits structure, it's important to have a historical review on the
formation of these assessment schemes. An interpretive historical review will be
conducted using scientific research papers- text books on the formation and
development of assessment schemes with a special focus on the selected three
assessment schemes.
3.2.2 Case Study building as a focus of the study
To be able to compare the energy performance under the three assessment schemes, a
case study building will be chosen in Abu Dhabi, the case study will be a typical
office building in Abu Dhabi, shape and area will be generic and simple to be
modeled in a timely and easy manner. Office buildings are representative sample as
they are one of main components of the construction market and the existing
buildings stock of Abu Dhabi and it is predominantly characterized by being a "glazed
high rise tower" (Elgendy, 2011)
3.2.3 Computational Simulation
2 base line models for the case study will be generated as per the requirements of
LEED, BREEAM and PRS; this will be generated using Computer Simulation
software IESVE. This step is essential and is required by all assessment schemes in
order to calculate the improvement in the energy performance in a later stage.

55
Table 3.1 Simulation tool references in the three schemes
Establish an actual case
1 actual case will be generated and will be compared against the three baselines of
PRS, LEED and BREEAM.
Computer Simulation Software
Two energy modeling softwares will be used in this analysis; the first one is
Integrated Environmental Solutions Virtual Environment (IESVE) for the following
reasons:
The software is approved by the three assessment schemes LEED, BREEAM
and PRS as shown in table 3.1 and follows their computational simulation
standard requirements (Roderick et al., 2008).
Easy to use with user-friendly interface, has plug-in to common architectural
design softwares such as Sketchup.
The wide possible studies that can be generated from the software such as
Energy and water consumption calculations, life cycle assessment, day
lighting and artificial light assessment.
Assessment Scheme PRS LEED BREEAM
Simulation Tool ASHRAE Standard 140 Standard Method of Test
ASHRAE Standard 140 Standard Method of Test
No specific requirement on the simulation
tool
And the other software will be Ecotect 2011 which will provide the required Weather
data extracted from the US department of Energy (DOE) in a good graphical
presentation.
3.2.4 Social Survey
In order to compare the satisfaction of occupants using buildings that are certified
achieving the highest standards under LEED, BREEAM and Estidama assessment
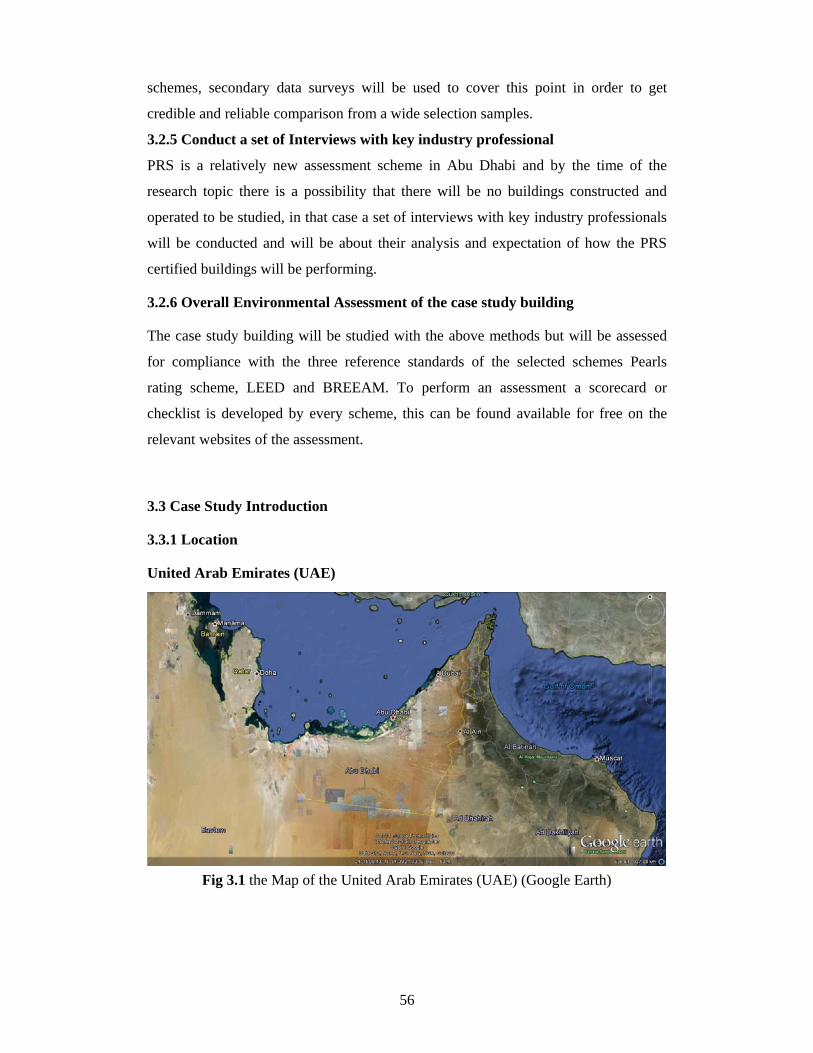
56
schemes, secondary data surveys will be used to cover this point in order to get
credible and reliable comparison from a wide selection samples.
3.2.5 Conduct a set of Interviews with key industry professional
PRS is a relatively new assessment scheme in Abu Dhabi and by the time of the
research topic there is a possibility that there will be no buildings constructed and
operated to be studied, in that case a set of interviews with key industry professionals
will be conducted and will be about their analysis and expectation of how the PRS
certified buildings will be performing.
3.2.6 Overall Environmental Assessment of the case study building
The case study building will be studied with the above methods but will be assessed
for compliance with the three reference standards of the selected schemes Pearls
rating scheme, LEED and BREEAM. To perform an assessment a scorecard or
checklist is developed by every scheme, this can be found available for free on the
relevant websites of the assessment.
3.3 Case Study Introduction
3.3.1 Location
United Arab Emirates (UAE)
Fig 3.1 the Map of the United Arab Emirates (UAE) (Google Earth)

57
Located in the southeast of the Arabian Gulf, UAE is bordered by Saudi Arabia from
the south and west, Sultanate Oman from the southeast and Qatar from the northeast.
UAE was established in 1971 following an agreement between 7 Emirates (Abu
Dhabi, Dubai, Al Sharjah, Ajman, Al Fujera and Ras Al khaimah which joined later in
1972). As of 2010 the population of UAE reached 8.26 millions with 11.5 % Emarati
national (UAE Statistics Bureau, 2010), most of the population (82%) lives in the
urban zones of the UAE (Abu Dhabi Tourism Authority). The economy of UAE is
mainly depending on Oil exports where the oil and natural gas production represented
36% of the gross domestic production (GDP) in 2005 (Abu Dhabi Tourism
Authority).
Abu Dhabi
The Emirate of Abu Dhabi Fig 3.2 is the capital of the UAE, the biggest Emirate; it
occupies around 80% of the total area. Abu Dhabi is known for its massive oil
reserves that drive its economy that made it a host for the major world wide oil
companies and its passion of tourism and Culture where it hosts touristic attractions
such as Formula one racing circuit, Ferrari world and cultural attractions such as the
world class museums (Louvre and Guggenheim).
Fig 3.2 Abu Dhabi Map (Google Earth)

58
3.3.2 Abu Dhabi Built Environment
The Emirate is famous by its shoreline Fig 3.3 which is rich with sky scrapers and the
down town area which is located close to it, also Abu Dhabi is known by its iconic
mosques such as the great mosque and a world class infrastructure that encourages a
lot of international companies and organizations to consider having their Head
Quarters and investments in the emirate.
To support their ambition for growth, Abu Dhabi and UAE had and still consuming a
huge amount of energy and water, where as per UPC (2010) in their justification for
Estidama initiative, UAE requires 5 planets same like earth to maintain its current life
style (UPC, 2010)
Abu Dhabi Water and Electricity Authority (ADWEA) had made a forecast for the
future consumption for electricity and water as per the current rate of growth, it found
that demand for electricity is expected to be tripled Fig. 3.4 and nearly doubled for
water Fig. 3.5 in the next 10 years. These facts all came as justification for the need
for a quick transformation towards a more sustainable life style.
Fig 3.3 Waterfront of Abu Dhabi

59
3.3.3 Current and future Green buildings codes and legislations in Abu Dhabi
The government of Abu Dhabi had the vision of transforming the emirate in to a
sustainable city and to reduce the current dependency on fossil fuels, to achieve this
vision they have out a future vision of the capital under the name of "Abu Dhabi
2030" which had put sustainability as an essential integrative part of every new to
development under than of "Estidama initiative", one of the tools of this initiative is
the Pearls Rating system, the government of Abu Dhabi had redrafted its building and
planning codes to incorporate the mandatory requirements of the Pearls system , and
by this any new development in the emirate must achieve at least the mandatory
pearls certification before being built.
Figure 3.5 Forecast for Water peak demand for Abu Dhabi (ADWEA, 2010)
Figure 3.4 Forecast for energy peak demand for Abu Dhabi (ADWEA, 2010)

60
3.3.4 Abu Dhabi Climate
As per ASHRAE 90.1, Abu Dhabi climate is classified as "1B" which is "very hot and
dry" and as per Köppen–Geiger climate classification system, the capital of UAE is
classified as "BWh" which is "Dry: arid(deficient precipitation most of the year),
Desert, Hot; arid (sub-tropical), True desert, xerophytic vegetation".
Psychometric chart was generated from Ecotect Fig. 3.6 to specify the exact comfort
zone of Abu Dhabi.
Fig. 3.6 shows that the Summer season most dominant and very hot with large diurnal
range; humidity is often higher than comfortable levels while winter is warm, and as
shown the average monthly maximum temperatures; and as the graph shows above, it
seems like most of the year Abu Dhabi is out of the comfort zone expect for 3 months.
Wind
As per IESVE The wind "depends on distance from sea; trade winds from the east and
local sea breezes. Daytime can be windless. Wind patterns: Typically strong
midday/afternoon winds", wind speed average is 3.6 m/s which is "light breeze" as
per IESVE classification.
Figure 3.6 Psychometric Charts for Abu Dhabi (Generated from Ecotect 2011)

61
Figure 3.7 Prevailing Wind-All Year for Abu Dhabi (Generated from Ecotect 2011)
Figure 3.8 Prevailing Wind- Temperature-All Year for Abu Dhabi (Generated from Ecotect 2011)
Wind Rose was generated by Ecotect Fig to specify the prevailing wind directions
Fig. 3.7 and wind temperature Fig. 3.8.
Fig. 3.8 shows that the temperature of the wind is relatively high most of the year
which may require insulation and reduction of infiltrations inside buildings.

62
Figure 3.9 Climate Summary Metrics (Generated from IESVE 2011)
Temperature
Fig. 3.9 shows the climate summary metris generated from IESVE, it shows that
highest annual temperatures are 47c at July and the lowest is 5c at February. As per
the Fig. 3.10 its clear the daytime will be in hot stress in most of the year.
.
3.3.5 Case study Building Description
The selected office building for the case study aimed to be representative to the
current construction market of office buildings in Abu Dhabi. The selected office
building consists of 4 typical office floors, mezzanine floor, and ground floor.
The architecture of the building can be described as "modern"; it is a simple
rectangular shape with no balconies and with typical floor area equals 446 sqm and
total area equals around 3370 sqm
Most of the building is covered with glass which is a common feature in most of the
office buildings in Abu Dhabi with some metal panels, and the side elevations are
fully solid of metal panels

63
Chapter 4
Case Study
Configuration and Assessment Tools
64
4.1 Overall Environmental Assessment of the case study building
The current design of the building will be assessed against the three selected schemes
Pearls rating scheme, LEED and BREEAM. This initial assessment will determine
whether the case study building which was designed and built before the issuing of
Estidama is good enough to be certified under the environmental assessment schemes
which are currently available and used in the UAE Market.
4.1.1 Pearls rating system
Estidama had developed an excel sheet “scorecard”, where the project team can put
the targeted points at every credit. The scorecard is divided into basic information part
and technical detailed part, and a summary part that concludes the assessment results
from points and the achieved certification level.
To be able to fully fill the assessment, several steps is required such as (Energy
Modeling) and the use of some PRS customized calculators for (Water, Waste), and
the involvement of some specialists as a third party review such as (Commissioning
Agent, Urban Assessor, Cost Analyst).
The first step in the assessment is to set targets on the scorecards by choosing specific
credits, a sample of the scorecard is in (Appendix 1, Table 1). After choosing the
required credits, the assessor can review the summary part of scorecard. This
summary part includes several graphs and bar charts graphically explaining the
building assessment.
4.1.2 LEED
LEED has nearly same style of assessment of Pearl Rating System, a downloadable
excel sheet under the name of “Checklist” is available in the USGBC website as a tool
for assessment. The Scorecard consists of two sheets, the first one is a one page
summary of LEED credits and targets, the second sheet is the detailed credits, sample
for LEED Score card is in (appendix 1, Table 2).
4.1.3 BREEAM
Similar to LEED and Pearls, BREEAM has its own customized pre assessment tool
(Appendix 1, Table 3) with more interactive design to facilitate the pre assessment
process. The tool is in an excel format and starts with five introductory questions such
as scheme selection, building information. After completing the introduction section,
65
Figure 4.1 Project floor Plan before simplification
Figure 4.2 Project floor Plan after simplification
OFFICE SPACE 1
OFFICE SPACE 2
OFFICE SPACE 3
OFFICE SPACE 4
CORE 1
the excel file opens two spread sheets, one for the assessment details where the
assessor puts information such as project name, team, client, and the other spreadsheet
shows the detailed credits of BREEAM.
4.2 Energy Model Setup and Validation
4.2.1 Model Description
The case study building is a Ground+Mezzanine+4 floors mixed use (Office and
residential building, the dimension of the building footprint is 24m x 18 m and the
total height is 30m, the building has two solid sides and two side half glazed, half
solid. The floor areas are varying from 373sqm in the ground floor to 443 in the 4th
floor. The model has been simplified to increase the speed of simulation runs; the
simplification was done by removing the internal walls (Figure 4.1 and 4.2).
66
Figure 4.3 IES-Sketchup Plugin
Model in Sketch up
Model in IESVE
3 Models had to be prepared in order to perform the energy analysis, the Actual, the
baseline of LEED and Pearls rating system and the baseline of BREEAM.
Step1. Sketch Up Modeling
The Model has been built in Google sketch 6, this program is an architectural program
with compatibility with the environmental analysis software IESVE, and it has added
some features under the name of IES in its main tool bar, features such as building
template where the user can choose the location, building construction, type of HVAC
system used and the use of the building, then there is the export to IES where is
convert the model to thermal volumes ready for energy simulation/calculations in IES
(Figure 4.3).
Step2. IESVE Modeling
IESVE is Environmental Modeling and analysis software, and it is used for the
energy analysis because it is complying with the requirement of LEED, BREEAM
and Estidama Energy Modeling software requirements (Roderick, 2008) ; the
67
Table 4.1 – Case study Construction and finishes
software can perform multiple Environmental studies such as Shadow studies, Energy
load calculations, and thermal analysis, cost and CO2 calculations through simple
steps.
Finishes
Actual
The finishes of the case study were extracted from the building consultant and it is as
shown in Table 4.1.
LEED/PRS/BREEAM Baseline
As shown in Table 4.1, the baseline of the LEED and PRS schemes is based on
ASHRAE 90.1-2007 which sets the following U-values as a maximum, and
BREEAM follows NCM standard.
Actual ASHRAE 90.1-2007 NCM
LEED/PRS BREEAM
No. Construction U-value (W/m2K) U-value (W/m2K) U-value (W/m2K)
1 External wall 0.35 0.4996 0.35
2 Ground floor 0.016 1.1 0.25
3 External glazing 1.9 6.9326 2.2
4 Roof 0.25 0.36 0.25
5 Door 2.32 2.32 2.32
6 Internal wall 1.47 1.47 1.47
7 Ceiling 2.14 2.14 2.14
HVAC System
Actual
There is no heating system in the building, the cooling system is “Ducted Split Unit”,
a refrigerant based system, this system is named also unit to unit system, because
every indoor unit has a separate outdoor unit, fresh air supply comes as a different
supply. This system is conventional in this type of buildings in Abu Dhabi because its
unitary system, it allows the owner to divert all it expenses directly to the tenants.

68
Figure 4.4 Actual System Schematic from ApacheHVAC
Fresh Air Intake
Out Door Unit
Indoor Cooling
unit
Room
Multiplex
Temp. Control
Outtake
Air Flow Control
Temp. Control
HVAC Schematic from IES
In order to properly evaluate the energy performance of a building, it is essential to
model in details the HVAC system. As shown in Fig. 4.4 the actual HVAC system for
the case study was modeled in details for performing the energy calculations showing
two cooling coils per thermal zone. The dotted line around the schematic is named
“multiplex” which allows multiplying the system on all the spaces of the model.
.LEED/PRS
The baseline of the LEED and PRS is based on ASHRAE 90.1-2007 which sets the
following HVAC systems, as per the mentioned standard the HVAC baseline system
must be VAV+PFP , IES has a preset templates for the baselines of ASHRAE which
was used in this study. (Figure 4.5)
69
Figure 4.5 HVAC LEED Baseline Schematic from IES
BREEAM
The baseline model of BREEAM is named “Reference Building” and based on
National Calculation Methodology (NCM), Heating fuel type must be gas. Heating
SCoP must be 0.73 and auxiliary energy must be taken as 0.61W/m2. Cooling set
point is fixed at 27 oC and the cooling SSEER must be taken as 2.25. As per National
Calculation methods (NCM), the design of BREEAM reference building shall be the
same as the actual but with different inputs for finishes as shown in Table 4.1 and
source of energy shall be gas.
Due to the complexity of the HVAC systems design and level of accuracy of
modeling which is required by the LEED, BREEAM and PRS to calculate energy
performance and the requirement of the input of an expert HVAC design engineer,
only actual case and its baselines was be modeled.
Lighting
Default lighting of the software will be used which is fluorescent 60x60 lighting tiles;
the lighting levels will be estimated at 500 lux

70
Figure 4.6 Actual Orientation
Weather Data
The Environmental Analysis software IES has a built in weather and climate analysis
tool under the name “AP Locate”, its data is based on standard tables published by
CIBSE and ASHRAE. The chosen case study is in Abu Dhabi, IES has four files for
Abu Dhabi the closest one to the case study site is “Abu Dhabi, Al Bateen Airport,
UAE. ASHRAE Fundamental Design Weather Data”.
“The weather file has values of the following variables measured at hourly intervals
over a year: Dry-bulb temperature, Wet-bulb temperature, Direct beam solar
radiation, Diffuse solar radiation, Wind speed, Wind direction, Cloud cover “
Orientation and time
The building actual orientation is facing North West as show in Fig. 4.6; it will be
simulated once on its actual orientation and another 4 simulations facing each (north,
east, south, and west) to take the average that represents the Baseline case for LEED
and Pearls Rating, this is required to be able to calculate the percentage of energy
saving.

71
Figure 4.7 Daily operational profile (8am to 6pm with lunch break)
Operational times
Building Office operation time will be following common operation times in Abu
Dhabi (8am to 6 pm) as shown in Fig. 4.7 with Friday and Saturday off. However
some systems are designed to remain on 24 hours such AC system and that even if no
one is in the space.
4.2.2 Simulation configuration
3 Models have been made to perform the energy calculations required from the
dissertations:
1- Actual Model: this will be modeled as per the actual design, some
simplification will be done on the internal partitioning of the building to
increase the simulations speed.
2- Pearls rating / LEED Baselines: the two baselines of LEED and Pearls are the
same and following ASHRAE 20.1-2007 Appendix G, the building will be
simulation in 4 different orientations (North, East, South and West), average
will be taken and compared with the actual model to calculate the energy
performance. Materials and construction must follow the specified U-Values
in ASHRAE.
3- BREEAM Baseline: a reference building will be modeling for the calculations
of this scheme, Materials and construction must follow the specified U-Values
in National Calculation Methodology (NCM), orientation shall be the same as
the Actual design.

72
Figure 4.8 Sketchup Model of the Case Study
4- Validation Model: a full detailed floor will be model in two softwares as a
validation for the calculations.
4.2.3 Modeling Process
The result of the modeling is below and as shown in Fig. 4.8 and Fig. 4.9
Energy/Carbon Simulation:
Building floor area 2160.00 m2
Conditioned floor area 2160.00 m2
Unconditioned floor area 0.00 m2
Number of rooms 30
Analysis Details:
Location: Abu Dhabi Bateen Airport :1 :N.A. :N.A., United Arab
Emirates (24.43N,54.47E)
Climate file: AbuDhabiIWEC.fwt
Calculated: 07/Jan/2012,23:08
Calculation Period: 01/Jan - 31/Dec

73
Figure 4.9 IES Model of the Case Study
Figure 4.10 The validation sample space
4.2.4 Model Validation
Two approaches had been taken to validate the energy model. The first one is
reviewing the modeling it self, this was done by forwarding to the (IES), the creator
of the software model to review the building overall modeling including its systems
and inputs and auditing the results.
The Second approach was to check the results with the commonly used software in
energy consumption analysis in Abu Dhabi which is "Carrier HAP", this was done by
forwarding the same input data of the model to an MEP Engineer in a consultant
office in Abu Dhabi “Hanover” to perform a energy load calculations for a sample
space in the building which was one of the shops shown in Fig. 4.10.
Validation Sample

74
MEP Engineer results generated from HAP shows that this space consumes around
33.4 MWh annually (Appendix 3, Table 4.1), the study model results shows that this
space consumes 33.8 MWh ( Appendix 3, Table 4.2).
4.3 Water Demand
To be able to estimate the water consumption a formula shall be used to calculate the
number of full time users for the building, in LEED and PRS its known as Full Time
Equivalent (FTE), only BREEAM has a default occupancy rates related to the
occupied areas.
4.3.1 Actual Input Data
Actual Input Data
Actual Water Fixtures performance.
1. Water Closets 6 liters per minute (single flush)
2. Water Taps 6 litres/min at 413.7 kPa (reference pressure)
There is no exterior use for water or irrigation.
Full Time Equivalent (FTE) = 280
4.3.2 Pearls Rating System Water Calculator and Baseline Input data
The pearls system has customized Calculators (Appendix 2, Table 1) downloadable
free from the website of Estidama. The water consumption depends on comparing the
actual or the design case to a baseline case. The inputs are Full-Time Equivalent
(FTE) and transit occupant and appropriate water fixture flow and use. The
calculator is organized in 7 steps; the user has to fill it by providing information such
as project details, occupancy type, schedules, interior water consumption, exterior
water consumption and water balance. After filling the steps the results can be shown
in three summary tabs.
Baseline Input Data:
PRS Baseline For Water Fixtures
1. Water Closets 6/4 liters per flush (Full/Half)
2. Water Taps 1.9 litres/min at 413.7 kPa (reference pressure)
There is no exterior use for water or irrigation.

75
Table 4.2 Strategies that contributes to potable water saving calculation per scheme
Full Time Equivalent = 280
4.3.3 LEED Water Calculator and Baseline Input data
The water credits in LEED have the same concept as the Pearls system in calculation
the water consumption; a water consumption calculator is available for download
after registering a project in LEED online. (Appendix 2, Table 2)
Baseline Input Data:
LEED Baseline For Water Fixtures
1. Water Closets 6 liters per Flush (Full)
2. Water Taps 1.9 litres/min at 413.7 kPa (reference pressure)
There is no exterior use for water or irrigation.
Full Time Equivalent = 280
4.3.4 BREEAM Water Calculator and Baseline Input data
The water calculation for BREEAM will be done with Wat 01 credit template
(Appendix 2, Table 3). In BREEAM water calculators uses “default usage and
occupancy rates to provide a benchmark of the typical consumption given the
specified fittings (in litres/person/day and m3/person/year) and their impact on the
buildings overall water efficiency” (BREEAM, 2011), it compares the
(litres/person/day) in design case to the record baseline values.
4.3.5 Benchmarking the potable water saving assessment process between PRS,
LEED and BREEAM
The water calculators of the three schemes shows that the strategies that are
contributing to the potable water savings are different as shown in Table 4.2.
Potable Water Use Reduction PRS LEED BREEAM
Using low flow fixtures x x x
Using Rainwater x x
Using Onsite treated Grey water x x
Using Municipal treated Grey water x

76
The potable water consumption assessment shows that PRS is most flexible and
accept more strategies that contributes to potable water saving then comes BREEAM
that awards for the same strategies expect for Municipal supply of grey water, while
in LEED any use for recycled water is awarded in different credit “Innovative Waste
Water Technologies “and not related to water use reduction calculations awards.

77
Chapter 5
Case Study Assessment
Results and Disscusion
78
5.1 The Assessment
To conduct the overall assessment of the case study building, several steps have to be
done prior to it such as energy modeling, water calculation, construction and
operational waste generation. For the scope of this study only the energy and water
calculations part will be conducted before the step of the overall assessment.
5.2 Energy Simulation
A common between PRS/LEED and BREEAM, is the importance that these schemes
give to energy efficiency; in fact one of the highest emphasis in these schemes is for
energy. In order to be able to measure and compare the energy performance of the
case study building, an energy simulation has been conducted using IES energy
modeling software as explained in the methodology.
5.2.1 Actual Design Model
Actual Design Model
The actual design model has been simulated and was found that the annual energy consumption of the building as 951 MWh. Full results is shown in (Appendix 3, Table 1.1).
5.2.2 Pearls Rating System (PRS)
As a partial requirement for a getting certified under PRS, "RE-R1, Minimum Energy
performance" required credit has to be assessed. As per PRS there are two paths for
analyzing the performance, one is the "prescriptive method" for buildings less than
5000 sqm of total area, and the "performance method" where and energy model has to
be done, one as per the design and one as baseline to measure the energy
performance. The case study building qualifies to be studied under the two methods;
however the performance method will be used of the study; the reason is that
performance method is an available method in the PRS, LEED and BREEAM which
allows that comparison between the three schemes.
The comparison between the different methods of energy performance credits in PRS
is a topic that requires further study in more details in future studies.
Baseline Model
The year energy consumption of the building was simulated four times with different
orientations and the results show that the average annual energy consumption for the
baseline case equals 669 MWh for Estidama, detailed report is attached in (appendix
3, Table 2)

79
When the Baseline case is compared to the Actual design case it appears that the case
study building performance is having the same performance of the Baseline and the
improvements required by PRS required credits is 12 %, in the annual energy
consumption, therefore the actual case is not fulfilling the minimum requirements.
As explained the majority of the energy in the case study was consumed in the HVAC
system which is a "Ducted Split Unit" which has a constant supply of air no matter the
occupancy or activity level, while in the Baseline case as per ASHRAE a VAV
system with and economizer is used which resulted to significant reduction in the
energy consumption.
5.2.3 LEED
As a prerequisite, any building applying for LEED must fulfill the mandatory
requirements of " EA Prerequisite 2: Minimum Energy Performance ". This credits as
options for calculating the energy performance, the case study building qualifies for
option 1 " Whole Building Energy Simulation " and option 2 " Prescriptive
Compliance Path: ASHRAE Advanced Energy Design Guide ", option 1 will be used
for the energy performance analysis. Baseline model of LEED is prepared as per
ASHRAE 90.1-2007 same as PRS, the Energy tariff in Abu Dhabi as per ADDC is
(0.15 dhs per KW/h). The total annual energy cost for the Actual case is AED 142,650
while the baseline case equals AED 100,222 this means that the building systems used
in the actual case study are not performing as or better than ASHRAE standards
which is mandatory for LEED compliance. (Appendix 3, Table 2)
5.2.4 BREEAM
The building energy performance in BREEAM is calculated as per its Carbon
emissions to fulfill the credit "Ene 01 Reduction of CO2 emissions", this credit is only
mandatory for buildings targeting starting from "Very Good". Baseline model for this
credit is calculated as per NCM. The results show that the average annual energy
consumption for the baseline case equals 71.9 tones of total carbon emissions
(Appendix 3, Table 3), the carbon emissions of the actual case 207 tones (Appendix 3,
Table 1.2) which is far more than the baseline case and not achieving any points under
BREEAM
Findings
It was found from the case study analysis towards the three baselines of PRS, LEED
and BREEAM that it’s not achieving the minimum requirements of these schemes and

80
with HVAC the major component of the energy consumption, a major design upgrade
is essential for improving the overall performance of the building.
The building system's operational schedules must be adjusted as per the requirements
of the occupants while in the actual case it's on 24 hours, more energy efficient
HVAC systems shall be installed instead of the current unitary system.
Lighting can be an area of energy saving but in the higher levels of certifications, this
can be done through by techniques such as adding occupancy sensors and providing
task lighting for desks.
5.3 WATER CALCULATIONS
One of the most critical issues in the Middle East is water, PRS has responded to this
fact and made water credits equal to energy credits the highest percentage "25%", and
although water consumption reduction is mentioned in LEED and BREEAM but it in
a reduced importance.
As an office building and since the HVAC system is air cooled, the main water
consumption of the building comes from Bathroom taps and toilets.
5.3.1 Pearls Rating System (PRS)
To check the compliance of the case study with the Precious water required water
credits of improved water consumption, the Water Calculator template of PRS has
been used, the case study building failed to pass the mandatory requirements, where
the building is using 2,111,760 litre per year while the baseline is only 1,234,884 litre
per year. (Appendix 2, Table 4)
The actual used water fixtures is high consuming, where the toilets have a single flush
only and used taps is exceeding the baseline flow rate of taps, where the actual taps
flow rate was (6) l/min while the baseline was (1.9) l/min.
Although the building did not achieve the mandatory credits it managed to score over
all of (18) points in water saving due to other strategies such as the absence of exterior
landscaping, water fountains and the use of air based chillers which are all awarded in
PRS.
5.3.2 LEED
Although LEED gives less attention to water issues than PRS as it dedicates only
5.5% of its credit points to water, but still it has it as a prerequisites where any project
can't get certified with proving to save more than 20% of the baseline case.
The WE-P1 calculator was used for the calculations of the baseline and actual case of
the case study building, from the results (Appendix 2, Table 5) the building failed to

81
achieve the minimum requirement of LEED which is saving 20%, the baseline was
265.44 (KGal) and the actual consumption is 376.32 (KGal)
The baseline flow rates of LEED are the same as PRS, therefore the same remark was
observed which is that the actual used flow rates for Taps and Toilets is higher than
the baseline.
5.3.3 BREEAM
BREEAM is least in the three schemes in addressing the water consumption issue
where 2.5% only of the credits are related to water, probably because it was designed
for UK where there is no problem in the availability of water but more in the energy
consumption. The current design of the building failed to achieve any points under
BREEAM as it must achieve a minimum of 12.5% and it only managed to achieve
12.05% (Appendix 2, Table 6), however water saving isn't a mandatory requirement
to achieve the minimum ratings of BRREAM but required for upper levels of
certifications.
Findings
The analysis of the case study building towards the three baselines of PRS, LEED and
BREEAM showed that it's not achieving the minimum requirements of the first two
systems in the Water consumption, for BREEAM the building can get the lowest
certificate without having water saving measurements. The main reason for the bad
performance of the case study was the used water fixtures where it’s highly exceeding
the baseline.
It was also noticed that although the baseline flow rates of PRS and LEED, FTE and
days of operation are the same, still the baseline performance of LEED is 1,003,167
Liter which is less than that of PRS which is 1,234,884 litre, the reason for this is that
in PRS water calculator it has a default value for visitors added automatically which
increases the overall consumption of water.
The approaches that can be used to reduce the water consumption is variable, it can be
done by specifying new fixtures that has lower flow rate or by adding regulators to
the existing fixtures, another technique is by using recycled water to be used in the
toilet flush instead of using potable water.
5.4 OVERALL ASSESSMENT RESULTS
Initial assessments had been conducted to the case study building using the relevant
scorecards for Pearls Rating System, LEED and BREEAM, it has been conducted

82
Table 5.1 PRS assessment: non achievable required credits
after the energy and water consumption calculations which is required for compliance
with some energy and water credits, below is the results:
5.4.1 Pearls Rating System
As shown in Table 5.1 and 5.2, the case study building with its current design and
specification failed to achieve the lowest level of the scheme which is (1 Pearl).
The building failed to achieve half of the required credits 10 out of 20, the failed
required credits are mentioned in Table 5.1:
Environmental Aspect Credits
IDP: Integrated Development Process
IDP‐R1: Integrated Development Strategy Not Achieved
IDP‐R2: Tenant Fit‐Out Design & Construction Guide Not Achieved
IDP‐R3: Basic Commissioning Not Achieved
PW: Precious Water
PW‐R1: Minimum Water Use Reduction Not Achieved
RE: Resourceful Energy
RE‐R1: Minimum Energy Performance Not Achieved
RE‐R2: Energy Monitoring & Reporting Not Achieved
RE‐R3: Ozone Impacts of Refrigerants & Fire Suppression Systems
Not Achieved
SM: Stewarding Materials
SM‐R1: Hazardous Materials Elimination Not Achieved
SM‐R2: Basic Construction Waste Management Not Achieved
SM‐R3: Basic Operational Waste Management Not Achieved
Nearly all of the not achieved credits are directly related to the used MEP systems,
while the rest is partially related. Some credits were not achieved due to absence of
specialist such as the credit of “Basic Commissioning” was not possible to achieve as
it’s a third party review to be done by a professional "commissioning agent" which
wasn't available or required at the time of the design of the building.
Waste Management concepts were known at the time of the building design but were
not mandatory or popular to the market as it was considered as a cost added.

83
Still the case study building managed to achieve some required credits such as:
Environmental Aspect Credits
NS: Natural Systems
NS‐R1: Natural Systems Assessment Achieved
NS‐R2: Natural Systems Protection Achieved
NS‐R3: Natural Systems Design & Management Strategy
Achieved
LB: Livable Buildings
LBo: Livable Outdoors
LBo‐R1: Plan 2030 Achieved
LBo‐R2: Urban Systems Assessment Achieved
LBo‐R3: Outdoor Thermal Comfort Strategy Achieved
LBi: Livable Indoors
LBi‐R1: Healthy Ventilation Delivery Achieved
LBi‐R2: Smoking Control Achieved
LBi‐R3: Legionella Prevention Achieved
PW: Precious Water
PW‐R2: Exterior Water Monitoring Achieved
As shown in Table 5.2, almost all of the fulfilled required credits were not due to
design compliance but was due to non applicability or accidentally complying. The
first three credits of the natural assessment are only activated when the building is
built on a Greenland or an ecologically important site. The fourth and fifth mentioned
credits are related to the site potentials such as being close to services and public
transportation. Another set of credits were achieved due to the absence of its point of
concern such as (not using water fountains, the absence of exterior landscaping and
swimming pools).
The only achieved points through actual intentional design initiatives were the
required credits of “Healthy Ventilation Delivery” and “Smoking Control”, where the
local codes already requires compliance with it.
Assessment shown in Table 5.3 shows that the case study building failed to score a
single point under the 5 categories of PRS:
Table 5.2 PRS assessment: achieved required credits

84
Environmental Aspect Possible Achieved
IDP: Integrated Development Process 13 0
NS: Natural Systems 12 0
RE: Resourceful Energy 44 0
SM: Stewarding Materials 29 0
IP: Innovating Practice 6 0
Total 104 0
However the case study building had succeeded to score total of 24 points of available
177 points, 6 points in the section of LB - Livable buildings and 18 points only under
the section of PW – Precious Water.
Although the building envelope construction and U-vales are better than what's
required by ASHRAE, still the systems of the building cannot be considered as energy
efficient and affected the overall energy performance of the building, for instance the
HVAC system is ducted split system, this system saved water as it uses air for cooling
but still its wasting energy as its most of the time on with the a constant rate of
refrigerant supply.
For the Indoor Air Quality that the building will more likely have a partially good
Indoor Air quality due to achieve the credits of minimum ventilation and daylight
levels but from the materials side, it may be a risk as low VOC materials were not
specified.
Therefore to get this building successfully certified at least with the lowest level of
PRS which is (1 Pearl) around 20 required credits, major design changes are needed
to be done to the building and with Water and Energy credits representing a 50% of
the PRS system, strategies such as upgrading the HVAC and plumbing systems seems
essential to get certified. But for the first Pearl level, its not only about deign and site
assessment, it also requires the involvement of specialists which Commissioning
agent, Urban Assessor and an Ecologist, the first one is to review the building systems
as per the owner project requirements, the second and the third to analyze the impact
and integration of the project with the surrounding urban and environment.
In order to target more points and to get certified as 2 Pearls or more (more than 60
points) more work has to be done especially to get the first 60 points, this level seems
to be the hardest as it includes the introduction of new initiatives to the building
design while to get more than 2 Pearls seems to be easier, because the differences
Table 5.3 PRS assessment: Categories with no points achieved
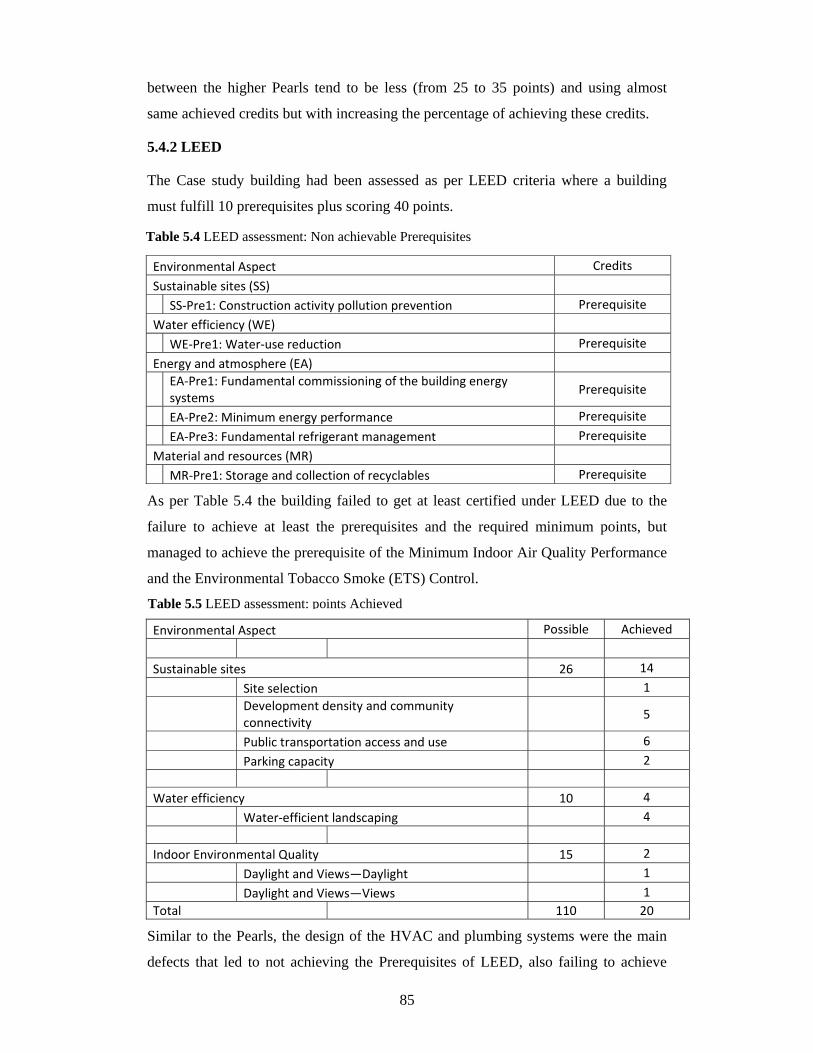
85
between the higher Pearls tend to be less (from 25 to 35 points) and using almost
same achieved credits but with increasing the percentage of achieving these credits.
5.4.2 LEED
The Case study building had been assessed as per LEED criteria where a building
must fulfill 10 prerequisites plus scoring 40 points.
Environmental Aspect Credits
Sustainable sites (SS)
SS‐Pre1: Construction activity pollution prevention Prerequisite
Water efficiency (WE)
WE‐Pre1: Water‐use reduction Prerequisite
Energy and atmosphere (EA)
EA‐Pre1: Fundamental commissioning of the building energy systems
Prerequisite
EA‐Pre2: Minimum energy performance Prerequisite
EA‐Pre3: Fundamental refrigerant management Prerequisite
Material and resources (MR)
MR‐Pre1: Storage and collection of recyclables Prerequisite
As per Table 5.4 the building failed to get at least certified under LEED due to the
failure to achieve at least the prerequisites and the required minimum points, but
managed to achieve the prerequisite of the Minimum Indoor Air Quality Performance
and the Environmental Tobacco Smoke (ETS) Control.
Environmental Aspect Possible Achieved
Sustainable sites 26 14
Site selection 1
Development density and community connectivity
5
Public transportation access and use 6
Parking capacity 2
Water efficiency 10 4
Water‐efficient landscaping 4
Indoor Environmental Quality 15 2
Daylight and Views—Daylight 1
Daylight and Views—Views 1
Total 110 20
Similar to the Pearls, the design of the HVAC and plumbing systems were the main
defects that led to not achieving the Prerequisites of LEED, also failing to achieve
Table 5.4 LEED assessment: Non achievable Prerequisites
Table 5.5 LEED assessment: points Achieved

86
minimum 40 points was another defect which was partially achieved as only 20 points
as mentioned in Table 5.5, it was noted also that although water consumption failed in
prerequisite, still it was possible to achieve 4 points under water category due to
absence of Landscaping.
The case study building failed to score any points under:
1. Energy and Atmosphere
2. Materials and Resources
3. Innovation and Design Process
4. Regional Priority Credits
With LEED having the highest emphasis on Energy (35 points) the core
improvements in the Case study building shall be related to the HVAC systems
accompanied with a wide selection of other credits related to Water, Materials and
IEQ, very limited can be done to sustainable sites credit as most of it is not related to
the design such as site selection, connectivity or public transportation.
5.4.3 BREEAM
The Case study we assessed as per the BREEAM 2011 assessment tool and failed to
achieve the lowest certification level which is PASS (30 % including the mandatory
credits).
Environmental Aspect Credits
Health and Wellbeing
At least 80% of net lettable office floor area has adequate daylight 1.15%
Evidence provided demonstrates that all desks are within a 7m radius of windows 1.15%
Evidence provided demonstrates that an occupant‐controlled glare control system 1.15%
Transport
Good access is available to and from public transport networks for commuting 2.40%
Good access to Local amenities 0.80%
Land use
Evidence is provided to demonstrate that the construction zone is defined 1.00%
as land of low ecological value
Total 7.65%
As shown in Table 5.6. The case study managed only to score 7.65 % of the total
credits where is required to achieve at least equal or more than 30% including the
Table 5.6 BREEAM assessment: achieved points

87
mandatory credits, in spite of the achieved percentage still the building failed to
achieve any of the mandatory credits required for the PASS grade.
Similar to LEED/PRS In order to get the building certified with BREEAM it’s
essential to do multiple revisions to the HVAC system as the energy consumption is
representing 33 % of BREEAM credits. Water credits have a minor importance
around 2.5% and not Mandatory in the lower certification level. IEQ and Materials
selection would be the second effective design changes after the HVAC Upgrade.
5.5 The Actual Design Case Assessment Conclusion
In the light of the results of the assessment of the case study building, it appears that
the legislations or building codes in Abu Dhabi weren't enough to guide the building
owners with their team of consultants and contractors to produce what we can call a
green energy efficient building which is healthy for its occupants. The building was
assessed based on three different schemes from three different origins, one of them
which is PRS is a local scheme developed especially for Abu Dhabi.
Minimum Certification Level
The building assessment results showed it cannot be certified under LEED, BREEAM
or PRS badly as it’s not meeting even the minimum requirements in these schemes,
overall level wasn’t efficient.
The building didn't the minimum performance requirements of the mandatory credits,
didn’t use recycled, regional, or reused materials; it didn't specify low VOC materials
and did not involve a commissioning agent in the design process which led to the
absence of design systems that can be monitored or commissioned and re
commissioned post occupancy.
Water Consumption
Although the baselines of different schemes are different, the case study building
water consumption rates was exceeding the three baselines; however it was found that
scoring in PRS in this category is easier than LEED and BREEAM.
Energy Consumption
Energy related strategies are the core of environmental assessment schemes and gives
the highest percentage of points; the current energy related strategies were not enough
to qualify the building to score more points in the assessment schemes.

88
Overall achieved points
Assessment Scheme Water points only Energy points only Overall points
PRS 18 0 26
LEED 4 0 18
BREEAM 0 0 7.65%
As shown in Table 5.7 the hardest scheme to score in was BREEAM then LEED then
PRS, it also showed that the Case Study building required an intensive upgrading
process in terms of:
1. Energy Consumption
2. Water Consumption
And other important aspects such as:
3. Indoor Environmental Quality
4. Materials Management
5. Reducing or elimination sources of pollution
The above mentioned topics can only be covered and implemented through a
collaborative effort of the project team including (Owner, Project Manager, and
Commissioning agent, Sustainability Professional, Team of Consultants and the
Contractor) through and integrative development process (IDP). This process is
highly important as it allows the interaction and exchange of information, ideas and
experience between the team which maximizes the input. IDP is highly appreciated by
the three schemes and even was included as a mandatory requirement in PRS.
After completing the Assessment scheme of the case study, it was clear that although
the three schemes has different credits structure and different points scale but still
there are big over laps between the schemes. Also LEED and BREEAM proved to be
harder for certification due to mandating scoring a minimum credit plus the
prerequisites or mandatory credits.
In the next chapter an upgrade will be done to the building to get it certified through
PRS, the certification will be measure against LEED and BREEAM scale to
understand how a green PRS building would be designed under schemes.
Table 5.7 Overall Points Comparisons

89
Chapter 6
Suggested Improvements in the Case Study
Assessment Results and Discussion

90
This Chapter aims to explore the different areas of possible upgrades required to
improve the conventional case study building in order to achieve the different
certification levels of PRS, the will be done by recommending different setups for the
building, then the next step will be measuring levels of these different setups on
LEED and BREEAM.
6.1 Case Study Upgrading Phase 1 : Getting the Case Study Building Certified
through PRS
The building upgrading will be phased based upon the requirements of every level in
PRS, in order to achieve the first PRS rating (1 Pearl) the building must achieve 20
required credits with majority of credits must be done in design phase, the following
will be implemented on the building:
1. Integrated Development Strategy
Starting from the design process, the Sustainability Engineer who must be approved
by Estidama UPC “the reviewing authority of PRS” will be appointed to lead a the
project team in setting and achieving sustainability targets, this professional is known
as Pearl Qualified Professional (PQP), he will be responsible for documenting the
integrative design process through documents and meetings.
2. Tenant Fit-Out Design & Construction Guide
This guide will include the necessary data that will be required by the future tenants
about the building, it will explain the building sustainability measures and how
systems are working, also information about any operational requirements such as
waste management.
3. Basic Commissioning.
A Commissioning agent will be appointed to join the team starting from the design till
operation; this specialist will initially make sure that the building has provisions that
allow the building systems to be commissioned. He will be will reporting to the owner
and will make the building systems are operating as per the design intent. He will
prepare a commissioning plan for the project document which will include Owner
project requirement (OPR) and Basis of Design (BOD).
4. Minimum Interior Water Use Reduction
Low flow water fixture will be used such as:
a. Self closable Bathroom taps of 1.9 L/m water flow, this type of taps saves a lot of
water and convenient for office use.

91
b. Half and full flush water closet of 4/6 l per flush will be used instead of the full
flush.
5. Minimum Energy Performance
Energy was one of the main concerns that was concluded in the assessment of the
original case study; the main major load was cooling load, ASHRAE guide for
building in hot and humid climates had listed a 10 strategies to reduce the cooling
loads inside buildings, some of it are already implemented but the following will be
followed to improve the energy performance through reducing the major load which
is the cooling load, the following shall be conducted:
a. Design and construct the exterior enclosure so that it is air tight.
b. Reducing the heat gain by reducing the U-Values of the Glass by using triple glass
c. Seal up all duct connections and make all supply and return plenums air tight
using mastic.
d. Changing the HVAC system to a more energy efficient system
e. Using heat recovery methods in the HVAC system.
f. Avoiding overcooling.
g. Invest in constant commission of the building to make it is performing as per the
design intent.
The actual HVAC system cannot achieve the above requirements; therefore it will be
changed from ducted split units into All Air system with package units. These units
are not expensive and will be placed on a secondary roof of the building. Ducts will
supply different spaces with cool air, this air will be controlled through valves to
reduce and increase the flow as per need.
6. Energy Monitoring & Reporting
Including provisions of metering facilities that allow the building energy consumption
to recorded and monitored, as per PRS 90% of the estimated energy consumption
shall be monitored through clearly labeled and accessible sub meters.
7. Ozone Impacts of Refrigerants & Fire Suppression Systems
Using refrigerants and fire suppression systems that has Ozone depletion factor
(ODP) of zero.
8. Hazardous Materials Elimination
Prohibit the use of Asbestos Contain Materials (ACM) and Chromated Copper
Arsenate (CCA) treated timber in the project. This can be done through the project
specifications and a later confirmation from the suppliers of these materials.

92
9. Basic Construction Waste Management
Prepare along with the contractor a waste management plan that can divert 30%
weight of volume of the generated construction waste. This can be done by contractor
through adopting good practice techniques such as reducing, reusing and recycling of
materials. i.e.: Contractor can crush the excess or waste concrete and reuse it again as
road base for roads, reuse the waste of steel bars by reselling it for reproduction.
10. Basic Operational Waste Management
Prepare a waste management plan that will aim to "reduce the long-term
environmental impacts associated with operational waste collection, transport and
disposal", the building has an accessible, properly sized and accessible spaces that
allow storage and segregation of waste, specialist will be appointed to calculate the
annual estimate of operation waste, for achieving the minimum certification 40% of
the operational waste shall be diverted from landfill.
6.2 Phase 1 Assessment through PRS
Water Consumption
Water consumption has been reduced to match the baseline of PRS which is a
mandatory requirement (appendix 2, Tables 7); the annual consumption was
1,234,884 l/year while baseline is exactly the same 1,234,884 l/year as the same
fixtures were used.
Energy Consumption
Phase 1 of the case study upgrades has saved the required amount of energy to
achieve the required credit, and the consumption after these upgrades reached 587
MWh annually which is less than the baseline by 12 percent.
Overall Assessment
Phase 1 of the upgrading has succeeded to get certified by adopting several
sustainability strategies and managed to achieve all the required credits.

93
Environmental Aspect Credits
IDP: Integrated Development Process
IDP‐R1: Integrated Development Strategy Achieved
IDP‐R2: Tenant Fit‐Out Design & Construction Guide Achieved
IDP‐R3: Basic Commissioning Achieved
NS: Natural Systems
NS‐R1: Natural Systems Assessment Achieved
NS‐R2: Natural Systems Protection Achieved
NS‐R3: Natural Systems Design & Management Strategy Achieved
LB: Livable Buildings
LBo: Livable Outdoors
LBo‐R1: Plan 2030 Achieved
LBo‐R2: Urban Systems Assessment Achieved
LBo‐R3: Outdoor Thermal Comfort Strategy Achieved
LBi: Livable Indoors
LBi‐R1: Healthy Ventilation Delivery Achieved
LBi‐R2: Smoking Control Achieved
LBi‐R3: Legionella Prevention Achieved
PW: Precious Water
PW‐R1: Minimum Water Use Reduction Achieved
PW‐R2: Exterior Water Monitoring Achieved
RE: Resourceful Energy
RE‐R1: Minimum Energy Performance Achieved
RE‐R2: Energy Monitoring & Reporting Achieved
RE‐R3: Ozone Impacts of Refrigerants & Fire Suppression Systems
Achieved
SM: Stewarding Materials
SM‐R1: Hazardous Materials Elimination Achieved
SM‐R2: Basic Construction Waste Management Achieved
SM‐R3: Basic Operational Waste Management Achieved
Achieved level = 1 Pearls
Table 6.1 PRS assessment: achieved required credits

94
6.3 Case Study Upgrading Phase 2 : The Case Study Building Achieving 2 Pearls
through PRS
2 Pearls is an essential level of certification in PRS as all new governmental buildings
in Abu Dhabi are required to achieve this rating in order to get a building permit. The
level requires the building to achieve the full required credits for Pearl 1 plus 60
points of optional credits. The case study building design had been upgraded in order
to achieve the 2 pearls certificate; the strategy to get the building get two pearls was to
focus on the water credits and a selection of necessary credits that is required to have
a green efficient building. The suggest upgrades for the building will be categorized
as per the PRS categories as follows:
1. Integrated Development process
In this the category several essential credits were chosen such as "IDP-1 life cycle
costing" as the economical side is very important when upgrading a design of a
building, also there is "IDP-3 Construction Environmental Management" which
makes sure that an environmental ISO certified contractor is on board and that he has
a plan that can reduce or eliminate negative impact of construction activities, another
targeted credit was "IPD-4 Building Envelope Verification" which make sure that the
building envelope is meeting the design intent and has been tested by a third party to
minimize building impacts from condensation, water ingress, air infiltration and
improper drainage, that last credit to be chosen from this category is "IDP-6
Sustainability Communication" where a handbook for future occupants will be
prepared to make sure they are using the systems the best way they can.
2. Natural Systems
There are no points targeted at this category at this stage.
3. Livable Buildings
The first strategy was “LBo-1: Improved Outdoor Thermal Comfort” by increasing
the shading for the pedestrian walkways around the building by adding canopies
around the perimeter. The second strategy is “LBo-3: accessible community facility”
which is automatically achieved because the site lies in a 350 safe walking distance to
Mosque, Gym, Supermarket, ATM and school. The third one is “LBo-6: Public
Transport”, in this one the case study building got two points out of three where the
building is within a 350 meter of a bus stop.”LBo-7: Bicycle Facilities”, two points

95
were targeted by making simple design changes such as adding Bicycle racks and
showers for the building to encourage the use of bicycles. The fifth targeted credit is
“LBo-8: preferred parking spaces” by providing a 6% of the parking for preferred cars
such as cars supplied with (electricity, LPG or CNG gas and hybrid cars) or for those
who are forming a group of a defined and approved car sharing program, it shall be
supplied with electric points for charging and in an optimal location to main entrances
after the disabled parking places, it shall also be provided with an enforcement
mechanism.
Upgrading will be done in terms of indoor environmental quality (IEQ) by targeting
credits in the Livable Building indoors (LBi) category. The case study building will
be specified to use the five credits from (LBi-2), the main aim is to use materials that
have low VOC content. Also the design of the case study building allows it to achieve
the point of “LBi-8: views”.
4. Precious Water
In order to save more water than the baseline, a lower flush WC will be used 3/6 l per
flush and a 100% sensor taps will be used, in addition to this the building is eligible to
get credits in “PW-2: Exterior water use” due to using air based cooling system and
absence of outdoor landscaping or water fountains.
5. Resourceful Energy
In this phase, the building will not undergo or apply for a major energy upgrades and
will only target one point out of three from “RE-4: Vertical transportation” which is
achieving by providing a day lighted staircase which visible from the main entrance
of the building.
6. Stewarding Materials
Five material credits had been targeted by changing the specifications, the material
credits are (SM-1: Non-Polluting Materials, SM-5: Modular Flooring Systems, SM-9:
Regional Materials and SM-11: Rapidly Renewable Materials)

96
6.4 Phase 2 Assessments through PRS
Water Consumption
On the water side the building managed to save 20 more the baseline % (246,976.8
Liters/y). (Appendix 2, Table 8)
Energy Consumption
No energy credits had been approached at this stage.
Overall Assessment
The building management to achieve the 2 pearls rating which governmental building
mandatory rating for buildings in Abu Dhabi.
Environmental Aspect Achieved Points
Available Points
IDP: Integrated Development Process 8
Life Cycle Costing 4 4
Construction Environmental Management 2 2
Building Envelope Verification 1 1
Sustainability Communication 1 1
LB: Livable Buildings
LBo: Livable Outdoors 8
Improved Outdoor Thermal Comfort 2 2
Accessible Community Facilities 1 1
Public Transport 2 3
Bicycle Facilities 2 2
Preferred Car Parking Spaces 1 1
LBi: Livable Indoors 7
Materials Emissions : Adhesives & Sealants 1 1
Materials Emissions : Paints & Coatings 1 1
Materials Emissions: Carpet & Hard Flooring 1 1
Materials Emissions : Ceiling Systems 1 1
Materials Emissions : Formaldehyde Reduction 2 2
Views 1 1
Table 6.2 Phase 2 assessment through PRS assessment: achieved credits

97
PW: Precious Water 29
Improved Interior Water Use Reduction 5 15
Exterior Water Use Reduction: Landscaping 8 8
Exterior Water Use Reduction: Heat Rejection 8 8
Exterior Water Use Reduction: Water Features 4 4
Water Monitoring & Leak Detection 4 4
RE: Resourceful Energy 3
Vertical Transportation 3 3
SM: Stewarding Materials 5
Non-Polluting Materials 1 3
Modular Flooring Systems 1 1
Regional Materials 2 2
Rapidly Renewable Materials 1 1
Total 60 177
Achieved level = 2 Pearls
As Shown in Table 6.2, the 2 Pearls level was achieved through mainly water credits
as the building is using air cooled systems and no exterior water use applications, this
is plus using the taps with sensors and reducing the flush rate of the toilets. The
second highest area for scoring points was the LB category where the building
managed to score credits due to its location in the downtown in Abu Dhabi which
made it near to bus stops and community facilities, a various selected credit had been
chosen then to reach the 2 pearls bottom-line which is 60 points.
6.5 Case Study Upgrading Phase 3 : The Case Study Building Achieving the
Maximum Rating in PRS which is 5 Pearls
In order to get a building certified with the highest standard in a specific rating, it
must be very high complying with it plus it shall be fulfilling most of the aspects of
green buildings which is the main goal and any environmental assessment scheme. In
PRS 1 and 2 Pearls rating are considered to be mandatory for the code, upgrading the
building from these levels to higher optional certification levels can still be achieved
easily without major design changes as the points difference in between is not high,
where to upgrade a 2 Pearls building to 3 Pearls only 25 extra points out of 178

98
available points, however going higher to 4 and 5 pearls seems to be challenging as
the minimum points will be 115 for 4 pearls and 140 or more for 5.
To target 5 Pearls rating, major design changes have to be implemented in order to
improve the building assessment.
1. Integrated Development process
One of the main things that help in improving the overall building performance in all
aspects is making sure it is working properly after construction as per the design
intent, this will be assured by implementing "IDP-5: Re-commissioning " where the
building systems must be tuned 1 year after completion and re commissioned after 2
years. The second strategy is "IDP-6: Sustainability communication" which was
partially implemented in Phase 2 upgrades. In this phase a feed back mechanism will
be added to every tenancy and all to be connected to Building Management System
(BMS).
2. Natural Systems
Since there was no ecological value for the project site, to enhance it we had to
introduce some natural systems through the architecture of the building.
In this category, a roof garden will be added to the building which improve the
building in a multiple aspects, "NS-3: Ecological enhancement" will be one of the
benefits of adopting a roof garden system as 70 % of the plants which will be used
will be native or adaptive species comprising 10 different types as per the credit
requirement.
3. Livable Buildings
By adding a roof garden to the building in addition to a gym will be qualify it to
achieve "LBo-4: Active Urban Environment" as it will enhance the life styles of its
occupants. Another strategy will be adopted in the LBo which "LBo-10: Light
pollution reduction" due its importance in mitigating the negative impact of
unnecessary emitted lighting from the building.
In the Indoor Environmental quality multiple strategies had been suggested. “LBi-1:
Ventilation quality” will be targeted by installing Co2 sensors in the building and that
CO2 levels shall not exceed 1000 pm, and part of this credit is increasing the fresh air
supply by 15% more than the minimum requirement of the ventilation. The full points
of “LBi-5: Thermal Comfort and controls” had been targeted by implementing

99
thermal modeling, logical Thermal zoning and allowing for occupant controls on all
over the systems. No incandescent lamps and only high frequency florescent lamps
will be used in the project as a requirement to achieve “LBi-6: High frequency
lighting”. By maximizing the use of day lighting to achieve 250 lux over 75% of the
occupied areas, adding occupancy sensors and installing glare control devices, “LBi-
7: Day lighting and glare” will be achieved. “LBi-9: Indoor noise pollution” will be
achieve by hiring an acoustical consultant to make sure that the building noise levels
are within the comfort levels. The project will be able achieve the credit of “LBi-10:
Safe and secure environment” as it’s a mandatory requirement for Abu Dhabi Police
civil defense authority.
4. Precious Water
Maximum water savings is an essential component of the upgrades, and will use
rainwater and recycled grey water for:
1. The roof gardens that implemented for to achieve credits “NS-3: Ecological
enhancement" and "LBo-4: Active Urban Environment".
2. Flush for toilets to reduce the demand for potable water.
5. Resourceful Energy
Energy efficiency is a major component in green buildings, it starts with the design of
the systems of the building, in this phase major design changes shall be made in the
HVAC systems, Lighting, building envelope and architecture to improve the overall
building energy performance and to reduce the heat gain. This will allow the building
scoring points in “RE-1: Improved Energy Performance” and “RE-2: Cool building
strategies”.
A multiple renewable energies can be introduced to the project that can help in saving
energy such as:
1. Generating electricity from photovoltaic cells
2. Solar thermal water heaters
3. Geothermal
But the introduced type was Photo Voltaic (PV) cells. PVWATTS calculator was used
to determine the amount of energy that can be generated from the whole roof area

100
which is 400 sqm and for a PV system that can generate a 1 KW per 9 sqm, in Abu
Dhabi region.
The total possible generated energy is mentioned in Table 6.3.
Table 6.3 shows that the 400 sqm of the roof area of the case study can generate
around 73,827 KWh which is around 12% of the baseline, that will be assessed in
order to calculate how many points the case study can achieve.
From the operational side:
1. Only Energy efficient appliances will be used by the tenants by adding it as
mandatory clause in their tenancy contracts. This appliance can be energy star
rated or a minimum (A) rating under the EU Energy Efficiency Labeling
Scheme or an appropriate level that is comparable and meets or exceeds the
other rating schemes. (PRS,2010)
2. No materials with global warming impacts will be used (PRS,2010):
- HVAC refrigerants to be installed within the project have an equivalent Global
Warming Potential (GWP) of 1 or less.
- Installing permanent refrigerant leak detection.
Table 6.3 PVWATTS calculator results
101
- Installing an automatic refrigerant pump down system to a dedicated storage
tank with isolation valves
- All gaseous fire suppression systems have a GWP of 1 or less.
6. Stewarding Materials
Multiple approaches had been used to in this category such as:
- Materials management
By using techniques Such as; reducing the required materials through making
modular designs, design for flexibility, adaptability and durability.
- The use of recycled content materials
Using recycled steel, supplementary cementitious materials & materials with recycled
aggregates.
- Improved construction waste management and operational waster
management.
6.6 Phase 3 Assessments through PRS
Water Consumption
On the water, the building managed to save 84.8 % of the used potable water in
addition to 23.3% reduction in the interior water consumption. (Appendix 2, Table 9)
Energy Consumption
Phase 3 of the case study upgrades has saved 60 % of its energy consumption
compared to the baseline; this qualifies the case study building to achieve the full
credits of the energy credits.
In terms of renewable energy, the installed PV system can generate around. ….
Percent of the total energy consumption after reduction and that qualify the building
for a ….. points for the renewable energy credit.
Overall Assessment
The Upgrades of phase 3 had succeeded to achieve a major difference on the building
design and on the performance.

102
Environmental Aspect Achieved Points
Available Points
IDP: Integrated Development Process 11
Life Cycle Costing 4 4
Construction Environmental Management 2 2
Building Envelope Verification 1 1
Re-Commissioning 2 2
Sustainability Communication 2 2
NS: Natural Systems 2
Ecological Enhancement 2 2
LB: Livable Buildings
LBo: Livable Outdoors 9
Improved Outdoor Thermal Comfort 2 2
Accessible Community Facilities 1 1
Public Transport 2 3
Bicycle Facilities 2 2
Preferred Car Parking Spaces 1 1
Light Pollution Reduction 1 1
LBi: Livable Indoors 20
Ventilation Quality 3 3
Materials Emissions : Adhesives & Sealants 1 1
Materials Emissions : Paints & Coatings 1 1
Materials Emissions: Carpet & Hard Flooring 1 1
Materials Emissions : Ceiling Systems 1 1
Materials Emissions : Formaldehyde Reduction 2 2
Thermal Comfort & Controls: Thermal Zoning 1 1
Thermal Comfort & Controls: Occupant Control 2 2
Thermal Comfort & Controls: Thermal Comfort Modeling 2 2
High Frequency Lighting 1 1
Daylight & Glare 2 2
Views 1 1
Indoor Noise Pollution 1 1
Safe & Secure Environment 1 1
PW: Precious Water 39
Improved Interior Water Use Reduction 15 15
Table 6.4 Phase 3 assessment through PRS assessment: achieved credits

103
Exterior Water Use Reduction: Landscaping 8 8
Exterior Water Use Reduction: Heat Rejection 8 8
Exterior Water Use Reduction: Water Features 4 4
Water Monitoring & Leak Detection 4 4
RE: Resourceful Energy 40
Improved Energy Performance 15 15
Cool Building Strategies 6 6
Energy Efficient Appliances 3 3
Vertical Transportation 3 3
Renewable Energy 9 9
Global Warming Impacts of Refrigerants & Fire Suppression Systems 4 4
SM: Stewarding Materials 20
Non-Polluting Materials 1 1
Design for Flexibility & Adaptability 1 1
Design for Disassembly 1 1
Modular Flooring Systems 1 1
Design for Durability 1 1
Regional Materials 2 2
Recycled Materials 6 6
Rapidly Renewable Materials 1 1
Reused or Certified Timber 2 2
Improved Construction Waste Management 2 2
Improved Operational Waste Management 2 2
Total 141 177
Achieved level = 5 Pearls
The building had scored 141 points out of 178 available points which made it
applicable to get the 5 pearls certificate, the highest two categories in terms of
possible points achieved are "Resourceful Energy" and "Precious Water" (Table 6.4)
6.7 The Assessment of the three Phases of upgrades towards LEED
In this stage of the Assessment the three phases of grades that was done for the case
study building will be assessed on LEED.

104
6.7.1 Phase 1 upgrades : (1) Pearl
Water Consumption
This phase of upgrades was successful in achieving the minimum requirement of
LEED prerequisites for water saving credits which is 20% and eligible now for
certification from the water consumption side. (Appendix 2, Table 10)
Energy Consumption
Since the baseline of LEED and PRS are similar, the building managed to save 12%
which is more than the minimum requirements of Energy performance in LEED
which is 10%, the building is quality to achieve one more point in the advanced
energy performance.
Overall Performance
Environmental Aspect Credits
Sustainable sites (SS)
SS‐Pre1: Construction activity pollution prevention Not
Achieved
Water efficiency (WE)
WE‐Pre1: Water‐use reduction Prereq. Achieved
Energy and atmosphere (EA)
EA‐Pre1: Fundamental commissioning of the building energy systems
Prereq. Achieved
EA‐Pre2: Minimum energy performance Prereq. Achieved
EA‐Pre3: Fundamental refrigerant management Prereq. Achieved
Material and resources (MR)
MR‐Pre1: Storage and collection of recyclables Prereq. Achieved
Minimum Indoor Air Quality Performance (IEQ) Prereq. Achieved
IEQ‐Pre1: Minimum Indoor Air Quality Performance Prereq. Achieved
IEQ‐Pre2: Environmental Tobacco Smoke (ETS) Control Prereq. Achieved
Achieved level = Not Certified
LEED and PRS share most of the same mandatory credits, it was expected that a 1
Pearl building would at least fulfill the “Prerequisites” of LEED, which was mostly
true except that it didn’t achieve “ SS Prerequisite 1: Construction Activity Pollution
Table 6.5 Phase 1 assessment through LEED assessment: Prerequisites
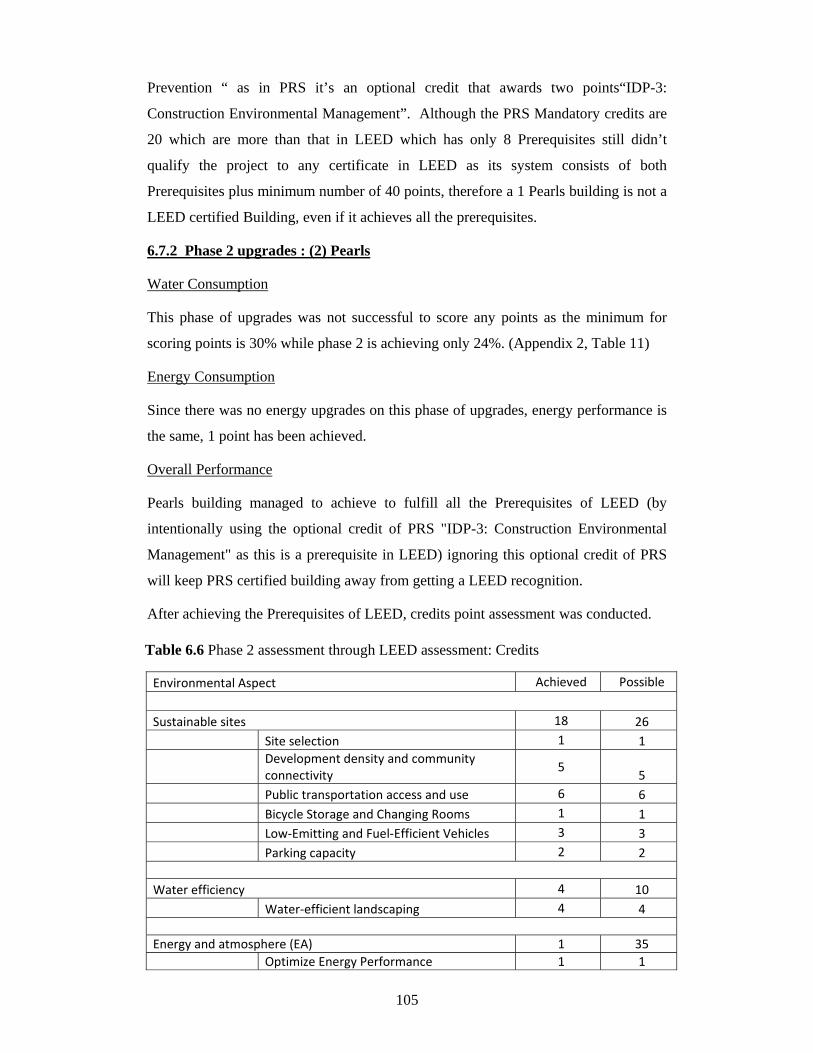
105
Prevention “ as in PRS it’s an optional credit that awards two points“IDP-3:
Construction Environmental Management”. Although the PRS Mandatory credits are
20 which are more than that in LEED which has only 8 Prerequisites still didn’t
qualify the project to any certificate in LEED as its system consists of both
Prerequisites plus minimum number of 40 points, therefore a 1 Pearls building is not a
LEED certified Building, even if it achieves all the prerequisites.
6.7.2 Phase 2 upgrades : (2) Pearls
Water Consumption
This phase of upgrades was not successful to score any points as the minimum for
scoring points is 30% while phase 2 is achieving only 24%. (Appendix 2, Table 11)
Energy Consumption
Since there was no energy upgrades on this phase of upgrades, energy performance is
the same, 1 point has been achieved.
Overall Performance
Pearls building managed to achieve to fulfill all the Prerequisites of LEED (by
intentionally using the optional credit of PRS "IDP-3: Construction Environmental
Management" as this is a prerequisite in LEED) ignoring this optional credit of PRS
will keep PRS certified building away from getting a LEED recognition.
After achieving the Prerequisites of LEED, credits point assessment was conducted.
Environmental Aspect Achieved Possible
Sustainable sites 18 26
Site selection 1 1
Development density and community connectivity
5 5
Public transportation access and use 6 6
Bicycle Storage and Changing Rooms 1 1
Low‐Emitting and Fuel‐Efficient Vehicles 3 3
Parking capacity 2 2
Water efficiency 4 10
Water‐efficient landscaping 4 4
Energy and atmosphere (EA) 1 35
Optimize Energy Performance 1 1
Table 6.6 Phase 2 assessment through LEED assessment: Credits

106
Material and resources (MR) 3 14
Regional materials (20%) 2 2
Rapidly Renewable Materials 1 1
Indoor Environmental Quality 6 15
Low‐Emitting Materials: Adhesives and Sealants
1 1
Low emitting materials: paints and coatings 1 1
Low‐Emitting Materials: Flooring Systems 1 1
Low‐Emitting Materials: Composite Wood and Agrifiber Products
1 1
Daylight and Views—Daylight 1 1
Daylight and Views—Views 1 1
Total Achieved level = not Certified 32 110
The case study building after reaching the bottom line of a 2 Pearls certification was
still was not good enough to get it at least certified. The case study building with
phase 2 upgrades still needed 8 points to reach the bottom line of getting certified
Table 6.6. The reason is that the core of phase 2 upgrades was in water credits which
did not payoff in LEED, however an upper 2 pearls building may be able to get
certified under LEED but as per current condition not possible.
6.7.3 Phase 3 upgrades : (5) Pearls
Water Consumption
Although phase 3 is saving 89.5% of potable water in PRS due to using grey water
from Municipality and without water use reduction, this phase was eligible for 2 extra
points at “WE-2: Innovative waste water technologies” but no extra credits under
“WE-3: Water use reduction” .
Energy Consumption
The building managed to save 60% from the baseline performance; however it will
only be awarded till 48% achieving 19 points as that’s the maximum of the this credit.
The use PV cells qualified the project to get 7 points under onsite renewable energy.
This increase in energy saving is expected to have a high and positive impact on the
building certification level as energy category in LEED has the highest weights.

107
Overall Performance
The case study building phase 3 upgrades was done mainly as per PRS guidelines, it
managed to fulfill the minimum required points for a 5 Pearl Rating, when this was
tested on LEED criteria, it achieved the credits shown in Table 6.7.
Environmental Aspect Achieved Possible
Sustainable sites 21 26
Site selection 1 1
Development density and community connectivity
5 5
Public transportation access and use 6 6
Bicycle Storage and Changing Rooms 1 1
Low‐Emitting and Fuel‐Efficient Vehicles 3 3
Parking capacity 2 2
Site Development—Protect or Restore Habitat 1 1
Heat Island Effect—Roof 1 1
Light Pollution Reduction 1 1
Water efficiency 6 10
Water‐efficient landscaping 4 4
Innovative Wastewater Technologies 2 2
Energy and atmosphere (EA) 33 35
Optimize Energy Performance 19 19
On‐site Renewable Energy 7 7
Enhanced Commissioning 2 2
Enhanced Refrigerant Management 2 2
Measurement and Verification 3 3
Material and resources (MR) 7 14
Construction Waste Management 1 1
Recycled Content 2 2
Regional materials (20%) 2 2
Rapidly Renewable Materials 1 1
Certified Wood 1 1
Indoor Environmental Quality 13 15
Outdoor Air Delivery Monitoring 1 1
Increased Ventilation 1 1
Low‐Emitting Materials: Adhesives and Sealants 1 1
Low emitting materials: paints and coatings 1 1
Low‐Emitting Materials: Flooring Systems 1 1
Low‐Emitting Materials: Composite Wood and Agrifiber Products
1 1
Table 6.7 Phase 3 assessment through LEED assessment: Credits
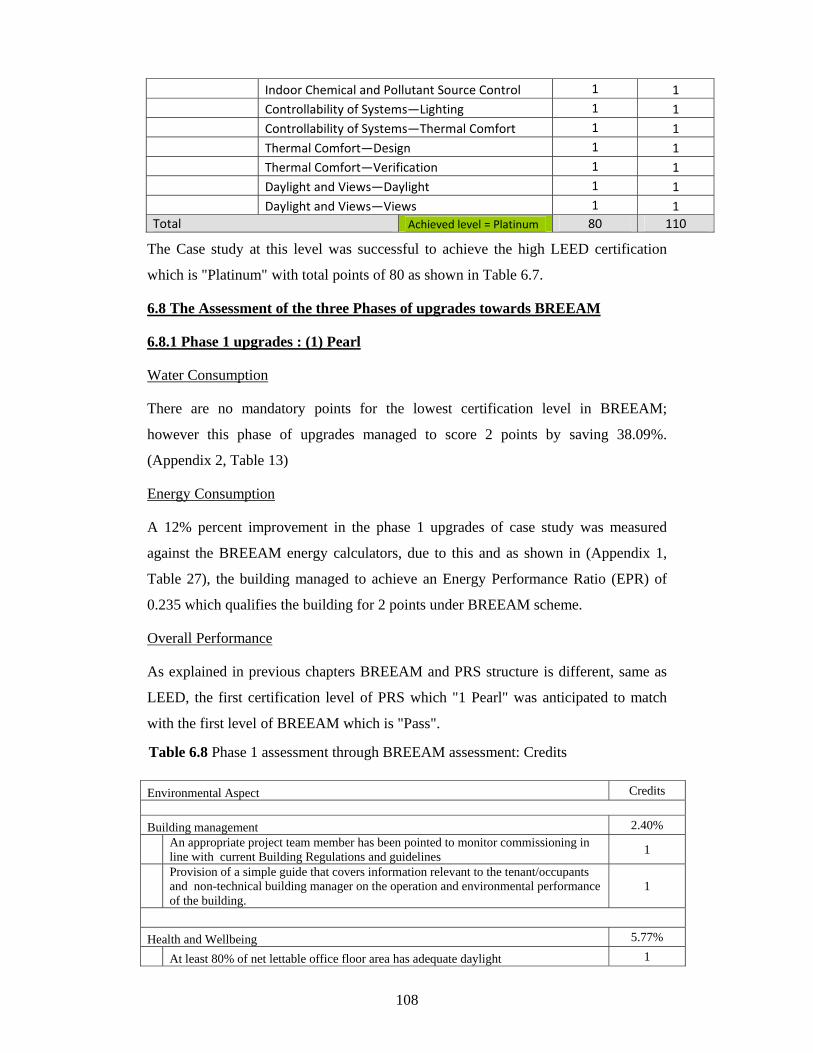
108
Indoor Chemical and Pollutant Source Control 1 1
Controllability of Systems—Lighting 1 1
Controllability of Systems—Thermal Comfort 1 1
Thermal Comfort—Design 1 1
Thermal Comfort—Verification 1 1
Daylight and Views—Daylight 1 1
Daylight and Views—Views 1 1
Total Achieved level = Platinum 80 110
The Case study at this level was successful to achieve the high LEED certification
which is "Platinum" with total points of 80 as shown in Table 6.7.
6.8 The Assessment of the three Phases of upgrades towards BREEAM
6.8.1 Phase 1 upgrades : (1) Pearl
Water Consumption
There are no mandatory points for the lowest certification level in BREEAM;
however this phase of upgrades managed to score 2 points by saving 38.09%.
(Appendix 2, Table 13)
Energy Consumption
A 12% percent improvement in the phase 1 upgrades of case study was measured
against the BREEAM energy calculators, due to this and as shown in (Appendix 1,
Table 27), the building managed to achieve an Energy Performance Ratio (EPR) of
0.235 which qualifies the building for 2 points under BREEAM scheme.
Overall Performance
As explained in previous chapters BREEAM and PRS structure is different, same as
LEED, the first certification level of PRS which "1 Pearl" was anticipated to match
with the first level of BREEAM which is "Pass".
Environmental Aspect Credits
Building management 2.40%
An appropriate project team member has been pointed to monitor commissioning in line with current Building Regulations and guidelines
1
Provision of a simple guide that covers information relevant to the tenant/occupants and non-technical building manager on the operation and environmental performance of the building.
1
Health and Wellbeing 5.77%
At least 80% of net lettable office floor area has adequate daylight 1
Table 6.8 Phase 1 assessment through BREEAM assessment: Credits

109
Although the Pass certification level seems possible to achieve but as shown in Table
6.8, the mandatory credits were not met as the focus of BREEAM is different than
that of PRS.
Phase 1 of the upgrades did allow the building to fulfill mandatory credits such as
“Man 01: Sustainable procurement” as it requires extended commissioning, “Hea 01:
Visual comfort” because of not using high frequency lamps and “Mat 03: Responsible
Sourcing” which is about sourcing of material such as wood and that is has to follow
UK Government procurement policy. Also Phase 1 did not achieve the required
minimum percentage for the lowest certification which is (30%) and achieved only
(23.03%).
Evidence provided demonstrates that all desks are within a 7m radius of windows 1
Evidence provided demonstrates that an occupant-controlled glare control system 1
Air intakes serving occupied areas avoid major sources of external pollution and recirculation of exhaust air.
1
Legionella prevention 1
Energy 2.38%
Reduction of Co2 emissions 2
Energy-efficient external lighting is specified and all light fittings are controlled for the presence of daylight.
1
Transport 3.20%
Good access is available to and from public transport networks for commuting 3
Good access to Local amenities 1
Water 2.00%
Improvement over standard specification of water fittings based on standards and legislation specifications
2
Waste 4.28%
Evidence provided demonstrates that the amount of non-hazardous construction waste (m3/100m2 or tonnes 100m2)generated on site by the development is the same as or better than good or best practice levels
3
Dedicated space is provided for the storage of the building’s recyclable waste streams.
1
Land use
Evidence is provided to demonstrate that the construction zone is defined 3.00%
as land of low ecological value 1
No negative change in the site’s existing ecological value as a result of development. 2
Total 23.03%
Achieved level = not certified

110
6.8.2 Phase 2 upgrades : (2) Pearls
Water Consumption
In this phase 2 of upgrades, there is a slight improvement in water consumption (from
38.09% to 38.89%) but still was not enough still to achieve more than 2 points.
(Appendix 2, Table 14)
Energy Consumption
There is no energy improvement as it wasn’t targeted at this credit.
Overall Performance
The focus in this phase was in water consumption reduction which is not mandatory
for BREEAM,
Environmental Aspect Credits
Building management 4.80%
An appropriate project team member has been pointed to monitor commissioning in line with current Building Regulations and guidelines
1
Evidence provided demonstrates that there is a commitment to go beyond best practice site management principles.
2
provision of a simple guide that covers information relevant to the tenant/occupants and Non-technical building manager on the operation and environmental performance of the building
1
Health and Wellbeing 8.08%
At least 80% of net lettable office floor area has adequate daylight 1
Evidence provided demonstrates that all desks are within a 7m radius of windows 1
Evidence provided demonstrates that an occupant-controlled glare control system 1
air intakes serving occupied areas avoid major sources of external pollution and recirculation of exhaust air.
1
Emissions of VOCs and other substances from key internal finishes and fittings comply with best practice levels
1
The risk of waterborne and airborne legionella contamination has been minimized. 1
High Frequency lighting 1
Energy 2.38%
Reduction of Co2 emissions 2
Energy-efficient external lighting is specified and all light fittings are controlled for the presence of daylight.
1
Transport 4.80%
Good access is available to and from public transport networks for commuting 3
Good access to Local amenities 1
Covered, secure and well-lit cycle storage facilities are provided for all building users. 1
Table 6.9 Phase 2 assessment through BREEAM assessment: Credits

111
Adequate changing facilities are provided for staff use. 1
Water 4.00%
Improvement over standard specification of water fittings based on standards and legislation specifications
2
A water meter with a pulsed output will be installed on the mains supply to each building/unit.
1
A leak detection system is specified or installed on the building's water supply. 1
Waste 4.28%
Evidence provided demonstrates that the amount of non-hazardous construction waste (m3/100m2 or tonnes 100m2) generated on site by the development is the same as or better than good or best practice levels.
3
Dedicated space is provided for the storage of the building’s recyclable waste streams. 1
Land use
Evidence is provided to demonstrate that the construction zone is defined 3.00%
as land of low ecological value 1
No negative change in the site’s existing ecological value as a result of development. 2
Pollution 1.67%
Land located in a low area of probability of flooding
Total 32.98%
Achieved level = Pass
Primary assessment showed that phase 2 was not able to achieve any certification
level due to missing one mandatory credit "high frequency lighting" which is an
optional credit in PRS. When this strategy considered as included, the case study
fulfilled all the highlight mandatory credits in Table 6.9 for pass and good grades and
managed to achieve a "PASS" grade with only "32.98%".
6.8.3 Phase 3 upgrades : (5) Pearls
Water Consumption
In this phase grey water was used, but only the recycled water from building was
possible to add, in PRS there is an option of having a municipal grey water supply.
The current changes in design managed to get the building 3 points under BREEAM
with percentage improvement 41.91 %. (Appendix 2, Table 15)
Energy Consumption
A 60 % percent improvement in the phase 3 upgrades of case study was measured
against the BREEAM energy calculators. The building managed to achieve an Energy

112
Table 6.10 Phase 3 assessment through BREEAM assessment: Credits
Performance Ratio (EPR) of 0.941 which qualifies the building for the full 15 points
under BREEAM scheme. (Appendix 3, Table 30)
Overall Performance
A bottom line 5 Pearls building was assessed against the BREEAM standards, Table
(6.10) shows the achieved credit.
Environmental Aspect Credits
Building management 7.20%
An appropriate project team member has been pointed to monitor commissioning in line with current Building Regulations and guidelines
1
seasonal commissioning will be carried out during the first year of occupation, post construction
1
Evidence provided demonstrates that there is a commitment to go beyond best practice site management principles.
2
Provision of a simple guide that covers information relevant to the tenant/occupants and Non-technical building manager on the operation and environmental performance of the building.
1
An Architectural Liaison Officer (ALO) or Crime Prevention Design Advisor (CPDA) from the local police force has been consulted at the design stage and their recommendations incorporated into the design of the building and its parking facilities
1
Health and Wellbeing 12.69%
At least 80% of net lettable office floor area has adequate daylight 1
Evidence provided demonstrates that all desks are within a 7m radius of windows
1
Evidence provided demonstrates that an occupant-controlled glare control system
1
Fresh air is capable of being delivered to the occupied spaces of the building via a natural ventilation strategy, and there is sufficient user-control of the supply of fresh air.
1
air intakes serving occupied areas avoid major sources of external pollution and recirculation of exhaust air.
1
Emissions of VOCs and other substances from key internal finishes and fittings comply with best practice levels
1
Thermal comfort levels in occupied spaces of the building are assessed at the design stage to evaluate appropriate servicing options; ensuring appropriate thermal comfort levels are achieved.
1
Local occupant control is available for temperature adjustment in each occupied space to reflect differing user demands.
1
The risk of waterborne and airborne legionella contamination has been minimized.
1
High Frequency lighting 1
The building achieves appropriate indoor ambient noise levels in offices areas. 1
Energy 15.83%
Reduction of Co2 emissions 15
Provision of direct sub-metering of energy uses within the building. 1
Sub-metering of energy consumption by tenancy/building function area is 1

113
installed within the building.
Energy-efficient external lighting is specified and all light fittings are controlled for the presence of daylight.
1
The installation of energy-efficient lift(s). 1
Transport 4.80%
Good access is available to and from public transport networks for commuting 3
Good access to Local ammenities 1
Covered, secure and well-lit cycle storage facilities are provided for all building users.
1
Adequate changing facilities are provided for staff use. 1
Water 5.00%
Improvement over standard specification of water fittings based on standards and legislation specifications
3
A water meter with a pulsed output will be installed on the mains supply to each building/unit.
1
A leak detection system is specified or installed on the building's water supply. 1
Materials 1.92%
Thermal insulation products used in the building have a low embodied impact relative to their thermal properties.
2
Waste 5.37%
Evidence provided demonstrates that the amount of non-hazardous construction waste (m3/100m2 or tonnes 100m2)generated on site by the development is the same as or better than good or best practice levels
3
significant use of recycled materials 1
Dedicated space is provided for the storage of the building’s recyclable waste streams.
1
Land use
Evidence is provided to demonstrate that the construction zone is defined 3.00%
as land of low ecological value 1
No negative change in the site’s existing ecological value as a result of development.
2
Pollution 5.00%
Use of refrigerants with a global warming potential (GWP) of less than 5 or where there are no refrigerants specified for use in building services.
1
That refrigerant leaks can be detected 1
Automatic refrigerant pump down is made to a heat exchanger (or dedicated storage tanks) with isolation valves.
1
The assessed development is located in a zone defined as having a low annual probability of flooding.
2
Reduction for nighttime pollution 1
New sources of noise from the development do not give rise to the likelihood of complaints from existing noise-sensitive premises and amenity or wildlife areas that are within the locality of the site.
1
Total 61.64%
Achieved level = Very Good
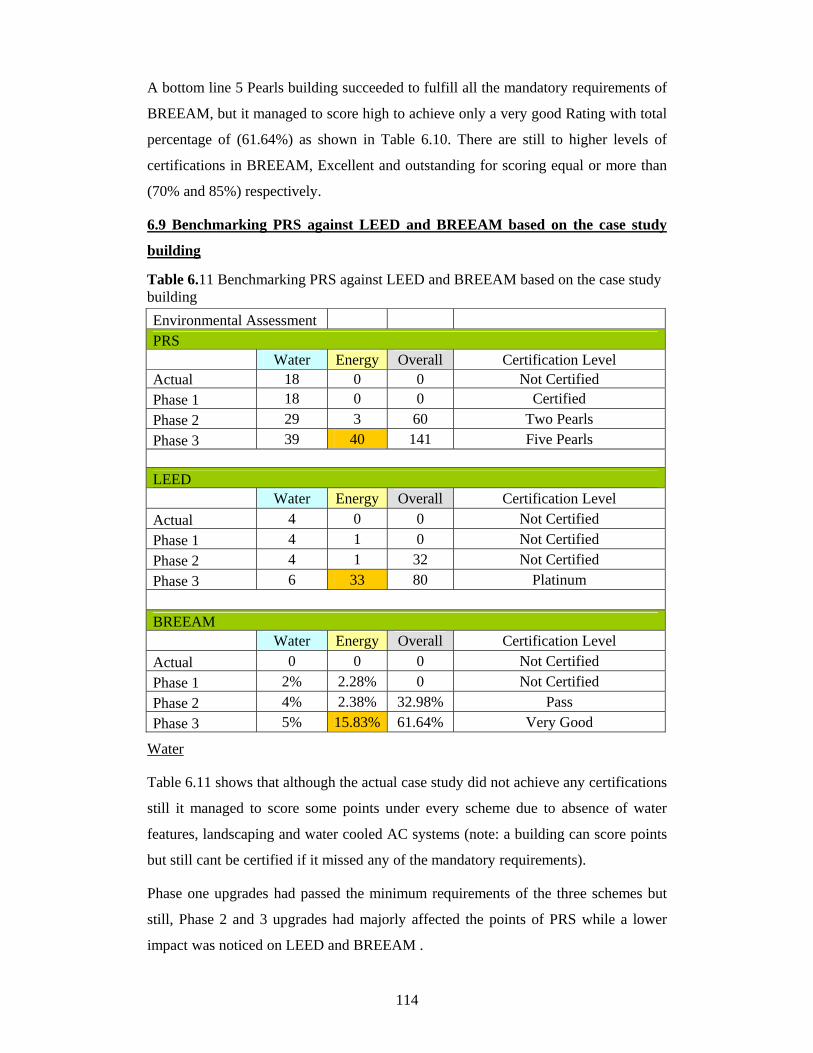
114
Table 6.11 Benchmarking PRS against LEED and BREEAM based on the case study building
A bottom line 5 Pearls building succeeded to fulfill all the mandatory requirements of
BREEAM, but it managed to score high to achieve only a very good Rating with total
percentage of (61.64%) as shown in Table 6.10. There are still to higher levels of
certifications in BREEAM, Excellent and outstanding for scoring equal or more than
(70% and 85%) respectively.
6.9 Benchmarking PRS against LEED and BREEAM based on the case study
building
Environmental Assessment PRS Water Energy Overall Certification Level Actual 18 0 0 Not Certified Phase 1 18 0 0 Certified
Phase 2 29 3 60 Two Pearls
Phase 3 39 40 141 Five Pearls LEED Water Energy Overall Certification Level
Actual 4 0 0 Not Certified
Phase 1 4 1 0 Not Certified
Phase 2 4 1 32 Not Certified
Phase 3 6 33 80 Platinum
BREEAM Water Energy Overall Certification Level
Actual 0 0 0 Not Certified
Phase 1 2% 2.28% 0 Not Certified
Phase 2 4% 2.38% 32.98% Pass
Phase 3 5% 15.83% 61.64% Very Good
Water
Table 6.11 shows that although the actual case study did not achieve any certifications
still it managed to score some points under every scheme due to absence of water
features, landscaping and water cooled AC systems (note: a building can score points
but still cant be certified if it missed any of the mandatory requirements).
Phase one upgrades had passed the minimum requirements of the three schemes but
still, Phase 2 and 3 upgrades had majorly affected the points of PRS while a lower
impact was noticed on LEED and BREEAM .

115
The water consumption related credits shows clearly the effect of the regional
priorities of every assessment scheme where the investment in increase the efficiency
in water consumption will score differently between PRS in one side and LEED,
BREEAM on the other side.
Energy
From the study, it appears that energy consumption is most comparable between the 3
three assessment schemes. And shown in Table 6.3, it proved that any investment in
energy efficiency will help the building to score high schemes which is not the same
case for other items such as Water.
Overall
Prerequisites, Required and Mandatory Credits
It seemed after having a detailed review and testing for the three assessment Systems
that it’s somehow not easy to compare, one of the main reasons is because of the
prerequisites or mandatory credits, a building can be scoring very high in a specific
system but not certified due to missing a single prerequisite as shown in Fig. 6.1,
What’s a mandatory in UK is considered to be an optional in UAE and US. Adding to
that, the complexity of comparing BREEAM is that its mandatory credits are not
constant; it changes with every higher level of certification. Also there is a necessity
of involvement of multiple construction specialists to be able to compare all aspects
of the schemes.
Figure 6.1 Illustration showing the relation between the mandatory part in three assessment schemes
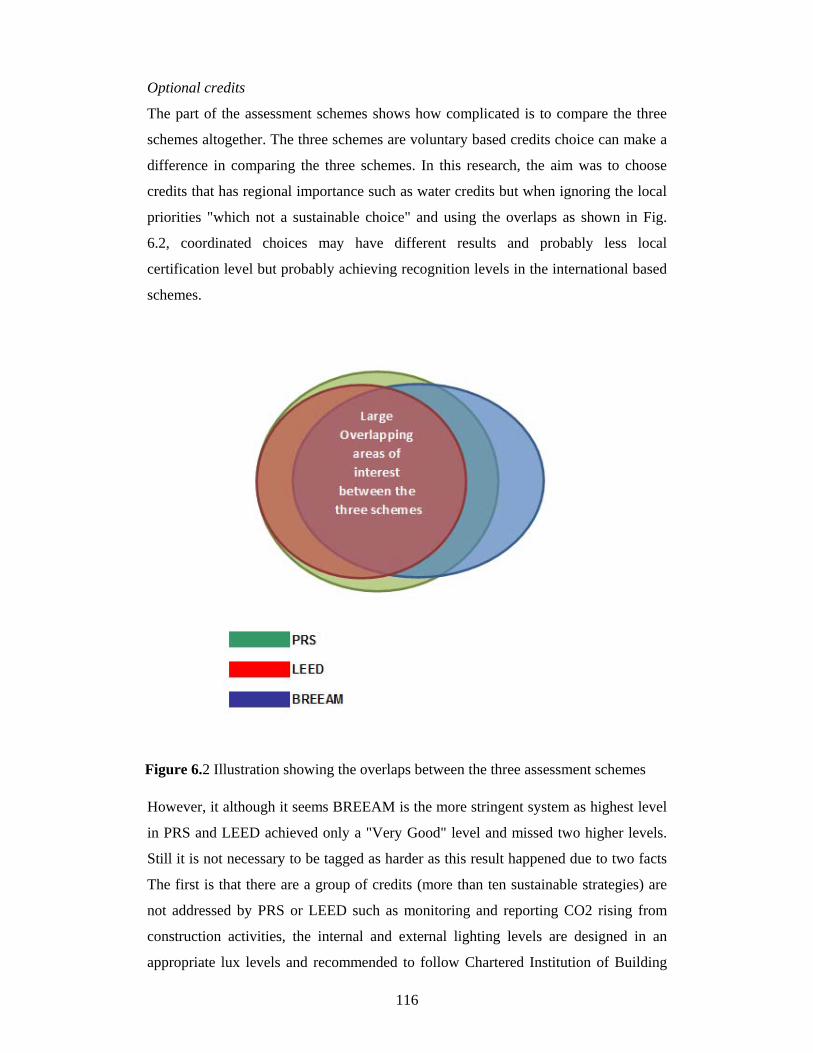
116
Optional credits
The part of the assessment schemes shows how complicated is to compare the three
schemes altogether. The three schemes are voluntary based credits choice can make a
difference in comparing the three schemes. In this research, the aim was to choose
credits that has regional importance such as water credits but when ignoring the local
priorities "which not a sustainable choice" and using the overlaps as shown in Fig.
6.2, coordinated choices may have different results and probably less local
certification level but probably achieving recognition levels in the international based
schemes.
However, it although it seems BREEAM is the more stringent system as highest level
in PRS and LEED achieved only a "Very Good" level and missed two higher levels.
Still it is not necessary to be tagged as harder as this result happened due to two facts
The first is that there are a group of credits (more than ten sustainable strategies) are
not addressed by PRS or LEED such as monitoring and reporting CO2 rising from
construction activities, the internal and external lighting levels are designed in an
appropriate lux levels and recommended to follow Chartered Institution of Building
Figure 6.2 Illustration showing the overlaps between the three assessment schemes

117
Services Engineers (CIBSE) standards, lighting zones and controls, Low zero carbon
technologies, Pedestrian and cyclist safety, sanitary supply shutoff, Material
specifications as per "Green Guide" which is a UK materials standard system,
responsible sourcing of materials, Floor finishes to be specified by future tenants or
occupant and NOx emissions from heating sources. The second fact is that the credit
structure with its mandatory credits of BREEAM is totally different than that of
LEED or PRS.
This means that although the three schemes appeared to be similar, the detailed
comparison showed that only LEED and PRS are more comparable while BREEAM
is a little far from them.
This contradicts somehow with some of what was found in the literature review,
where Elgendy (2010) had compared the same three schemes and concluded that they
have many similarities, also in the Inbuilt report (2010) who although they mentioned
that "its not straight forward to compare" however but still they mentioned that "If a
building has scored well under LEED, it is likely that it will score well under
BREEAM. The converse relationship does not hold quite as well".
Saunders (2008) had also concluded similar findings of this research as he mentioned
in his research "The results demonstrate much higher levels of variation between
systems for the same “grade” " and that "Thus buildings designed to achieve high
LEED and Green Star scores in the UK will generally not score as well against
BREEAM". Also Lee and Burnett (2008) when compared HK-BEAM against LEED
and BREEAM, they stated that " It is most difficult to score credits under BREEAM "
but also highlighted that in terms of energy assessment " The difference in energy use
assessment methods, baseline buildings, simulation tools and performance criteria do
not affect the assessment results" and that was similar to what was found in this
research paper.
The effect of mandatory credits to the comparability between the assessment schemes
seems to be not mentioned by any of the reviewed papers, they all seem to analyze
schemes as a bunch of credits that represents sustainable strategies without really
trying to undergo the certification process of every scheme. In this paper it was found
that mandatory schemes require an essential alienation and coordination in order to
increase the comparability between schemes.

118
Chapter 7
Conclusion and Further Study

119
Buildings are a huge investment not only on the economical side but also on the
natural environment side. The three studied schemes and the organizations behind
them put this into consideration and aimed to work diligently on mitigating the
negative impacts of construction industry on the natural environment.
Since the study is a comparative analysis between environmental assessment schemes,
actual design and assessment process had to be conducted for the case study building
as per every assessment scheme. Due to time limitation the focus had been given to
Water, Energy and Overall all assessment of the schemes.
The study has started with a literature review that showed the history of
environmental assessment schemes in general and the reasons behind its creation and
development; this was one of the main research objectives which were necessary to
provide a good basis and the required background knowledge that can allow fulfilling
the main research aim and objectives.
The main aim was to benchmark PRS against LEED and BREEAM, it was found that
PRS is a standalone system that combines most of the other two schemes credits, thus
has big overall laps in terms of sustainability strategies with them. PRS also gives
more recognition to the buildings who respond to local and regional priorities of the
Gulf such as energy and water saving. It was also noticed that BREEAM is the least
in terms of popularity in the region with no buildings certified in UAE that led
BREEAM to withdraw its customized assessment scheme which was developed for
the Gulf. From an application and certification levels side, LEED and PRS are more
comparable and especially in the higher certification levels, that’s why it was found
that both were assessed by nearly the same professionals as the structure, credits and
references are much similar. BREEAM proved to be less comparable and presents the
hardest scheme of the three to score under. On the Cultural and social side, it was
observed that PRS is the only scheme who claims to dedicate points for the cultural
values of credits. Still it was found that in general, the three schemes are far from
being related to the current behaviors of occupants and assumes that all occupants are
educated and will use the building exactly as designed.

120
In overall look after the study the three environmental assessment schemes even with
its differences; all showed in overall a definite positive impact on the building design,
performance, a positive impact on the occupants of the rated buildings and positive
impact on the environment.
Further Study
The Impact of the HVAC design on the overall energy performance of the
building.
The differences between the prescriptive and performance based methods in
assessing the energy performance in PRS and the impact on the actual
performance of buildings.
The impact of water saving on the energy savings.
Post occupancy evaluations for PRS certified buildings.
Cost impact of applying LEED/BREEAM and PRS on the buildings in UAE.
The efficiency of using renewable energies on the buildings of Abu Dhabi and
the impact on cost.

121
References
122
Abu Dhabi Distribution Company (ADDC). (2012). How to understand your bill [Online]. UAE:ADDC. [Accessed 01 February 2012]. Available at: https://eservices.addc.ae/En/Pages/BillFormat.aspx Al Arabiya News Channel. (2010). Index seeks alert to risks of carbon pricing [Online]. UAE [Accessed 20 March 2011]. Available at: http://www.ead.ae/en/news/turnit.off.campaign.aspx American Society of Heating, Refrigeration and Air-Conditioning Engineers. (2007). ASHRAE 62.1-2007. Ventilation for acceptable Indoor Air Quality. USA. Australian Government, Department of Energy and Climate Change. Renewable Energy Programs and Resources. (2012). What you need to know/Renewable Energy [Online]. Australia. [Accessed 14 February 2012]. Available at: http://www.climatechange.gov.au/what-you-need-to-know/renewable-energy.aspx British Broadcasting Company (BBC) News. (2011). Horn of Africa sees 'worst drought in 60 years' [Online]. Somalia. [Accessed 20 September 2011]. Available at: www.bbc.co.uk/news/world-africa-13944550 British Broadcasting Company (BBC) News. (2011). Oil hits new high on Iran fears [Online]. Iran. [Accessed 20 September 2011]. Available at: http://newsvote.bbc.co.uk/2/hi/business/7501939.stm Bundesverband Solarwirtschaft (BSW). (2012). Policy Framework: The Renewable Energy Sources Act (EEG) [Online]. Germany. [Accessed 4 February 2012]. Available at: http://bswsolar.com/En/home/photovoltaic-market/policy-framework.html Climate Control Middle East (ME). (2010). Water and electricity cost price outstrips billing[Online] UAE [Accessed 01 February 2012]. Available at: http://www.climatecontrolme.com/en/2010/12/water-electricity-cost-price-outstrips-billing/ Crawleya, D., Hand, J., Kummert, M., Griffith, B. Contrasting the capabilities of building energy performance simulation programs, Building and Environment, 43 . 661–673. 2008 Environmental Agency Abu Dhabi (EAD). (2009). Environment Agency – Abu Dhabi Targets International Audience with Latest Energy and Water Campaign[Online]. UAE. [Accessed 20 March 2011]. Available at: http://www.ead.ae/en/news/turnit.off.campaign.aspx European Commission (EC).(2011). Energy Efficiency in Buildings[Online]. Europe. [Accessed 20 September 2011]. Available at: http://ec.europa.eu/energy/efficiency/buildings/buildings_en.htm Fowler, K. and Rauch, E. (2008). Assessing green building performance: a post occupancy evaluation of 12 GSA buildings, Pacific Northwest National Laboratory, Report number PNNL-17393.

123
Gendy, k. (2010). Comparing Estidama’s Pearls Rating System to LEED and BREEAM. Carboun. Happy Planet Index – New Economics Foundation (NEF). Life Satisfaction[Online] [Accessed 15 September 2011]. Available at: http://www.happyplanetindex.org/explore/global/life-sat.html Holmes, J. & Hudson, G. (2000). The Cutting Edge 2000. An evaluation of the objectives of the BREEAM scheme for offices: a local case study. University of Northumbria at Newcastle. ISBN 1-84219-031-8 Huizenga, C., Abbaszadeh, S., Zagreus,L., Arens,E. (2006). Air Quality and Thermal Comfort in Office Buildings: Results of a Large Indoor Environmental Quality Survey, Proceedings of Healthy Buildings. Lisbon,Vol. III, 393-397. International Union for Conservation of Nature (IUCN). (2011). International Union for Conservation of Nature helps the world find pragmatic solutions to our most pressing environment and development challenge years[Online] Switzerland [Accessed 20 September 2011]. Available at: www.iucn.org Intergovernmental Panel of Climate Change (IPCC). (2005). A glossary by the Intergovernmental Panel on Climate Change [Online] [Accessed 05 February 2012]. Available at: http://www.ipcc.ch/publications_and_data/publications_and_data_glossary.shtml Integrated Environmental Solutions (IES). (2011). IES VE Plug-in for Google SketchUp, User Guide. UK. Integrated Environmental Solutions (IES). (2011). ApacheHVAC User Guide. UK Integrated Environmental Solutions (IES). (2011). ApacheSim User Guide. UK Integrated Environmental Solutions (IES). (2011). Vista User Guide. UK American Society of Heating, Refrigeration and Air-Conditioning Engineers (ASHRAE). (2007). ASHRAE 90.1-2007, Energy Standard for Buildings except Low-Rise Residential Buildings. USA. Langdon, D. (2007). The cost and benefit of achieving green buildings. Davis Langdon. Langdon, D. (2007). Sustainability Offices[Online]. Europe. [Accessed 14 February 2012]. Available at: www.davislangdon.com/EME/Research/ResearchFinder/SustainabilityPublications/SustainabilityOffices_Jan07 Lee, W. & Burnett, J. (2008). Benchmarking energy use assessment of HK-BEAM, BREEAM and LEED. Building and Environment 43. P 1882–1891.

124
Lee, Y. and Kim, S. (2008). Indoor Environmental Quality in LEED-Certified Buildings in the U.S, Journal of Asian Architecture and Building Engineering/November 2008/300. Lee, W. (2012). Benchmarking energy use of building environmental assessment schemes. Energy and Buildings. Volume 45. Masdar. (2011). The Future Build [Online]. UAE. [Accessed 15 September 2011]. Available at: http://www.thefuturebuild.com/ McGraw Hill Construction. (2009). Green outlook 2009: trends driving change. Organization of the Petroleum Exporting Countries (OPEC). (2011). OPEC Basket Price [Online]. Austria. [Accessed 20 September 2011]. Available at: http://www.opec.org/opec_web/en/data_graphs/40.htm Poveda, C. (2011). A Review of Sustainability Assessment and Sustainability/Environmental Rating Systems and Credit Weighting Tools, Journal of Sustainable Development. Vol. 4, No. 6. PVWATTS. PV calculator. [Online] USA [Accessed 02 March 2012]. Available at: www.nrel.gov/rredc/pvwatts/ Renewable Heat Incentive. (2012). How the Renewable Heat Incentive works [Online]. UK. [Accessed 14 February 2012]. Available at: http://www.rhincentive.co.uk/RHI/principles/ Roderick, Y. (2009). A comparative study of building energy performance assessment between LEED, BREEAM and Green Star schemes. Integrated Environmental Solutions Limited, Kelvin Campus, West of Scotland Science Park, Glasgow. Sabapathy, A., Ragavan,S., Vijendra, M., Nataraja,A. (2010). Energy efficiency benchmarks and the performance of LEED rated buildings for Information Technology facilities in Bangalore, India. Energy and Buildings 42. 2206–2212. Saunders, T. A. (2008). Discussion Document Comparing International Environmental Assessment Methods for Buildings, BRE Global. Tay, E. (2011). The Green Business Times Guide to Singapore Government Funding and Incentives for the Environment. Green Building Times.com [Online]. USA. [Accessed 14 February 2012]. Available at: www.greenbusinesstimes.com/2011/06/14/the-green-business-times-guide-to-singapore-government-funding-and-incentives-for-the-environment/ Tatari, O. & Kucukvar, M. (2011). Cost premium prediction of certified green buildings: A neural network approach. Civil Engineering Dept., Ohio University. Tilbury, D. (2002). Education and Sustainability. Responding to the Global Challenge Commission on Education and Communication. The World Conservation Union (ICUN).

125
UAE Statistics Bureau. (2010) Methodology of estimating the population in UAE. Population Estimates 2006 – 2010.UAE. United States Green Building Council (USGBC). (2009). LEED 2009 for Buildings Design and Construction. USA: USGBC. United States Green Building Council (USGBC). (2009) LEED Core Concepts Guide. USA: USGBC. United Nations (UN) General Assembly. (1987). Report of the World Commission on Environment and Development: Our Common Future. The United Nations. United Nations (UN) General Assembly. (2005). World Summit. Resolution A/60/1. The United Nations. United Nations (UN). UN Framework Convention on Climate Change (UNFCC). [Online] USA [Accessed 20 September 2011]. Available at: http://unfccc.int/essential_background/convention/background/items/1349.php United Nation Environmental Program (UNEP). (2007). Buildings Can Play a Key Role in Combating Climate Change [Online]. Sweden. [Accessed 20 September 2011]. Available at: www.unep.org/Documents.Multilingual/Default.asp?DocumentID=502&ArticleID=5545&l=en UN Framework Convention on Climate Change (UNFCC). Kyoto Protocol [Online] USA [Accessed 20 September 2011]. Available at: http://unfccc.int/kyoto_protocol/items/2830.php United States Environmental Protection Agency US (EPA). (2011). Green Buildings [Online]. USA. [Accessed 15 September 2011]. Available at: http://www.epa.gov/greenbuilding/ United States Green Building Council (USGBC). (2012) .Public Policies Adopting or Referencing LEED[Online]. USA. [Accessed 14 February 2012]. Available at: http://www.usgbc.org/DisplayPage.aspx?CMSPageID=1852 Wright, R. & Boorse, D. (2011). Environmental Science Toward a sustainable future. .Pearson.

0A
Appendices

1A
APPENDIX 1
Environmental Assessments Scorecards
1. Pearl Rating System Score Card
2. LEED Score Card
3. BREEAM Score Card

1. Pearl Rating System Score Card

Pearl Building Rating System Version 2
Project Name Office Building
Project ID 1
Building Use Office
Pearl Rating Stage Design
Pearl QP Name Ahmed Effat Mokhtar Abdelsalam Mosa
Pearl QP Number 1
Date 7/4/1905
Credit Points Summary
Yes Maybe No Yes Maybe No
IDPIDP-R1 Integrated Development Strategy Required
IDP-R2 Tenant Fit-Out Design & Construction Guide Required
IDP-R3 Basic Commissioning Required
IDP-1 Life Cycle Costing 4 0
IDP-2 Guest Worker Accommodation 2 0
IDP-3 Construction Environmental Management 2 0
IDP-4 Building Envelope Verification 1 0
IDP-5 Re-Commissioning 2 0
IDP-6 Sustainability Communication 2 0
TOTAL 13 0 0 0 0 0 0
NSNS-R1 Natural Systems Assessment Required
NS-R2 Natural Systems Protection Required
NS-R3 Natural Systems Design & Management Strategy Required
NS-1 Reuse of Land 2 0
NS-2 Remediation of Contaminated Land 2 0
NS-3 Ecological Enhancement 2 0
NS-4 Habitat Creation & Restoration 6 0
TOTAL 12 0 0 0 0 0 0
LBoLBo-R1 Plan 2030 Required
LBo-R2 Urban Systems Assessment Required
LBo-R3 Outdoor Thermal Comfort Strategy Required
LBo-1 Improved Outdoor Thermal Comfort 2
LBo-2 Pearl Rated Communities 1 0
LBo-3 Accessible Community Facilities 1
LBo-4 Active Urban Environments 1 0
LBo-5 Private Outdoor Space n/a
LBo-6 Public Transport 3
Comments
Integrated Development Process
Natural Systems
Livable Buildings : Outdoors
No
Project Details
ConstructionDesignCredit Title
Credit Points Available
Credit Reference
No
No
Yes
Yes
Yes
Yes
Yes
Yes
No required submission
No required submission
Report a Template Bug : [email protected]
No required submission

LBo-7 Bicycle Facilities 2 0
LBo-8 Preferred Car Parking Spaces 1 0
LBo-9 Travel Plan 1 0
LBo-10 Light Pollution Reduction 1 0
13 0 0 0 0 0 0
LBiLBi-R1 Healthy Ventilation Delivery Required
LBi-R2 Smoking Control Required
LBi-R3 Legionella Prevention Required
LBi-1 Ventilation Quality 3 0
LBi-2.1 Materials Emissions : Adhesives & Sealants 1 0
LBi-2.2 Materials Emissions : Paints & Coatings 1 0
LBi-2.3 Materials Emissions: Carpet & Hard Flooring 1 0
LBi-2.4 Materials Emissions : Ceiling Systems 1 0
LBi-2.5 Materials Emissions : Formaldehyde Reduction 2 0
LBi-3 Construction Indoor Air Quality Management 2 0
LBi-4 Car Park Air Quality Management 1 0
LBi-5.1 Thermal Comfort & Controls: Thermal Zoning 1 0
LBi-5.2 Thermal Comfort & Controls: Occupant Control 2 0
LBi-5.3 Thermal Comfort & Controls: Thermal Comfort Modeling 2 0
LBi-6 High Frequency Lighting 1 0
LBi-7 Daylight & Glare 2 0
LBi-8 Views 1
LBi-9 Indoor Noise Pollution 1 0
LBi-10 Safe & Secure Environment 1 0
23 0 0 0 0 0 0
PW
PW-R1 Minimum Interior Water Use Reduction Required
PW-R2 Exterior Water Monitoring Required
PW-1 Improved Interior Water Use Reduction 15 0
PW-2.1 Exterior Water Use Reduction: Landscaping 8 0
PW-2.2 Exterior Water Use Reduction: Heat Rejection 8 0
PW-2.3 Exterior Water Use Reduction: Water Features 4 0
PW-3 Water Monitoring & Leak Detection 4 0
PW-4 Stormwater Management 4 0
TOTAL 43 0 0 0 0 0 0
RE
RE-R1 Minimum Energy Performance Required
RE-R2 Energy Monitoring & Reporting Required
RE-R3 Ozone Impacts of Refrigerants & Fire Suppression Systems Required
RE-1 Improved Energy Performance 15 0
RE-2 Cool Building Strategies 6 0
RE-3 Energy Efficient Appliances 3 0
RE-4 Vertical Transportation 3 0
RE-5 Peak Load Reduction 4 0
RE-6 Renewable Energy 9 0
Precious Water
Resourceful Energy
SUB-TOTAL
SUB-TOTAL
Livable Buildings : Indoors
Yes
No
No
Yes
No
No
No
No

RE-7 Global Warming Impacts of Refrigerants & Fire Suppression Systems 4 0
TOTAL 44 0 0 0 0 0 0
SM
SM-R1 Hazardous Materials Elimination Required
SM-R2 Basic Construction Waste Management Required
SM-R3 Basic Operational Waste Management Required
SM-1 Non-Polluting Materials 3 0
SM-2 Design for Materials Reduction 1 0
SM-3 Design for Flexibility & Adaptability 1 0
SM-4 Design for Disassembly 1 0
SM-5 Modular Flooring Systems 1 0
SM-6 Design for Durability 1 0
SM-7 Building Reuse 2 0
SM-8 Material Reuse 1 0
SM-9 Regional Materials 2 0
SM-10 Recycled Materials 6 0
SM-11 Rapidly Renewable Materials 1 0
SM-12 Reused or Certified Timber 2 0
SM-13 Improved Construction Waste Management 2 0
SM-14 Improved Operational Waste Management 2 0
SM-15 Organic Waste Management 2 0
TOTAL 28 0 0 0 0 0 0
IP
IP-1 Innovative Cultural & Regional Practices 3 0
IP-2 Innovating Practice 3 0
TOTAL 6 0 0 0 0 0 0
Stewarding Materials
Innovating Practice
No
No
No

Pearl Building Rating System
Credit Section Credit Points AvailableDesign
Credit PointsConstruction Credit Points
Project Name Office Building IDP - Integrated Development Process 13 0 0
Project ID 1/1/1900 NS - Natural Systems 12 0 0
Building Use Office LB - Livable Buildings 36 0 0
Pearl Rating Stage Design PW - Precious Water 43 0 0
Pearl QP Name Ahmed Effat Mokhtar Abdelsalam Mosa RE - Resourceful Energy 44 0 0
Pearl QP Number 1/1/1900 SM - Stewarding Materials 28 0 0
Date 7/4/1905 IP - Innovating Practice 6 0 0
Total 0 0Total Credit Points Pearl Rating
Required credits only 1
60 2
85 3
115 4
140 5
Project Summary
Pearl Rating Levels
Unrated
Unrated
Construction Pearl Rating
Design Pearl Rating
0
10
20
30
40
50LB
PW
RE
SMIP
IDP
NS
Points Available Design Points Construction Points
0
10
20
30
40
50
IDP NS LB PW RE SM IP
Cred
it P
oint
s
Points Available Design Points Construction Points

2. LEED Score Card

LEED 2009 for New Construction and Major Renovations Office Building in Abu Dhabi
Project Checklist 2012
Possible Points: 26Y ? N Y ? N
Y Prereq 1 Credit 4 1 to 2Credit 1 1 Credit 5 1 to 2Credit 2 5 Credit 6 Rapidly Renewable Materials 1Credit 3 Brownfield Redevelopment 1 Credit 7 1Credit 4.1 6Credit 4.2 1 Possible Points: 15Credit 4.3 Alternative Transportation—Low-Emitting and Fuel-Efficient Vehicles 3Credit 4.4 2 Y Prereq 1
Credit 5.1 Site Development—Protect or Restore Habitat 1 Y Prereq 2
Credit 5.2 Site Development—Maximize Open Space 1 Credit 1 1Credit 6.1 Stormwater Design—Quantity Control 1 Credit 2 1Credit 6.2 Stormwater Design—Quality Control 1 Credit 3.1 1Credit 7.1 Heat Island Effect—Non-roof 1 Credit 3.2 1Credit 7.2 1 Credit 4.1 1Credit 8 Light Pollution Reduction 1 Credit 4.2 1
Credit 4.3 1
Possible Points: 10 Credit 4.4 1Credit 5 1
Y Prereq 1 Credit 6.1 Controllability of Systems—Lighting 1Credit 1 Water Efficient Landscaping 2 to 4 Credit 6.2 1Credit 2 Innovative Wastewater Technologies 2 Credit 7.1 1Credit 3 2 to 4 Credit 7.2 Thermal Comfort—Verification 1
Credit 8.1 1
Possible Points: 35 Credit 8.2 1
Y Prereq 1 Possible Points: 6Y Prereq 2
Y Prereq 3 Credit 1.1 1Credit 1 1 to 19 Credit 1.2 1Credit 2 1 to 7 Credit 1.3 1Credit 3 2 Credit 1.4 1Credit 4 2 Credit 1.5 1Credit 5 3 Credit 2 1Credit 6 2
Possible Points: 4Possible Points: 14
Credit 1.1 1Y Prereq 1 Credit 1.2 1
Credit 1.1 1 to 3 Credit 1.3 1Credit 1.2 Building Reuse—Maintain 50% of Interior Non-Structural Elements 1 Credit 1.4 1Credit 2 1 to 2Credit 3 1 to 2 Possible Points: 110
Certified 40 to 49 points Silver 50 to 59 points Gold 60 to 79 points Platinum 80 to 110
Construction IAQ Management Plan—During Construction
Outdoor Air Delivery Monitoring
Indoor Environmental Quality
Minimum Indoor Air Quality PerformanceEnvironmental Tobacco Smoke (ETS) Control
Increased Ventilation
Regional Priority Credits
Innovation and Design ProcessMinimum Energy PerformanceFundamental Refrigerant Management
Daylight and Views—ViewsDaylight and Views—Daylight
Low-Emitting Materials—Adhesives and SealantsLow-Emitting Materials—Paints and Coatings
Innovation in Design: Specific TitleOptimize Energy Performance
Energy and Atmosphere
Water Use Reduction—20% Reduction
Low-Emitting Materials—Composite Wood and Agrifiber ProductsLow-Emitting Materials—Flooring Systems
Indoor Chemical and Pollutant Source Control
Thermal Comfort—DesignControllability of Systems—Thermal Comfort
Fundamental Commissioning of Building Energy Systems
Water Use Reduction
Regional Materials
Certified Wood
Alternative Transportation—Bicycle Storage and Changing Rooms
Sustainable Sites
Alternative Transportation—Public Transportation Access
Site SelectionDevelopment Density and Community Connectivity
Construction Activity Pollution Prevention
Materials Reuse
Storage and Collection of Recyclables
Construction IAQ Management Plan—Before Occupancy
Materials and Resources, Continued
Water Efficiency
Building Reuse—Maintain Existing Walls, Floors, and Roof
Alternative Transportation—Parking Capacity
Heat Island Effect—Roof
Recycled Content
Construction Waste Management
Enhanced CommissioningOn-Site Renewable Energy
Enhanced Refrigerant Management
Green PowerLEED Accredited Professional
Materials and Resources
Measurement and Verification
Innovation in Design: Specific TitleInnovation in Design: Specific TitleInnovation in Design: Specific TitleInnovation in Design: Specific Title
Total
Regional Priority: Specific CreditRegional Priority: Specific CreditRegional Priority: Specific CreditRegional Priority: Specific Credit

3. BREEAM Score Card

Table 3 - BREEAMBREEAM Credits
Pass Good Very Good Excellent Outstanding
Achieved? NO NO NO NO NO
Notes
Management
Man 1 Commissioning
One credit where evidence provided demonstrates that an appropriate project team member has been appointed to monitor commissioning on behalf of the client to ensure commissioning will be carried out in line with current best practice.
Two credits where, in addition to the above, evidence provided demonstrates that seasonal commissioning will be carried out during the first year of occupation, post construction (or post fit out).
2 1 1 1 1 2
Man 2 Considerate Constructors
One credit where evidence provided demonstrates that there is a commitment to comply with best practice site management principles.
Two credits where evidence provided demonstrates that there is a commitment to go beyond best practice site management principles.
2 - - - 1 2
Man 3 Construction Site Impacts
One credit where evidence provided demonstrates that 2 or more of items a-g (listed below) are achieved.
Two credits where evidence provided demonstrates that 4 or more of items a-g (listed below) are achieved.
Three credits where evidence provided demonstrates that 6 or more of items a-g are achieved:a. Monitor, report and set targets for CO2 or energy arising from site activitiesb. Monitor, report and set targets for CO2 or energy arising from transport to and from sitec. Monitor, report and set targets for water consumption arising from site activitiesd. Implement best practice policies in respect of air (dust) pollution arising from the sitee. Implement best practice policies in respect of water (ground and surface) pollution occurring on the sitef. Main contractor has an environmental materials policy, used for sourcing of construction materials to be utilised on siteg. Main contractor operates an Environmental Management System.
One additional credit where evidence provided demonstrates that at least 80% of site timber is responsibly sourced and 100% is legally sourced.
4 - - - - -
Man 4 Building user guideOne credit where evidence provided demonstrates the provision of a simple guide that covers information relevant to the tenant/occupants and non-technical building manager on the operation and environmental performance of the building.
1 - - - 1 1
Man 8 Security
One credit where evidence provided demonstrates that an Architectural Liaison Officer (ALO) or Crime Prevention Design Advisor (CPDA) from the local police force has been consulted at the design stage and their recommendations incorporated into the design of the building and its parking facilities (if relevant).
1 - - - - -
Indicative Mangement (weighted) Section Score 0.00%
Health & Wellbeing
Number of BREEAM credits
availableTitle Offices Criteria
Total predicted BREEAM credits
achievedRef
Minimum required credits by BREEAM issue and rating
BREEAM Rating Benchmarks
PASS ≥30%
GOOD ≥45%
Minimum BREEAM Standards
OUTSTANDING* ≥85%
Indicative Overall BREEAM Score
0.00%VERY GOOD ≥55%
EXCELLENT ≥70%
Copyright of BRE Global Ltd 5/24/2012

Table 3 - BREEAMBREEAM Credits
Hea 3 Glare Control One credit where evidence provided demonstrates that an occupant-controlled shading system (e.g. internal or external blinds) is fitted in relevant building areas. 1 - - - - -
Hea 4 High frequency lighting One credit where evidence provided demonstrates that high frequency ballasts are installed on all fluorescent and compact fluorescent lamps. 1 1 1 1 1 1
Hea 5 Internal and external lighting levels One credit where evidence provided demonstrates that all internal and external lighting, where relevant, is specified in accordance with the appropriate maintained illuminance levels (in lux) recommended by CIBSE.
1 - - - - -
Hea 6 Lighting zones & controls One credit where evidence provided demonstrates that, in all relevant building areas, lighting is appropriately zoned and occupant controllable. 1 - - - - -
Hea 7 Potential for natural ventilationOne credit where evidence provided demonstrates that fresh air is capable of being delivered to the occupied spaces of the building via a natural ventilation strategy, and there is sufficient user-control of the supply of fresh air.
1 - - - - -
Hea 8 Indoor air quality One credit where air intakes serving occupied areas avoid major sources of external pollution and recirculation of exhaust air. 1 - - - - -
Hea 9 Volatile Organic CompoundsOne credit where evidence provided demonstrates that the emissions of VOCs and other substances from key internal finishes and fittings comply with best practicelevels.
1 - - - - -
Hea 10 Thermal comfort
One credit where evidence provided demonstrates that thermal comfort levels in occupied spaces of the building are assessed at the design stage to evaluate appropriate servicing options, ensuring appropriate thermal comfort levels are achieved.
1 - - - - -
Hea 11 Thermal zoningOne credit where evidence provided demonstrates that local occupant control is available for temperature adjustment in each occupied space to reflect differing user demands.
1 - - - - -
Hea 12 Microbial contamination One credit where evidence provided demonstrates that the risk of waterborne and airborne legionella contamination has been minimised. 1 1 1 1 1 1
Hea 13 Acoustic Performance
One credit where evidence provided demonstrates that the building achieves appropriate indoor ambient noise levels in offices areas.
In addition, for fully fitted buildings only: Appropriate airborne sound insulation levels are achieved between acoustically sensitive spaces and occupied spaces, sufficient to ensure adequate privacy.
1 - - - - -
Indicative Health & Wellbeing (weighted) Section Score 0.00%
Hea 1 Daylighting
1
1One credit where evidence provided demonstrates that at least 80% of floor area in each occupied space is adequately daylit.
One credit where evidence provided demonstrates that all relevant building areas have an adequate view out.Hea 2 View Out -- - - -
-- - - -
Copyright of BRE Global Ltd 5/24/2012

Table 3 - BREEAMBREEAM Credits
Energy
Ene 1 Reduction of CO2 EmissionsUp to fifteen credits where evidence provided demonstrates an improvement in the energy efficiency of the building’s fabric and services and therefore achieves lower building operational related CO2 emissions.
15 - - - 6 10
Ene 2 Sub-metering of Substantial Energy Uses
One credit where evidence provided demonstrates the provision of direct sub-metering of energy uses within the building. 1 - - 1 1 1
Ene 3 Sub-metering of high energy load Areas and Tenancy
One credit where evidence provided demonstrates sub-metering of energy consumption by tenancy/building function area is installed within the building. 1 - - - - -
Ene 4 External Lighting One credit where energy-efficient external lighting is specified and all light fittings are controlled for the presence of daylight. 1 - - - - -
Ene 5 Low zero carbon technologies
One credit where evidence provided demonstrates that a feasibility study considering local (on-site and/or near site) low or zero carbon (LZC) technologies has been carried out and the results implemented.
Two credits where evidence provided demonstrates that the first credit has been achieved and there is a 10% reduction in the building’s CO2 emissions as a result of the installation of a feasible local LZC technology.
Three credits where evidence provided demonstrates that the first credit has been achieved and there is a 15% reduction in the building’s CO2 emissions as a result of the installation of a feasible local LZC technology.
Or alternatively:
A maximum of one credit where evidence provided demonstrates that a contract with an energy supplier is in place to provide sufficient electricity used within the assessed building/development to meet the above criteria from a 100% renewable energy source. (Note: a standard Green Tariff will not comply)
3 - - - 1 1
Ene 8 Lifts Up to two credits are available where evidence provided demonstrates the installation of energy-efficient lift(s). 2 - - - - -
Ene 9 Escalators & travelling walkways One credit where evidence provided demonstrates that escalators reduce unnecessary operation when there is no passenger demand. 1 - - - - -
Indicative Energy (weighted) Section Score 0.00%
Copyright of BRE Global Ltd 5/24/2012

Table 3 - BREEAMBREEAM Credits
Transport
Tra 1 Provision of public transport Up to three credits are awarded on a sliding scale based on the assessed buildings’accessibility to the public transport network. 3 - - - - -
Tra 2 Proximity to amenities One credit where evidence provided demonstrates that the building is located within 500m of accessible local amenities appropriate to the building type and its users. 1 - - - - -
Tra 3 Cyclist Facilities
One credit where evidence provided demonstrates that covered, secure and well-lit cycle storage facilities are provided for all building users.
Two credits where, in addition to the above, adequate changing facilities are provided for staff use.
2 - - - - -
Tra 4 Pedestrian and cycle safetyOne credit where evidence provided demonstrates that the site layout has been designed in accordance with best practice to ensure safe and adequate pedestrian and cycle access.
1 - - - - -
Tra 5 Travel plan One credit where evidence is provided to demonstrate that a travel plan has been developed and tailored to the specific needs of the building users. 1 - - - - -
Tra 6 Maximum car parking capacity
One credit where evidence provided demonstrates no more than one parking space is provided for every three building users.
Two credits where evidence provided demonstrates no more than one parking space is provided for every four building users.
2 - - - - -
Indicative Transport (weighted) Section Score 0.00%
Water
Wat 1 Water ConsumptionUp to three credits where evidence provided demonstrates that the specification includes taps, urinals, WCs and showers that consume less potable water in use than standard specifications for the same type of fittings.
3 - 1 1 1 2
Wat 2 Water meter One credit where evidence provided demonstrates that a water meter with a pulsed output will be installed on the mains supply to each building/unit. 1 - 1 1 1 1
Wat 3 Major leak detection One credit where evidence provided demonstrates that a leak detection system is specified or installed on the building's water supply. 1 - - - - -
Wat 4 Sanitary supply shut off One credit where evidence provided demonstrates that proximity detection shut-off isprovided to the water supply to all toilet areas. 1 - - - - -
Indicative Water (weighted) Section Score 0.00%
Materials
Copyright of BRE Global Ltd 5/24/2012
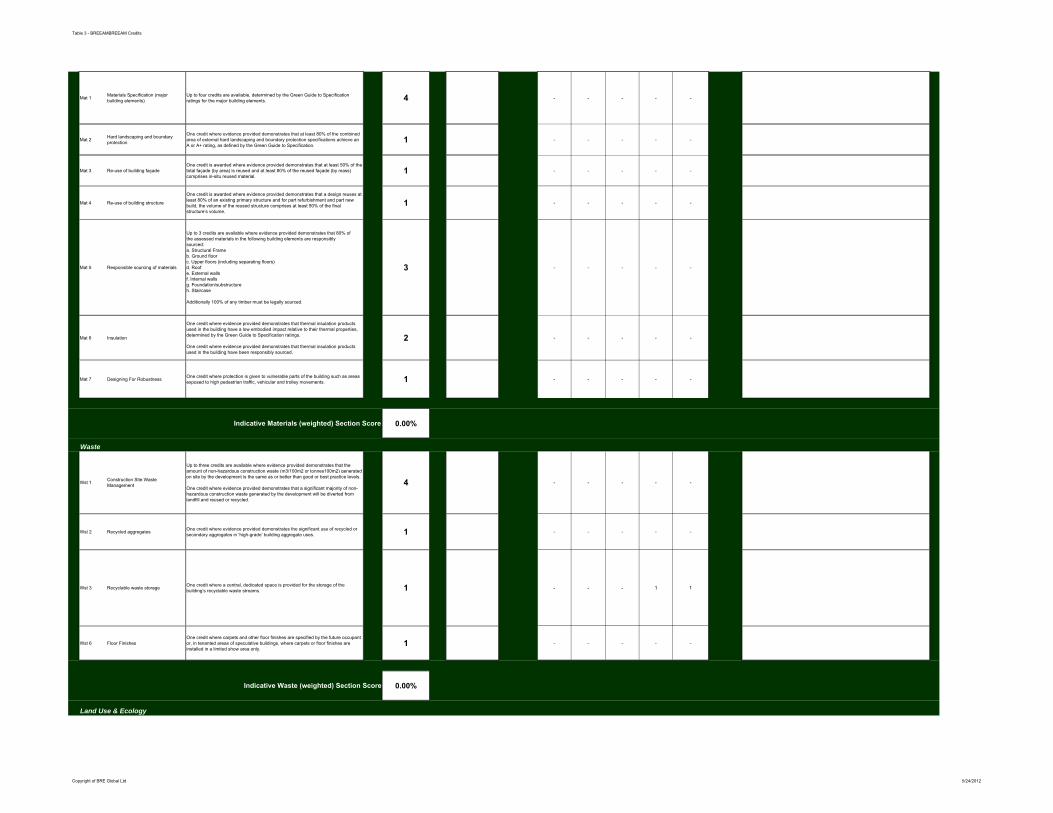
Table 3 - BREEAMBREEAM Credits
Mat 1 Materials Specification (major building elements)
Up to four credits are available, determined by the Green Guide to Specification ratings for the major building elements. 4 - - - - -
Mat 2 Hard landscaping and boundary protection
One credit where evidence provided demonstrates that at least 80% of the combined area of external hard landscaping and boundary protection specifications achieve an A or A+ rating, as defined by the Green Guide to Specification.
1 - - - - -
Mat 3 Re-use of building façadeOne credit is awarded where evidence provided demonstrates that at least 50% of the total façade (by area) is reused and at least 80% of the reused façade (by mass) comprises in-situ reused material.
1 - - - - -
Mat 4 Re-use of building structure
One credit is awarded where evidence provided demonstrates that a design reuses at least 80% of an existing primary structure and for part refurbishment and part new build, the volume of the reused structure comprises at least 50% of the final structure’s volume.
1 - - - - -
Mat 5 Responsible sourcing of materials
Up to 3 credits are available where evidence provided demonstrates that 80% ofthe assessed materials in the following building elements are responsiblysourced:a. Structural Frameb. Ground floorc. Upper floors (including separating floors)d. Roofe. External wallsf. Internal wallsg. Foundation/substructureh. Staircase
Additionally 100% of any timber must be legally sourced.
3 - - - - -
Mat 6 Insulation
One credit where evidence provided demonstrates that thermal insulation products used in the building have a low embodied impact relative to their thermal properties, determined by the Green Guide to Specification ratings.
One credit where evidence provided demonstrates that thermal insulation products used in the building have been responsibly sourced.
2 - - - - -
Mat 7 Designing For Robustness One credit where protection is given to vulnerable parts of the building such as areas exposed to high pedestrian traffic, vehicular and trolley movements. 1 - - - - -
Indicative Materials (weighted) Section Score 0.00%
Waste
Wst 1 Construction Site Waste Management
Up to three credits are available where evidence provided demonstrates that the amount of non-hazardous construction waste (m3/100m2 or tonnes100m2) generated on site by the development is the same as or better than good or best practice levels.
One credit where evidence provided demonstrates that a significant majority of non-hazardous construction waste generated by the development will be diverted from landfill and reused or recycled.
4 - - - - -
Wst 2 Recycled aggregates One credit where evidence provided demonstrates the significant use of recycled orsecondary aggregates in ‘high-grade’ building aggregate uses. 1 - - - - -
Wst 3 Recyclable waste storage One credit where a central, dedicated space is provided for the storage of the building’s recyclable waste streams. 1 - - - 1 1
Wst 6 Floor FinishesOne credit where carpets and other floor finishes are specified by the future occupant or, in tenanted areas of speculative buildings, where carpets or floor finishes are installed in a limited show area only.
1 - - - - -
Indicative Waste (weighted) Section Score 0.00%
Land Use & Ecology
Copyright of BRE Global Ltd 5/24/2012

Table 3 - BREEAMBREEAM Credits
LE1 Re-use of landOne credit where evidence provided demonstrates that the majority of the footprint ofthe proposed development falls within the boundary of previously developedland.
1 - - - - -
LE2 Contaminated land
One credit is awarded where evidence provided demonstrates that the land used for the new development has, prior to development, been defined as contaminated and where adequate remedial steps have been taken to decontaminate the site prior to construction.
1 - - - - -
LE3 Ecological value of site AND Protection of ecological features
One credit is awarded where evidence provided demonstrates that the construction zone is defined as land of low ecological value and all existing features of ecological value will be fully protected from damage during site preparation and construction works.
1 - - - - -
LE4 Mitigating Ecological impact
One credit where evidence provided demonstrates that the change in the site’s existingecological value, as a result of development, is minimal.
Two credits where evidence provided demonstrates that there is no negative change inthe site’s existing ecological value as a result of development.
2 - - 1 1 1
LE5 Enhancing Site Ecology
One credit where the design team (or client) has appointed a suitably qualified ecologist to advise and report on enhancing and protecting the ecological value of the site;and implemented the professional’s recommendations for general enhancementand protection of site ecology.
Two credits where, in addition to the above, there is a positive increase in the ecological value of the site of up to (but not including) 6 species.
Three credits where, in addition to the above, evidence is provided to demonstrate a positive increase in the ecological value of the site of 6 species or greater.
3 - - - - -
LE6 Long term impact on biodiversity
One credit where the client has committed to achieving the mandatory requirements listed below and at least two of the additional requirements.
Two credits where the client has committed to achieving the mandatory requirements listed below and at least four of the additional requirements.
2 - - - - -
Indicative Land Use & Ecology (weighted) Section Score 0.00%
Pollution
Pol 1 Refrigerant GWP - Building servicesOne credit where evidence provided demonstrates the use of refrigerants with a global warming potential (GWP) of less than 5 or where there are no refrigerants specified for use in building services.
1 - - - - -
Pol 2 Preventing refrigerant leaks
One credit where evidence provided demonstrates that refrigerant leaks can be detected or where there are no refrigerants specified for the development.
One credit where evidence provided demonstrates that the provision of automatic refrigerant pump down is made to a heat exchanger (or dedicated storage tanks) with isolation valves. Or where there are no refrigerants specified for the development.
2 - - - - -
Pol 4 NOx emissions from heating source
One credit where evidence provided demonstrates that the maximum dry NOx emissions from delivered space heating energy are ≤100 mg/kWh (at 0% excess O2).
Twp credits where evidence provided demonstrates that the maximum dry NOx emissions from delivered space heating energy are ≤70 mg/kWh (at 0% excess O2).
Three credits where evidence provided demonstrates that the maximum dry NOx emissions from delivered space heating energy are ≤40 mg/kWh (at 0% excess O2).
3 - - - - -
Copyright of BRE Global Ltd 5/24/2012

Table 3 - BREEAMBREEAM Credits
Pol 5 Flood risk
Two credits where evidence provided demonstrates that the assessed development is located in a zone defined as having a low annual probability of flooding.
One credit where evidence provided demonstrates that the assessed development is located in a zone defined as having a medium or high annual probability of flooding AND the ground level of the building, car parking and access is above the design flood level for the site’s location.
One further credit where evidence provided demonstrates that surface water run-off attenuation measures are specified to minimise the risk of localised flooding, resulting from a loss of flood storage on site due to development.
3 - - - - -
Pol 6 Minimising watercourse pollutionOne credit here evidence provided demonstrates that effective on site treatment such as Sustainable Drainage Systems (SUDs) or oil separators have been specified in areas that are or could be a source of watercourse pollution.
1 - - - - -
Pol 7 Reduction of Night Time Light Pollution
One credit where evidence provided demonstrates that the external lighting design is in compliance with the guidance in the Institution of Lighting Engineers (ILE) Guidance notes for the reduction of obtrusive light, 2005.
1 - - - - -
Pol 8 Noise AttenuationOne credit where evidence provided demonstrates that new sources of noise from the development do not give rise to the likelihood of complaints from existing noise-sensitive premises and amenity or wildlife areas that are within the locality of the site.
1 - - - - -
Indicative Pollution (weighted) Section Score 0.00%
Copyright of BRE Global Ltd 5/24/2012

Table 3 - BREEAMBREEAM Credits
Innovation - Exemplary Level Criteria
Innovation Man 2: Considerate Constructors
Where post construction, a Considerate Constructors Scheme certificate can be provided demonstrating that the site achieved CCS Code of Considerate Practice with a score of at least 36.
OR
Where post construction, the site has complied in full with the alternative, independently assessed scheme, and the alternative scheme addresses all the mandatory and optional items in Checklist A2.
1
Innovation Hea 1: DaylightingAt least 80% of the floor area (for the building spaces/room identified above in the standard requirements) has an average daylight factor of 3% in multi-storey buildings and 4% in single-storey buildings.
1
Innovation Ene 1: Reduction of CO2 emissions
One additional innovation credit can be awarded where evidence provided demonstrates the building is designed to be a carbon neutral building as defined by the NCM (i.e. in terms of building services energy demand), as follows:a. A new building achieves a CO2 index less than 0 on the benchmark scale.b. A refurbished building achieves a CO2 index equal to or less than 0 on thebenchmark scale.
Two additional innovation credits can be awarded where evidence provided demonstrates the building is designed to be a True zero carbon building (in terms of building services and operational energy demand).
2
Innovation Ene 5: Low or Zero Carbon Technologies
A local LZC energy technology has been installed in line with the recommendations of a compliant feasibility study and this method of supply results in a 20% reduction in the building’s CO2 emissions.
1
Innovation Wat 2: Water Meter
Where sub meters are fitted to allow individual water-consuming plant or building areas to be monitored such as cooling towers, car washes, catering areas, etc. If the building does not have any major water consuming plant this exemplar credit is not available.
Each sub meter has a pulsed output to enable connection to a Building Management System (BMS) for the monitoring of water consumption.
In addition to the above, for sites with multiple departments e.g. large health centres or acute hospitals, separate pulsed sub meters are fitted on the supply to the following areas where present:
a. Staff and public areasb. Clinical areas and wardsc. Letting areas: On the water supply to each tenant unitd. Laundriese. Main production kitchenf. Hydrotherapy poolsg. Laboratoriesh. CSSD/HSDU, pathology, pharmacy, mortuary and any other major process water user.
1
Copyright of BRE Global Ltd 5/24/2012

Table 3 - BREEAMBREEAM Credits
Innovation Materials Specification
One exemplary BREEAM credit can be awarded as follows:
a. Where assessing four or more applicable building elements, the building achieves at least two points additional to the total points required to achieve maximum credits under the standard BREEAM requirements.
b. Where assessing fewer than four applicable building elements, the buildingachieves at least one point additional to the total points required to achievemaximum credits under the standard BREEAM requirements.
1
Innovation Responsible Sourcing of MaterialsWhere, in addition to the standard BREEAM requirements, 95% of the applicable materials, comprised within the applicable building elements, have been responsibly sourced.
1
Innovation Wst 1 Construction Site Waste Management
Where non-hazardous construction waste generated by the building’s development meets or exceeds the resource efficiency benchmark required to achieve three credits (as outlined in the guidance).
Where at least 90% by weight (80% by volume) of non-hazardous construction waste and 95% of demolition waste by weight (85% by volume) (if applicable) generated by the buildhas been diverted from landfill and either:a. Reused on site (in-situ or for new applications)b. Reused on other sitesc. Salvaged/reclaimed for reused. Returned to the supplier via a ‘take-back’ schemee. Recovered from site by an approved waste management contractor and recycled.
Where all key waste groups are identified for diversion from landfill at pre-construction stage SWMP.
1
Innovation - BREEAM Accredited Professional
Innovation BREEAM Accredited Professional Up to two credits are available for the comprehensive use of a BREEAM Accredited Professional (AP) throughout project work stages. 2
Indicative Innovation (weighted) Section Score 0.00%
Copyright of BRE Global Ltd 5/24/2012

2A
APPENDIX 2
Water Calculations
1. Pearl Rating System (PRS) Water Calculator
2. LEED Water Calculator
3. BREEAM Water Calculator
4. PRS Water Case study – Phase 1
5. PRS Water Case study – Phase 2
6. PRS Water Case study – Phase 3
7. LEED Water Case study – Phase 1
8. LEED Water Case study – Phase 2
9. BREEAM Water Case study – Phase 1
10. BREEAM Water Case study – Phase 2
11. BREEAM Water Case study – Phase 3

3A
APPENDIX 3
Energy Simulation Results
1. Actual Energy Assessment Results
2. LEED Assessment Baseline Results
3. BREEAM Assessment Baseline results

1. Actual Energy Assessment Results

<Virtual Environment> 6.4.0.8 Copyright © 2011 Integrated Environmental Solutions Limited.
Project File: actual.mit Sim File: actual.aps 14/Mar/2012Weather File: AbuDhabiIWEC.fwt
Total electricity (misc.) (MWh)
actual.aps
Date
Jan 01-31 49.7227
Feb 01-28 49.1492
Mar 01-31 63.6741
Apr 01-30 71.8070
May 01-31 88.5238
Jun 01-30 96.5783
Jul 01-31 109.1167
Aug 01-31 108.3530
Sep 01-30 102.0545
Oct 01-31 85.7700
Nov 01-30 70.2967
Dec 01-31 56.0458
Summed total 951.0918
Page 1 of 1Results Grid
5/24/2012file://C:\Documents and Settings\ahmedmosa\Desktop\FINAL - Hard Cover\For Print\0.A...

<Virtual Environment> 6.4.0.8 Copyright © 2011 Integrated Environmental Solutions Limited.
Project File: actual.mit Sim File: actual.aps 14/Mar/2012Weather File: AbuDhabiIWEC.fwt
Total CE (kgC)
actual.aps
Date
Jan 01-31 10849
Feb 01-28 10723
Mar 01-31 13893
Apr 01-30 15667
May 01-31 19314
Jun 01-30 21072
Jul 01-31 23807
Aug 01-31 23641
Sep 01-30 22266
Oct 01-31 18713
Nov 01-30 15337
Dec 01-31 12228
Summed total 207511
Page 1 of 1Results Grid
5/24/2012file://C:\Documents and Settings\ahmedmosa\Desktop\FINAL - Hard Cover\For Print\0.A...

Total electricity (misc.) (MWh)
Date
Jan 01-31 49.8757
Feb 01-28 47.6847
Mar 01-31 58.2871
Apr 01-30 63.7669
May 01-31 77.9692
Jun 01-30 84.017
Jul 01-31 95.1918
Aug 01-31 94.6724
Sep 01-30 88.3825
Oct 01-31 75.5352
Nov 01-30 62.1136
Dec 01-31 53.4443 Cost $
Summed total 951 AED 142,650.00

2. LEED Assessment Baseline Results

Orientation 0 Orientation 90 Orientation 180 Orientation 270 AverageTotal energy (MWh) Total energy (MWh) Total energy (MWh) Total energy (MWh) Total energy (MWh)
DateJan 01-31 45.3948 45.1541 45.3948 45.1541 45.27445Feb 01-28 43.9855 43.9557 43.9855 43.9557 43.9706Mar 01-31 52.9095 53.1411 52.9095 53.1411 53.0253Apr 01-30 57.033 57.226 57.033 57.226 57.1295May 01-31 61.3767 61.3884 61.3767 61.3884 61.38255Jun 01-30 59.6639 59.6639 59.6639 59.6639 59.6639Jul 01-31 61.8604 61.8604 61.8604 61.8604 61.8604Aug 01-31 61.9063 61.9063 61.9063 61.9063 61.9063Sep 01-30 59.6283 59.6283 59.6283 59.6283 59.6283Oct 01-31 60.9651 60.9681 60.9651 60.9681 60.9666Nov 01-30 55.7277 55.6953 55.7277 55.6953 55.7115Dec 01-31 49.0163 48.7444 49.0163 48.7444 48.88035 Cost $Summed total 669.4675 669.3319 669.4675 669.3319 669.3997 AED 100,409.96

3. BREEAM Assessment Baseline results

<Virtual Environment> 6.4.0.8 Copyright © 2011 Integrated Environmental Solutions Limited.
Project File: actual.mit Sim File: actual.aps 14/Mar/2012Weather File: AbuDhabiIWEC.fwt
Total CE (kgC)
actual.aps
Date
Jan 01-31 4372
Feb 01-28 4172
Mar 01-31 5117
Apr 01-30 5567
May 01-31 6547
Jun 01-30 6947
Jul 01-31 7736
Aug 01-31 7648
Sep 01-30 7280
Oct 01-31 6414
Nov 01-30 5436
Dec 01-31 4730
Summed total 71967
Page 1 of 1Results Grid
5/24/2012file://C:\Documents and Settings\ahmedmosa\Desktop\FINAL - Hard Cover\For Print\0.A...

4A
APPENDIX 4
Energy Model Validation with HAP 1. HAP Results 2. IES Results

1. HAP Results

Annual Cost Summary 1xx 03/13/2012 Hannover Consulting Engineers 02:16PM
Hourly Analysis Program v4.51 Page 1 of 6
Table 1. Annual Costs
Component [B000] Shop 2
(DHS) [B090] Shop 2
(DHS)[B180] Shop 2
(DHS)[B270] Shop 2
(DHS) Shop 2
(DHS)
Air System Fans 0 0 0 0 0
Cooling 1,642 1,626 1,765 1,786 1,699
Heating 0 0 0 0 0
Pumps 0 0 0 0 0
Cooling Tower Fans 0 0 0 0 0
HVAC Sub-Total 1,642 1,626 1,765 1,786 1,699
Lights 226 226 226 226 418
Electric Equipment 2,578 2,578 2,578 2,578 2,578
Misc. Electric 321 321 321 321 321
Misc. Fuel Use 0 0 0 0 0
Non-HVAC Sub-Total 3,124 3,124 3,124 3,124 3,317
Grand Total 4,766 4,749 4,889 4,909 5,016
Table 2. Annual Cost per Unit Floor Area
Component [B000] Shop 2
(DHS/ft²) [B090] Shop 2
(DHS/ft²)[B180] Shop 2
(DHS/ft²)[B270] Shop 2
(DHS/ft²) Shop 2
(DHS/ft²)
Air System Fans 0.000 0.000 0.000 0.000 0.000
Cooling 3.655 3.618 3.929 3.975 3.782
Heating 0.000 0.000 0.000 0.000 0.000
Pumps 0.000 0.000 0.000 0.000 0.000
Cooling Tower Fans 0.000 0.000 0.000 0.000 0.000
HVAC Sub-Total 3.655 3.618 3.929 3.975 3.782
Lights 0.502 0.502 0.502 0.502 0.931
Electric Equipment 5.737 5.737 5.737 5.737 5.737
Misc. Electric 0.714 0.714 0.714 0.714 0.714
Misc. Fuel Use 0.000 0.000 0.000 0.000 0.000
Non-HVAC Sub-Total 6.953 6.953 6.953 6.953 7.382
Grand Total 10.608 10.570 10.881 10.927 11.164
Gross Floor Area (ft²) 449.3 449.3 449.3 449.3 449.3
Conditioned Floor Area (ft²) 449.3 449.3 449.3 449.3 449.3
Note: Values in this table are calculated using the Gross Floor Area. Table 3. Component Cost as a Percentage of Total Cost
Component [B000] Shop 2
( % ) [B090] Shop 2
( % )[B180] Shop 2
( % )[B270] Shop 2
( % ) Shop 2
( % )
Air System Fans 0.0 0.0 0.0 0.0 0.0
Cooling 34.5 34.2 36.1 36.4 33.9
Heating 0.0 0.0 0.0 0.0 0.0
Pumps 0.0 0.0 0.0 0.0 0.0
Cooling Tower Fans 0.0 0.0 0.0 0.0 0.0
HVAC Sub-Total 34.5 34.2 36.1 36.4 33.9
Lights 4.7 4.7 4.6 4.6 8.3
Electric Equipment 54.1 54.3 52.7 52.5 51.4
Misc. Electric 6.7 6.8 6.6 6.5 6.4
Misc. Fuel Use 0.0 0.0 0.0 0.0 0.0
Non-HVAC Sub-Total 65.5 65.8 63.9 63.6 66.1
Grand Total 100.0 100.0 100.0 100.0 100.0

Annual Energy and Emissions Summary 1xx 03/13/2012 Hannover Consulting Engineers 02:16PM
Hourly Analysis Program v4.51 Page 2 of 6
Table 1. Annual Costs
Component [B000] Shop 2
(DHS) [B090] Shop 2
(DHS)[B180] Shop 2
(DHS)[B270] Shop 2
(DHS) Shop 2
(DHS)
HVAC Components
Electric 1,642 1,626 1,765 1,786 1,699
Natural Gas 0 0 0 0 0
Fuel Oil 0 0 0 0 0
Propane 0 0 0 0 0
Remote HW 0 0 0 0 0
Remote Steam 0 0 0 0 0
Remote CW 0 0 0 0 0
HVAC Sub-Total 1,642 1,626 1,765 1,786 1,699
Non-HVAC Components
Electric 3,124 3,124 3,124 3,124 3,317
Natural Gas 0 0 0 0 0
Fuel Oil 0 0 0 0 0
Propane 0 0 0 0 0
Remote HW 0 0 0 0 0
Remote Steam 0 0 0 0 0
Non-HVAC Sub-Total 3,124 3,124 3,124 3,124 3,317
Grand Total 4,766 4,749 4,889 4,909 5,016
Table 2. Annual Energy Consumption
Component [B000] Shop 2 [B090] Shop 2 [B180] Shop 2 [B270] Shop 2 Shop 2
HVAC Components
Electric (kWh) 10,948 10,837 11,767 11,905 11,329
Natural Gas (na) 0 0 0 0 0
Fuel Oil (na) 0 0 0 0 0
Propane (na) 0 0 0 0 0
Remote HW (na) 0 0 0 0 0
Remote Steam (na) 0 0 0 0 0
Remote CW (na) 0 0 0 0 0
Non-HVAC Components
Electric (kWh) 20,825 20,825 20,825 20,825 22,110
Natural Gas (na) 0 0 0 0 0
Fuel Oil (na) 0 0 0 0 0
Propane (na) 0 0 0 0 0
Remote HW (na) 0 0 0 0 0
Remote Steam (na) 0 0 0 0 0
Totals
Electric (kWh) 31,773 31,662 32,592 32,730 33,439
Natural Gas (na) 0 0 0 0 0
Fuel Oil (na) 0 0 0 0 0
Propane (na) 0 0 0 0 0
Remote HW (na) 0 0 0 0 0
Remote Steam (na) 0 0 0 0 0
Remote CW (na) 0 0 0 0 0

Annual Energy and Emissions Summary 1xx 03/13/2012 Hannover Consulting Engineers 02:16PM
Hourly Analysis Program v4.51 Page 3 of 6
Table 3. Annual Emissions
Component [B000] Shop 2 [B090] Shop 2 [B180] Shop 2 [B270] Shop 2 Shop 2
CO2 Equivalent (lb) 0 0 0 0 0
Table 4. Annual Cost per Unit Floor Area
Component [B000] Shop 2
(DHS/ft²) [B090] Shop 2
(DHS/ft²)[B180] Shop 2
(DHS/ft²)[B270] Shop 2
(DHS/ft²) Shop 2
(DHS/ft²)
HVAC Components
Electric 3.655 3.618 3.929 3.975 3.782
Natural Gas 0.000 0.000 0.000 0.000 0.000
Fuel Oil 0.000 0.000 0.000 0.000 0.000
Propane 0.000 0.000 0.000 0.000 0.000
Remote HW 0.000 0.000 0.000 0.000 0.000
Remote Steam 0.000 0.000 0.000 0.000 0.000
Remote CW 0.000 0.000 0.000 0.000 0.000
HVAC Sub-Total 3.655 3.618 3.929 3.975 3.782
Non-HVAC Components
Electric 6.953 6.953 6.953 6.953 7.382
Natural Gas 0.000 0.000 0.000 0.000 0.000
Fuel Oil 0.000 0.000 0.000 0.000 0.000
Propane 0.000 0.000 0.000 0.000 0.000
Remote HW 0.000 0.000 0.000 0.000 0.000
Remote Steam 0.000 0.000 0.000 0.000 0.000
Non-HVAC Sub-Total 6.953 6.953 6.953 6.953 7.382
Grand Total 10.608 10.570 10.881 10.927 11.164
Gross Floor Area (ft²) 449.3 449.3 449.3 449.3 449.3
Conditioned Floor Area (ft²) 449.3 449.3 449.3 449.3 449.3
Note: Values in this table are calculated using the Gross Floor Area. Table 5. Component Cost as a Percentage of Total Cost
Component [B000] Shop 2
( % ) [B090] Shop 2
( % )[B180] Shop 2
( % )[B270] Shop 2
( % ) Shop 2
( % )
HVAC Components
Electric 34.5 34.2 36.1 36.4 33.9
Natural Gas 0.0 0.0 0.0 0.0 0.0
Fuel Oil 0.0 0.0 0.0 0.0 0.0
Propane 0.0 0.0 0.0 0.0 0.0
Remote HW 0.0 0.0 0.0 0.0 0.0
Remote Steam 0.0 0.0 0.0 0.0 0.0
Remote CW 0.0 0.0 0.0 0.0 0.0
HVAC Sub-Total 34.5 34.2 36.1 36.4 33.9
Non-HVAC Components
Electric 65.5 65.8 63.9 63.6 66.1
Natural Gas 0.0 0.0 0.0 0.0 0.0
Fuel Oil 0.0 0.0 0.0 0.0 0.0
Propane 0.0 0.0 0.0 0.0 0.0
Remote HW 0.0 0.0 0.0 0.0 0.0
Remote Steam 0.0 0.0 0.0 0.0 0.0
Non-HVAC Sub-Total 65.5 65.8 63.9 63.6 66.1
Grand Total 100.0 100.0 100.0 100.0 100.0
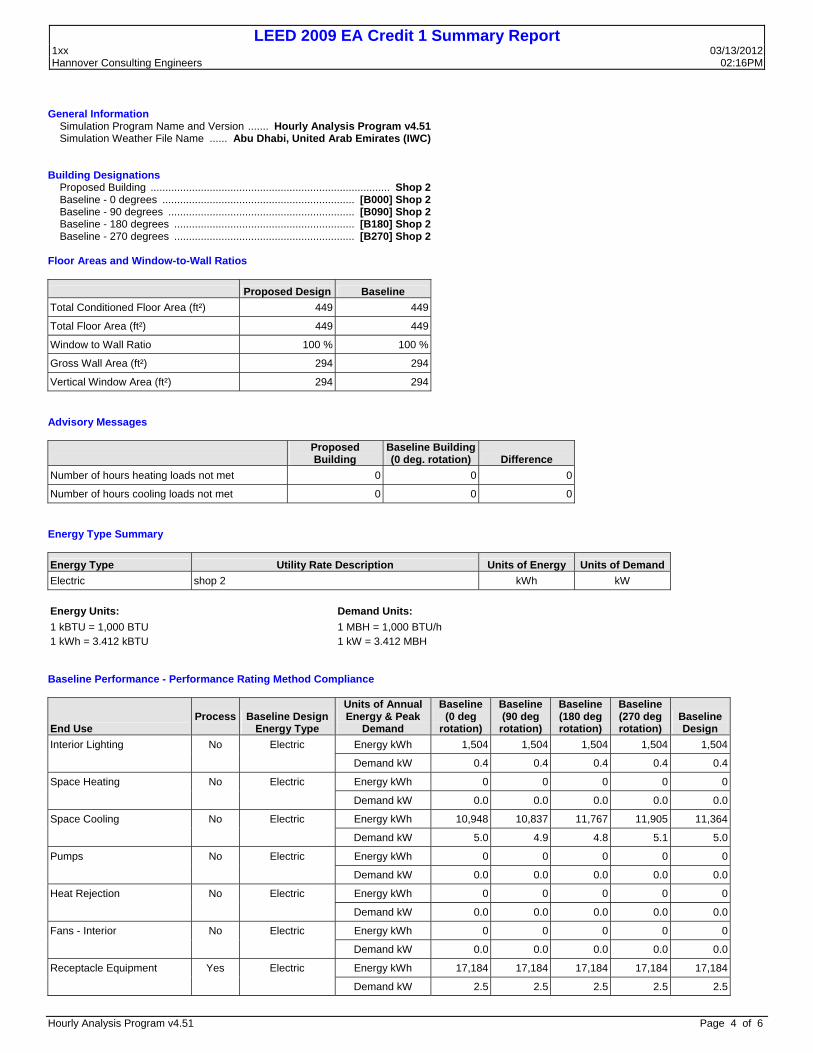
LEED 2009 EA Credit 1 Summary Report 1xx 03/13/2012 Hannover Consulting Engineers 02:16PM
Hourly Analysis Program v4.51 Page 4 of 6
General Information Simulation Program Name and Version ....... Hourly Analysis Program v4.51 Simulation Weather File Name ...... Abu Dhabi, United Arab Emirates (IWC) Building Designations Proposed Building ................................................................................. Shop 2 Baseline - 0 degrees ................................................................. [B000] Shop 2 Baseline - 90 degrees ............................................................... [B090] Shop 2 Baseline - 180 degrees ............................................................. [B180] Shop 2 Baseline - 270 degrees ............................................................. [B270] Shop 2 Floor Areas and Window-to-Wall Ratios
Proposed Design Baseline
Total Conditioned Floor Area (ft²) 449 449
Total Floor Area (ft²) 449 449
Window to Wall Ratio 100 % 100 %
Gross Wall Area (ft²) 294 294
Vertical Window Area (ft²) 294 294
Advisory Messages
Proposed Building
Baseline Building (0 deg. rotation) Difference
Number of hours heating loads not met 0 0 0
Number of hours cooling loads not met 0 0 0
Energy Type Summary
Energy Type Utility Rate Description Units of Energy Units of Demand
Electric shop 2 kWh kW
Energy Units: Demand Units:
1 kBTU = 1,000 BTU 1 MBH = 1,000 BTU/h 1 kWh = 3.412 kBTU 1 kW = 3.412 MBH Baseline Performance - Performance Rating Method Compliance
End Use Process
Baseline Design
Energy Type
Units of Annual Energy & Peak
Demand
Baseline (0 deg
rotation)
Baseline (90 deg
rotation)
Baseline (180 deg rotation)
Baseline (270 deg rotation)
Baseline Design
Interior Lighting No Electric Energy kWh 1,504 1,504 1,504 1,504 1,504
Demand kW 0.4 0.4 0.4 0.4 0.4
Space Heating No Electric Energy kWh 0 0 0 0 0
Demand kW 0.0 0.0 0.0 0.0 0.0
Space Cooling No Electric Energy kWh 10,948 10,837 11,767 11,905 11,364
Demand kW 5.0 4.9 4.8 5.1 5.0
Pumps No Electric Energy kWh 0 0 0 0 0
Demand kW 0.0 0.0 0.0 0.0 0.0
Heat Rejection No Electric Energy kWh 0 0 0 0 0
Demand kW 0.0 0.0 0.0 0.0 0.0
Fans - Interior No Electric Energy kWh 0 0 0 0 0
Demand kW 0.0 0.0 0.0 0.0 0.0
Receptacle Equipment Yes Electric Energy kWh 17,184 17,184 17,184 17,184 17,184
Demand kW 2.5 2.5 2.5 2.5 2.5

LEED 2009 EA Credit 1 Summary Report 1xx 03/13/2012 Hannover Consulting Engineers 02:16PM
Hourly Analysis Program v4.51 Page 5 of 6
Electrical instruments Yes Electric Energy kWh 2,137 2,137 2,137 2,137 2,137
Demand kW 0.4 0.4 0.4 0.4 0.4
Baseline Energy Totals Total Annual Energy Use kBTU 108,411 108,030 111,206 111,675 109,830
Annual Process Energy kBTU 65,925
Process Energy Modeling Compliance Y
(1) This form determines compliance using cost calculations from Section 1.9. Process Energy Costs should be modeled to accurately reflect the proposed building. Process Energy must be the same in the baseline and proposed cases, unless an exceptional calculation is used. Process energy costs must be at least 25% of the total baseline energy costs. Any exceptions must be supported by a narrative and/or other supporting doucmentation. (2) In this project Process Energy is 60% of total baseline energy cost. Baseline Energy Costs
Energy Type Baseline Cost
(0 deg rotation) (DHS)
Baseline Cost(90 deg rotation)
(DHS)
Baseline Cost(180 deg rotation)
(DHS)
Baseline Cost (270 deg rotation)
(DHS)
Baseline Building Performance
(DHS)
Electric 4,766 4,749 4,889 4,909 4,828
Total Baseline Costs 4,766 4,749 4,889 4,909 4,828
Performance Rating Table - Performance Rating Method Compliance
End Use Process ?
Baseline Building Units
Baseline Building Results
Proposed Design
Energy TypeProposed Design
Units
Proposed Building Results
Percent Savings
Interior Lighting No Energy kWh 1,504 Electric Energy kWh 2,789 -85 %
Demand kW 0.4 Demand kW 0.7 -85 %
Space Heating No Energy kWh 0 Electric Energy kWh 0 n/a
Demand kW 0.0 Demand kW 0.0 n/a
Space Cooling No Energy kWh 11,364 Electric Energy kWh 11,329 0 %
Demand kW 5.0 Demand kW 5.1 -4 %
Pumps No Energy kWh 0 Electric Energy kWh 0 n/a
Demand kW 0.0 Demand kW 0.0 n/a
Heat Rejection No Energy kWh 0 Electric Energy kWh 0 n/a
Demand kW 0.0 Demand kW 0.0 n/a
Fans - Interior No Energy kWh 0 Electric Energy kWh 0 n/a
Demand kW 0.0 Demand kW 0.0 n/a
Receptacle Equipment Yes Energy kWh 17,184 Electric Energy kWh 17,184 0 %
Demand kW 2.5 Demand kW 2.5 0 %
Electrical instruments Yes Energy kWh 2,137 Electric Energy kWh 2,137 0 %
Demand kW 0.4 Demand kW 0.4 0 %
Energy Totals Baseline Total Energy Use
(kBTU) 109,830
Proposed Total Energy Use (kBTU)
114,094 -4 %
Baseline Annual Process
Energy (kBTU) 65,925
Proposed Annual Process Energy (kBTU)
65,925 0 %

LEED 2009 EA Credit 1 Summary Report 1xx 03/13/2012 Hannover Consulting Engineers 02:16PM
Hourly Analysis Program v4.51 Page 6 of 6
Energy Cost and Consumption by Energy Type - Performance Rating Method Compliance
Proposed Design Baseline Design
Energy Type Energy Use Cost (DHS) Energy Use Cost (DHS)
Electric 33,439 kWh 5,016 32,189 kWh 4,828
Subtotal (Model Outputs) 114,094 kBTU 5,016 109,830 kBTU 4,828
Energy
Generated
Renewable Energy Cost
Savings (DHS)
Total On Site Renewable Energy
Energy Savings Cost Savings
(DHS)
Exceptional Calculation Totals
Energy Use Cost (DHS)
Net Proposed Design Total 114,094 kBTU 5,016
Percent Savings Energy Use Intensity
Energy Cost Proposed Design
(kBTU/ft²) Baseline Design
(kBTU/ft²)
Summary Data -3.9 % -3.9 % 253.94 244.45
LEED 2009 EA Credit 1 Points Reference Table
New Construction % Cost Savings
Existing Building Renovations
% Cost Savings
LEED 2009 Points Awarded
12% 8% 1 pt
14% 10% 2 pt
16% 12% 3 pts
18% 14% 4 pts
20% 16% 5 pts
22% 18% 6 pts
24% 20% 7 pts
26% 22% 8 pts
28% 24% 9 pts
30% 26% 10 pts
32% 28% 11 pts
34% 30% 12 pts
36% 32% 13 pts
38% 34% 14 pts
40% 36% 15 pts
42% 38% 16 pts
44% 40% 17 pts
46% 42% 18 pts
48% 44% 19 pts

2. IES Results

<Virtual Environment> 6.4.0.8 Copyright © 2011 Integrated Environmental Solutions Limited.
Project File: Validation.mit Sim File: validation.aps 14/Mar/2012Weather File: AbuDhabiIWEC.fwt
Total electricity (MWh)
validation.aps
Date
Jan 01-31 1.4275
Feb 01-28 1.4795
Mar 01-31 2.0774
Apr 01-30 2.4185
May 01-31 3.0995
Jun 01-30 3.6394
Jul 01-31 4.3501
Aug 01-31 4.3323
Sep 01-30 3.9761
Oct 01-31 2.9868
Nov 01-30 2.3684
Dec 01-31 1.7098
Summed total 33.8654
Page 1 of 1Results Grid
5/24/2012file://C:\Documents and Settings\ahmedmosa\Desktop\FINAL - Hard Cover\For Print\0.A...


![BREEAM en VERLICHTING - IBE-BIV · BREEAM Building Research Establishment Environmental Assessment Method, first published by the Building Research Establishment (BRE) in 1990,[1]](https://static.fdocuments.in/doc/165x107/5f0f3f347e708231d4433683/breeam-en-verlichting-ibe-breeam-building-research-establishment-environmental.jpg)