Comparative study between serum cystatin c and creatinine ...
71
COMPARATIVE STUDY BETWEEN SERUM CYSTATIN C AND CREATININE LEVELS IN CHRONIC KIDNEY DISEASE PATIENTS AND BLOOD DONORS Dr. Mwaludindi Dixon Mchana, MB, Ch.B (UoN) i
Transcript of Comparative study between serum cystatin c and creatinine ...
COMPARATIVE STUDY BETWEEN SERUM CYSTATIN C AND CREATININE LEVELS IN CHRONIC
KIDNEY DISEASE PATIENTS AND BLOOD DONORS
Dr. Mwaludindi Dixon Mchana,
MB, Ch.B (UoN)
i

A dissertation submitted to the University of Nairobi in part fulfillment of the requirements for
the degree of Master of Medicine in Human Pathology.
ii

SUPERVISED BY:
Prof. Christine S. Kigondu
Associate Professor, Thematic Area of Clinical Chemistry.
Department of Human Pathology, University of Nairobi.
Dr. Anthony J.O. Were
Consultant Nephrologist,
Senior Lecturer Department of Clinical Medicine & Therapeutics, University of Nairobi.
Chairman Division of Medicine, Kenyatta National Hospital.
Dr. Julius Kuria MB, Ch.B, MMed Path (UoN).
Consultant Pathologist, Lecturer Thematic Area of Clinical Chemistry,
Department of Human Pathology ‐ University of Nairobi.
Dr. Marybeth C. Maritim MB, Ch.B, MMed(UoN)
Consultant Physician and Lecturer
Department of Clinical Medicine & Therapeutics, University of Nairobi.
iii

DECLARATION
Student Declaration
I, Mwaludindi Dixon Mchana, declare that this dissertation for Master of Medicine in Human
Pathology is my original work and has not, to the best of my knowledge, been presented by any
other individual at any other institution of higher learning.
Signed: ………………………………………………………..
Date : ……………………………………………..............
iv

SUPERVISOR DECLARATION
This dissertation for the Master of Medicine in Human Pathology is submitted with our approval
1. Prof. Christine S. Kigondu
Signed: …………………………………………………………..
Date : …………………………………………………………..
2. Dr. Anthony J.O. Were
Signed : …………………………………………………………
Date : ….………………………………………………………….
3. Dr. Julius Kuria
Signed: ……………………………………………………………..
Date : …………………………………………………………….
4. Dr. Marybeth C. Maritim
Signed: ………………………………………………………………
Date : .. ……………………………………………………………
v

DEDICATION
This work is dedicated to my family and true friends
vi

APPRECIATION
I humbly express my sincere gratitude to all those who either directly or indirectly
contributed to the successful completion of this dissertation.
I thank my supervisors: Prof. Christine Kigondu, Dr. A.J.O. Were, Dr. Julius Kuria and Dr.
Marybeth C. Maritim. It is through their unreserved guidance and professionalism that
this dissertation reached fruitful conclusion.
Special thanks to Dr. Angela Amayo for her selfless contribution in the entire study
period.
Additionally, I thank all the members of the academic staff in the department of Human
Pathology whose immense contribution cannot be overemphasized.
I also thank the Director of the NBTS and NBTC – Nairobi whose approval and assistance
shall forever be appreciated.
I am indebted to the staff at the Renal Clinic‐ KNH and their willingness to assist during
the recruitment period.
I thank Dr. Odera – HoD, Laboratory Services (KNH) and the able staff at the Main
Laboratory under the guidance of Mr. Njagi.
To Alex my study assistant, I say thank you.
Lastly, I acknowledge the encouragement and support from my fellow students in the
department.
vii

LIST OF ABBREVIATIONS
ACE Angiotensin‐Converting Enzyme
BMI Body Mass Index
BTU Blood Transfusion Unit
CG Cockroft‐Gault formula
CKD Chronic Kidney Disease
CRF Chronic Renal Failure
Cr‐EDTA Chromium‐labeled EDTA
Cys C Cystatin C
CV’s Coefficient of Variance
99mTc‐DTPA Technecium‐labelled diethylene‐triamine‐pentacetate
eGFR Estimated Glomerular Filtration Rate (eGFR)
EPO Erythropoietin
ESRD End‐Stage Renal Disease
HAART Highly‐active antiretroviral therapy
HbA1c Hemoglobin A1c
HCV Hepatitis C Virus
HIV Human Immunodeficiency Virus
HIVAN HIV‐associated nephropathy
IFCC International Federation of Clinical Chemists
IQC Internal Quality Control
KDIGO Kidney Disease Improving Global Outcome
KNBTS Kenya National Blood Transfusion Service
viii

KNH Kenyatta National Hospital
MDRD Modification of Diet in Renal Disease
NBTC National Blood Transfusion Centre
NBTS National Blood Transfusion Services
SCr Serum Creatinine
SCr LN Serum creatinine natural logarithm
SLE Systemic Lupus Erythematosus
TGs Triglycerides
USA United States of America
VDRL Venereal Diseases Research Laboratories
ix
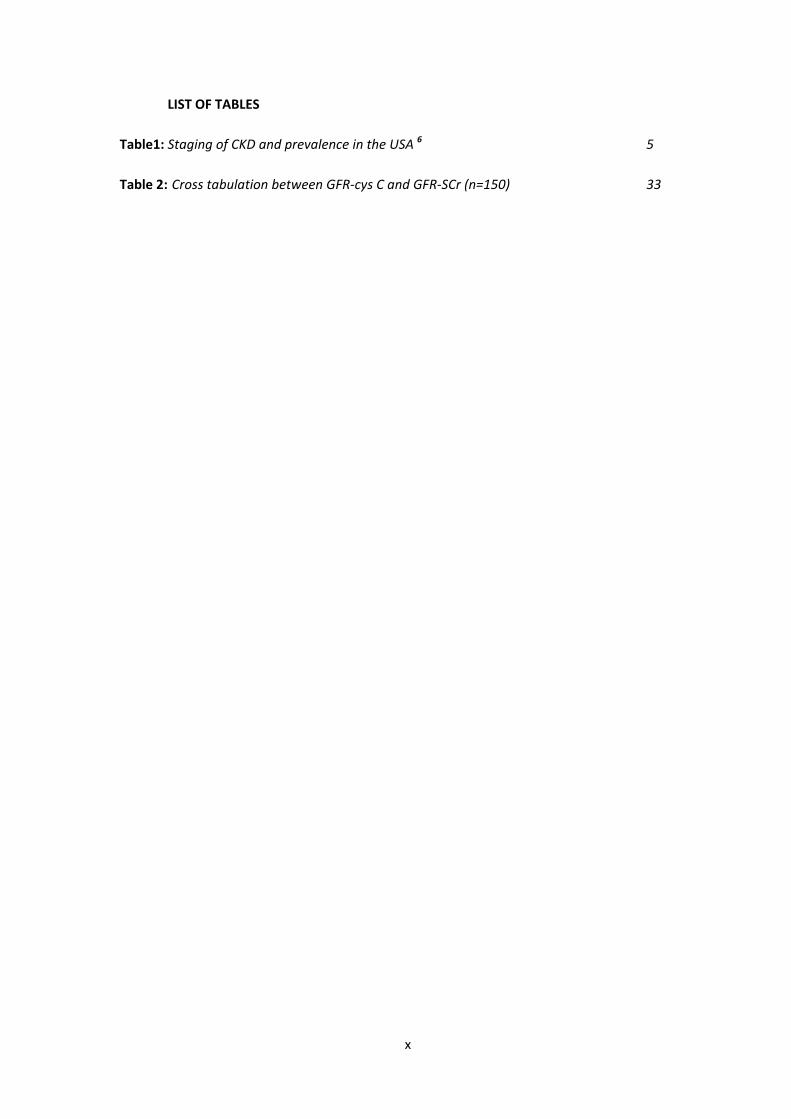
LIST OF TABLES
Table1: Staging of CKD and prevalence in the USA 6 5
Table 2: Cross tabulation between GFR‐cys C and GFR‐SCr (n=150) 33
x

LIST OF FIGURES
Figure 1: Age‐Gender distribution of blood donors (n = 124) 18
Figure 2: Serum cystatin C levels in blood donors (n = 120) 19
Figure 3: eGFR‐cystatin C in blood donors (n = 122) 20
Figure 4: Distribution of the Natural Log SCr (n=124) 21
Figure 5: Distribution Natural Log for eGFR‐SCr for blood donors (n=124) 22
Figure 6: Correlation between Serum Cystatin C and creatinine for blood donors
(n = 124) 23
Figure 7: Correlation between cystatin C and eGFRcys C for blood donors (n=124) 24
Figure 8: Correlation between Serum creatinine and eGFRSCr in blood donors(n=124) 25
Figure 9: Correlation between eGFR‐cys C and eGFR‐scr for blood donor (n=124) 26
Figure 10: Graph showing the age‐gender distribution of CKD patients (n=124) 28
Figure 11: Graph showing monodiagnoses in CKD patients (n=150) 29
Figure 12: Graph showing co‐morbidities in CKD patients (n=150) 30
Figure 13: Graph showing staging of CKD patients using the two markers (n=150) 30
Figure 14: Correlation between cystatin C and eGFRcys C for CKD patients (n=150) 31
Figure 15: Correlation between eGFR‐cys C and eGFR‐scr for CKD patients (n=150) 31
Figure 16: Graph showing staging of CKD patients using the two markers (n=150) 32
xi

LIST OF APPENDICES
Appendix I: Screening Proforma Renal Patients 43
Appendix II: Study Questionnaire for Renal Patients 44
Appendix III: Study explanation for Renal Patients 47
Appendix IV: Consent form for Renal Patients 49
Appendix V: Study explanation for Blood Donors 50
Appendix VI: Consent form for Healthy Blood Donors 51
Appendix VII: Blood Donor’s Screening/Study Questionnaire 52
Appendix VIII: Methodology for Serum Creatinine 54
Appendix IX: Methodology for Serum cystatin C 55
Appendix X: Approval Letter KNH/UoN Ethics and Research Committee 56
Appendix XI: Formulae for estimated Glomerular filtration Rate 57
Appendix XII: Clearance from KNBTS Director, Nairobi 58
xii

TABLE OF CONTENTS
Title i
Declaration iv
Dedication vi
Acknowledgement vii
Abbreviations viii
List of tables and figures x
List of appendices xi
Summary 1
Introduction and Literature review 4
Rationale of the Study 11
Study Questions 11
Study objectives 12
Methodology 12
Results 18
Discussion 34
Conclusions and recommendations 37
References 38
xiii

SUMMARY
Background
Chronic Kidney Disease (CKD) is a disease spectrum characterized by progressive loss of renal
function over a period of time. Chronic kidney disease has reached epidemic proportion with
current reported incidence of approximately 14.5% among the adult population in the United
States of America. While no data exists on the Kenyan situation, risk factors for CKD such as
post‐streptococcal glomerulonephritis, hypertension, diabetes mellitus and lately HIV‐associated
nephropathy (HIVAN) are on the rise. Recent studies show that early diagnosis allows for
institution of therapy to either arrest or reverse progression of the CKD. Glomerular filtration
rate (GFR) is accepted as the best overall measure of renal function and is determined by the
renal clearance of exogenous markers such as inulin, iohexol and chromium‐labeled ethylene
diamine tetrachloroacetic acid (51Cr‐EDTA). Currently, creatinine clearance (CrCl) is the widely
used endogenous marker for estimating glomerular filtration rate.
While a number of equations based on serum creatinine (SCr) are in use to estimate GFR, case
diagnosis and stratification of CKD is poor. Estimated GFRs based on serum cystatin C (cys C)
levels have been shown to be more sensitive to early CKD compared to serum creatinine, hence
a suitable alternative.
In this study, estimated GFRs for CKD patients at the Kenyatta National Hospital and blood
donors at the National Blood Transfusion Centre (Nairobi) were derived from serum cystatin C
and serum creatinine. Secondly, the reference ranges for both serum cystatin C and serum
creatinine were compared to those from studies done in other parts of the world.
Main Objectives:
o To compare serum cystatin C and creatinine levels among CKD patients and blood donors.
Specific Objectives:
o To determine the serum cystatin C and creatinine levels in CKD patients and blood donors.
o To determine reference ranges for serum cystatin C and creatinine using blood donors as the
reference population.
o To compare the estimated GFRs based on the two markers and stratify the CKD patients as
per the National Kidney Foundation (NKF) guidelines.
1

Study Design
Comparative descriptive study between two assay markers.
Study Setting and Population/Subjects
1. Confirmed CKD patients on follow‐up at the renal clinic in KNH.
2. Volunteer blood donors at the blood transfusion unit (BTU) ‐ KNH and those at the various
outreach tents organized by the NBTC, Nairobi.
Methods
A total of 124 blood donors, well above the minimum requirement of 40 by IFCC for
establishment of reference range were recruited. One hundred and fifty (150) CKD patients were
also recruited into the study according to the formula for prevalence study. Minimal
demographic data was obtained by direct interviews using a study questionnaire.
Additional information on CKD patients was obtained by perusal of the treatment files on clinic
day followed by a clinical evaluation.
Once informed consent was guaranteed, 5 ml of whole blood was obtained from each study
participant for eventual determination of serum cystatin C and creatinine at the KNH main
laboratory.
Data Management
The data obtained from the laboratory was entered into a computer database. Spreadsheets
were generated and analyzed using Windows SPSS version 17.
Results
Out of the 124 blood donors recruited into the study, 78 (63%) were males while 46 (37%) were
females. The age group pattern was: ≤20 years were 24%, 48% were in the 21 – 25 years; 26% in
the 26 – 30 years and 2% were above 30 years. The serum cystatin C levels for blood donors had
0.6mg/L as the lowest and 1.6mg/L as the highest level while it was 65µmol/L and 120µmol/L for
serum creatinine respectively. The reference ranges for cystatin c and creatinine (irrespective of
age and gender) were 0.8‐ 1.4mg/L and 63 – 109 µmol/L respectively.
Of the 150 CKD patients, 57% were males and 43% were females. The youngest CKD patient was
18 years and the oldest was 77 years. The younger CKD study participants had glomerulopathies
2

(17%) as the commonest underlying morbidity while hypertension with diabetes co‐morbidity
was seen in the older CKD patients.
Staging of the CKD study participants using derived estimated GFR as per serum cystatin C had
75% in early disease (stages 1‐3) with only 2% in ESRD. However, eGRF based on serum
creatinine had 64% of participants in early CKD (stages 1‐3) and 15.4% had ESRD.
Correlation between cystatin C and creatinine levels among CKD study participants had an r
value of 0.849 and a p value of o.oo. The correlation between cystatin C and its derived eGFR
had an r value of ‐0.837 and p value of 0.00. The correlation between serum creatinine and
eGFR‐serum creatinine had an r value of ‐.678 and p value of 0.00.
Conclusions
1. The reference ranges for blood donors aged 18 – 34 years for both serum cystatin C and
creatinine in this study were 0.8 ‐ 1.4 mg/L and 62 – 120 mol/L respectively.
2. There is a difference in the staging for CKD participants as per National Kidney Foundation
(NKF) guidelines using the estimated GFR derived from the two markers separately
3. There is a difference in the staging for CKD participants as per NKF guidelines using the
estimated GFR derived from cystatin C and serum creatinine separately. Cross tabulation
of the staging of the CKD participants yielded a kappa vaue of 0.359.
Recommendations
Laboratory input in the management and follow‐up is central and at all times staging of known
and at risk CKD patients as per the National Kidney Foundation should be done on every clinical
request for renal function tests.
A follow‐up study involving a larger sample size of blood donors be carried out to capture more
variables such as age, gender and race.
A comparative study involving a ‘gold standard’ for measured GFR be carried out to assess the
sensitivity and specificty of serum cystatin C and serum creatinine.
3

1.0 INTRODUCTION AND LITERATURE REVIEW
1.1 Normal Renal Function and biochemical markers
In health, the body requires normal functioning kidneys which are involved in:
• Secretion of hormones: Erythropoietin (EPO) regulates the red cell population in
erythropoietin marrow, Renin which is central in the renin‐angiotensin –aldosterone
system, Calcitriol and Prostaglandins.
• Maintenance of extracellular fluid volume and composition such as glucose, amino acids,
sodium chloride, water, bicarbonate, protons, potassium, calcium, magnesium and
phosphate. Maintenance of acid‐base of acid‐base balance is critical for optimal enzyme
function.
• Excretion of metabolic waste: water, sodium, urea among other substances.
The kidney achieves the above via fundamental physiological mechanisms of filtration,
reabsorption and secretion. When assayed, the above indices are maintained within the
reference intervals.
1.2 Renal Dysfunction
This occurs when the kidney cannot effectively carry its body functions.
Kidney failure may be a complication of many disease entities and/or syndromes. Glomerular
diseases such as post‐streptococcal glomerulonephritis contribute a large proportion of early
CKD. Chronic pyelonephritis and tuberculosis are notable infectious risk factors of which HIV‐
associated nephropathy is routinely encountered. Not to be left out are congenital anomalies
e.g. polycystic kidney disease and obstructive processes such as calculi. Collagen disease e.g. SLE
and vascular diseases such as renal nephrosclerosis may lead to CKD. Nephrotoxic agents e.g.
aminoglycosides are occasionally implicated. Chronic kidney disease may be a progression from
acute renal failure. These disease processes interfere with the 3 mechanisms of kidney function
mentioned above.
Studies done in the USA show that diabetes and hypertension account for two thirds of cases
with CKD with a significant other contribution by glomerulonephritis and cystic lesions of the
kidney [1].
Chronic Kidney Disease (CKD) is a continuum in which there is progressive loss of renal function
over variable time duration. While CKD has reached epidemic proportions(1) with rising
prevalence and incidence worldwide, insensitivity of diagnostic markers has continuously
hampered efforts in case identification and monitoring disease progression.
4

In 2002, the National Kidney Foundation (NKF) under the umbrella of Kidney Disease Outcomes
Quality Initiative (K/DOQI) was formed to address CKD in the USA and to facilitate the
development and implementation of clinical guidelines (2). Through a series of conferences,
consensus was reached on i) definition of CKD and staging regardless of underlying cause, ii)
laboratory measurement of kidney disease, iii) association of the level of kidney function with
complications of CKD, and iv) stratification of the risk for loss of kidney function and
development of cardiovascular disease.
Table1: Staging of CKD and prevalence in the USA between 1998 and 2004 (2)
Stage
Description
GFR
mL/min/1.73m2
Prevalence
‐ Increased Risk ≥ 60 ‐
1 Kidney disease with
normal or increased
GFR
≥ 90 3.3
2 Mild reduction in GFR 60 – 89 3.0
3 Moderate reduction
in GFR
30 – 59 4.3
4 Severe reduction in
GFR
15 – 29 0.2
5 End‐Stage renal
Disease (ESRD)
< 15 0.1
From the table above, approximately 10.6% of the general USA population in the period
between 1998 and 2004 had early CKD (stages 1 – 3) and are normally asymptomatic.
Asymptomatic cases will miss out on early treatment with risk of progression to ESRD.
5
1.3 Markers of Renal Function
Urea, electrolytes and creatinine. Serum Na+ K+, Cl‐ , HCO3‐ and creatinine levels are assayed
during routine examination or in suspected renal impairment to assess electrolyte imbalance
and acid and base disturbance. The body pH which is maintained at a narrow range of 7.35 –
7.45 gives additional information of renal involvement in various metabolic syndromes. Levels of
acidosis rise depending on the degree of renal failure.
The Anion gap is a measure of [Na+] + [K+] ‐ (Cl‐ + HCO3‐). The gap is maintained at 8 – 12
mmol/L with interpretation of either elevation, normal or decrease useful in the eventual search
for the cause of acid‐base disturbance.
Traditionally GFR is considered the best overall index of renal function in health and disease. The
‘gold standard’ of measuring GFR is by the renal clearance of exogenous markers inulin, radio‐
labeled EDTA (51Cr‐EDTA) and technetium‐labeled diethylene‐triamine‐pentacetate (99mTc‐DTPA)
and iohexol. These tests are however time‐consuming, labor‐intensive, invasive, costly and
require specialized equipment restricting their use in routine individual cases monitoring or in
large epidemiological studies.
While an ideal endogenous marker should meet 3 criteria of complete filtration at the
glomerulus, absent tubular secretion and no tubular reabsorption, serum creatinine is widely
accepted as an endogenous marker for assessing renal function despite its well‐documented
limitations. Previously, the laborious and error‐prone creatinine clearance (CrCl) involving 24‐
hour urine collection was in use. The formula for CrCl is
Creatinine clearance = U × V (3)
P
U = urinary creatinine concentration (µmol/L)
V = urine flow rate [mL/min or (L/24h)/1.44]
P = plasma creatinine concentration (µmol/L)
Currently, a spot serum creatinine level is favored with creatinine‐based equations for
estimating GFR being employed. They are the Cockcroft‐Gault (CG), the 4‐variable Modifications
of Diet in Renal Disease (4v‐MDRD) and the Mayo Clinic Quadratic formulae (see Appendix
xii).These equations are used inter‐changeably to suit various study populations with no
consensus on which equation is more accurate ((4, 5)].
6

Limitations of serum creatinine
There is an inverse relationship between plasma creatinine and GFR. Glomerular filtration rate
can decrease by 50% before plasma creatinine concentration rises beyond the upper limit of the
reference range hence the poor sensitivity in early CKD case detection. Thereafter, serum
creatinine doubles for each further 50% fall in GFR [6].
Levels of serum creatinine are influenced by creatinine generation, renal function, extra renal
elimination and tubular handling. Confounders that alter the serum creatinine levels are age,
gender, race, muscle mass, protein load in diet and drugs that interfere with colonic flora [7].
These variables are factored in the various equations for calculation of eGFR.
In their study, McClellan et al (8) showed that tubular secretion increases creatinine clearance by
10‐20%, thus overestimating the glomerular filtration rate by nearly a similar proportion.
In the method of Jaffé which employs alkaline picrate, there are multiple interfering substances
both exogenous and endogenous. These include proteins, glucose, and acetoacetate and drugs
especially the cephalosporin family (9, 10). These non‐creatinine chromogens are present in
serum but absent in urine. The end‐result is underestimation of creatinine clearance. However,
recent modifications such as optimization of kinetic assays have improved method specificity
and minimized susceptibility to interfering substances (10).
Creatinine clearance requires 24 hour urine collection which is laborious and prone to
standardization and preservation errors especially when carried out in an out‐patient setting.
Rigelleau et al (11) in their study on diabetic patients showed that CG equation had
hyperglycemia and BMI‐related bias with overestimation of the eventual eGFR.
Perkins et al (12) and separately McIsaac et al (13) demonstrated that MDRD equation
overestimates normal or raised GFR missing out early stages of CKD.
Sensitivity of serum creatinine is low with detection of renal dysfunction occurring when more
than half the initial population of nephrons is non‐functional. The diagnostic accuracy of
Cockcroft & Gault (CG) and Modification of Diet in Renal Disease (MDRD) prediction equations in
mild and moderate renal function is poor thus the acronym ‘creatinine blind’ range of 40‐
70mL/min/1.73m2(14).
7

Accordingly, only 70% of renal subjects (15) can be considered well stratified as per the NKF
guidelines thus the need for a precise marker for GFR. Cystatin C is considered an ‘ideal’ marker
and is being proposed as a suitable alternative endogenous marker of renal function.
Cystatin C
Biochemistry
It is a 122 amino acid protein with molecular weight of 13 KDa. It belongs to a family of 11 other
potent, non‐covalent, competitive inhibitors of mammalian lysosomal cysteine proteinases.
Known functions of cystatins include control of proteolysis (intracellular, extracellular and
intravascular), immune modulation, antimicrobial activities and modification of the body’s
response to injury (16).
Properties of cystatin C that make it a potentially more “ideal” endogenous marker of GFR
compared to creatinine include:
i). Constant rate of production in all nucleated cells
ii). Reported lack of effect of age, gender or muscle mass on cystatin C generation
iii). Free filtration at the glomerulus due to its small size and basic pH
iv). Complete reabsorption and catabolism by proximal tubular cells; lack of renal tubular
secretion and lack of reabsorption into the bloodstream and
v). Absence of problems with analytic control.
Clinical Utility of Cystatin C
Cystatin C is freely filtered by the renal glomeruli, is not secreted by the tubules or eliminated via
any extra‐renal route but almost completely reabsorbed and metabolized by proximal tubular
cells (17).
Clinical usefulness of cystatin C as a measure of GFR was first proposed in 1985 by Grabb et al
(18) and separately by Simonsen et al (19) triggering widespread research interest.
Advances in assay of serum cystatin C have established its place as suitable alternative to serum
creatinine in estimating GFR. In their meta‐analysis of cystatin C and serum creatinine in
predicting renal dysfunction, Ross et al (20) found that cystatin C had higher pooled sensitivity
(81%) and similar specificity (88%) as compared to serum creatinine (69%;88% respectively).
8
Results mirrored those by Harmoinen et al (21) while comparing the diagnostic accuracy of
cystatin C with serum creatinine and creatinine clearance (CG) and CrCl (MDRD): Cystatin C was
superior to SCr when BMI was abnormal, or when GFR was normal or moderately impaired.
Absence of tubular secretion makes it extremely sensitive to early CKD as shown by Laterza et al
(22). Maahs et al (23) showed that cystatin C predicts progression of sub‐clinical atherosclerosis
in type 1 DM. Like HbA1c, cystatin C is reflective of cumulative effect GFR over time, but also
sensitive to recent changes in renal function (24). It allows for estimation of the slope of decline
in GFR and possible progression to End‐Stage Renal Disease (ESRD). Other studies concur with
additional role of cystatin C levels in predicting cardiovascular events and death in CKD patients
(25).
Cystatin C is unaffected in hepatic disease and in intestinal bacteria overgrowth (26). Studies
done in the pediatric age groups and other patient categories such as the elderly, pregnancy and
transplant recipients stress its widening application in monitoring disease progression and
increased risk of mortality (27, 28). Levels of cystatin C in extracellular fluids such as in malignant
effusions correlate closely with disease burden.
In an elaborate study in the pediatric population (from premature infants to 17 years), Finney et
al (29) had 3 conclusions.
Cystatin C is a better marker than creatinine of glomerular filtration rate in preterm
infants .
A single reference range for plasma cystatin C can be used, regardless of gender, from
1 year of age.
Cystatin C offers a more specific and practical measure for monitoring GFR in the pediatric
population than does creatinine.
Cystatin C levels have been found to remain stable from 1 year to 80 years of age effectively
covering the spectrum for possible CKD. Cystatin C is currently in routine use for estimating GFR
employing nephelometric, turbidimetric and Elisa techniques (30).
Immunoturbidimetric Assay: highly accurate, excellent precision with coefficient of variance of
less than 5%. It is cost‐effective with easy instrument adaptation. One may use either serum or
plasma.
Immunonephelometric Assay: No blank correction required, is highly sensitive with lower
detection limit but not widely available.
9

Elisa: Easy to perform, rapid, more cost‐effective and allows quantification.
Cystatin C remains stable during storage for both plasma and serum samples for up to 1 week at
2‐4°C. Levels are not affected by most drugs, acute phase reaction or diet (31).
Correlation between Marker and Usefulness
An increase in serum cystatin C corresponds to decreased GFR. Normal cystatin C values for
adults are between 0.8 and 1.2 mg/L, but may rise 2 to 5 times the upper limit in cases of
chronic kidney diseases.
The formula for estimating GFR in this study was:
eGFR = 100/cystatin C expressed as ml/min (32). This is used for adults and refereed to as the
simple cystatin C equation.
Limitations of cystatin C.
1. Levels are not affected by standardized high‐dose corticosteroid therapy but may increase
in patients with renal dysfunction receiving corticosteroids (33).
2. Levels are sensitive to changes in thyroid function: Cystatin C levels rise in
hyperthyroidism and fall in hypothyroidism. This is as opposed to the inverse
relationship between serum creatinine and thyroid function (34).
3. Higher cost with limited availability of current assay techniques compared to serum
creatinine. This may eventually change with emerging evidence in favor of cystatin C
(35).
10

RATIONALE OF THE STUDY
While no data is available on the prevalence of CKD in Kenya, it remains a major global health
problem (1). There is reported rise in the risk factors for CKD such as chronic glomerulonephritis,
diabetes mellitus, hypertension and recently HIV‐associated nephropathy (HIVAN) (36). Chronic
kidney disease is characterized by high cost of management and poor outcomes chiefly being
cardiovascular disease and death. Remuzzi et al (37) found that adverse outcomes in CKD can be
prevented or delayed by early detection and treatment using ACE‐inhibitors.
Despite the existence of guiding principles on approach to CKD, it remains greatly
underdiagnosed and undertreated. Laboratory input is central in staging and risk stratification.
Creatinine clearance is widely used despite its numerous limitations. Cystatin C is an emerging
marker for detecting early renal dysfunction and a big step towards preventive renal medicine.
This study aims to assess whether serum cystatin C equals or is a better marker for renal
dysfunction than serum creatinine. Levels from volunteer blood donors will be assessed and
used to determine reference ranges for cystatin C and creatinine and their respective estimated
GFRs.
NULL HYPOTHESIS
There is no diffence in the staging of the Chronic kidney disease patients at Kenyatta National Hospital as per National Kidney Foundation guidelines using seum cystatin C and serum creatinine. ALTERNATE HYPOTHESIS The reference ranges for serum cystatin C and serum creatinine among blood donors at the NBTS, Nairobi are comparable to those in literature.
STUDY QUESTIONS
• What are the serum cystatin C and serum creatinine levels in blood donors and CKD
patients at NBTS and Kenyatta National Hospital?
• What is the staging of CKD patients using estimated GFR as per the National Kidney
Federation guidelines based on serum cystatin C and serum creatinine?
11
2.0 OBJECTIVES
2.1 Broad Objective:
To compare the serum cystatin C and creatinine levels in CKD patients and blood
donors.
2.2 Specific Objectives:
To determine serum cystatin C and creatinine levels in CKD patients and blood
donors.
To determine reference values of cystatin C using blood donors as reference
population.
To compare the eGFR values obtained using cystatin C and serum creatinine in
blood donors and CKD patients.
3.0 METHODOLOGY
Study Design
This was a comparative descriptive study involving both CKD patients and blood donors
A) RENAL PATIENTS
Study Site
The renal clinic at the Kenyatta National Hospital which is conducted every Friday from 8
a.m. with an average attendance of 40 patients of all age groups.
Study Population
Adult males and females on follow‐up at the renal clinic.
Definition of cases
• Referred patients with ≥3/12 established renal disease with/without proteinuria,
elevated serum creatinine levels or deranged eGFR.
Case Selection
Inclusion Criteria
• Age 18 to 80yrs.
• Gender: Male and Female.
• Renal disease for ≥3/12.
12

• Mild to moderate chronic kidney disease as per clinical staging in the treatment file.
• Informed consent.
Exclusion Criteria
• Patients with advanced renal disease or End‐stage renal failure requiring dialysis.
• Patients with known malignancies or thyroid illness through clinical history and physical
examination.
• Patients on high‐dose steroids
• Declined consent
Sample Size
The sample size for CKD patients was 150. This was arrived at using the formulae for cross
sectional studies (38). The minimum sample size n was thus obtained by the formulae
n = Z2P (1‐P)
d2
Z value is the upper α/2 point of the normal distribution with a value of 1.96.
P is the assumed prevalence of CKD in Kenyatta National Hospital, based on the prevalence of
11% among adult population in the USA.
d is the precision, 0.05 with which to determine the prevalence
n = 1.962*0.11(1‐0.11)
0.052
n = 150
Sampling Technique
In a study on renal patients at KNH carried out by Maritim (39), it was found that early CKD
(Stage I‐III) comprised 53% of cases 30 years old and above. In this study, every second adult
patient on follow‐up at the renal clinic was assessed for eligibility and recruitment until the
desired number of 150 was achieved.
13

Recruitment
On the morning of a clinic day, files were perused to identify candidates for screening. Once the
patients were done with the physician, they were ushered into a designate study room where
the purpose of the study, the benefits and risks of participation were explained. Informed
consent was sought. The screening proforma (Appendix I) was then administered by direct
interview and responses entered into respective sections. Successful patients were assigned
study numbers. Further information was then obtained followed by a clinical assessment, which
were entered into the study proforma (Appendix II). Five mls of whole blood was then obtained
and put into a plain vacutainer and thereafter into a cool box. The recruited patients were then
advised to check the results of their renal function status in their next visit. Those who declined
at the screening stage were allowed to continue with the physician’s instructions. An average of
10 CKD patients was recruited on a single clinic day. A sticker was put on the file to avoid
duplication in recruitment.
B) HEALTHY BLOOD DONORS
Study Site
The blood transfusion unit (BTU) at Kenyatta National Hospital and the National Blood
Transfusion Services (NBTS) outreach tents within Nairobi province.
Study Population
Volunteer donors at the BTU in KNH and in outreach campaigns by the NBTS team.
Definition of suitable donors
Eligible study participants were male or female volunteer donors aged between 18 and 65
years, weighed 50 kgs and above and had a hemoglobin count of/or above 12.5g/dl (determined
using copper sulphate method). They agreed to test for HIV, HBsAg, HCV and syphilis as required
by NBTS guidelines.
Subject selection – donors
Inclusion Criteria
• Volunteers who qualified as blood donors as per NBTS guidelines (Appendix VI).
• Those who gave informed consent to voluntarily take part in the study.
14

Exclusion Criteria
• Volunteers who did not qualify as blood donors as per NBTS guidelines.
• All blood donors who did not give consent to participate in the study.
Sample Size
According to the International Federation for Clinical Chemists (IFCC) (40), a minimum of 40
cases are required for establishment of reference ranges though 120 is most desirable.
In this study, 128 blood donors were initially recruited to make up for any anticipated pre‐
analytical sources of error. Four specimens tested positive for HIV and were eliminated leaving
124 blood donors’ specimens for eventual analysis.
Sampling Technique
Every third blood donor irrespective of age and gender was recruited until the desired sample
size of 124 was achieved. A research assistant assisted in administering both the screening and
study proformas for blood donors (Appendix VI).
Recruitment and Sample Collection
During a blood donation exercise, potential donors were briefed on the purpose of the study,
the advantages and risks alongside the NBTS donor screening questionnaire (Appendix VI). Their
consent was sought before obtaining of vital socio‐demographic data by direct interviews, which
was entered into the relevant section in the donor screening/study questionnaire (Appendix VI).
Those who declined consent were excluded from the study but proceeded to donate blood
normally.
Five ml of whole blood was then obtained from the venepuncture just before connecting the
pilot tube, into well‐labeled plain vacutainers. An average of 20 blood donors was recruited on a
single day.
The vacutainers bearing samples from study participants were transported in a cooler box to
NBTC‐ Nairobi offices.
Separation and Storage:
The vacutainers were left to settle and serum pipetted into labeled cryovials (in duplicates) for
storage at ‐40°C at the NBTC. The precipitant was discarded safely. Once the desired sample size
15

was reached, all the specimens were removed from the freezer for batch analysis in one single
day.
Specimen Analysis:
The alkaline picrate method (modified kinetic Jaffe reaction) using an Olympus 400/640
autoanalyzer was employed in this study (Appendix III).
Cystatin C was measured using Latex‐enhanced immuno‐turbidimetric assay on Olympus
400/640 autoanalyzer (Appendix VIII).
The samples, reagents, controls and calibrators were retrieved from the refrigerators and
brought to room temperature. The tests were run as per manufacturer’s instructions.
Quality Assurance
Stringent measures were followed to ensure accurate and precise data to within the
recommended coefficient of variance (<5%) by the manufacturers. Both the calibrators and
controls were run in duplicates.
ETHICAL CONSIDERATIONS
The study commenced upon approval by the Department of Human Pathology (UoN) and the
KNH/UoN Scientific & Ethical Review Committee (Appendix XI).
There was also clearance from the office of the Director, National Blood Transfusion Services
(Appendix XII).
Pre‐consent counseling involved the following:
i. Information and explanation on the research nature and overall goal
ii. Detailed explanation of the procedures involved, outlining their safety or lack of.
iii. Assurance that participation is voluntary and one can withdraw at any point without
losing other benefits from KNH or blood donation services
iv. Confidentiality and custody of patient information, specimen and results
v. Assurance on free access to their results and their medical interpretations. Appropriate
referrals for medical intervention shall be carried out.
vi. The benefits and unforeseen harm of participating in the study shall be explained in
unambiguous language as contained in the Study explanations for both renal patients and
healthy blood donors (Appendices III and V respectively).
16

Thereafter, the study participants signed the consent form (Appendix IV and VI) before
undergoing a physical examination.
DATA HANDLING AND ANALYSIS
Demographic data on study participants was obtained by direct interviews and entered into the
study proforma. Laboratory results for serum cystatin C and creatinine levels were in the form of
a computer print out. The eGFR using the two equations below:
1. Serum creatinine: the MDRD study equation (also available online at the NKF website) .
2. Serum cystatin C: 100/ [cystatin C] – the simple cystatin C equation.
All data was then entered into a computer database from which spreadsheets were generated
and transferred to the Statistical Package for Social Sciences (SPSS) software version 17 for
analysis. Summary of the statistics was determined during the analysis and presented as
proportions and percentages in the form of tables and graphs.
In the determination of reference range, there was no partitioning of blood donors into age or
gender because of the small sample size and the narrow age spread. Histograms were prepared
using the SPSS; visual inspection was then done to ensure a Gaussian distribution. Outliers were
identified and excluded in the final analysis. The data derived from cystatin C was linear and
Gaussian distribution was obtained. For serum creatinine, the data was non‐linear hence
transformation into the natural logarithm to obtain a Gaussian distribution. The reference limits
were set at X ± 1.96 SD where X = the mean and SD = standard deviation.
Statistical methods employed included correlations, cross tabulations and T‐tests for
comparison. A p value of <0.05 was considered a statistically significant result.
17

RESULTS
A. BLOOD DONORS
Socio‐demographic characteristics of the study participants
A total of 124 blood donors were recruited into the study. Of the 124, 78 (63%) were males and
46 (37%) were female. Majority, 60 (48%) were aged between 21 – 25 years. The mean age was
23.3 years and the standard deviation was 3.587. The mode was 21 years and the median was 23
years. The youngest donor was 18 years and the oldest was 34 years. Most of the donors were
single and naïve. The age‐gender distribution is depicted in figure 1.
Figure 1: Age‐Gender distribution of blood donors (n = 124)
Frequency
Age (years)
Majority (48%) of the blood donors were in the 21 ‐25years age bracket, 24% were 20 and below years, 26% were 26 – 30 years and only 2% were 30 years and above (Figure 1).
The serum cystatin C levels (expressed in mg/L) obtained from the donors yielded continuous
data with a histogram plot resulting in a Gaussian distribution as shown in figure 2. Four outliers
were excluded in the analysis to obtain the reference range for serum cystatin C.
18

Figure 2: Serum cystatin C levels in blood donors (n = 120)
(mg/L)
The cystatin C levels ranged from 0.7 to 1.4 mg/L on exclusion of four outliers. The mode was 1.2 mg/L while the mean was 1.11 mg/L. The standard deviation was 0.161 mg/L (Figure 2).
The estimated GFR derived from cystatin C (eGFRcysC) was also continuous. Histograms were
prepared and visual inspection of the frequency plot yielded a Gaussian distribution as shown in
figure 3. Two outliers were excluded during analysis.
19

Figure 3: eGFR‐cystatin C in blood donors (n = 122)
(ml/min) e
The derived eGFR‐cystatin C of study participants ranged from 63 to 125 ml/min after removal of two outliers. The mean was 91.08 ml/min and the standard deviation 14.465 ml/min. The reference range obtained was 62 – 120 ml/min (figure 3).
The histograms for the data for serum creatinine levels among blood donors were non‐linear.
Transformation into natural logarithm was necessary in order to achieve gauchian distribution as
shown in figure 4. No outliers were found in the inspection of the plot.
20

Figure 4: Distribution of the Natural Log SCr (n=124)
SCrLN: the natural logarithm of the serum creatinine levels. The range was from 4.15 to 4.75.
The mean was 4.45 with a standard deviation of 0.133 (figure 4).
The retransformed data into corresponding serum creatinine levels was as per table 2 below:
The lowest and highest values for serum creatinine were 65 and 120 respectively. The mean was
86.32µmol/L and the standard deviation 11.46. The reference range was 63 ‐ 109µmol/L (table
2).
Similarly, the estimated GFR derived from serum creatinine yielded non‐linear data and required
transformation into natural logarithm. The plot for the histogram for the natural logarithm had a
Gaussian distribution shown in figure 5 below. No outliers were noted.
21

Figure 5: Distribution of the Natural Log for eGFR‐SCr for blood donors (n=124)
GFR SCr LN: the natural logarithm for eGFR derived from serum creatinine levels. The range was
from 4.35 to 5.10. The mean was 4.71 and the standard deviation was 0.187 (figure 5). This
information was retransformed into usable values as summarized below.
Summary of eGFR‐serum creatinine for blood donors
The lowest and highest derived values for blood donors were 63 and 167 µmol/min/1.73m2
respectively. The mean was 112.74 µmol/min/1.73m2, the standard deviation was 20.86 and the
median was 113 µmol/min/1.73m2. The reference range was 71 ‐ 155µmol/min.1.73m2.
22
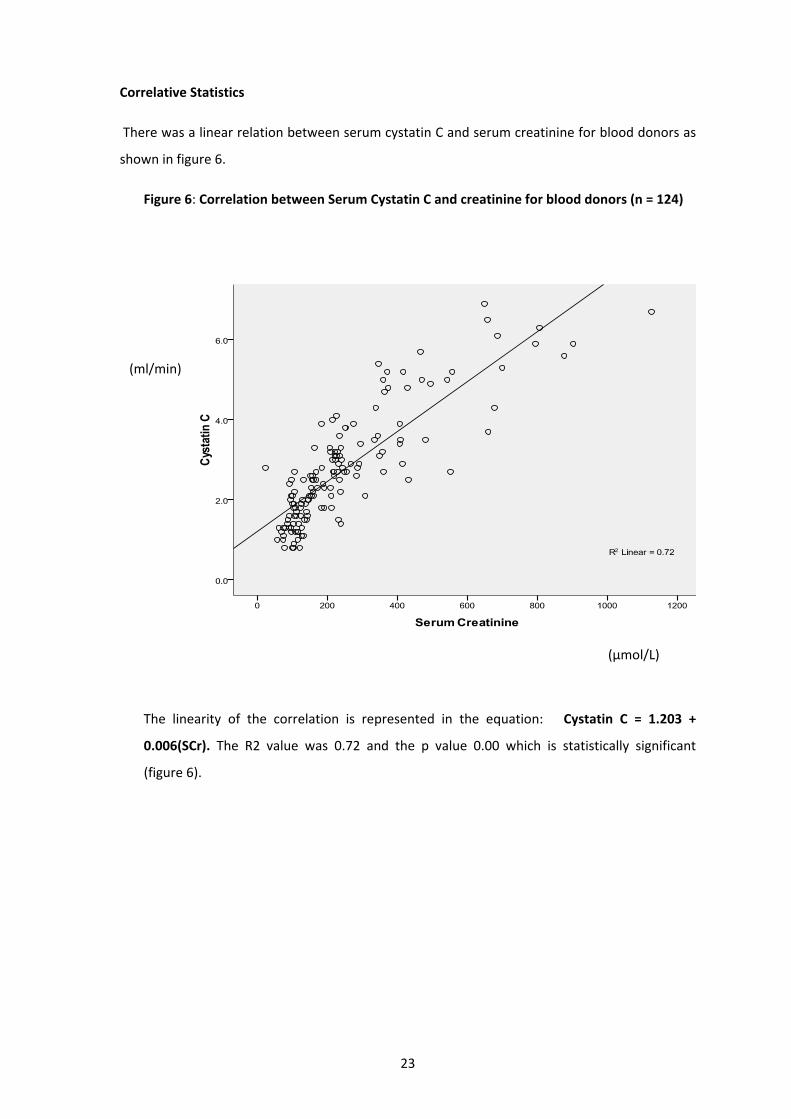
Correlative Statistics
There was a linear relation between serum cystatin C and serum creatinine for blood donors as
shown in figure 6.
Figure 6: Correlation between Serum Cystatin C and creatinine for blood donors (n = 124)
(µmol/L)
(ml/min)
The linearity of the correlation is represented in the equation: Cystatin C = 1.203 +
0.006(SCr). The R2 value was 0.72 and the p value 0.00 which is statistically significant
(figure 6).
23
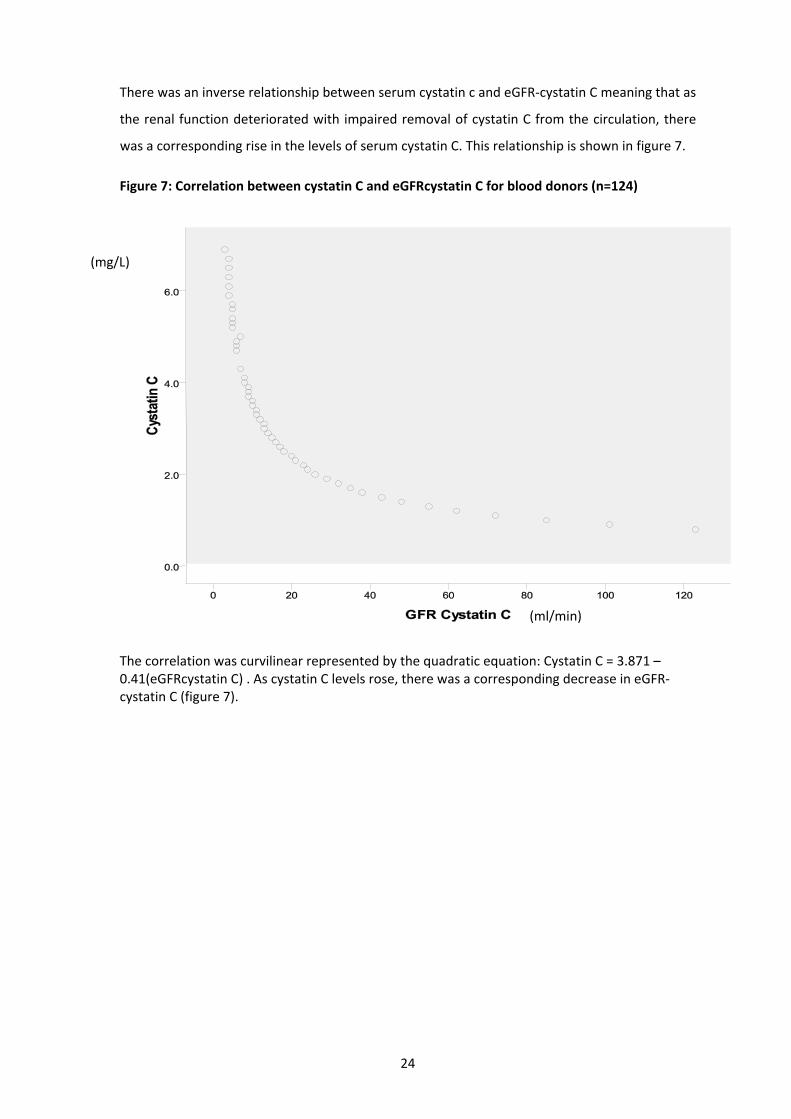
There was an inverse relationship between serum cystatin c and eGFR‐cystatin C meaning that as
the renal function deteriorated with impaired removal of cystatin C from the circulation, there
was a corresponding rise in the levels of serum cystatin C. This relationship is shown in figure 7.
Figure 7: Correlation between cystatin C and eGFRcystatin C for blood donors (n=124)
(ml/min)
(mg/L)
The correlation was curvilinear represented by the quadratic equation: Cystatin C = 3.871 – 0.41(eGFRcystatin C) . As cystatin C levels rose, there was a corresponding decrease in eGFR‐cystatin C (figure 7).
24

Similarly, there was an inverse relationship between serum creatinine and eGFR‐serum
creatinine as shown in figure 8 below. As renal function decreased hence fall in eGFR, there was
a corresponding rise in the serum creatinine levels and vice versa.
Figure 8: Correlation between Serum creatinine and eGFRSCr in blood donors (n = 124)
(µmol/min/1.73m2)
µmol/L
The correlation was curvilinear represented by the equation: eGFRSCr = 75.663 – 0.118 X SCr. The R value was 0.678 and the p value 0.00 which is statistically significant (figure 8).
25

Lastly, there was a linear relationship between eGFRcystatin C and eGFRScr as shown in figure 9
below.
Figure 9: Correlation between eGFR‐cystatin C and eGFR‐scr for blood donor (n=124)
(ml/min)
(µmol/min/1.73m2)
The correlation yielded an r value of 0.701 and a p value of 0.00 which is statistically significant
(figure 9) indicating that one could use GFR‐cystatin C and GFR‐serum creatinine to assess the
renal function status.
26

Below is a summary of the correlations between primary and secondary results for blood
donors.
1. Correlation between cystatin C and serum creatinine : r value = 0.849, p value = 0.01
2. Correlation between cystatin C and eGFR‐cystatin C : Pearson’s correlation (r value) = ‐
0.837, p value = 0.01
3. Correlation between serum creatinine and eGFR‐serum creatinine : r value = ‐0.678, p
value = 0.01
There is a positive correlation between cystatin C and serum creatinine (r value = 0.849) with p
value of 0.01 which is statistically significant. Additionally, cystatin C is inversely correlated with
eGFR with r value of ‐0.837, p =0.01. Similarly, serum creatinine and its derived eGFR are
inversely correlated, r value = ‐0.678, p = 0.01. However, cystatin C has stronger correlation with
eGFR compared to serum creatinine ( r value ‐0.837 vs ‐0.678 ).
27
B. RENAL PATIENTS
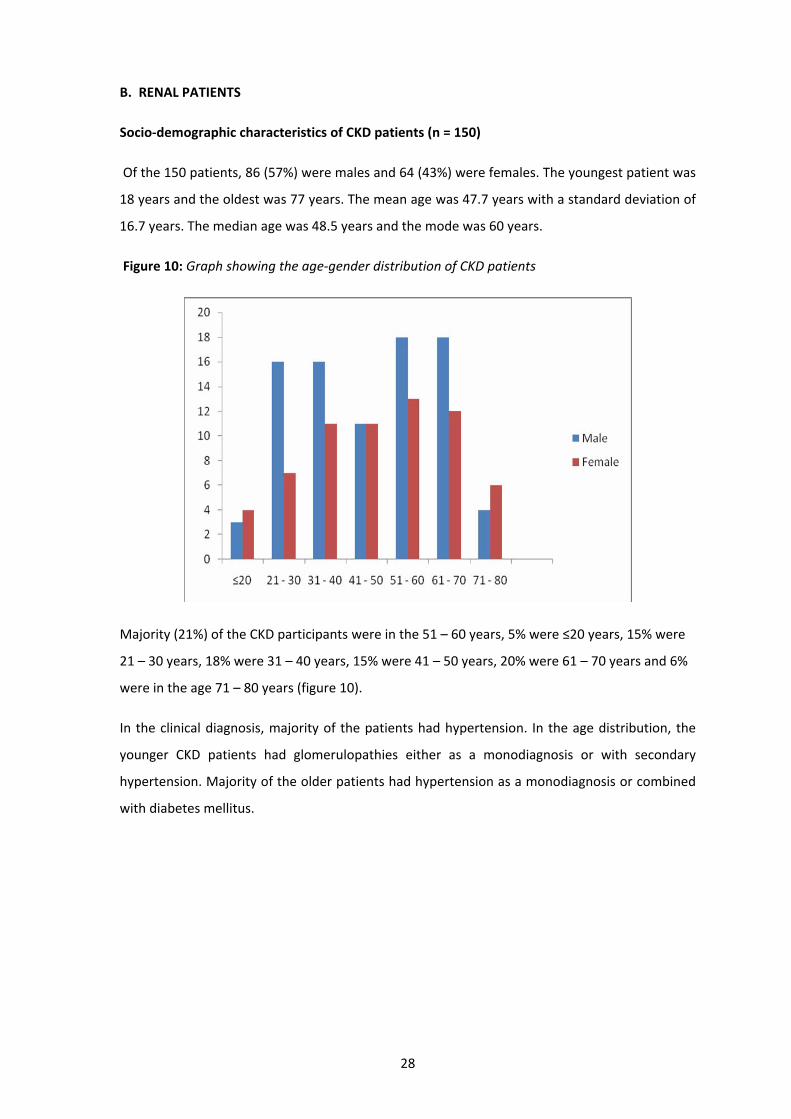
Socio‐demographic characteristics of CKD patients (n = 150)
Of the 150 patients, 86 (57%) were males and 64 (43%) were females. The youngest patient was
18 years and the oldest was 77 years. The mean age was 47.7 years with a standard deviation of
16.7 years. The median age was 48.5 years and the mode was 60 years.
Figure 10: Graph showing the age‐gender distribution of CKD patients
Majority (21%) of the CKD participants were in the 51 – 60 years, 5% were ≤20 years, 15% were
21 – 30 years, 18% were 31 – 40 years, 15% were 41 – 50 years, 20% were 61 – 70 years and 6%
were in the age 71 – 80 years (figure 10).
In the clinical diagnosis, majority of the patients had hypertension. In the age distribution, the
younger CKD patients had glomerulopathies either as a monodiagnosis or with secondary
hypertension. Majority of the older patients had hypertension as a monodiagnosis or combined
with diabetes mellitus.
28
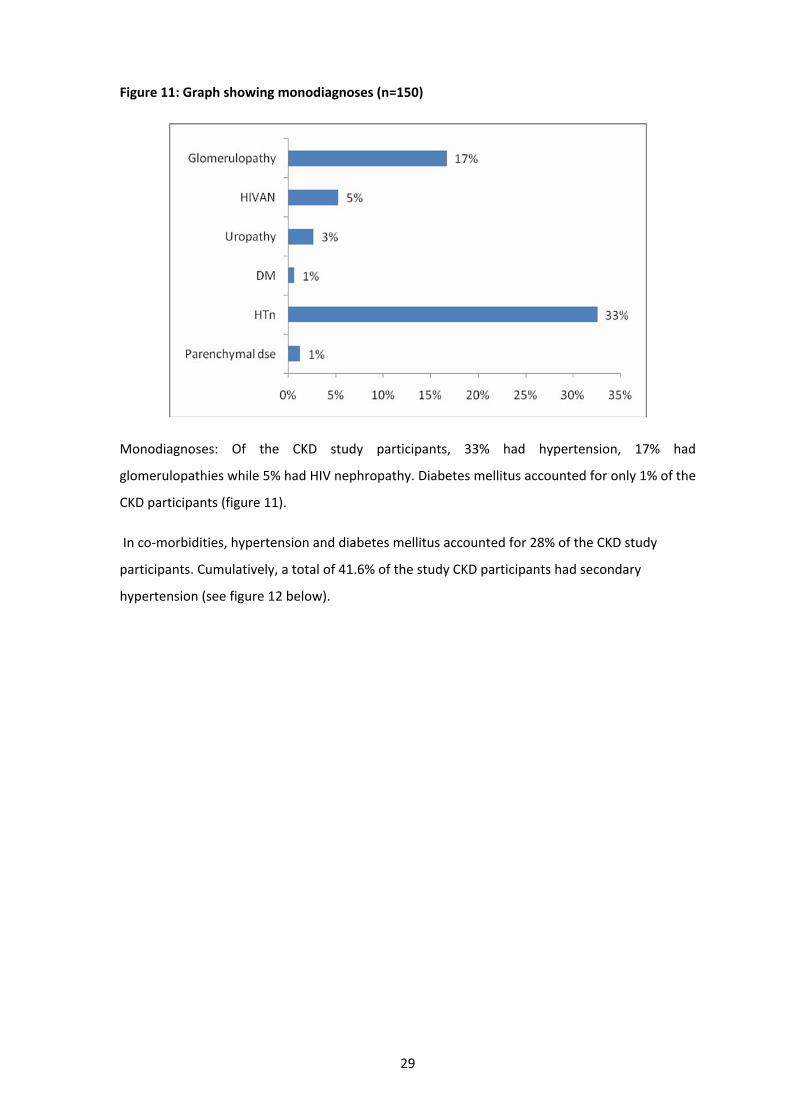
Figure 11: Graph showing monodiagnoses (n=150)
Monodiagnoses: Of the CKD study participants, 33% had hypertension, 17% had
glomerulopathies while 5% had HIV nephropathy. Diabetes mellitus accounted for only 1% of the
CKD participants (figure 11).
In co‐morbidities, hypertension and diabetes mellitus accounted for 28% of the CKD study
participants. Cumulatively, a total of 41.6% of the study CKD participants had secondary
hypertension (see figure 12 below).
29

Figure 12: Graph showing co‐morbidities among CKD patients (n=150)
Correlative Statistics
Correlations were done between serum cystatin C and serum creatinine and each with its
derived eGFR. The results were as shown in the graphs below.
Figure 13: Correlation between Serum Cystatin C and creatinine for CKD patients (n = 150)
There is a positive correlation between serum cystatin C and serum creatinine with r = 0.849
and p = 0.01 which is statistically significant (figure 13).
30
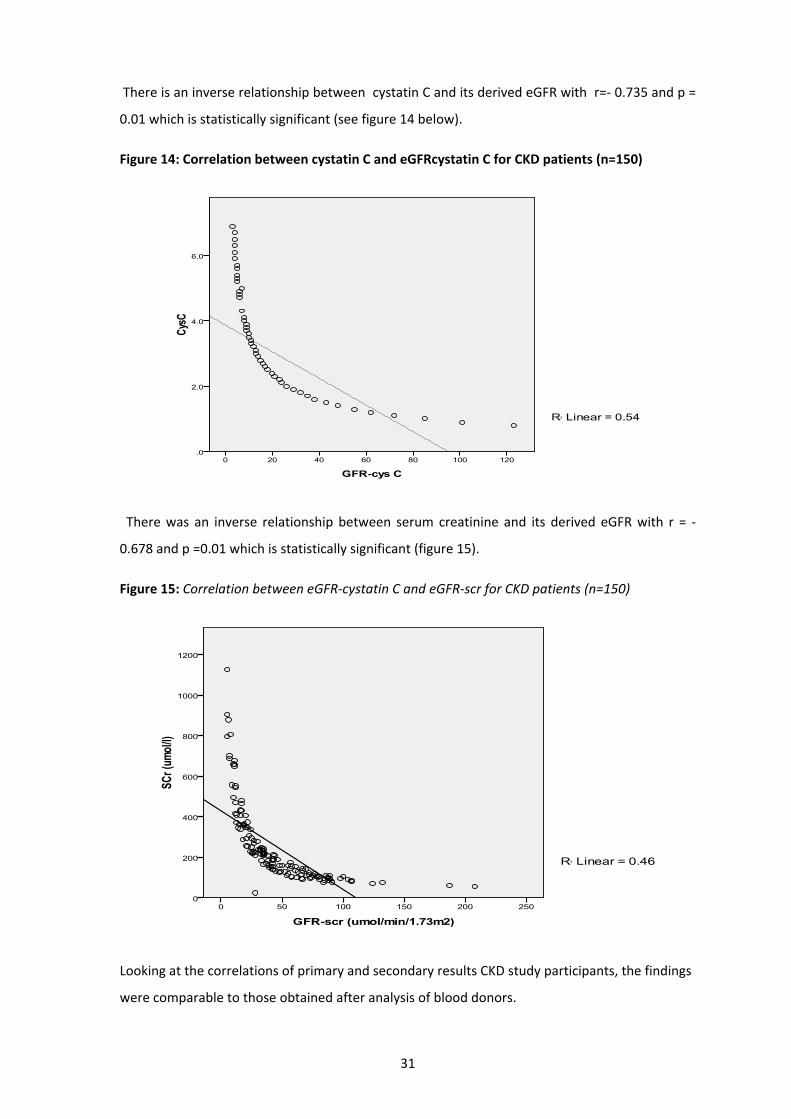
There is an inverse relationship between cystatin C and its derived eGFR with r=‐ 0.735 and p =
0.01 which is statistically significant (see figure 14 below).
Figure 14: Correlation between cystatin C and eGFRcystatin C for CKD patients (n=150)
There was an inverse relationship between serum creatinine and its derived eGFR with r = ‐
0.678 and p =0.01 which is statistically significant (figure 15).
Figure 15: Correlation between eGFR‐cystatin C and eGFR‐scr for CKD patients (n=150)
Looking at the correlations of primary and secondary results CKD study participants, the findings
were comparable to those obtained after analysis of blood donors.
31
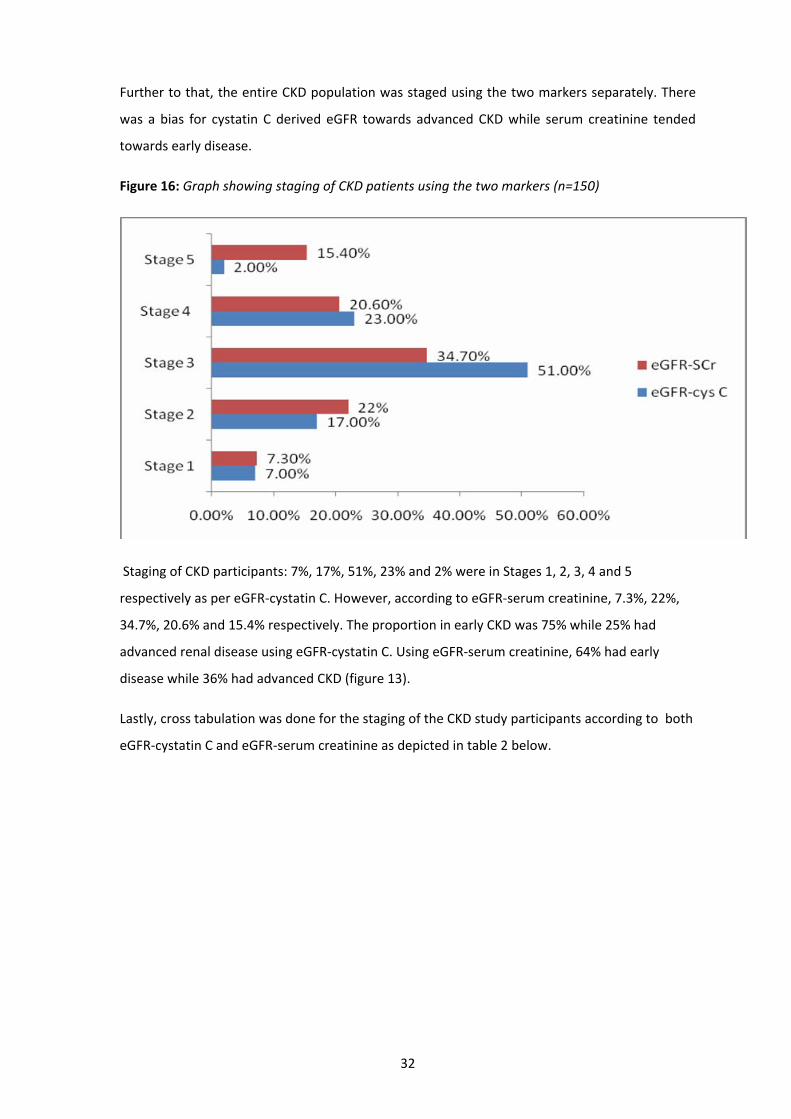
Further to that, the entire CKD population was staged using the two markers separately. There
was a bias for cystatin C derived eGFR towards advanced CKD while serum creatinine tended
towards early disease.
Figure 16: Graph showing staging of CKD patients using the two markers (n=150)
Staging of CKD participants: 7%, 17%, 51%, 23% and 2% were in Stages 1, 2, 3, 4 and 5
respectively as per eGFR‐cystatin C. However, according to eGFR‐serum creatinine, 7.3%, 22%,
34.7%, 20.6% and 15.4% respectively. The proportion in early CKD was 75% while 25% had
advanced renal disease using eGFR‐cystatin C. Using eGFR‐serum creatinine, 64% had early
disease while 36% had advanced CKD (figure 13).
Lastly, cross tabulation was done for the staging of the CKD study participants according to both
eGFR‐cystatin C and eGFR‐serum creatinine as depicted in table 2 below.
32
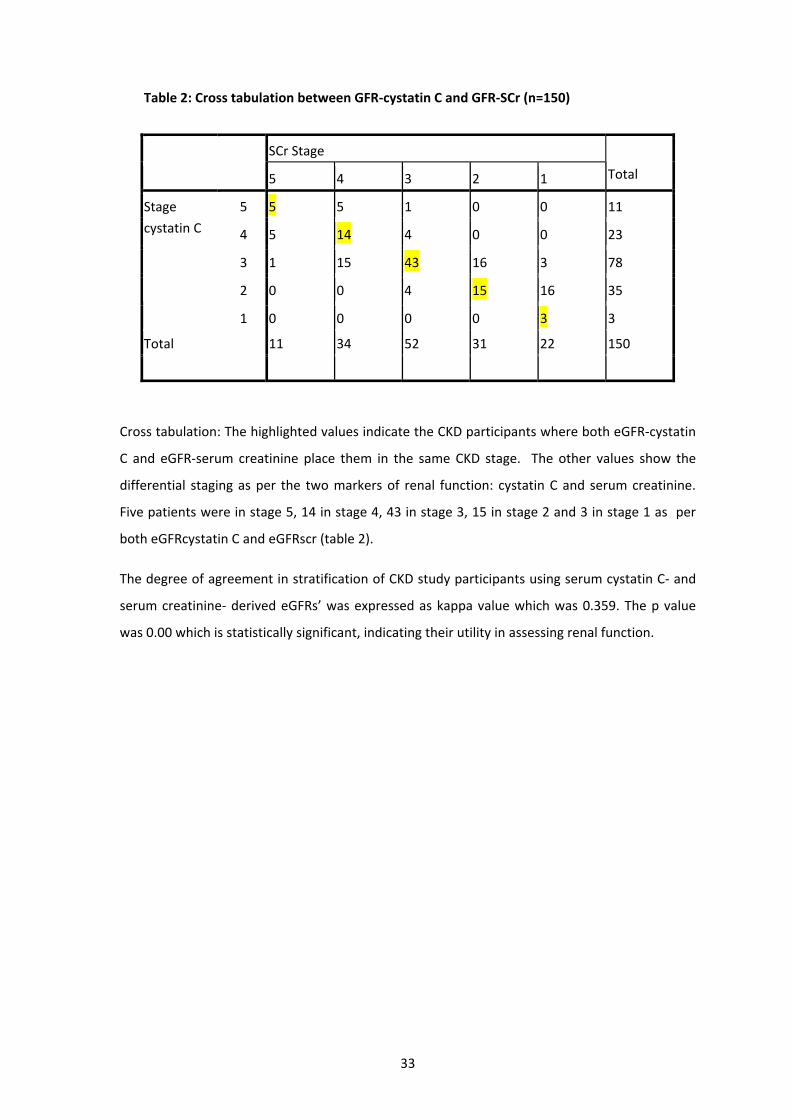
Table 2: Cross tabulation between GFR‐cystatin C and GFR‐SCr (n=150)
SCr Stage
5 4 3 2 1 Total
5 5 5 1 0 0 11
4 5 14 4 0 0 23
3 1 15 43 16 3 78
2 0 0 4 15 16 35
Stage
cystatin C
1 0 0 0 0 3 3
Total 11 34 52 31 22 150
Cross tabulation: The highlighted values indicate the CKD participants where both eGFR‐cystatin
C and eGFR‐serum creatinine place them in the same CKD stage. The other values show the
differential staging as per the two markers of renal function: cystatin C and serum creatinine.
Five patients were in stage 5, 14 in stage 4, 43 in stage 3, 15 in stage 2 and 3 in stage 1 as per
both eGFRcystatin C and eGFRscr (table 2).
The degree of agreement in stratification of CKD study participants using serum cystatin C‐ and
serum creatinine‐ derived eGFRs’ was expressed as kappa value which was 0.359. The p value
was 0.00 which is statistically significant, indicating their utility in assessing renal function.
33

DISCUSSION
There were more male donors recruited into the study compared to female donors reflecting
the true situation at the National Blood Transfusion Services (NBTS). This is despite the sampling
technique favouring both genders equally. According to the Kenya demographic and health
survey (KDHS)‐2003 (41), women make up a larger proportion of the Kenyan population (57%).
Women volunteers are likely to fail to qualify as donors because of low haemoglobin levels.
Lower haemoglobin levels may be secondary to menstrual losses or increased iron requirements
in pregnancy and lactation.
The 21 – 25 years age bracket had the highest proportion (48%) of donors. This is due to the fact
that most of the blood donation exercises targeted the youth in the post‐secondary colleges and
universities.The youngest blood donor was 18 years and the oldest was 34 years.The volunteers
were mostly single and naive donors. A good proportion were repeat donors responding to radio
broadcast or faith‐based appeal for urgent need for blood. This study was limited in the spread
for blood donors where a wider age distribution of upto 65 years would have been more
representative of the adult population. In her study on the seroprevalence of CMV antibodies in
donated blood at the NBTC ‐ Nairobi, Njeru (42) noted a similar trend where only 5% of study
participants were above 30 years. Given that the sampling of donors was for every third
volunteer irrespective of age and gender, there was no bias.
In health, cystatin C levels are maintained at a fairly narrow range of between 0.8 – 1.2 mg/mL
from the age of one to eighty years with minimal gender variations. In this study, the 95%
reference intervals for 124 blood donors for serum cystatin C and eGFR‐cystatin C were 0.8 – 1.4
mg/L and 62 – 120 ml/min respectively while those for serum creatinine and eGFR‐serum
creatinine were 63 ‐ 109µmol/L and 71 – 155ml/min/1.73m2. These are comparable to findings
from a study to determine adult reference ranges in the UK, where Hazel et al [43] found that
the 95% reference intervals for creatinine, predicted creatinine clearance and cystatin C for 309
blood donors, regardless of gender were 68‐118 µmol/L, 58‐120 ml/min/1∙73 m2 and 0∙51‐0∙98
mg/L, respectively. As shown above, there is a slight difference the values for all the three
parameters. This could have arisen due the difference in sample sizes between the two studies.
In the study mentioned above to determine the adult reference ranges, the recruited 309
healthy blood donors ranged from 16 years to 65 years. This enabled partitioning of the
participants according to gender and age and the investigators were able to assess the effects of
these two variables on the serum creatinine, creatinine clearance and serum cystatin C with no
effect on the power of the study. There was minimal effect of gender on serum cystatin C levels
34
to warrant use of separate reference ranges for males and females. However, there was
separation of reference range in those under 50 years of age and those above. In this study, no
gender or age variations were calculated given the size and distribution of the sampled blood
donors. While the effect of race on the serum creatinine is well‐documented and factored in the
MDRD equation, cystatin C levels are considered not tobe affected by race. This fact can thus be
cemented in the local setting by an appropriate follow‐up study.
In impaired renal function serum levels of cystatin C rise proportionately due to impaired
glomerular clearance.This gives an inverse relationship with estimated GFR. With a half‐life of
twenty minutes, cystatin C is a useful marker in the monitoring of subtle changes in renal
function among CKD patients and staging necessary in the management and prognostication.
Serum creatinine remains the most widely used routine marker for assessing renal function.
Levels of serum creatinine rise with worsening kidney failure thus an inverse relationship with
estimated GFR. Serum creatinine has an estimated half‐life of 3.85 hours in a healthy male
individual of between 20 and 39 years is 3.85 hours. In established chronic kidney disease
irrespective of age and gender, the half‐life of serum creatinine is prolonged up to 77 hours
making it a lesser sensitive marker in monitoring (44). However, cystatin C sensitivity remains
unchanged in established CKD.
Results for the CKD patients in this study showed that the younger patients had mainly the
glomerulopathies (17%) with additional 7.4% having hypertension or diabetes mellitus co‐
morbidity. The recently recognised HIV‐associated nephropathy (HIVAN) accounted for 7% of the
CKD study participants. HIVAN had patients spaning the entire age range. The older age groups
had mainly hypertension (46%) and hypertension‐diabetes co‐morbidities (27.3%).
Globally, the prevalence of impaired kidney function is estimated to range between 10% and
20% of the adult population (45) with rising incidence attributable to the epidemic of type II
diabetes and the ageing population in developed countries. In a recent study, the prevalence of
CKD in the general population was reported as 11% by Kissmayer et al (46) in the United
Kingdom. In a 2007 weekly publication by CDC (47), the prevalence of CKD in the USA is
estimated at 14.5% of the adult population. The leading risk factors are diabetes, hypertension ,
glomerulonephritis and cystic kidney in that order. Diabetes and hypertension account for two
thirds of CKD cases.
Regionally, a prevalence study in a family practice population in Nigeria by Afolabi et al (48) is
the closest that CKD in Sub‐Saharan Africa has been investigated exhaustively. Accordingly,
12.4% of consecutive patients aged between 20 years and 74 years had CKD with demonstrable
35

association with modifiable risk factors namely hypertension, diabetes and abnormal waist‐hip
ratio. Available data from the South African society of nephrology (49) recognizes the high
prevalence of HIV (up to 25%) in some centres but low incidence of HIV‐related renal
dysfunction (including HIVAN) due to early mortality before CKD can manifest.
In a study to determine the prevalence of and risk factors for renal diseases in a cohort of
HAART‐naïve adults attending an HIV clinic in western Kenya, Wools‐Kaloustian et al (50)
recognized the existence of renal insufficiency in non‐daibetic, non‐hypertensive HIV patients
and recommended screening to allow for dose adjustments. There is no available data on the
prevalenceof CKD in the general Kenyan population. Borrowing from a recent Ugandan study
among HIV‐infected adults in the Home‐Based AIDS Care clinical trial by Philip et al (51), renal
dysfunction in advanced HIV disease improved by 16% after 2 years‐follow‐up while on HAART.
This change accompanied other variables such as weight gain and rise in the CD4 counts
Staging of the CKD participants was done as per NKF guidelines, using eGFRs derived from both
cystatin C and serum creatinine. As per eGFR‐cystatin C, 76% had stages 3 – 5 chronic kidney
disease while eGFR‐serum creatinine showed 70% in stages 3 – 5. This indeed answers one of
the study objectives: that there is differential staging of the CKD participants when the two
markers are used separately. There is a bias for serum cystatin C towards more severe renal
disease compared to serum creatinine. According to the KDIGO meeting of 2006 (52), the
prevalence of CKD (stages 3 – 5) in the USA, UK, Netherlands, Australia and China was 4.7%, 4.9,
5.3%, 11.2% and 2.53% respectively. In a study at the St Georges Hospital in London in 2006
[51], 17.7% of all acute medical emergencies were due to stages 3 – 5 CKD, underscoring the
need for clinical suspicion.
Correlative statistics in CKD patients in this study between serum cystatin C and serum
creatinine had an r value of 0.849 and a p value of 0.01 which is statistically significant. This
compares to recent comparative study between cystatin C and serum creatinine for detecting
renal dysfunction among South Indian type II diabetes mellitus by Viswanathan et al (53) showed
an r value of 0.5 and p value of <0.0001.
Correlation between cystatin C and eGFR‐cystatin C yielded an r value of ‐0.837 due to the
inverse relatioship. Comparison between serum creatinine and GFR‐serum creatinine yielded an
r value ‐0.678. In their study, Hoek et al (54) found that the correlation between cystatin C and
its derived eGFR (r =0.873) while serum creatinine and eGFR‐SCr yielded an r value of 0.876.
They concluded that cystatin C had a better correlation with eGFR compared to serum
creatinine.
36

CONCLUSION AND RECOMMENDATIONS
Conclusions
1. The reference ranges for blood donors aged 18 – 34 years for both serum cystatin C and
creatinine in this study were 0.8 ‐ 1.4 mg/L and 62 – 120 mol/L respectively and are
comparable in literature.
2. There is a difference in the staging of CKD patients using eGFR derived from serum cystatin
C and serum creatinine. Serum cystatin C had 76% of CKD patients with advanced disease
(stages III – V) compared to serum creatinine which had 70.7%. Therefore, eGFR derived
from cystatin C has a bias towards advanced disease.
3. The degree of agreement ( kappa value 0 .359) of the two markers is statistically
significant (p value – 0.001), meaning that both markers remain useful means of assessing
renal function. Given that no ‘gold standard’ was used, the sensitivity and specificty of
each marker could not be obtained.
Recommendations
1. A minimum report from the laboratory for all requests for renal function tests to include
eGFR as a useful prognostic indicator in line with NKF guidelines. This will enable
physicians to manage CKD patients better.
2. A study involving a larger sample size of blood donors is recommended. Further
stratification with sufficient numbers in each stratum would remove the bias of comparing
a relatively young reference group with a much older patient population.
3. A follow‐up comparative study involving a gold standard (e.g. inulin) for measured GFR to
be carried out to depict sensitivity and specificity serum cystatin C and serum creatinine.
This will enable wider usage of either of them for routine follow‐up of at‐risk and
confirmed CKD cases.
37
REFERENCES
1. US Renal Data System, USRDS 2002 annual data report: atlas of end‐stage renal disease in the
United States. Bethesda, MD: National Institute of Health, National Institute of Diabetes and
Digestive and Kidney Diseases, 2002.
2. National Kidney Foundation. K/DOQI clinical practice guidelines for chronic kidney disease:
evaluation, classification, and stratification. Kidney Disease Outcome quality Imitative. Am. J.
of Kidney Dis. 2002; 39:1 – 246.
3. Philip, D.M. The Kidney Clinical Chemistry in Diagnosis and Treatment 6th Edition Published by
Hodder Arnold 2005, pp 16 ‐ 18.
4. Cockcroft, D.W., Gault, M.H. Prediction of creatinine clearance serum creatinine. Nephrons
1976; 16: 31‐41.
5. Levey, A.S., Greene, T., Kusek, J.W., Beck, G.L. A simplified equation to predict glomerular
filtration rate from serum creatinine (Abstract). J. of Am. Soc. of Nephrologists 2000; 11:155A.
6. William, J.M., Stephen, K.B. The Kidney Clinical Chemistry 5th Edition Published by Mosby
2002, pp 73 – 74.
7. Stevens, L.A., Levey, A.S. Measurement of kidney function. Med. Clin. J. of N.A. 2005; 89:457‐
73.
8. McClellan, W.M., Knight, D.F., Karp H., Brown, W.W. Early detection and treatment of renal
disease in hospitalized diabetic and hypertensive patients: important differences between
practice and published guidelines. Am. J. of Kidney Dis. 1997; 29: 367‐75.
9. Jaffe, M. Uber den Niederschlag welchen Pikrinsäure in normalem Harn erzeugt and ueber
eine neue Reaction des Kreatinins. Z physiology Chem. 1886; 10: 391‐400.
10. Cook, J.H.G. Factors influencing the assay of creatinine. Ann. of Clin. Biochem. 1975; 12: 219‐
32.
11. Rigalleau, V. , Lasseur, C. , Perlemoine, C., Barthe, N. , Rafffaitin, C. , Chauveau, P., Combe, C.
,Gin, G. Cockcroft‐Gault formula is biased by body weight in diabetic patients with renal
impairment. Metabolism 2006; 55: 108‐112.
12. Perkins, B.A. , Nelson, R.G. , Ostrander, B.E. , Blouch, K.L. , Krolewski, A.S. , Myers, B.D.,
Warram, J.H. Detection of renal function decline in patients with diabetes and normal or
38

elevated GFR by serial measurements of serum cystatin c concentration: results of a 4‐year
follow‐up study. J. of Am. Soc. of Nephrologists, 2005; 16: 1404 – 1412.
13. MacIsaac, R.J. , Tsalamandris, C. , Thomas, M.C., Premaratne, E.S. , Smith, T.J. , Poona, A.,
Jenkins, M.A. , Retake, S.I. , Power, D.A. , Jorums, G. Estimating glomerular filtration rate in
diabetes: a comparison of cystatin C and creatinine‐based methods. Dialectologies 2006; 49:
1686 – 1689.
14. How to estimate GFR‐serum creatinine, serum cystatin C or equations? Clin Biochem 2007;
40 :153 ‐161
15. United States Renal data Systems. (www.usrds.org)
16. Brain J, Popovic T, Turk V, Borchart U, Machleidt W. Human cystatin, a new protein inhibitor
of cysteine proteinases. Biochem Biophs Res Comm 1984; 120: 631‐636.
17. Jung K. Low‐molecular‐mass proteins in serum and their relationship to the glomerular
filtration rate. The Nephron 1987; 47: 160‐168.
18. Grabb, A., Simonsen, O., Sturfelt, G., Truedsson, L., Thysell, H. Serum concentration of
cystatin C, factor D and ß2‐microglobulin as a measure of glomerular filtration rate. Acta.
Med. Scand. 1985; 218: 499‐503.
19. Simonsen, O., Grubb, A., Thysell, H. The blood serum concentration of cystatin C (gamma‐
trace) as a measure of the glomerular filtration rate. Scand Journal of Clin. Lab. Investigation
1985; 45: 97‐101.
20. Juliana, F., Ross, Jenny,D., Susan, E., Tett, Carl, M.J., Kirkpatrick. Diagnostic accuracy of
cystatin C compared to serum creatinine for the estimation of renal dysfunction in adults
and children‐ A meta‐analysis. Clin. Biochem. 2007; 40: 383‐391.
21. Harmoinen, A.P., Kouri, T.T., Wirta, O.R., Lehtimaki, T.J., Rantalaiho, V., Turjanmaa, V,M.
Evaluation of plasma cystatin C as a marker for glomerular filtration rate in patients with
type 2 diabetes. Clin. Nephr. 1999; 52(6): 363‐70.
22. Laterza, O.F., Price, C.P., Scott, M.G. Cystatin C: an improved estimator of glomerular
filtration rate? Clin Chem 2002; 48: 699 – 707.
39

23. David, M. Maahs, Lorraine, G. Ogden, Adam, K., Janet, K., Snell‐Bergeon, Gregory, L. K, Tomas
B., Marian, R. Serum cystatin C predicts progression of sub‐clinical coronary atherosclerosis
in individuals with Type 1 Diabetes. Diabetes, November 2007; 56: 2774‐2779.
24. Perkins, B.A., Krowleski, A.S. Early nephropathy in type 1 diabetes: a new perspective on who
will and will not progress. Curr Diab Rep 2005; 5: 455‐463.
25. Shlipak, M.G., Sarnak, M.J., Katz, R.L.F., Seliger, S.L., Newman, A.B., Siscovick, D.S., Stehmann‐
Breen, C. Cystatin C and the risk of death and cardiovascular events among elderly persons.
N Engl J Med 2005; 352: 2049 – 2060.
26. Woitas, R.P., Stoffel‐Wagner B., Flommersfeld S. Correlation of serum concentrations of
cystatin C and creatinine to inulin clearance in liver cirrhosis. Clin. Chem. 2000; 46: 712‐715.
27. Ylinen, E.A., Ala‐Houhala, M., Harmoinen, A.P., Knip, M. Cystatin C as marker for glomerular
filtration rate in pediatric patients. Ped. Nephr. 1999; 13: 506‐509.
28. Strevens, H., Wide‐Swensson D., Grubb, A. Serum cystatin C reflects glomerular endotheliosis
in normal, hypertensive and pre‐eclamptic pregnancies. Brit. J. of Gyn. 2003; 110: 825‐30.
29. Finney, H., Newman, D.J., Thakkar, H., Fell, J.M.E., Price, C.P. Reference ranges for plasma
cystatin C and creatinine measurements in premature infants, neonates and older children.
Arch. Dis. Children 2000; 82: 71‐75.
30. Cook, J.H.G. Factors influencing the assay of creatinine. Ann. Clin. Biochem. 1979; 12: 1148‐
51.
31. Rule, A.D., Bergstralh, E.J., Slezak, J.M., Bergert, J., Larson, T.S. Glomerular filtration rate
estimated by cystatin C among different clinical presentations. Kidn. Intern. 2006; 69: 399‐
405.
32. Grabb, A., Ulf, N., Jonas, B., Veronica, L., Bengt, R., Gunnar, S., Anders, C.,. Simple Cystatin C–
Based prediction equations for glomerular filtration rate compared with the Modification of
Diet in Renal Disease prediction equation for adults and the Schwartz and the Counahan–
Barratt prediction equations for children. Clin Chem 2005; 51: 1420‐1431.
33. Effect of Corticosteroid Therapy on serum cystatin C and ß2‐microglobulin concentrations.
Clin. Chem. 2002; 48: 1123‐1126.
40

34. Peter, W., Beat, S., Giatgen, A. Spinas, Christoph, S. Serum cystatin C is sensitive to small
changes in thyroid function. Clin. Chim. Acta 2003; 338: 87‐90.
35. Janice, S.C.C, Mohammed, S., Christopher, M.F., Peter, M.G. Cystatin C – A paradigm of
evidence‐based laboratory medicine. Clin Biochem Rev. May 2008; 29(2): 47 – 62.
36. Naicker, S. End‐stage renal disease in sub‐Saharan and South Africa. Kidn. Intern. Suppl. 2003;
83:S119‐22.
37. Remuzzi, G., Ruggenenti, P., Perico, N. Chronic renal diseases: reno‐protective benefits of
renin‐angiotensin system inhibition. Ann. of Internal Med. 2002; 136: 604‐15.
38. Will, G.H. ©2009; A New view of Statistics.
39. Maritim, M.C. Prevalence of peripheral arterial disease among chronic kidney disease at
Kenyatta National Hospital 2007; 31‐32.
40. Tietz Textbook of Clinical Chemistry and Molecular Diagnostics Edited by Carl A. Burtis,
Edward R. Ashwood, David E. Bruns. 4th Edition Published 1986. General consideration for
determination of reference limits; sample size calculation, pp 435‐36.
41. Central Bureau of Statistics in partnership with the Ministry of Health – Kenya (2003).
Summary of the findings of the 2003 Kenya Demographic and Health Survey (KDHS), KDHS;
3: 7 – 8.
42. Njeru, G.D. Prevalence of Cytomegalovirus antibodies in blood donors at National Blood
Transfusion Centre, Nairobi – Kenya. MMed Dissert 2008; 37.
43. Hazel, F., Newman, D.J., Christopher, P.P. Adult reference ranges for serum cystatin C,
creatinine and predicted creatinine clearance Ann. Clin. Biochem. 2000; 37: 49‐59.
44. Chiou, W.L., Hsu, F.H. Pharmacokinetics of creatinine in man and its implications in the
monitoring of renal function and in dosage regimen modifications in patients with renal
insuffieciency J Clin Pharmocol 1975; 15(5‐6): 427‐34
45. Levey, A.S., Atkins, R., Coresh, J., Cohen, E.P., Collins, A.J., Eckardt, K.U., Nahas, M.E., Jaber,
B.L., Jadoul, M., Levin, A., Powe, N.R., Rossert, J., Wheeler, D.C., Lameire, N., Eknoyan, G.
Chronic kidney disease as a global public health problem: Approaches and initiatives – a
position statement from Kidney Disease Improving Global Outcomes, International Society
of Nephrology 2007.
41

46. Kissmeyer, L., Kong, C., Cohen, J., Unwin, R.J., Woolfson, R.J., Neild, G.H. Community
nephrology: audit of screening for renal insufficiency in a high risk population. Nephrol Dial
Transplan 1999;14: 2150–5.
47. CDC MMWR Weekly, March 2007; 56(08): 161 – 168.
48. Afolabi, M.O., Abioye‐Kuteyi, E.A., Arogundade, F.A. Prevalence of chronic kidney
disease in a Nigerian family practice population SA Fam Pract 2009; 51 (2) :132‐137.
49. Medscape Today 2002; 3(2). Highlights from the South African Renal Society Congress:
Chronic Kidney Disease.
50. Wools‐Kaloustian, K., Samir, K.G., Eva, M., Owino‐Ong’or, W., John, S., Ryan, W.A., Jianzhao ,
S., Kirwa, K., Beth, E.Z., Mitchell, G. Renal disease in an antiretroviral‐naïve HIV‐infected
outpatient population in Western Kenya. Nephrol Dial Transplant 2007; 22(8): 2208 – 2212.
51. Philip, J.P., David, M.M., Jonathan, M., John, T.B., Robert, D., Willy, W., Amina, K., Kate, B.,
Paul, J.W. Antiretroviral therapy improves renal function among HIV‐infected Ugandans.
Kidney Int. 2008; 74(7): 925 – 929.
52. Grading Evidence and Recommendations for Clinical Practice Guidelines. A position
statement from KDIGO Kidn Intern 2006; 70.
53. Vishwanathan ,V., Snehalatha, C., Nair, M.B., Ramachandran, A. Comparative assessment for
cystatin C and creatinine for determining renal function. Indian J Nephrol 2005; 15:91 – 94.
54. Hoek, F.J., Frits, K.A.W., Raymond T.K. A comparison between cystatin C, plasma creatinine
and Cockcroft and Gault formula for the estimation of glomerular filtration rate. Nephrol Dial
Transplant 2003; 18: 2024 – 2031.
42
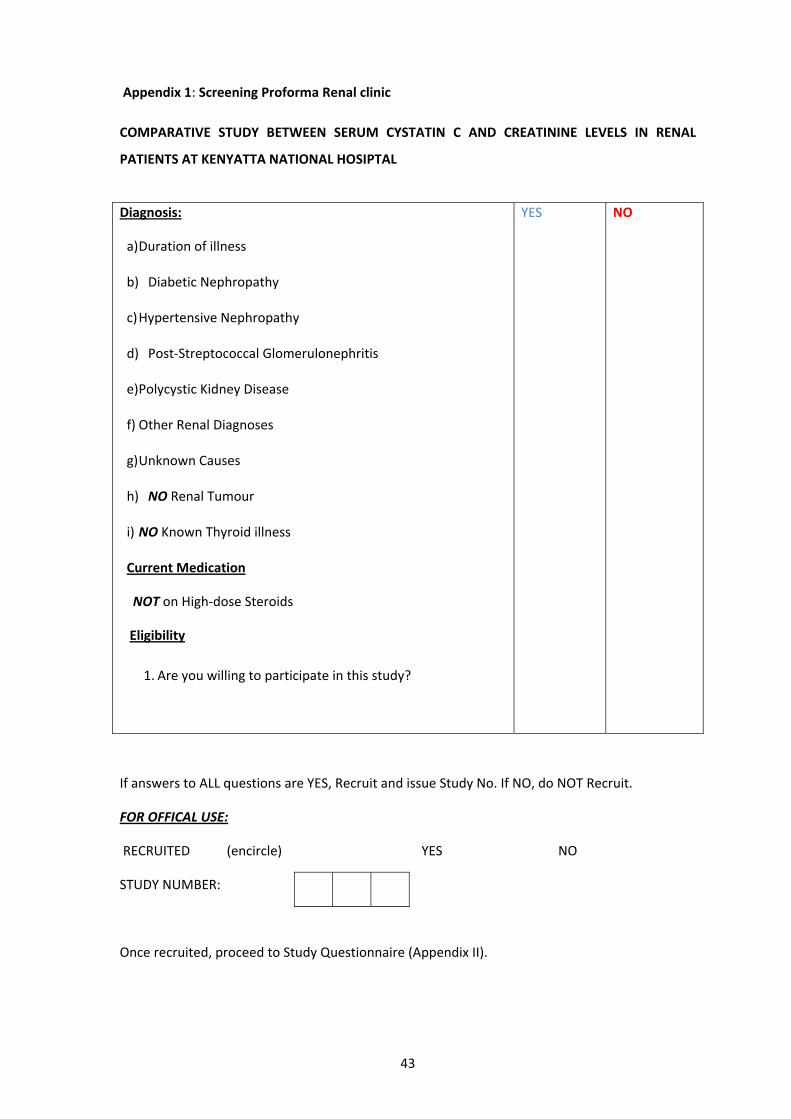
Appendix 1: Screening Proforma Renal clinic
COMPARATIVE STUDY BETWEEN SERUM CYSTATIN C AND CREATININE LEVELS IN RENAL
PATIENTS AT KENYATTA NATIONAL HOSIPTAL
Diagnosis:
a) Duration of illness
b) Diabetic Nephropathy
c) Hypertensive Nephropathy
d) Post‐Streptococcal Glomerulonephritis
e) Polycystic Kidney Disease
f) Other Renal Diagnoses
g) Unknown Causes
h) NO Renal Tumour
i) NO Known Thyroid illness
Current Medication
NOT on High‐dose Steroids
Eligibility
1. Are you willing to participate in this study?
YES NO
If answers to ALL questions are YES, Recruit and issue Study No. If NO, do NOT Recruit.
FOR OFFICAL USE:
RECRUITED (encircle) YES NO
STUDY NUMBER:
Once recruited, proceed to Study Questionnaire (Appendix II).
43
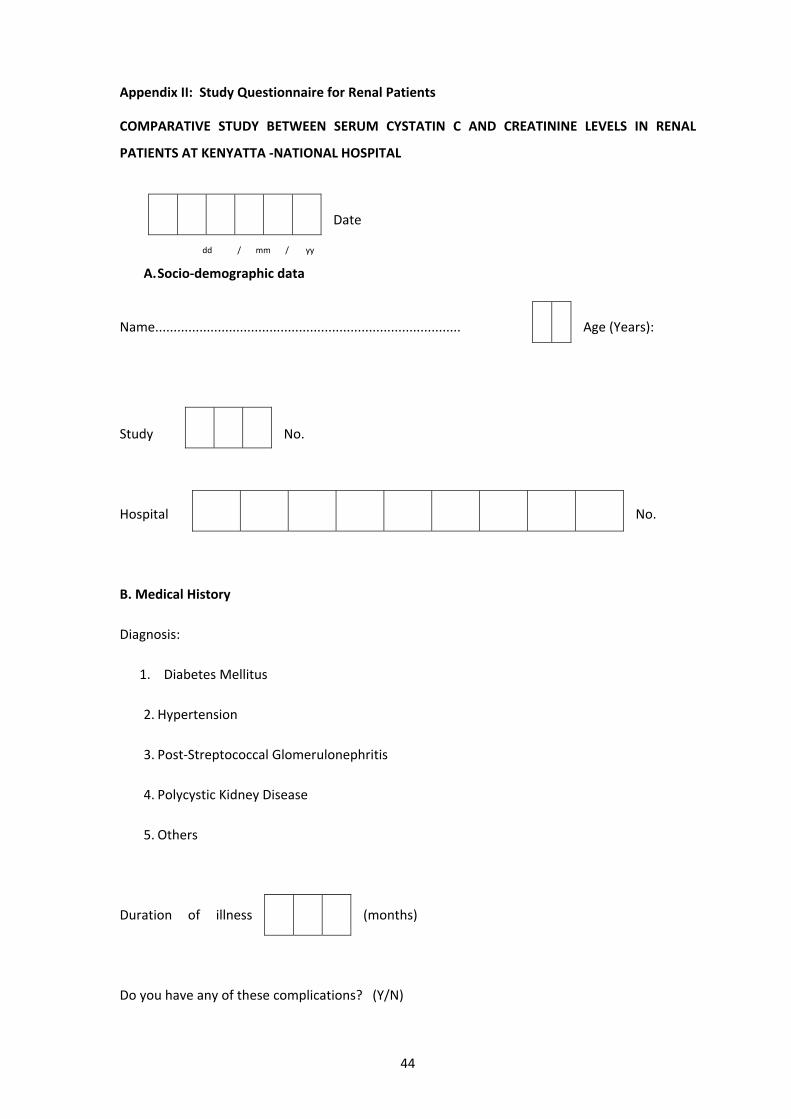
Appendix II: Study Questionnaire for Renal Patients
COMPARATIVE STUDY BETWEEN SERUM CYSTATIN C AND CREATININE LEVELS IN RENAL
PATIENTS AT KENYATTA ‐NATIONAL HOSPITAL
Date
dd / mm / yy
A. Socio‐demographic data
Name................................................................................... Age (Years):
Study No.
Hospital No.
B. Medical History
Diagnosis:
1. Diabetes Mellitus
2. Hypertension
3. Post‐Streptococcal Glomerulonephritis
4. Polycystic Kidney Disease
5. Others
Duration of illness (months)
Do you have any of these complications? (Y/N)
44

1. Heart failure
2. Renal failure
3. Stroke
4. Sub‐clinical Atherosclerosis
Medications currently on (Y/N)
1. ACE‐inhibitors
2. Anti‐hypertensives
3. Oral hypoglycemic agents
4. Antibiotics (specify)
5. Analgesics
6. Others (specify)
Family History
1. Do any of your relatives have similar symptoms? YES / NO
2. Have they been diagnosed with similar disease or any other renal disease?
YES / NO
3. If YES, relation to you is….
1° degree................... [Mother, father, brother, Child]
2° degree..................
PHYSICAL EXAMINATION
1. Height (m)
2. Weight (kg)
45

3. BMI
4. BP reading
Systolic BP mm/Hg Diastolic
BP mm/Hg
LABORATORY RESULTS (Renal Patients)
1. Serum Cystatin C (mg/L)
eGFR cystatin C (mL/min/1.73m2)
2. Serum creatinine ( µmol/L)
eGFR SCr (mL/min/1.
46

Appendix III: Study Explanation for Renal Patients
COMPARATIVE STUDY BETWEEN SERUM CYSTATIN C AND CREATININE LEVELS IN RENAL
PATIENTS AT KENYATTA NATIONAL HOSPITAL
Introduction and objectives of the study:
I am Dr. Mwaludindi D. M., a masters student in Human Pathology at the University of Nairobi
and conducting a study on the status of kidney function. The kidneys are a pair of organs that
carry out 3 keys functions: removal of body waste, maintain volume and composition of body
fluid and hormone production. In a number of disease processes, the functions of the kidney are
impaired progressively with eventual death unless intervened. A number of body compounds
can be used to diagnose kidney failure. My interest is in 2 compounds found in blood: creatinine
and cystatin C. The study aims to:
i. Compare cystatin C and serum creatinine levels in renal patients at Kenyatta National
Hospital.
ii. Determine the reference range for serum cystatin c among healthy blood donors in Kenyatta
National Hospital and in outreach campaigns by the National Blood Transfusion Services
teams.
Benefits and risks of the study to you:
By participating in it, you will benefit by:
o Having examinations and laboratory tests done on you at no added cost.
o A report on your renal function status being sent to your physician
o Receiving appropriate advice and intervention measures undertaken to stop/ reverse
progression of Chronic Kidney Disease.
Risk: You will be withdrawn venous blood 5mls from the antecubital vein. The needle prick will
be painful.
If you consent to participate as case, you will:
• Sign a consent form (Appendix IV).
• Answer a number of questions contained in the screening and study questionnaire
(Appendices I/II).
• Undergo a physical examination
47

Participation in this study is voluntary and you can withdraw at any time. Any information given
to us will remain confidential. You may ask me any questions regarding this study now and at
any time during the study.
In case you have questions relating to the study, kindly contact..
1. Dr. Mwaludindi D. Mchana 0722821192 (PI) or
2. Dr. Marybeth C. Maritim 0733729963 (Co‐Investigator)
3. The Secretary to the Ethical Committee KNH Tel. Nos. 2727260 Ext. 44102
48
Appendix IV: Consent Form for Renal Patients
COMPARATIVE STUDY BETWEEN SERUM CYSTATIN C AND CREATININE LEVELS IN RENAL
PATIENTS AT KENYATTA ‐NATIONAL HOSPITAL
I ................................................................ after reading and being explained to on the study
purpose by Dr. Mwaludindi D.M., do hereby give informed consent to participate in the
COMPARATIVE STUDY BETWEEN CYSTATIN C AND CREATININE IN RENAL PATIENTS AT KNH.
I am aware that i can withdraw from this study without having any benefits or quality of
management of my medical condition interfered with.
Signed: ....................................................................
Thumb print: .......................................................... Date: ……………………………………………..
Signature of questionnaire administrator (Dr Mwaludindi) ……………………………………
Witness: ……………………………………… Date: …………………………………………
49

Appendix V: Study Explanation for Blood Donors
COMPARATIVE STUDY BETWEEN SERUM CYSTATIN C AND CREATININE LEVELS IN RENAL
PATIENTS AT KENYATTA NATIONAL HOSPITAL
Introduction and objectives of the study:
I am Dr. Mwaludindi D. M., a masters student in Human Pathology at the University of Nairobi
and conducting a study on the status of kidney function. The kidneys are a pair of organs that
carry out 3 keys functions: removal of body waste, maintain volume and composition of body
fluid and hormone production. In a number of disease processes, the functions of the kidney are
impaired progressively with eventual death unless intervened. A number of body compounds
can be used to diagnose kidney failure. My interest is in 2 compounds: Creatinine and cystatin C.
The study aims to:
i. Compare cystatin C and serum creatinine levels in renal patients at Kenyatta National
Hospital.
ii. Determine the reference range for serum cystatin C among healthy blood donors in
Kenyatta National Hospital and in outreach campaigns by the National Blood Transfusion
Services teams.
Benefits and risks of the study to you:
Your participation will help improve the care of patients with impaired renal function and screening of at risk population.
There shall be no extra procedure over and above what the NBTS team does. Two needle‐pricks, one to find out the level of blood in your body (Hemoglobin), and the other for drawing blood for transfusion. Your blood will also undergo routine screening test (HIV, VDRL and HBsAg) as per blood donor card.
I humbly request you to join the study and allow for your pre‐donation blood sample of 10mls to have the cystatin C and creatinine levels established.
Participation in this study is voluntary and you can withdraw at any time. Any information given
to us will remain confidential. You may ask me any questions regarding this study now and at
any time during the study.
In case you have questions relating to the study, kindly contact..
1. Dr. Mchana 0722821192 (PI) or
2. Dr. Maritim C. Marybeth 0733729963 (Co‐Investigator)
3. The Secretary to the Ethical Committee KNH Tel. Nos. 2727260 Ext. 44102
50

Appendix VI: CONSENT FORM FOR HEALTHY BLOOD DONORS
I ........................................................................... after reading the consent explanation form as
explained by Dr. Mwaludindi D.M., do hereby give informed consent to participate in the
COMPARATIVE STUDY BETWEEN CYSTATIN C AND CREATININE IN RENAL PATIENTS AT KNH. The
specimen obtained from me shall be used to establish the reference range for the local
population. Prior to that, routine pre‐transfusion blood test for Hepatitis B, Syphilis and HIV will
be carried out and the results communicated to me.
I am also aware that i can withdraw from this study without having any compromise to my care
at KNH now and in future.
Signed: ....................................................................
Thumb print: ........................................... Date: ……………………………………………
Signature of questionnaire administrator (Dr Mwaludindi): ……………………………………
Witness: ……………………………………… Date: ……………………………..
51

Appendix VII: Blood Donors Screening/Study Questionnaire
(Adapted from KNH BLOOD DONOR RECORD CARD.)
Date of birth (dd/mm/yy)
Family Name:
Other Names:
Physical Address:
P.O. Box:
Town: …………………………………………….. Married (Y/N)
Sex (M/F) . Age Years
Phone numbers:
Home: ……………………………………….. Work: ………………………………………
MEDICAL HISTORY‐ Please tick appropriately if you have ever suffered from any of the following:
Allergy Anaemia Diabetes Epilepsy
Heart disease High blood pressure Jaundice
• If you have had any major operation in the previous two years, please state
52

which …………………………………………………………………………………………..
• If you suffer from any other disease NOT listed above, please state which ………………………………………………………………………………………………………..
• Remarks: ……………………………………………………………………………………………
Date Centre Tube no.
Are you willing to participate in this study? YES / NO. If Yes, recruit and issue study number.
FOR OFFICAL USE:
RECRUITED (encircle) YES NO
STUDY NUMBER:
LABORATORY RESULTS (Healthy Blood Donors)
1. Serum Cystatin C (mg/dL)
2(mL/min/1.73m )eGFR cystatin C
2. Serum creatinine (µmol/L)
eGFR SCr (mL/min/1.
53
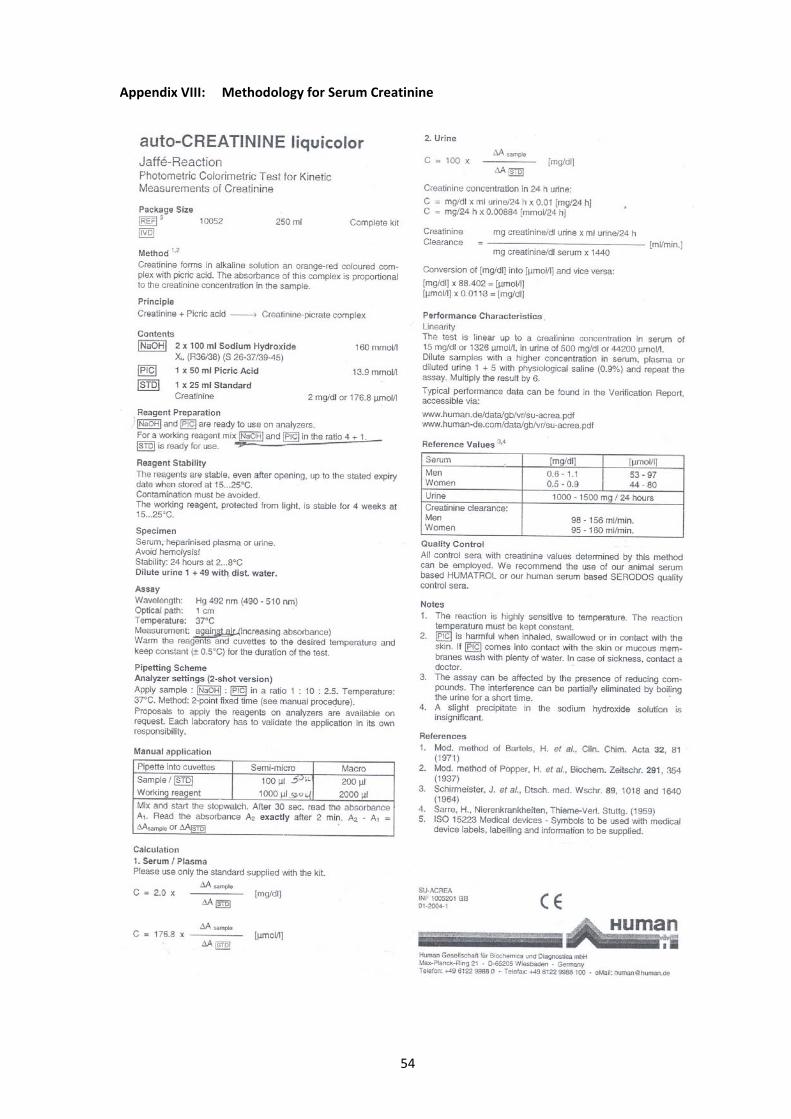
Appendix VIII: Methodology for Serum Creatinine
54

Appendix IX: Methodology for Serum Cystatin C
55
Appendix X: Approval Letter KNH/UoN Ethics and Research Committee
56

Appendix XI: Formulae for Estimation of Glomerular Filtration Rate
1. Estimated creatinine clearance rate (eC ) using Cockcroft‐Gault formula Cr
When serum creatinine is measured in µmol/L:
eC = (140 – Age) X Mass (in kilograms) X Constantcr Serum Creatinine ( in µmol/L) Where Constant is 1.23 for men and 1.04 for women.
2. Estimated GFR (eGFR) using Modification of Diet in Renal Disease (MDRD) formula
For creatinine in µmol/L:
1.154 ‐1.154 eGFR = 186 X 88.4 X Serum Creatinine X Age‐0.203 X [1.210 if Black] X [0.742 if Female]
3. Estimated GFR (eGFR) using the Mayo Quadratic formula When serum creatinine is measured in mg/dL: e GFR = exp(1.911 + 5.249/SCr ‐ 2.14/Scr^2 ‐ 0.00686 * Age ‐0.205 if female). If SCr < 0.8 mg/dL, use 0.8 for SCr
57

Appendix XII: Clearance from KNBTS Director, Nairobi
58


![Analytical study of three cystatin C assays and their ... · Cystatin C in serum is thus considered as a good marker of the glomerular filtration rate (GFR)[l]. As for creatinine,](https://static.fdocuments.in/doc/165x107/5e170fbec23381723378cf04/analytical-study-of-three-cystatin-c-assays-and-their-cystatin-c-in-serum-is.jpg)