Comparative Spectrum Occupancy Measurement Using Wireless ...
10
279 Comparative Spectrum Occupancy Measurement Using Wireless Waveform Generator Iwunna Chukwunonso Marcellinus, Eneh Joy Nnenna* Department of Electronic Engineering, University of Nigeria Nsukka Email: [email protected]; [email protected] *Corresponding author Abstract- Spectrum has become a scarce resource in wireless communication systems due to the high growth in demand for wireless devices and services. This therefore, poses a major threat on the available frequency spectrum and as a result, an efficient method for the utilisation of the limited frequency spectrum is required. The need to obtain the utilization rate of the used frequency bands gave rise to frequency occupancy measurements, which this research work aims to simulate and compare wideband and narrowband spectrum occupancy measurements. Result shows that wideband/general occupancy measurement which covers several frequency bands each having its own services and signal characteristics, is commonly focus at giving a rough occupancy of the spectrum, whereas in Narrowband occupancy measurements, the system can be optimized according to the signal present in the frequency bands as different signal have different characteristics and requires tailored measurement parameters in order to obtain the most accurate and reliable result. Keywords: Spectrum, Cognitive Radio, Narrowband, Wideband, Occupancy. 1. INTRODUCTION The spectrum from telecommunication point of view is a natural resource that has ranges of high and low frequency, but some certain ranges of that frequency do not really satisfy the need and purpose for communication, so the spectrum is limited. Since the early days of radio communications, wireless communication systems have been exploited under a fixed and strict spectrum management policy [1] where ranges of spectrum, separated by guard bands, have been allocated to particular radio standards or services over large geographical regions (e.g., whole countries), on a long-term basis (e.g., several years), and under exclusive exploitation licenses. But due the growing diversity in services and user behaviour in wireless communication technologies during the last years has posed a major challenge under this static regulatory regime, in the exhaustion/virtual scarcity of spectrum bands rather than the physical depletion of usable radio frequency with commercially attractive radio propagation characteristics. Cognitive radio (CR) stands to be a promising solution to the artificial scarcity generated due the static regulation policy, by introducing the opportunistic usage of frequency bands (SU) that are not heavily occupied by licensed/Primary users (LU) [2]. Therefore, spectrum occupancy information (in environments with various spectrum regulations, user profiles and habits, geographical characteristics and population densities), is needed in other to detect the unused band of the spectrum which is the main drive of the work, to compare the wideband and narrowband measurement techniques for efficient spectrum occupancy measurement. The rest of the paper is outlined as follows: In Section 2, we showed some extensive related works/researches about spectrum occupancy measurements. In Section 3, we mentioned the research objectives. In Section 4, we enumerate the parameters used to achieve this research. In Section 5, the proposed model and simulation results are presented and analysed. In Section 6, we finally give the conclusion and future work.
Transcript of Comparative Spectrum Occupancy Measurement Using Wireless ...

279
Comparative Spectrum Occupancy Measurement Using Wireless Waveform Generator
Iwunna Chukwunonso Marcellinus, Eneh Joy Nnenna*
Department of Electronic Engineering, University of Nigeria Nsukka Email: [email protected]; [email protected]
*Corresponding author Abstract- Spectrum has become a scarce resource in wireless communication systems due to the high growth in demand for wireless devices and services. This therefore, poses a major threat on the available frequency spectrum and as a result, an efficient method for the utilisation of the limited frequency spectrum is required. The need to obtain the utilization rate of the used frequency bands gave rise to frequency occupancy measurements, which this research work aims to simulate and compare wideband and narrowband spectrum occupancy measurements. Result shows that wideband/general occupancy measurement which covers several frequency bands each having its own services and signal characteristics, is commonly focus at giving a rough occupancy of the spectrum, whereas in Narrowband occupancy measurements, the system can be optimized according to the signal present in the frequency bands as different signal have different characteristics and requires tailored measurement parameters in order to obtain the most accurate and reliable result.Keywords: Spectrum, Cognitive Radio, Narrowband, Wideband, Occupancy. 1. INTRODUCTION
The spectrum from telecommunication point of view is a natural resource that has ranges of high and low frequency, but some certain ranges of that frequency do not really satisfy the need and purpose for communication, so the spectrum is limited. Since the early days of radio communications, wireless communication systems have been exploited under a fixed and strict spectrum management policy [1] where ranges of spectrum, separated by guard bands, have been allocated to particular radio standards or services over large geographical regions (e.g., whole countries), on a long-term basis (e.g., several years), and under exclusive exploitation licenses. But due the growing diversity in services and user behaviour in wireless communication technologies during the last years has posed a major challenge under this static regulatory regime, in the exhaustion/virtual scarcity of spectrum bands rather than the physical depletion of usable radio frequency with commercially attractive radio propagation characteristics. Cognitive radio (CR) stands to be a promising solution to the artificial scarcity generated due the static regulation policy, by introducing the opportunistic usage of frequency bands (SU) that are not heavily occupied by licensed/Primary users (LU) [2]. Therefore, spectrum occupancy information (in environments with various spectrum regulations, user profiles and habits, geographical characteristics and population densities), is needed in other to detect the unused band of the spectrum which is the main drive of the work, to compare the wideband and narrowband measurement techniques for efficient spectrum occupancy measurement. The rest of the paper is outlined as follows: In Section 2, we showed some extensive related works/researches about spectrum occupancy measurements. In Section 3, we mentioned the research objectives. In Section 4, we enumerate the parameters used to achieve this research. In Section 5, the proposed model and simulation results are presented and analysed. In Section 6, we finally give the conclusion and future work.

Iwunna Chukwunonso Marcellinus, Eneh Joy Nnenna/ Comparative Spectrum Occupancy Measurement Using Wireless Waveform Generator
280
2. RELATED WORKS To make the CR deployment successful in the near future, an effective quantitative measurement is essential to provide a detailed structure of the current spectrum usage and to identify the suitable and potential candidate bands for future Cognitive Radio access. Several research works have been done on spectrum occupancy measurement, which has mostly concerned wideband measurements (i.e., they covered multiple frequency bands), which is aimed at measuring average occupancies in different bands over a short, and extended time period. Some examples of spectrum occupancy studies in the context of DSA/CR has been performed in New York [3], Los Angeles [4], Germany [5], Auckland (New Zealand) [6], Singapore [7], Doha, Qatar [8], Bucharest, Romania [9], Amsterdam, Netherlands [10], Brno and some additional cities in the United States [11], and other areas in [12]–[14]. These wideband studies are often aimed in providing only a coarse estimate of the state of the spectrum, as parameters of the measurement setup are not specifically conditioned to detect specific signals in each band. However, wideband occupancy measurement studies are still useful for coarse evaluation of bands and identifying bands of interest for subsequent detailed studies. In addition to these wideband studies, there have been several focused measurement campaigns that aim at determining the use of certain frequency bands in detail. A lot of studies have been carried out in the ISM band, focusing on different aspects measurement parameters in order to produce the most reliable results [15]–[17], [18]. Under focused measurement other bands like public safety bands [19] and the cellular band 900 and 1800 MHz [20] are also considered.3. RESEARCH OBJECTIVE The aim of this work is to evaluate the availability of spectrum for wideband and narrowband occupancy measurement for cognitive radio: therefore, research objectives include
• To generate different wireless waveform signals (Spectrum)
• To examine the performance level of wide and narrow band measurement setup in obtaining the utilization rate/occupancy of the tailored spectrum.
• From the obtained result, to determine the measurement setup that best provides the most accurate and reliable spectrum occupancy measurement using MATLAB as a test bed.
4. PRELIMINARIES 4.1 Signal Types Generation for Occupancy Measurement There are two basic types of signal: analogy and digital. The bandwidth explains the properties of the signal. The relationship between the transmitted signal’s bandwidth and frequency resolution is an important aspect which has received little attention and though has resulted in extremely poor frequency resolution and hence in a very coarse spectrum occupancy measurement. For a given number of frequency points per span, the frequency bin size (i.e., the separation between two consecutively measured frequency points) increases as the frequency span becomes wider; this maintains a considerable rate as the bandwidth of the transmitted signal increases. This parameter when properly adjusted leads to higher spectrum occupancy rate.

281
Table 1. Bandwidths for the respective types of signal
Signal type Bandwidths of signal (KHz)
AM double sideband 9 or 10
AM signal sideband 2.4
FM broadcast signal 120
Videos carrier 120
GSM signal 300
UMTS signal 3840
LTE and Advance 20000 – 30370
DAB signal 1500
TETRA 30
Narrow-band FM radio 7.5 or 12
From table 1, different signal types with their bandwidth and characteristics were generated using MATLAB script (FM and AM signals) and wireless waveform generator in below section, which was introduced in matlab 2018b.
4.2 Frequency Measurement Frequency measurement means a process of making comparison between an unknown frequency and a known frequency (reference frequency). Fundamentally, all monitoring of frequency measurements is based on remote measurement, which has to be made with the aid of receivers. In order to obtain results that cannot be contested, the receivers should have the following properties: high input sensitivity, satisfactory image-frequency rejection low cross-modulation and intermodulation, proper input filters (pre-selector) to protect the frequency band used for measurement against unwanted frequencies, an external frequency standard input low phase noise of the internal oscillators either manual, remote controlled or automatic gain control transparent IF output for additional measurements. Spectrum Analyser System object displays the frequency spectrum of time-domain signals (spectral power) based on configured parameters. This scope supports variable-size input, which allows the input frame size to change. Frame size is the first dimension of the input vector. The number of input channels must remain constant. The wireless waveform generator app generates a waveform that you can transmit using a connected lab test instrument is an interactive tool for creating, impairing, visualizing, and exporting modulated waveforms. By default, the app-generated waveform has no filtering applied. The supported waveform types include OFDM, QAM, PSK, Sine wave, Bluetooth, WLAN, LTE, all can be used to generate modulated waveforms using their respective features. After generating a waveform, you can export it by selecting the desired options from “Export” in the Export section.

Iwunna Chukwunonso Marcellinus, Eneh Joy Nnenna/ Comparative Spectrum Occupancy Measurement Using Wireless Waveform Generator
282
5. PROPOSED AND MATLAB SIMULATION MODELS 5.1 Proposed Model Spectrum measurement setup should be able to detect, over a wide range of frequencies, a large number of transmitters of the most diverse nature, from narrow- to wide-band systems and from weak signals received near the noise floor to strong signals that may overload the receiving system.
Figure 1: Wireless Waveform Generator App
Figure 2: Basic model for spectrum occupancy measurement
Depending on how much information is available about the signal, different performance can be reached. However, in most general cases no prior information is available, so energy detection is the only possible method to determine the presence of a primary licence signal.

283
The radio signal y(t), received at the antenna is first filtered with a bandwidth, B, which is the band under consideration. The signal is then down-converted to baseband, and digitized (at a sampling frequency of 1/!!) before being sent to the detector.
Figure 3: The architecture of digital free band detector
The function of the detector has to perform is that of detecting signals in the presence of noise, which is stated at equation (1). These techniques are often evaluated using the probabilities of false alarm and probability of detection. These two probabilities can be defined as
!! = ! !!!!
……………………… . . (1)
!! = ! !!!!
………………………… . (2)
Threshold value decision: To detect whether a frequency is used by a licenced user, different sensing methods have been proposed. This provides different trade-offs between required sensing time, complexity and detection capabilities. For this research, Probability of False Alarm criterion (PFA) is adopted for setting of the threshold. The probability of false alarm (!!") (deciding the !!! channel !! to be occupied while the true state is not occupied) is defined as
(!!") = !!(! > !!") = 1 − !!(! ≤ !!")= 1 − !!(!!")…………… . (3) Where !! . Is the probability density function (PDF) of the noise with Gaussian distribution and !!(. ) is the cumulative distribution function (CDF). Therefore, for a given sub-band and a constant false alarm, !!" = ! the threshold value associated is
!!" = !!!! 1 − ! ………………………… . . (4)
Where !!" is the threshold value and !!!! is the inverse of the Gaussian cumulative distribution function.
Energy Detection: Energy detection computes the energy of the samples and compares it to a threshold. If the energy is higher than this threshold, the primary user signal is considered present; otherwise, the primary user is considered absent. The concept, shown in Figure 3, calculates the energy
Iwunna Chukwunonso Marcellinus, Eneh Joy Nnenna/ Comparative Spectrum Occupancy Measurement Using Wireless Waveform Generator
284
of the samples as the squared magnitude of the FFT averaged over the number of samples N. This is given by:
!!" = !! (! ! )!!!!! ………………… . . (5)
where N denotes the total number of received samples, and Y[n] denotes the nth received sample. The result of this computation is then compared to a predefined threshold to obtain the sensing decision. If that energy is above the threshold, the primary user is considered present; otherwise, the primary user is considered absent. This is expressed mathematically as
!!" < !!" !"#$%"& !"#$ !"#$%&,
!!" > !!" !"#$%"& !"#$ !"#$#%& Where !!" denotes the threshold that depends on the noise variance. All the channels within the entire measured band are taken into account when frequency band occupancy ! is determined. It is calculated as
! = !!! ………………………… . . (6)
Where !! is the number of measurement samples with a power level above the threshold and ! is the total number of measurement samples over the integration time.5.2 Matlab Simulation Model Figure 4 shows built model for spectrum occupancy measurement in the environment of Matlab/ Simulink 2018b
Figure 4: Spectrum Measurement Model in Matlab/Simulink
285
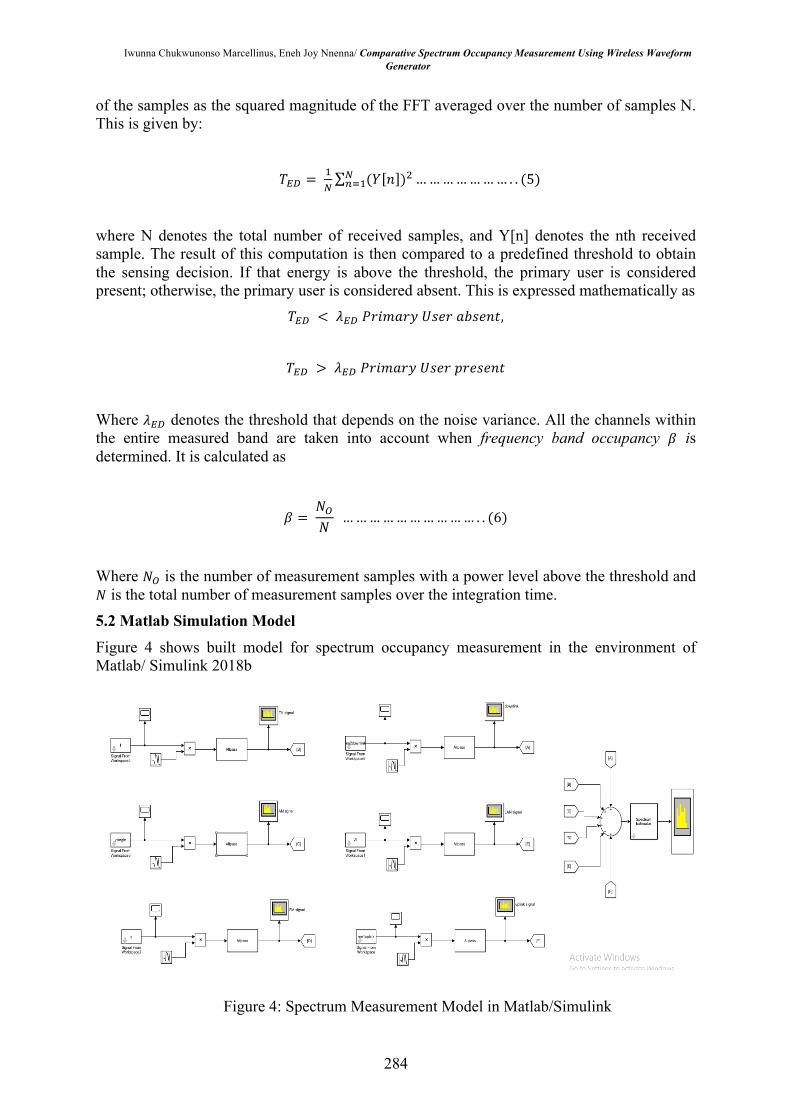
6. SIMULATION RESULTS AND COMPARATIVE ANALYSIS Various frequency block/span over which measurements are performed individually and their configurations are shown below table
Table 2: Measurement Band Plan and Resolutions
Frequency Range (MHz)
Frequency Span (MHz)
Detection type
Resolution bandwidth (MHz)
Time resolution (ns)
0-200 200 RMS 0.58594 0.0171
200-1000 800 RMS 11.72 85.33
1000-3000 2000 RMS 17.58 56.89
3000-4000 1000 RMS 11.72 85.33
0-4000 4000 RMS 46.88 21.33
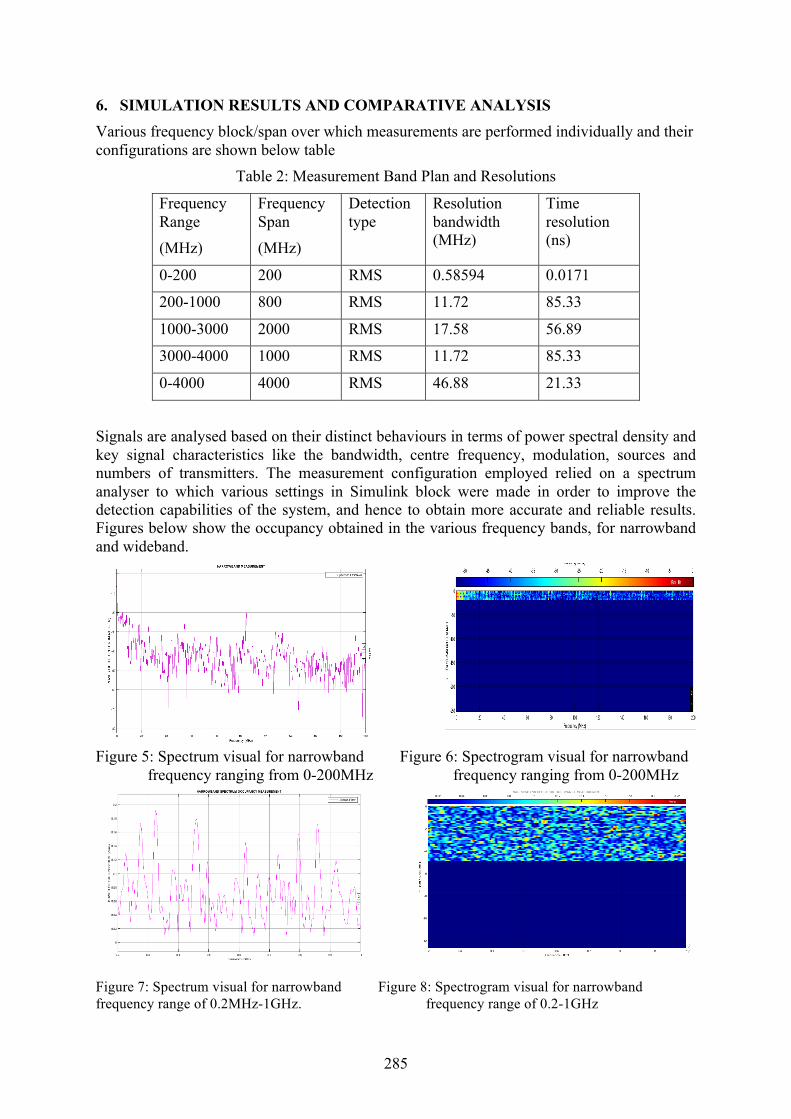
Signals are analysed based on their distinct behaviours in terms of power spectral density and key signal characteristics like the bandwidth, centre frequency, modulation, sources and numbers of transmitters. The measurement configuration employed relied on a spectrum analyser to which various settings in Simulink block were made in order to improve the detection capabilities of the system, and hence to obtain more accurate and reliable results. Figures below show the occupancy obtained in the various frequency bands, for narrowband and wideband.
Figure 5: Spectrum visual for narrowband Figure 6: Spectrogram visual for narrowband frequency ranging from 0-200MHz frequency ranging from 0-200MHz
Figure 7: Spectrum visual for narrowband Figure 8: Spectrogram visual for narrowband frequency range of 0.2MHz-1GHz. frequency range of 0.2-1GHz

Iwunna Chukwunonso Marcellinus, Eneh Joy Nnenna/ Comparative Spectrum Occupancy Measurement Using Wireless Waveform Generator
286
Figure 9: Spectrum visual for narrowband Figure 10: Spectrogram visual for narrowband frequency range of 1GHZ -3GHz frequency range of 1GHz-3GHz
Figure 11: Spectrum visual result for Figure 12: Spectrogram visual result for narrowband frequency range of 3-4GHz narrowband frequency range of 3-4GHz
Figure 13: Spectrum visual result for Figure 14: Spectrogram visual result for wideband frequency range of 0-4GHz wideband frequency range of 0-4GHz
6.2 ANALYSIS All the results obtained in figures (5-12) above depicts the actual activity levels of the various measured signals as the measurement settings are optimized to detect specific signals in each band based on the characteristics of the signals of interest and objective of the measurement. Simulation result obtained on wideband frequency range (see figure 13 and 14), shows a

287
coarse occupancy levels of the activities in the wide range, as the settings shown in table 1 are not optimised to detect specific signals. From the result, a high spectrum occupancy level was observed in figure 9 and 10 (Uplink of mobile cellular network) and also, an average occupancy level was experienced in ISM band (figure 11 and 12) but all these activities were not captured in figure 13 and 14 as the ranges are not designed to provide reliable, low power, secure wireless communication. The high-power signal like TV, FM and AM signal induce overload in the receiver, thus degrading the receiver’s performance by an increase in noise floor or presence of spurious signal which alters the receiver’s ability to detect the presence of low powered and weak signal. The narrow, sharp and large amplitude in figure 13 is associated with fixed transmitters with constant power indicating the presence of high-power signals. This study showed that the bandwidth and frequency span strongly affect the results, and both the resolution bandwidth of the measurement device and the analysis bandwidth should take the actual signal type into account. Due to the reasons discussed, it is highly recommended that narrowband measurement is conducted with a carefully designed measurement setup that is appropriate for the specific spectrum and specific purpose for which the measurement is being taken for a more accurate and reliable result.
7 CONCLUSIONS
From the obtained result on comparing the spectrum utilization rate of the channel or band between wideband and narrowband occupancy measurement, simulation shows that wideband measurement often provides a rough estimate of the spectrum as measurement systems are not optimised to detect specific signals in each band. While narrowband which has prior information on the bandwidth and signal characteristics (modulation, shape, centre frequency) required to obtain more reliable results.
8 RECOMMENDATION
1. Survey to obtain more complete knowledge about the spectrum use such as identification of nearby users and radio interfaces in the band. Example: discrimination of WLAN, ZigBee and Bluetooth signals.
2. Optimize security and energy efficiency aspect in cognitive radio
REFERENCES [1] F. C. Commission. (2003), “Facilitating opportunities for flexible, efficient and
reliable spectrum use employing cognitive radio technologies notice of proposed rulemaking and order,” 2000.
[2] G. Q. Mitola J. and Maguire, “Cognitive Radio: Making Software Radios More Personal,” IEEE Access, vol. 4, pp. 13–18, 1999.
[3] M. a Mchenry, D. McCloskey, and G. Lane-Roberts, “Spectrum Occupancy Measurements Location 4 of 6: Republican National Convention, New York, August 30, 2004-September 3, 2004, Revision 2,” pp. 1–109, 2005.
[4] F. H. Sanders, B. J. Ramsey, and V. S. Lawrence, “Broadband Spectrum Survey at Los Angeles, California,” no. May, 1997.

Iwunna Chukwunonso Marcellinus, Eneh Joy Nnenna/ Comparative Spectrum Occupancy Measurement Using Wireless Waveform Generator
288
[5] M. Wellens and M. Petri, “Lessons Learned from an Extensive Spectrum Occupancy Measurement Campaign and a Stochastic Duty Cycle Model.”
[6] R. I. C. Chiang, G. B. Rowe, and K. W. Sowerby, “A Quantitative Analysis of Spectral Occupancy Measurements for Cognitive Radio,” pp. 3016–3020, 2007.
[7] H. Islam et al., “Spectrum Survey in Singapore: Occupancy Measurements and Analyses.”
[8] K. A. Qaraqe, H. Celebi, A. Gorcin, A. El-saigh, H. Arslan, and M. Alouini, “Empirical Results for Wideband Multidimensional Spectrum Usage,” pp. 1262–1266.
[9] A. Mar, I. Marcu, and I. Marghescu, “Spectrum Occupancy in an Urban Environment: A Cognitive Radio Approach,” pp. 25–29, 2010.
[10] R. Schiphorst and C. H. Slump, “Evaluation of Spectrum Occupancy in Amsterdam Using Mobile Monitoring Vehicles,” 2010.
[11] A. M. Wyglinski, “A Quantitative Assessment of Wireless Spectrum Measurements for Dynamic Spectrum Access,” 2009.
[12] M. Wellens, J. Riihijärvi, and P. Mähönen, “Empirical time and frequency domain models of spectrum use,” Phys. Commun., vol. 2, no. 1–2, pp. 10–32, 2009.
[13] V. Kone, L. Yang, X. Yang, B. Y. Zhao, and H. Zheng, “The Effectiveness of Opportunistic Spectrum Access: A Measurement Study,” pp. 1–12, 2012.
[14] S. Yin, D. Chen, S. Member, and Q. Zhang, “Mining Spectrum Usage Data: A Large-Scale Spectrum Measurement Study,” vol. 11, no. 6, pp. 1033–1046, 2012.
[15] J. J. Lehtomäki, R. Vuohtoniemi, and K. Umebayashi, “On the Measurement of Duty Cycle and Channel Occupancy Rate,” vol. 31, no. 11, pp. 2555–2565, 2013.
[16] M. Matinmikko, M. Mustonen, M. Höyhtyä, T. Rauma, H. Sarvanko, and A. Mämmelä, “Distributed and Directional Spectrum Occupancy Measurements in the 2.4 GHz ISM Band,” pp. 976–980, 2010.
[17] M. Höyhtyä, J. Lehtomäki, J. Kokkoniemi, M. Matinmikko, and A. Mämmelä, “Measurements and Analysis of Spectrum Occupancy with Several Bandwidths,” pp. 4682–4686, 2013.
[18] Vladimir A. Daniel Denkovski, Mihajlo Pavloski, “Parameter Setting for 2.2GHz ISM spectrum Measurement,” pp. 3–7, 2010.
[19] T. M. Taher, R. B. Bacchus, K. J. Zdunek, and D. A. Roberson, “Dynamic Spectrum Access Opportunities for Public Safety in Land Mobile Radio Bands,” pp. 355–359, 2011.
[20] O. Holland, P. Cordier, M. Muck, L. Mazet, C. Klöck, and T. Renk, “Spectrum Power Measurements in 2G and 3G Cellular Phone Bands during the 2006 Football World Cup in Germany,” pp. 575–578, 2007.