Comparative Report Pacific Region Electricity Bills - … Price Comparison... · Guam Power...
21
Comparative Report Pacific Region Electricity Bills June 2015
Transcript of Comparative Report Pacific Region Electricity Bills - … Price Comparison... · Guam Power...

Comparative Report
Pacific Region Electricity Bills
June 2015

Utilities Regulatory Authority – Pacific Region Electricity Bills Comparison Report 2015, June 2015 Page 2 of 21
Letter from the CEO
This is the third report of the Utilities Regulatory Authority (URA) on electricity bills comparisons for the small pacific island countries and territories.
It is a challenging but useful exercise to gather, compile and disseminate current energy pricing. Information could be used to observe trends and major factors influencing electricity prices. Our previous reports were generally well-received with positive feedback from Government officials, development agencies and utilities, thus encouraging the URA to continue this exercise.
This report is designed from the consumer standpoint, computing the total bill a consumer pays, including the costs related to energy use, fixed charges and all applicable taxes. In contrast, most studies are performed from the utility perspective, capturing generation, distribution and supply fixed and variable costs, return on investments or profits, but not necessarily reflecting the total retail price paid by the customers.
Section 4 of this report illustrates the measurement of tariffs over time. The aim is to track the impact of regulatory programs including subsidy regime, energy infrastructure development, renewable energy contribution and efficiency efforts across region, and measure their combined impact on ultimate consumer bills. As the region is dependent on diesel fuel for at least the base load, we have flagged the component of diesel in the generation mix for each utility, to provide some reference point for their ranking in the cost index.
To study comparability in the current bills, we have used the spot currency exchange rates in March 2015, since the trend in rankings is only meaningful by holding exchange rates constant at the last version of the report.
This year’s Bill comparison study is marked by a sharp drop in raw fuel prices in the global markets during the second half of 2014. The Electricity bill comparison report captures the fuel prices resulting in significant decrease in consumer energy prices across the region. However due to transportation and logistics of supply chain to the pacific islands, the timing of the impact was varied and not immediate. Delays in price drop was observed and attributable to the transportation and frequency of supply differing for each country based on the distance from the port of origin, supply route, the local demand (volumes) and storage capacities. Another effect that was measured in Vanuatu and is reflected in this report was the appreciation of US dollar against local currencies for some countries in the region including Vanuatu, negating somewhat the positive effects of diesel price drops as diesel and other derivative products are priced in US dollar.
I hope that this report is of some value to those interested in the electricity pricing in the Pacific island region, and take this opportunity to thank all the professionals involved, the regulatory agencies and electricity companies who assisted our URA team in gathering the data.
I want to thank Olivier Fernandez, our Principal Finance Specialist who is the author of this report and who designed and developed this Regional Bill comparison study in 2013, and Maureen Malas who has assisted in this effort.
I welcome any suggestions to improve on this analysis and comparison report.
Sincerely,
Hasso Bhatia, PhD
CEO, Utility Regulatory Authority of Vanuatu
Utilities Regulatory Authority – Pacific Region Electricity Bills Comparison Report 2015, June 2015 Page 3 of 21
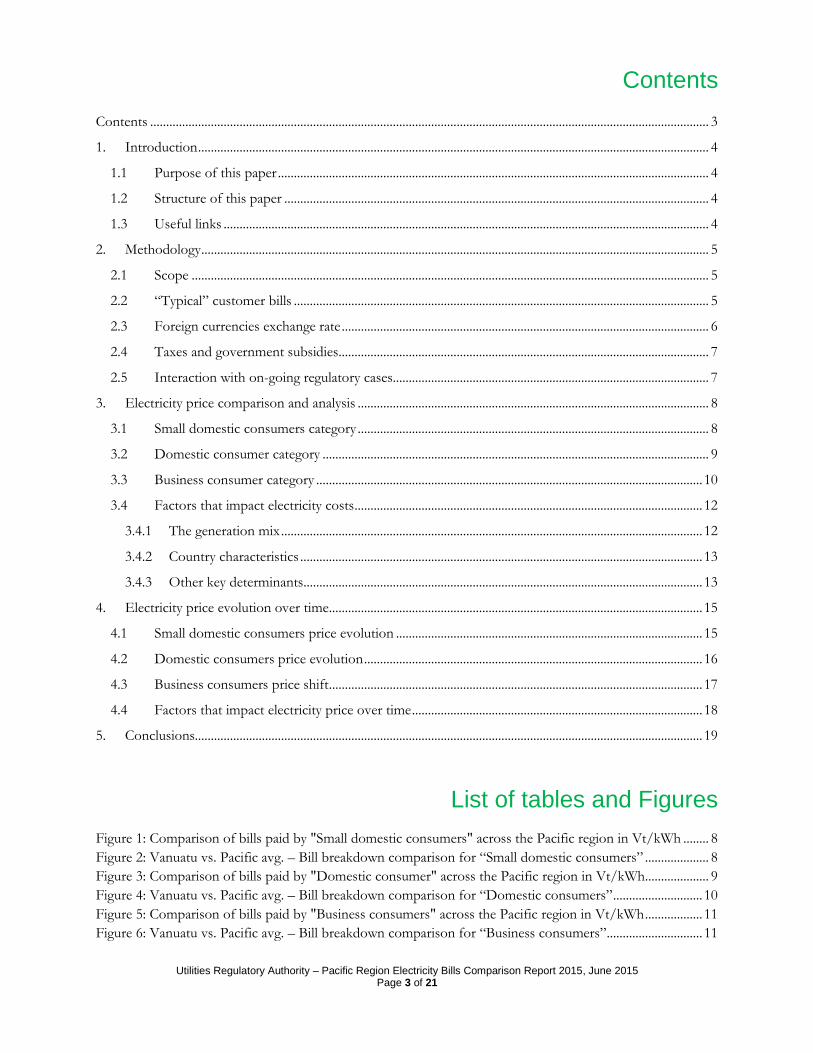
Contents
Contents ............................................................................................................................................................................... 3
1. Introduction ................................................................................................................................................................ 4
1.1 Purpose of this paper ....................................................................................................................................... 4
1.2 Structure of this paper ..................................................................................................................................... 4
1.3 Useful links ........................................................................................................................................................ 4
2. Methodology ............................................................................................................................................................... 5
2.1 Scope .................................................................................................................................................................. 5
2.2 “Typical” customer bills .................................................................................................................................. 5
2.3 Foreign currencies exchange rate ................................................................................................................... 6
2.4 Taxes and government subsidies .................................................................................................................... 7
2.5 Interaction with on-going regulatory cases................................................................................................... 7
3. Electricity price comparison and analysis .............................................................................................................. 8
3.1 Small domestic consumers category .............................................................................................................. 8
3.2 Domestic consumer category ......................................................................................................................... 9
3.3 Business consumer category ......................................................................................................................... 10
3.4 Factors that impact electricity costs ............................................................................................................. 12
3.4.1 The generation mix .................................................................................................................................... 12
3.4.2 Country characteristics .............................................................................................................................. 13
3.4.3 Other key determinants ............................................................................................................................. 13
4. Electricity price evolution over time ..................................................................................................................... 15
4.1 Small domestic consumers price evolution ................................................................................................ 15
4.2 Domestic consumers price evolution .......................................................................................................... 16
4.3 Business consumers price shift ..................................................................................................................... 17
4.4 Factors that impact electricity price over time ........................................................................................... 18
5. Conclusions............................................................................................................................................................... 19
List of tables and Figures
Figure 1: Comparison of bills paid by "Small domestic consumers" across the Pacific region in Vt/kWh ........ 8
Figure 2: Vanuatu vs. Pacific avg. – Bill breakdown comparison for “Small domestic consumers” .................... 8
Figure 3: Comparison of bills paid by "Domestic consumer" across the Pacific region in Vt/kWh.................... 9
Figure 4: Vanuatu vs. Pacific avg. – Bill breakdown comparison for “Domestic consumers” ............................ 10
Figure 5: Comparison of bills paid by "Business consumers" across the Pacific region in Vt/kWh .................. 11
Figure 6: Vanuatu vs. Pacific avg. – Bill breakdown comparison for “Business consumers” .............................. 11

Utilities Regulatory Authority – Pacific Region Electricity Bills Comparison Report 2015, June 2015 Page 4 of 21
1. Introduction
1.1 Purpose of this paper
The aim of this paper is to provide a comparison of electricity prices paid by customers in Vanuatu with
different countries across the Pacific island region. Data is based on publicly available information on
electricity rates for different utilities and includes all applicable taxes and fees.
The methodology used in this report is the same as used in earlier reports. That is comparison of the total
cost of electricity for certain given levels of consumption and by major customer categories. This avoids
differences in country-specific average or typical levels of consumption and customer mix when comparing
average prices across countries.
Quality of service, availability, and reliability of service also vary widely between electricity suppliers across the
Pacific. These factors have not been considered in this report.
1.2 Structure of this paper
This paper is structured into the following sections:
Chapter 2, ‘Methodology’, describes the approach used to compare the cost of electricity services
across the Pacific region.
Chapter 3, ‘Electricity price comparison and analysis’, provides a comparison of electricity bills
across the Pacific region and gives summary conclusions.
Chapter 4, ‘Electricity price evolution’, shows how the tariffs have changed and trends in energy
prices across the region since July 2014, time of our last release.
1.3 Useful links
Readers of this report may find it useful to consult the following sources:
Fiji Electricity Authority: www.fea.com.fj
Palau Public Utilities Corporation: http://www.ppuc.com
American Samoa Power Authority: http://www.aspower.com
PNG Power Ltd.: http://www.pngpower.com.pg
EEC New-Caledonia: http://www.eec.nc/
Tuvalu Electricity Corporation: http://www.tectuvalu.tv
Republic of Kiribati Island report series: www.climate.gov.ki
Rep – 5 : http://www.rep5.eu
Marshalls Energy Company: http://mecrmi.net
Cook Islands energy provider: www.teaponga.com
Tonga Power Ltd.: http://www.tongapower.to
FSM-Chuuck Public Utilities Corp.: http://www.cpuc.fm
Guam Power Authority: http://guampowerauthority.com
Vanuatu: www.ura.gov.vu

Utilities Regulatory Authority – Pacific Region Electricity Bills Comparison Report 2015, June 2015 Page 5 of 21
2. Methodology
This section describes the methodology used to compare the Pacific region electricity costs, the analysis and findings presented in this report. Each utility included in the survey charges different prices for different categories of customer, and for different levels of consumption. Typical pricing structures include a mixture of monthly fixed charge and per-kWh charge which may vary with consumption within the category, , as well as any applicable taxes and other fees. Therefore this report is based on a comparison of bills, using three typical customer consumption categories across utilities in the Pacific region. There is no detailed examination of factors such as quality, availability, or reliability of service. These factors vary widely across the electricity utilities in the Pacific, and should be taken into account when considering the price levels. Another factor that influences the cost of electricity is the method of generation. Each utility has a different mix of generation sources, which heavily influences the cost of electricity. Generation methods are not compared in this report. However diesel generation in total output for a utility is flagged for better understanding of price differences.
2.1 Scope
Information from electricity utilities in 25 different islands and territories in the Pacific region had been collected and reviewed. Tariff information published by regulatory agencies or the utilities was used to calculate customer bills based on typical consumption levels for three different customer categories. All applicable taxes and fees were included, representing the total price of electricity to customers in each country and territories.
2.2 “Typical” customer bills
In order to compare electricity suppliers using different customer categories and tariff structures, “typical”
bills for three customer categories have been estimated. These represent three main customer categories in
Vanuatu:
“Small domestic consumers” are households that only use small amounts of electricity. There are over 7,000 customers of this type in Vanuatu, with an average consumption of 60kWh per month;
“Domestic consumers” are non-commercial customers that have moderate electricity consumption. There are approximately 5,000 customers of this type in Vanuatu, with an average consumption of 300 kWh per month;
“Business consumers” are commercial and industrial customers. There are approximately 1,000
customers of this type in Vanuatu. Consumption levels vary widely, so for this analysis we have
assumed a “typical” consumption level to be 10MWh (10,000kWh) per month, on a 100kVA
connection. As certain countries monitor the actual demand and charge the consumers based on
their monthly peak use instead of subscribed capacity, to make comparable analysis, we assumed that
the consumer will use a constant load of 100kVA and be charged accordingly. For customers of this
size, the connection could be either low voltage or high voltage. The costs of both options are shown
for Vanuatu although customers would be high voltage, but connections in other countries are
assumed to be low voltage three-phase connection in a 190v to 415v voltage range depending on the
country. High voltage tariffs are excluded from the scope of our study as they are structured in a

Utilities Regulatory Authority – Pacific Region Electricity Bills Comparison Report 2015, June 2015 Page 6 of 21
more complex way, with different rates for day/night consumption, making comparisons more
difficult.
The characteristics of each “typical” customer category used in this report are summarized in the table
below:
Table 1: Typical customer bill definitions
Small domestic customer Consumption per month 60 kWh
Subscribed capacity 1.1 kVA
Other low voltage
Consumption per month 300 kWh
Subscribed capacity 3.3 kVA
Business customer
Consumption per month 10,000 kWh
Subscribed capacity 100 kVA
Power factor conversion
Cos phi 0.85
As some energy suppliers use kW instead of kVA to calculate the fixed charge billed for subscribed capacity,
we used an average power factor rate of |cos φ|=0.85 to convert kW into kVA.
Whenever there was an option allowing customers to choose between different offers and rates, we picked
the cheapest comparable option according to our selection criteria. Note that these customer categories are
assumed not to have access to time of day tariffs, which simplified the comparison by avoiding the need to
estimate the spread of load across day/night hours.
2.3 Foreign currencies exchange rate
Among the electricity suppliers included in this comparison, there are sixteen nations and ten different
currencies. The fluctuation of currencies impacts the results of the tariff comparison. Since this exercise is
about comparing the cost of electricity at a given point in time, and across time, a spot exchange rate has been
used from a single source to convert all foreign currencies into Vatu, on the 15th of the month of the
corresponding billing period. In order to avoid currencies fluctuation impact and make our 2015 analysis
comparable to the previous report, billing amounts collected from the previous release have been adjusted
based on current exchange rates. Countries’ respective rankings were kept identical though.
Utilities Regulatory Authority – Pacific Region Electricity Bills Comparison Report 2015, June 2015 Page 7 of 21
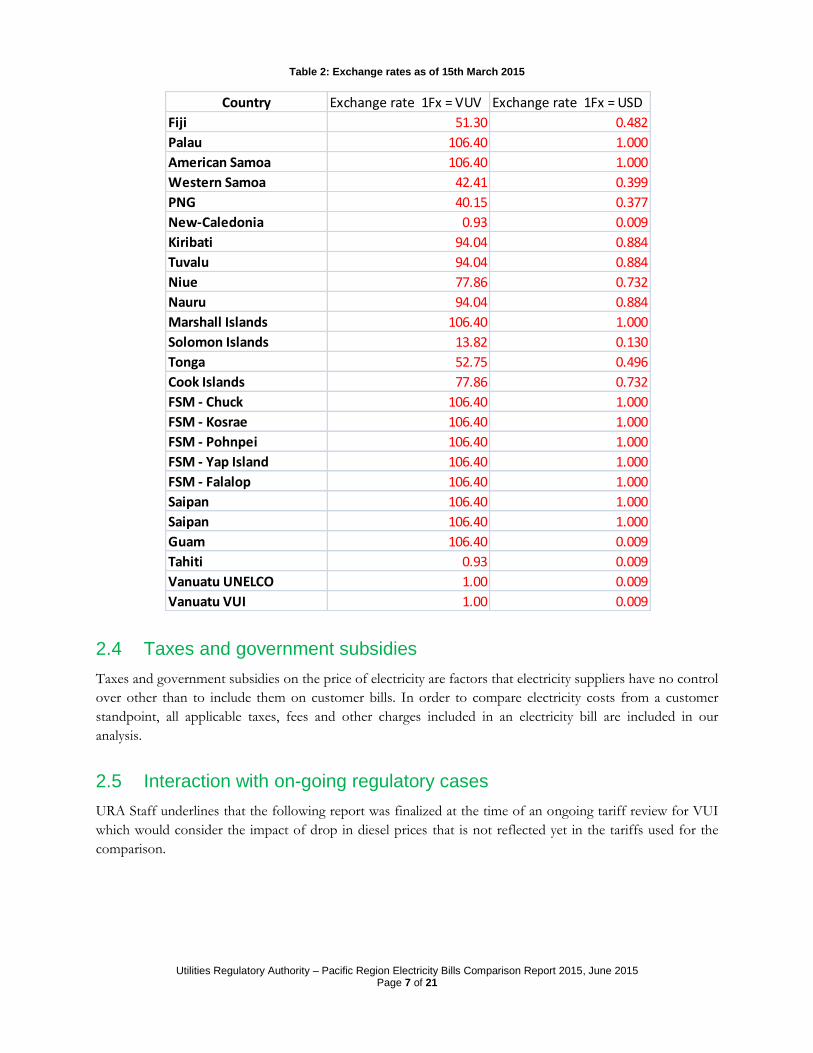
Table 2: Exchange rates as of 15th March 2015
2.4 Taxes and government subsidies
Taxes and government subsidies on the price of electricity are factors that electricity suppliers have no control
over other than to include them on customer bills. In order to compare electricity costs from a customer
standpoint, all applicable taxes, fees and other charges included in an electricity bill are included in our
analysis.
2.5 Interaction with on-going regulatory cases
URA Staff underlines that the following report was finalized at the time of an ongoing tariff review for VUI
which would consider the impact of drop in diesel prices that is not reflected yet in the tariffs used for the
comparison.
Country Exchange rate 1Fx = VUV Exchange rate 1Fx = USD
Fiji 51.30 0.482
Palau 106.40 1.000
American Samoa 106.40 1.000
Western Samoa 42.41 0.399
PNG 40.15 0.377
New-Caledonia 0.93 0.009
Kiribati 94.04 0.884
Tuvalu 94.04 0.884
Niue 77.86 0.732
Nauru 94.04 0.884
Marshall Islands 106.40 1.000
Solomon Islands 13.82 0.130
Tonga 52.75 0.496
Cook Islands 77.86 0.732
FSM - Chuck 106.40 1.000
FSM - Kosrae 106.40 1.000
FSM - Pohnpei 106.40 1.000
FSM - Yap Island 106.40 1.000
FSM - Falalop 106.40 1.000
Saipan 106.40 1.000
Saipan 106.40 1.000
Guam 106.40 0.009
Tahiti 0.93 0.009
Vanuatu UNELCO 1.00 0.009
Vanuatu VUI 1.00 0.009
Utilities Regulatory Authority – Pacific Region Electricity Bills Comparison Report 2015, June 2015 Page 8 of 21
3. Electricity price comparison and analysis
3.1 Small domestic consumers category
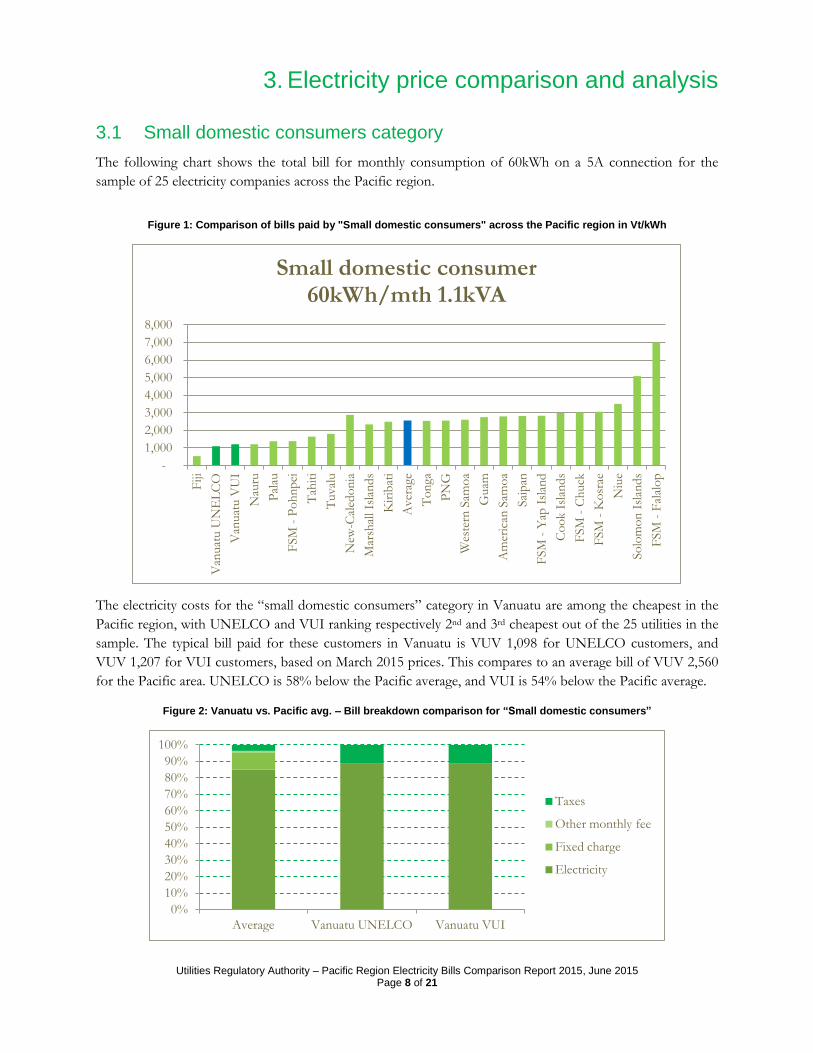
The following chart shows the total bill for monthly consumption of 60kWh on a 5A connection for the
sample of 25 electricity companies across the Pacific region.
Figure 1: Comparison of bills paid by "Small domestic consumers" across the Pacific region in Vt/kWh
The electricity costs for the “small domestic consumers” category in Vanuatu are among the cheapest in the
Pacific region, with UNELCO and VUI ranking respectively 2nd and 3rd cheapest out of the 25 utilities in the
sample. The typical bill paid for these customers in Vanuatu is VUV 1,098 for UNELCO customers, and
VUV 1,207 for VUI customers, based on March 2015 prices. This compares to an average bill of VUV 2,560
for the Pacific area. UNELCO is 58% below the Pacific average, and VUI is 54% below the Pacific average.
Figure 2: Vanuatu vs. Pacific avg. – Bill breakdown comparison for “Small domestic consumers”
-
1,000
2,000
3,000
4,000
5,000
6,000
7,000
8,000
Fiji
Van
uat
u U
NE
LC
O
Van
uat
u V
UI
Nau
ru
Pal
au
FSM
- P
oh
np
ei
Tah
iti
Tuval
u
New
-Cal
edo
nia
Mar
shal
l Is
lan
ds
Kir
ibat
i
Aver
age
To
nga
PN
G
Wes
tern
Sam
oa
Guam
Am
eric
an S
amo
a
Sai
pan
FSM
- Y
ap I
slan
d
Co
ok I
slan
ds
FSM
- C
huck
FSM
- K
osr
ae
Niu
e
So
lom
on
Isl
and
s
FSM
- F
alal
op
Small domestic consumer 60kWh/mth 1.1kVA
0%
10%
20%
30%
40%
50%
60%
70%
80%
90%
100%
Average Vanuatu UNELCO Vanuatu VUI
Taxes
Other monthly fee
Fixed charge
Electricity
Utilities Regulatory Authority – Pacific Region Electricity Bills Comparison Report 2015, June 2015 Page 9 of 21
The comparison between Vanuatu and the Pacific area shows that a higher proportion of the electricity bill is
made up of Government taxes in Vanuatu. This consists of 12.5% VAT charged on all electricity bills,
compared to a Pacific average of 4% tax.
There are no fixed charges for this particular consumer category in Vanuatu, compared to 10% fixed charges
and other fees on average across the Pacific.
3.2 Domestic consumer category
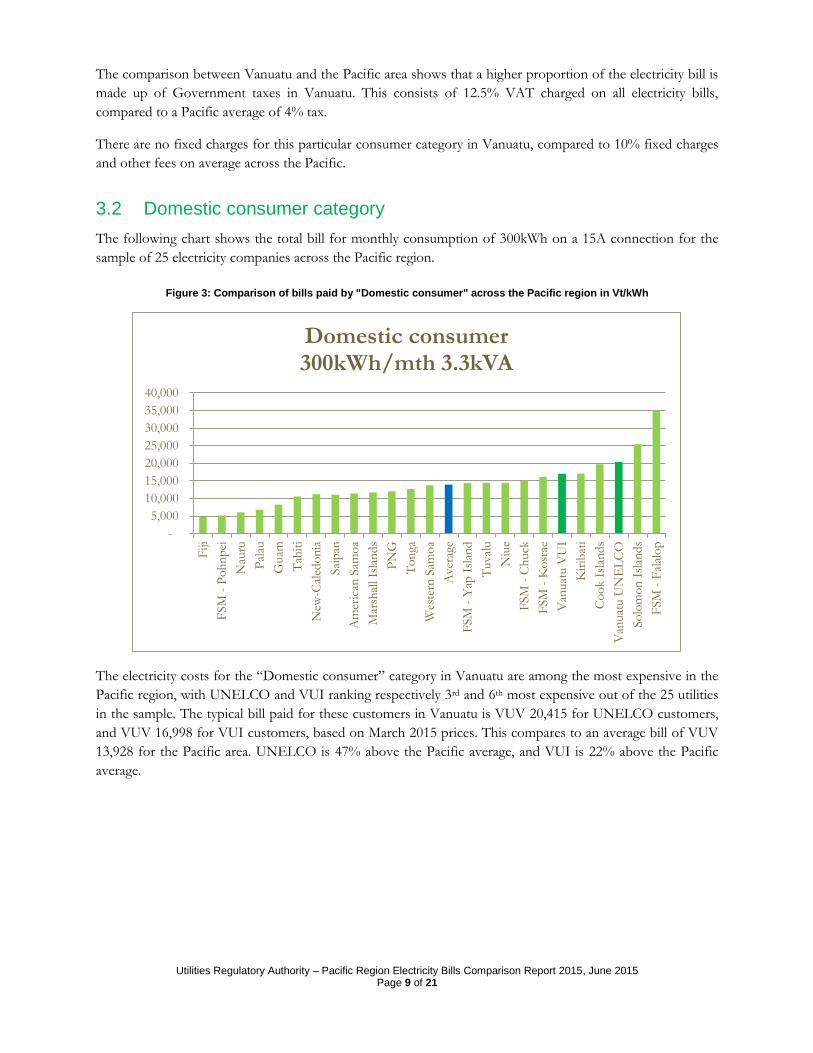
The following chart shows the total bill for monthly consumption of 300kWh on a 15A connection for the
sample of 25 electricity companies across the Pacific region.
Figure 3: Comparison of bills paid by "Domestic consumer" across the Pacific region in Vt/kWh
The electricity costs for the “Domestic consumer” category in Vanuatu are among the most expensive in the
Pacific region, with UNELCO and VUI ranking respectively 3rd and 6th most expensive out of the 25 utilities
in the sample. The typical bill paid for these customers in Vanuatu is VUV 20,415 for UNELCO customers,
and VUV 16,998 for VUI customers, based on March 2015 prices. This compares to an average bill of VUV
13,928 for the Pacific area. UNELCO is 47% above the Pacific average, and VUI is 22% above the Pacific
average.
-
5,000
10,000
15,000
20,000
25,000
30,000
35,000
40,000
Fiji
FSM
- P
oh
np
ei
Nau
ru
Pal
au
Guam
Tah
iti
New
-Cal
edo
nia
Sai
pan
Am
eric
an S
amo
a
Mar
shal
l Is
lan
ds
PN
G
To
nga
Wes
tern
Sam
oa
Aver
age
FSM
- Y
ap I
slan
d
Tuval
u
Niu
e
FSM
- C
huck
FSM
- K
osr
ae
Van
uat
u V
UI
Kir
ibat
i
Co
ok I
slan
ds
Van
uat
u U
NE
LC
O
So
lom
on
Isl
and
s
FSM
- F
alal
op
Domestic consumer 300kWh/mth 3.3kVA

Utilities Regulatory Authority – Pacific Region Electricity Bills Comparison Report 2015, June 2015 Page 10 of 21
Figure 4: Vanuatu vs. Pacific avg. – Bill breakdown comparison for “Domestic consumers”
The comparison between Vanuatu and the Pacific area shows that a higher proportion of the electricity bill is
made up of Government taxes. This consists of 12.5% VAT charged on all electricity bills, compared to a
Pacific average of 5% tax.
In Vanuatu, there are fixed charges for UNELCO customers of 3.9% of the total bill, while there are no fixed
charges for VUI customers. This is compared to an average fixed charge of 2.6% across the Pacific region.
3.3 Business consumer category
The following chart shows the total bill for a commercial customer with a monthly consumption of
10,000kWh on a 100kVA connection for the sample of electricity companies across the Pacific region.
Businesses with this level of consumption have an option to have a high voltage connection. For the purpose
of this comparison, it is assumed that these customers have a low voltage connection. There is a difference in
the tariffs for this type of customers in Vanuatu: there is a specific low voltage business tariff for UNELCO,
which includes a fixed monthly charge whereas VUI business customers requesting low voltage connection
are charged the same progressive tariff as domestic customers with no fixed charge.
The bills for high voltage customers with the same connection and consumption are also provided for
UNELCO and VUI as customers with similar consumption patterns would be on HV connection.
0%
10%
20%
30%
40%
50%
60%
70%
80%
90%
100%
Average Vanuatu UNELCO
Vanuatu VUI
Taxes
Other monthly fee
Fixed charge
Electricity

Utilities Regulatory Authority – Pacific Region Electricity Bills Comparison Report 2015, June 2015 Page 11 of 21
Figure 5: Comparison of bills paid by "Business consumers" across the Pacific region in Vt/kWh
The electricity costs for the “business consumers” category in Vanuatu are, for VUI, just under regional
average for HV connection and above regional average for LV connection. Both UNELCO’s and VUI’s
tariffs are in line with the regional average for HV types of connection. The typical bill paid for HV
customers in Vanuatu is VUV 503,061 for VUI customers, and VUV 511,031 for UNELCO customers,
based on March 2015 prices, assuming a low voltage connection. This compares to an average bill of VUV
505,924 for the Pacific area. LV type connections in Vanuatu are about 15% above the Pacific average.
Figure 6: Vanuatu vs. Pacific avg. – Bill breakdown comparison for “Business consumers”
-
200,000
400,000
600,000
800,000
1,000,000
1,200,000
1,400,000 F
iji
FSM
- P
oh
np
ei
Nau
ru
Guam
New
-Cal
edo
nia
Pal
au
Am
eric
an S
amo
a
To
nga
Mar
shal
l Is
lan
ds
Wes
tern
Sam
oa
PN
G
Sai
pan
Tah
iti
Van
uat
u V
UI
HV
Aver
age
Van
uat
u U
NE
LC
O H
V
FSM
- C
huck
Niu
e
Tuval
u
FSM
- K
osr
ae
Van
uat
u U
NE
LC
O L
V
Van
uat
u V
UI
LV
FSM
- Y
ap I
slan
d
Co
ok I
slan
ds
Kir
ibat
i
So
lom
on
Isl
and
s
FSM
- F
alal
op
Business consumer 10,000kWh/mth 100kVA
0%
10%
20%
30%
40%
50%
60%
70%
80%
90%
100%
Average Vanuatu UNELCO
Vanuatu VUI
Taxes
Other monthly fee
Fixed charge
Electricity
Utilities Regulatory Authority – Pacific Region Electricity Bills Comparison Report 2015, June 2015 Page 12 of 21
The comparison between Vanuatu and the Pacific area shows that a higher proportion of the electricity bill is
made up of Government taxes in Vanuatu. This consists of 12.5% VAT charged on all electricity bills,
compared to a Pacific average of 5% tax.
In Vanuatu, there are fixed charges for UNELCO customers of 16.6% of the total bill. There are no fixed
charges for VUI customers. This is compared to an average fixed charge of 4.7% across the Pacific region.
For high voltage customers in Vanuatu, the monthly fixed charge represents approximately 23% of the bill
for both UNELCO and VUI customers.
3.4 Factors that impact electricity costs
3.4.1 The generation mix
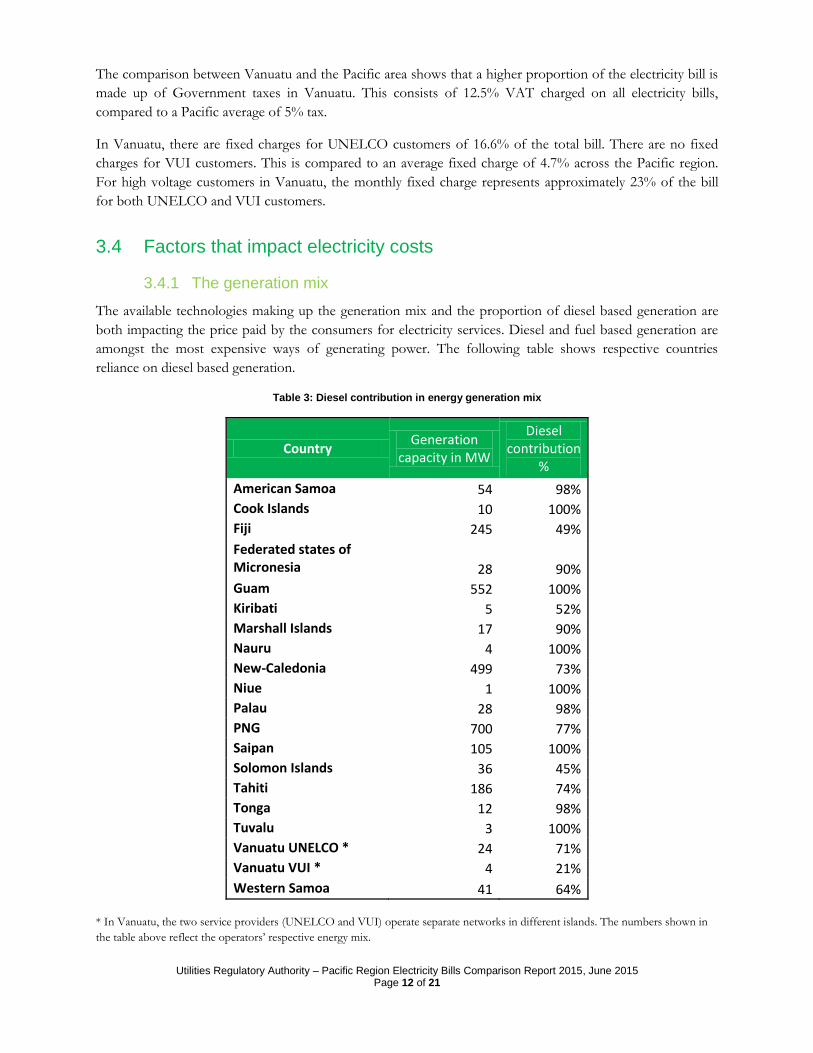
The available technologies making up the generation mix and the proportion of diesel based generation are
both impacting the price paid by the consumers for electricity services. Diesel and fuel based generation are
amongst the most expensive ways of generating power. The following table shows respective countries
reliance on diesel based generation.
Table 3: Diesel contribution in energy generation mix
Country Generation
capacity in MW
Diesel contribution
%
American Samoa 54 98%
Cook Islands 10 100%
Fiji 245 49%
Federated states of Micronesia 28 90%
Guam 552 100%
Kiribati 5 52%
Marshall Islands 17 90%
Nauru 4 100%
New-Caledonia 499 73%
Niue 1 100%
Palau 28 98%
PNG 700 77%
Saipan 105 100%
Solomon Islands 36 45%
Tahiti 186 74%
Tonga 12 98%
Tuvalu 3 100%
Vanuatu UNELCO * 24 71%
Vanuatu VUI * 4 21%
Western Samoa 41 64%
* In Vanuatu, the two service providers (UNELCO and VUI) operate separate networks in different islands. The numbers shown in
the table above reflect the operators’ respective energy mix.

Utilities Regulatory Authority – Pacific Region Electricity Bills Comparison Report 2015, June 2015 Page 13 of 21
3.4.2 Country characteristics
Besides the energy mix and diesel contribution, several country-specific characteristics affect final prices of
energy. We are highlighting the following factors for the reader’s consideration:
Country’s isolation and distance from mainland (impacts the need for redundancy, cost of logistic
and time lag on repairs);
Geographical dispersion of the country (where islands spread over long distances and are not
interconnected, each independent system has incompressible fixed costs and limited economy of
scale potential;
Availability of natural resources and alternatives for fuel based electricity generation;
Customer density and mix of residential, commercial and industrial users (affects system load factor,
network development and operations costs, system losses, billings etc);
Local labor rates, availability of skilled labor and social policies; and
Country’s exposure to natural disasters and associated risk mitigation/prevention costs.
3.4.3 Other key determinants
This study has only reviewed the differences between customer bills for different electricity utilities in the
Pacific; it has not considered or compared factors that can impact the reliability of electricity systems. These
include:
Reliability measures such as System Average Interruption Duration Index (SAIDI) or System
Average Interruption Frequency Index (SAIFI), which indicate how reliable an electricity network is
for its customers;
Availability measures, as some electricity networks in the Pacific do not provide electricity 24 hours
a day, 7 days a week;
Quality measures such as voltage or frequency range;
Ownership and cost-recovery, as the prices charged by some state-owned utilities across the Pacific
do not cover the full costs of production; and
Aid donation and subsidization, as the impact of aid donation and subsidies will vary across the
region, and will have an impact on costs.

Utilities Regulatory Authority – Pacific Region Electricity Bills Comparison Report 2015, June 2015 Page 14 of 21
The following table provides examples in the Pacific where these factors have an impact on electricity prices:
Country Observations
Fiji Fiji generates 50% of its electricity through hydro-electric power stations. The Fiji Electricity Authority (FEA) incurred significant non-commercial obligation (NCO) costs each year when supplying subsidised electricity to rural Viti Levu and the whole of Vanua Levu and Ovalau. These reached a total of $25m in 2012. Although the Public Enterprises Act requires the Fijian government to reimburse the NCO costs to FEA, these have apparently not been refunded. Instead the government has accepted that FEA's non-commercial contribution to social and community services through its electricity subsidies is to be recognised as its annual dividend to the government.
FSM-Pohnpei The power tariff in Pohnpei consists of (i) base tariff to cover all operating and
maintenance expenditure, and (ii) automatically adjusted fuel surcharge which covers
fuel expenditure. The base tariff is insufficient to cover routine maintenance costs and
has not been increased since 1994.
Vanuatu In Vanuatu a cross-subsidy mechanism designed to support access to electricity services for modest households impacts the consumer bills. Consumers under the “Small domestic” category are paying low subsidised rates in the first tranche of 0-60kWh. “Domestic consumers” are paying a higher price per kWh as a result. The cross-subsidization is more pronounced for UNELCO consumers.
Utilities Regulatory Authority – Pacific Region Electricity Bills Comparison Report 2015, June 2015 Page 15 of 21
4. Electricity price evolution over time
The following section focuses on electricity tariffs evolution across the region.
4.1 Small domestic consumers price evolution
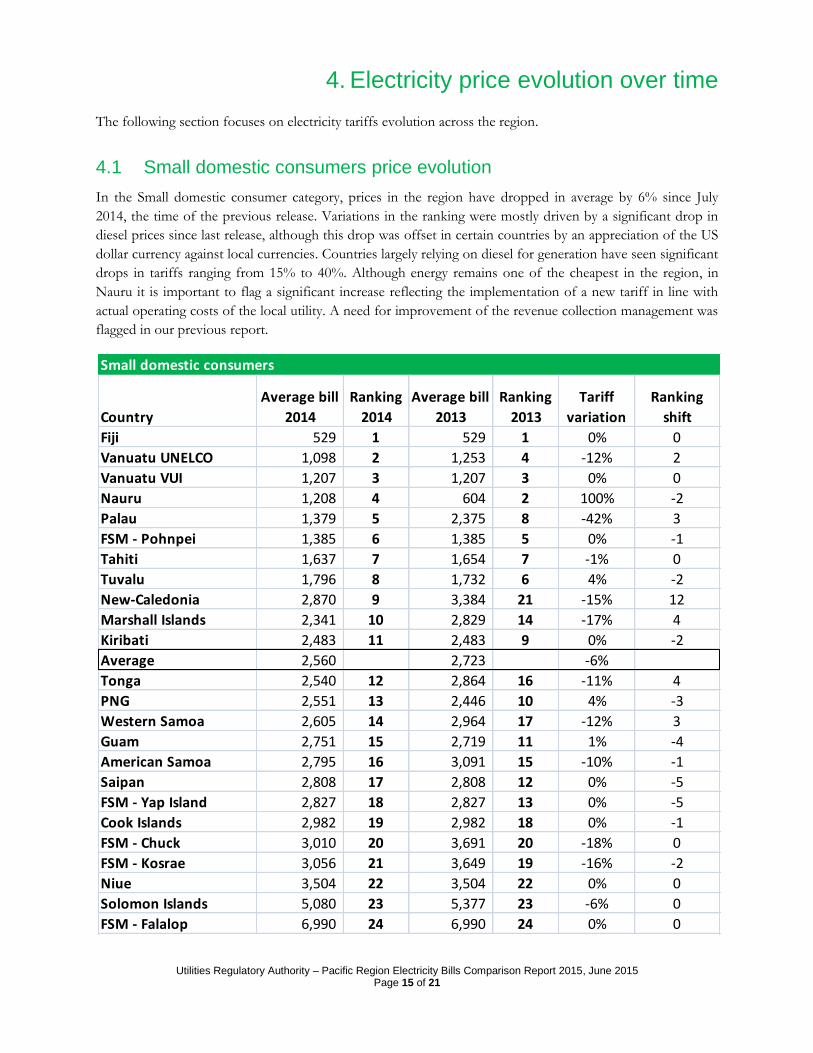
In the Small domestic consumer category, prices in the region have dropped in average by 6% since July
2014, the time of the previous release. Variations in the ranking were mostly driven by a significant drop in
diesel prices since last release, although this drop was offset in certain countries by an appreciation of the US
dollar currency against local currencies. Countries largely relying on diesel for generation have seen significant
drops in tariffs ranging from 15% to 40%. Although energy remains one of the cheapest in the region, in
Nauru it is important to flag a significant increase reflecting the implementation of a new tariff in line with
actual operating costs of the local utility. A need for improvement of the revenue collection management was
flagged in our previous report.
Small domestic consumers
Country
Average bill
2014
Ranking
2014
Average bill
2013
Ranking
2013
Tariff
variation
Ranking
shift
Fiji 529 1 529 1 0% 0
Vanuatu UNELCO 1,098 2 1,253 4 -12% 2
Vanuatu VUI 1,207 3 1,207 3 0% 0
Nauru 1,208 4 604 2 100% -2
Palau 1,379 5 2,375 8 -42% 3
FSM - Pohnpei 1,385 6 1,385 5 0% -1
Tahiti 1,637 7 1,654 7 -1% 0
Tuvalu 1,796 8 1,732 6 4% -2
New-Caledonia 2,870 9 3,384 21 -15% 12
Marshall Islands 2,341 10 2,829 14 -17% 4
Kiribati 2,483 11 2,483 9 0% -2
Average 2,560 2,723 -6%
Tonga 2,540 12 2,864 16 -11% 4
PNG 2,551 13 2,446 10 4% -3
Western Samoa 2,605 14 2,964 17 -12% 3
Guam 2,751 15 2,719 11 1% -4
American Samoa 2,795 16 3,091 15 -10% -1
Saipan 2,808 17 2,808 12 0% -5
FSM - Yap Island 2,827 18 2,827 13 0% -5
Cook Islands 2,982 19 2,982 18 0% -1
FSM - Chuck 3,010 20 3,691 20 -18% 0
FSM - Kosrae 3,056 21 3,649 19 -16% -2
Niue 3,504 22 3,504 22 0% 0
Solomon Islands 5,080 23 5,377 23 -6% 0
FSM - Falalop 6,990 24 6,990 24 0% 0
Utilities Regulatory Authority – Pacific Region Electricity Bills Comparison Report 2015, June 2015 Page 16 of 21
4.2 Domestic consumers price evolution
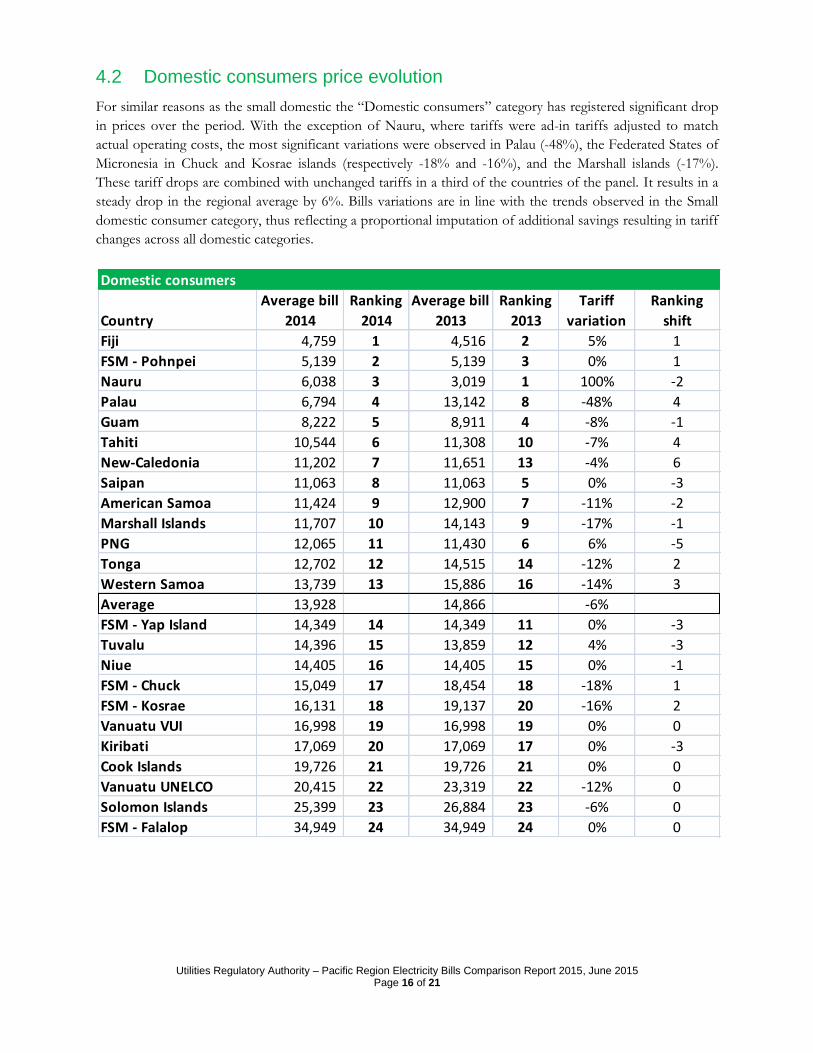
For similar reasons as the small domestic the “Domestic consumers” category has registered significant drop
in prices over the period. With the exception of Nauru, where tariffs were ad-in tariffs adjusted to match
actual operating costs, the most significant variations were observed in Palau (-48%), the Federated States of
Micronesia in Chuck and Kosrae islands (respectively -18% and -16%), and the Marshall islands (-17%).
These tariff drops are combined with unchanged tariffs in a third of the countries of the panel. It results in a
steady drop in the regional average by 6%. Bills variations are in line with the trends observed in the Small
domestic consumer category, thus reflecting a proportional imputation of additional savings resulting in tariff
changes across all domestic categories.
Domestic consumers
Country
Average bill
2014
Ranking
2014
Average bill
2013
Ranking
2013
Tariff
variation
Ranking
shift
Fiji 4,759 1 4,516 2 5% 1
FSM - Pohnpei 5,139 2 5,139 3 0% 1
Nauru 6,038 3 3,019 1 100% -2
Palau 6,794 4 13,142 8 -48% 4
Guam 8,222 5 8,911 4 -8% -1
Tahiti 10,544 6 11,308 10 -7% 4
New-Caledonia 11,202 7 11,651 13 -4% 6
Saipan 11,063 8 11,063 5 0% -3
American Samoa 11,424 9 12,900 7 -11% -2
Marshall Islands 11,707 10 14,143 9 -17% -1
PNG 12,065 11 11,430 6 6% -5
Tonga 12,702 12 14,515 14 -12% 2
Western Samoa 13,739 13 15,886 16 -14% 3
Average 13,928 14,866 -6%
FSM - Yap Island 14,349 14 14,349 11 0% -3
Tuvalu 14,396 15 13,859 12 4% -3
Niue 14,405 16 14,405 15 0% -1
FSM - Chuck 15,049 17 18,454 18 -18% 1
FSM - Kosrae 16,131 18 19,137 20 -16% 2
Vanuatu VUI 16,998 19 16,998 19 0% 0
Kiribati 17,069 20 17,069 17 0% -3
Cook Islands 19,726 21 19,726 21 0% 0
Vanuatu UNELCO 20,415 22 23,319 22 -12% 0
Solomon Islands 25,399 23 26,884 23 -6% 0
FSM - Falalop 34,949 24 34,949 24 0% 0

Utilities Regulatory Authority – Pacific Region Electricity Bills Comparison Report 2015, June 2015 Page 17 of 21
4.3 Business consumers price shift
Electricity tariffs charged to Business consumers across the region dropped by 8% in average over the period.
In several instances the tariff structures have been adjusted along with fuel compensation variables reflecting
lower diesel prices. The average energy bill for business consumers dropped significantly in Palau (-52%) and
Fiji (-27%) showing commitment to support local economies. For countries passing on the drops in diesel
prices, the average tariff decrease ranges from 12% to 17% as shown in the following table:
Business consumers
Country
Average bill
2014
Ranking
2014
Average bill
2013
Ranking
2013
Tariff
variation
Ranking
shift
Fiji 157,369 1 216,064 2 -27% 1
FSM - Pohnpei 227,350 2 227,350 1 0% -1
Nauru 251,564 3 251,564 3 0% 0
Guam 296,531 4 321,268 4 -8% 0
New-Caledonia 301,198 5 312,715 5 -4% 0
Palau 314,659 6 655,512 20 -52% 14
American Samoa 396,425 7 445,646 6 -11% -1
Tonga 423,395 8 483,843 9 -12% 1
Marshall Islands 457,903 9 539,108 10 -15% 1
Western Samoa 457,981 10 529,540 13 -14% 3
PNG 461,676 11 436,758 8 6% -3
Saipan 467,373 12 465,854 7 0% -5
Tahiti 494,670 13 506,535 17 -2% 4
Vanuatu VUI HV 503,061 14 503,061 11 0% -3
Average 505,924 547,513 -8%
Vanuatu UNELCO HV 511,031 15 583,706 18 -12% 3
FSM - Chuck 535,251 16 648,758 19 -17% 3
Niue 543,485 17 543,095 15 0% -2
Tuvalu 552,972 18 532,752 12 4% -6
FSM - Kosrae 572,006 19 673,895 21 -15% 2
Vanuatu UNELCO LV 575,595 20 657,495 22 -12% 2
Vanuatu VUI LV 582,015 21 582,706 16 0% -5
FSM - Yap Island 584,117 22 584,117 14 0% -8
Cook Islands 706,811 23 706,811 24 0% 1
Kiribati 724,129 24 724,129 23 0% -1
Solomon Islands 890,490 25 938,076 25 -5% 0
FSM - Falalop 1,164,974 26 1,164,974 26 0% 0

Utilities Regulatory Authority – Pacific Region Electricity Bills Comparison Report 2015, June 2015 Page 18 of 21
4.4 Factors that impact electricity price over time
In the Pacific region, most of the generation capacity is diesel fueled. It makes fuel cost the main variable
impacting the price of electricity, although not all countries are passing these fluctuations to their customers
at the same pace. For the countries passing the fuel price variations onto electricity consumers, time gap
observed vary between countries and are driven by the supply chain and country’s characteristics. The key
drivers are the distance from the port of origin, supply route, the local demand for diesel and the storage
capacities. The storage capacity may also impact the time lag between the time when prices are changing on
the international trade market and the day the prices are reflected in local electricity prices. In Vanuatu for
example, the price change occurs when fuel from previous delivery has been fully exhausted, using first-in
first out inventory method. This means that based on how much stock is left in the storage the day the tanker
lands at the wharf, the price change from cheaper fuel delivered may be delayed further. The billing cycle
adopted by the utility company, or the time elapsed between the day the utility is using cheaper diesel in
generation and the day the customers are billed based on this cheaper fuel may increase the time lag in price
transfer again. All together we observed a three to four months lag in price transfer in Vanuatu, a process we
detailed in our monitoring report “Diesel Pricing for Electricity Services” released in January 2015 and
available on the URA’s website.
In order to avoid distortions in the comparison of shift in rankings over time, we keep the exchange rates
constant using spot exchange rates to recalculate the corresponding bills for last report. However,
fluctuations are only partly neutralized as the costs related to imported fuels and materials are impacted by
currency fluctuations and fully reflected in the current tariffs used to calculate the bills. The lack of details in
the proportion of operating costs being impacted by currency variations introduces a bias in subsequent
analysis.

Utilities Regulatory Authority – Pacific Region Electricity Bills Comparison Report 2015, June 2015 Page 19 of 21
5. Conclusions
Based on the comparison of customer bills, the overall picture for Vanuatu is mixed, with significant
differences in the relative position depending on customer category:
Small domestic customers in Vanuatu are charged significantly less than the regional average;
Other low voltage domestic customers, which means relatively high users in Vanuatu are charged
significantly more than the regional average and are subsidizing the low users; and
Business customers in Vanuatu are now divided geographically between concessions with VUI
charging below average pacific rate and UNELCO charging higher prices than average based on the
type of connection. It should be noted that the URA reduced VUI prices in March 2014, while
Unelco prices are adjusted monthly reflecting current fuel prices.
In general, we observe that the cross-subsidy from large to small customers is more pronounced in Vanuatu
than in other parts of the Pacific region.
This third release of the URA’s Electricity tariff comparison reflects the significant drops in diesel prices
driving down energy prices across the region, although appreciation of US dollar currency played against
certain countries like Vanuatu who have seen a portion of the benefits from diesel prices drop taken away by
the depreciation of local currencies against US dollar used to price petroleum products. It highlights the risks
and exposure to currency fluctuations in most countries of the region with no or limited hedging measures
adopted. Such risks may also be mitigated with the increasing contribution of renewable energy sources in the
energy mix of the respective countries.
Another effect to be expected from diesel prices drop is the loss in renewable energy competitiveness against
fossil fuel generation. In Vanuatu the effect resulted in a significant decrease of coconut oil use as an
alternative to diesel, as processing costs for locally made fuel became higher than imported fuels.
The URA team wishes to thank all the persons involved with the regulatory agencies and utility companies
across the region who helped us compile the information necessary to issue this report.

Utilities Regulatory Authority – Pacific Region Electricity Bills Comparison Report 2015, June 2015 Page 20 of 21
Annexe I. Electricity bill breakdown
Country Fiji PalauAmerican
Samoa
Western
SamoaPNG
New-
CaledoniaKiribati Tuvalu Niue Nauru
Marshall
Islands
Solomon
Islands
Small domestic consumer
Average use per month 60 kWh
Amperage 1.1 kVa
Electricity in VUV 529 964 2,157 2,315 1,717 1,793 2,257 1,777 2,336 1,129 2,209 5,080
Fixed charge in VUV - 319 638 - 602 382 - - 1,168 - - -
Other monthly fee in VUV - - - - - 558 - - - - - -
Taxes in VUV - 96 - 289 232 137 226 18 - 79 133 -
Estimated bill in VUV 529 1,379 2,795 2,605 2,551 2,870 2,483 1,796 3,504 1,208 2,341 5,080
Domestic consumer
Average use per month 300 kWh
Amperage 3.3 kVa
Electricity in VUV 4,401 6,001 10,785 12,213 10,366 8,965 15,517 13,777 13,237 5,643 11,044 25,399
Fixed charge in VUV - 319 638 - 602 1,145 - - 1,168 - - -
Other monthly fee in VUV - - - - - 558 - - - - - -
Taxes in VUV 358 474 - 1,527 1,097 533 1,552 618 - 395 663 -
Estimated bill in VUV 4,759 6,794 11,424 13,739 12,065 11,202 17,069 14,396 14,405 6,038 11,707 25,399
Business consumer
Average use per month 30000 kWh
Amperage 100 kVa
Electricity in VUV 138,874 291,536 351,205 407,094 419,698 205,441 658,299 526,640 541,928 235,107 431,984 890,490
Fixed charge in VUV 1,180 1,170 45,220 - 7 80,760 - - 1,168 - - -
Other monthly fee in VUV - - - - - 654 - - - - - -
Taxes in VUV 17,314 21,953 - 50,887 41,971 14,343 65,830 26,332 389 16,457 25,919 -
Estimated bill in VUV 157,369 314,659 396,425 457,981 461,676 301,198 724,129 552,972 543,485 251,564 457,903 890,490
Country TongaCook
IslandsFSM - Chuck
FSM -
Kosrae
FSM -
Pohnpei
FSM - Yap
Island
FSM -
FalalopSaipan Guam Tahiti
Vanuatu
UNELCO HV
Vanuatu
VUI HV
Small domestic consumer
Average use per month 60 kWh
Amperage 1.1 kVa
Electricity in VUV 2,540 2,663 2,866 3,056 894 2,426 6,990 2,064 1,368 1,065 976 1,073
Fixed charge in VUV - - - - - - - - - - - -
Other monthly fee in VUV - - - - - - - - - - - -
Taxes in VUV - - - - - - - - - - - -
Estimated bill in VUV 2,864 2,864 2,864 2,864 2,864 2,864 2,864 2,864 2,864 2,864 2,864 2,864
Domestic consumer
Average use per month 300 kWh
Amperage 3.3 kVa
Electricity in VUV 12,702 17,613 14,332 16,131 4,469 13,399 34,949 10,318 6,839 7,704 17,358 15,109
Fixed charge in VUV - - 0 - 426 266 - 745 1,383 1,217 789 -
Other monthly fee in VUV - - - - - - - - - 1,121 - -
Taxes in VUV - 2,114 717 - 245 683 - - - 502 2,268 1,889
Estimated bill in VUV 12,702 19,726 15,049 16,131 5,139 14,349 34,949 11,063 8,222 10,544 20,415 16,998
Business consumer
Average use per month 30000 kWh
Amperage 100 kVa
Electricity in VUV 423,395 630,692 509,762 572,006 127,680 555,770 1,164,974 466,309 283,768 401,545 334,700 329,490
Fixed charge in VUV - 389 - - 86,184 532 - 1,064 12,763 32,217 119,550 117,675
Other monthly fee in VUV - - - - 2,660 - - - - 37,353 - -
Taxes in VUV - 75,730 25,488 - 10,826 27,815 - - - 23,556 56,781 55,896
Estimated bill in VUV 423,395 706,811 535,251 572,006 227,350 584,117 1,164,974 467,373 296,531 494,670 511,031 503,061

Utilities Regulatory Authority – Pacific Region Electricity Bills Comparison Report 2015, June 2015 Page 21 of 21
Utilities Regulatory Authority
Vanuatu
You can access the Pacific Region Electricity Bills Comparison Report 2015 on our website www.ura.gov.vu, or by contacting us by telephone (+678) 23335, email: [email protected] or regular mail at Comparative Report “Electricity price – Pacific area” Utilities Regulatory Authority, PMB 9093, Port Vila, Vanuatu.