Comparative pharmacokinetics studies of immediate- and modified-release formulations of glipizide in...
10
RESEARCH ARTICLE Comparative Pharmacokinetics Studies of Immediate- and Modified-Release Formulations of Glipizide in Pigs and Dogs RAJESH KULKARNI, 1 NATHAN YUMIBE, 1 ZHONGYI WANG, 1 XIN ZHANG, 1 CHENG CAI TANG, 1 KENNETH RUTERBORIES, 1 AMY COX, 1 ROBYN MCCAIN, 3 GREGORY T. KNIPP 2,3 1 Eli Lilly and Company, Lilly Corporate Center, Indianapolis, Indiana 46285 2 Department of Industrial and Physical Pharmacy, College of Pharmacy, Purdue University, West Lafayette, Indiana 47907 3 Purdue Translational Pharmacology Facility, Bindley Biosciences Center, Purdue University, West Lafayette, Indiana 47907 Received 5 July 2012; revised DD MM YYYY; accepted 31 July 2012 Published online in Wiley Online Library (wileyonlinelibrary.com). DOI 10.1002/jps.23292 ABSTRACT: The utility of pigs as preclinical animals for pharmaceutical development was assessed by evaluating the pharmacokinetics and pharmacodynamics of glipizide (Glucotrol R ) following oral administration of immediate-release (IR) and modified-release (MR) formula- tions. Doses of 10 and 30 mg were administered to six male pigs in a crossover design. Blood samples were collected at selected time-points up to 48 h after dose. Relative to the IR for- mulation, the time to reach the maximum concentration (t max ) was delayed with the MR formulation from 1.3 to 8.7 h with the 10 mg dose and to 6.2 h with the 30 mg dose. The relative bioavailability (BA) was approximately 92% at 10 mg and 79% at 30 mg dose. The area under the curve of the plasma concentration versus time curve (AUC) increased nearly proportionally with the dose. Interanimal coefficient of variation (CV) in AUC ranged from approximately 40% to 60%. Blood glucose results suggest that pigs demonstrate formulation- dependent response to glipizide. Compared with the pigs, the 10 mg MR formulation in dogs showed a higher AUC CV of approximately 80%, a t max of 5.5 h, and a lower relative BA of 18%. These data indicate that the MR formulation performed less consistently in dogs as com- pared with humans, whereas the porcine absorption kinetics and BA were consistent with pub- lished clinical data. © 2012 Wiley Periodicals, Inc. and the American Pharmacists Association J Pharm Sci Keywords: absorption; bioavailability; controlled release; pharmacokinetics/ pharmacodynamics model; physiological model; dissolution; in vitro/in vivo correlation (IVIVC) INTRODUCTION Modified- or controlled-release (MR) formulations of- fer significant advantages over immediate-release (IR) formulations by increasing patient compliance, Abbreviations used: AUC, area under the curve of the plasma concentration versus time curve; BA, bioavailability; C max , maxi- mum concentration reached in the plasma concentration versus time curve; CV, coefficient of variation; EDTA, ethylenediaminete- traacetic acid; GI, gastrointestinal; IR, immediate-release formu- lation; IVIVC, in vitro–in vivo correlation; MR, modified-release formulation; PD, pharmacodynamics; PK, pharmacokinetics; rpm, revolutions per minute; t max , time to reach the maximum concen- tration; USP, United States Pharmacopeia Correspondence to: Rajesh Kulkarni (Telephone: + 317-433- 8285; Fax: +317-277-2560; E-mail: kulkarni [email protected]), Nathan Yumibe (Telephone: +317-433-4088; Fax: +317-655-1185; E-mail: yumibe nathan [email protected]) Journal of Pharmaceutical Sciences © 2012 Wiley Periodicals, Inc. and the American Pharmacists Association reducing the frequency of dosing for drugs with a short terminal elimination half-life, and minimizing the degree of fluctuation in the drug’s plasma con- centration over the dosing intervals. 1 The develop- ment of MR formulations is a complex and iterative process that requires an integrated understanding of the effects of formulation design and manufacturing process on the drug product performance attributes. 2 However, the intricacies of formulation development get increasingly challenging if meaningful in vitro– in vivo correlations (IVIVC) cannot be developed. Con- sequently, even minor formulation changes may need to be substantiated with in vivo studies to ensure that the changes have not affected the desired pharma- cokinetics (PK) profile and pharmacodynamics (PD) response. This lengthens the development timeline because multiple clinical studies are needed to opti- mize the formulation. JOURNAL OF PHARMACEUTICAL SCIENCES 1
-
Upload
rajesh-kulkarni -
Category
Documents
-
view
213 -
download
0
Transcript of Comparative pharmacokinetics studies of immediate- and modified-release formulations of glipizide in...

RESEARCH ARTICLE
Comparative Pharmacokinetics Studies of Immediate- andModified-Release Formulations of Glipizide in Pigs and Dogs
RAJESH KULKARNI,1 NATHAN YUMIBE,1 ZHONGYI WANG,1 XIN ZHANG,1 CHENG CAI TANG,1 KENNETH RUTERBORIES,1
AMY COX,1 ROBYN MCCAIN,3 GREGORY T. KNIPP2,3
1Eli Lilly and Company, Lilly Corporate Center, Indianapolis, Indiana 46285
2Department of Industrial and Physical Pharmacy, College of Pharmacy, Purdue University, West Lafayette, Indiana 47907
3Purdue Translational Pharmacology Facility, Bindley Biosciences Center, Purdue University, West Lafayette, Indiana 47907
Received 5 July 2012; revised DD MM YYYY; accepted 31 July 2012
Published online in Wiley Online Library (wileyonlinelibrary.com). DOI 10.1002/jps.23292
ABSTRACT: The utility of pigs as preclinical animals for pharmaceutical development wasassessed by evaluating the pharmacokinetics and pharmacodynamics of glipizide (Glucotrol R©)following oral administration of immediate-release (IR) and modified-release (MR) formula-tions. Doses of 10 and 30 mg were administered to six male pigs in a crossover design. Bloodsamples were collected at selected time-points up to 48 h after dose. Relative to the IR for-mulation, the time to reach the maximum concentration (tmax) was delayed with the MRformulation from 1.3 to 8.7 h with the 10 mg dose and to 6.2 h with the 30 mg dose. Therelative bioavailability (BA) was approximately 92% at 10 mg and 79% at 30 mg dose. Thearea under the curve of the plasma concentration versus time curve (AUC) increased nearlyproportionally with the dose. Interanimal coefficient of variation (CV) in AUC ranged fromapproximately 40% to 60%. Blood glucose results suggest that pigs demonstrate formulation-dependent response to glipizide. Compared with the pigs, the 10 mg MR formulation in dogsshowed a higher AUC CV of approximately 80%, a tmax of 5.5 h, and a lower relative BA of18%. These data indicate that the MR formulation performed less consistently in dogs as com-pared with humans, whereas the porcine absorption kinetics and BA were consistent with pub-lished clinical data. © 2012 Wiley Periodicals, Inc. and the American Pharmacists AssociationJ Pharm SciKeywords: absorption; bioavailability; controlled release; pharmacokinetics/pharmacodynamics model; physiological model; dissolution; in vitro/in vivo correlation(IVIVC)
INTRODUCTION
Modified- or controlled-release (MR) formulations of-fer significant advantages over immediate-release(IR) formulations by increasing patient compliance,
Abbreviations used: AUC, area under the curve of the plasmaconcentration versus time curve; BA, bioavailability; Cmax, maxi-mum concentration reached in the plasma concentration versustime curve; CV, coefficient of variation; EDTA, ethylenediaminete-traacetic acid; GI, gastrointestinal; IR, immediate-release formu-lation; IVIVC, in vitro–in vivo correlation; MR, modified-releaseformulation; PD, pharmacodynamics; PK, pharmacokinetics; rpm,revolutions per minute; tmax, time to reach the maximum concen-tration; USP, United States Pharmacopeia
Correspondence to: Rajesh Kulkarni (Telephone: + 317-433-8285; Fax: +317-277-2560; E-mail: kulkarni [email protected]),Nathan Yumibe (Telephone: +317-433-4088; Fax: +317-655-1185;E-mail: yumibe nathan [email protected])Journal of Pharmaceutical Sciences© 2012 Wiley Periodicals, Inc. and the American Pharmacists Association
reducing the frequency of dosing for drugs with ashort terminal elimination half-life, and minimizingthe degree of fluctuation in the drug’s plasma con-centration over the dosing intervals.1 The develop-ment of MR formulations is a complex and iterativeprocess that requires an integrated understanding ofthe effects of formulation design and manufacturingprocess on the drug product performance attributes.2
However, the intricacies of formulation developmentget increasingly challenging if meaningful in vitro–in vivo correlations (IVIVC) cannot be developed. Con-sequently, even minor formulation changes may needto be substantiated with in vivo studies to ensure thatthe changes have not affected the desired pharma-cokinetics (PK) profile and pharmacodynamics (PD)response. This lengthens the development timelinebecause multiple clinical studies are needed to opti-mize the formulation.
JOURNAL OF PHARMACEUTICAL SCIENCES 1

2 KULKARNI ET AL.
Modified-release formulation development gener-ally involves the following systematic approachesincluding: development of formulation prototypes pos-sessing different release rates, characterization of re-lease rates utilizing in vitro dissolution tests [poten-tially United States Pharmacopeia (USP) based], andthe evaluation of in vivo performance of the proto-type formulations in clinical studies.3–5 It should benoted that human physiology is complex and clinicaldrug absorption from a dosage form is influenced byvarious factors such as gastric residence time, com-position and volume of gastrointestinal (GI) fluids,mechanical destructive forces during peristalsis, anddifferences in absorption along the GI tract.6–9 It iswell established that the presence of food can dra-matically alter the oral bioavailability (BA) of drugsfrom MR formulations.10–13 For example, the compo-sition of meal and dosing time relative to meal intakewas found to affect the PK of controlled release theo-phylline formulation.13
in vitro dissolution tests are developed and mod-ified with intent to serve as a biological fluid sur-rogate to mimic in vivo release and increase thepotential to establish an IVIVC.3,5,14 However, forreasons mentioned above, it is practically impossiblefor in vitro dissolution to simulate the complex pro-cesses involved with drug release and absorption thatoccur within the in vivo GI environment. The mul-tiple physiological confounding variables with gen-eral and USP-based in vitro dissolution methodsoften lead to lack of an observed in vitro–in vivorelationship or IVIVC. Several references describelimitations of the dissolution method in predictingin vivo performance.3,4,14–16
We hypothesize that the out-bred, domesticatedfarm pig is an appropriate preclinical model to as-sess the in vivo performance of MR formulationsduring development. The porcine model has severalphysiological characteristics that are more similar tohumans than other nonprimate species.17–19 In partic-ular, among the factors that govern drug absorption—pH, surface area, and transit time in the GI tract—itshould be noted that pigs are the closest to humansin these measures when compared with the otherpreclinical species.18–32 Literature references suggestthat the porcine model may be the most appropri-ate human surrogate for drug metabolism and PKstudies.26–32 This animal can also be dosed with theintact monolithic dosage form to protect its integrityand prevent burst release, which is a critical require-ment for many MR formulations.33,34 There is a highlikelihood that the MR dosage form will remain in-tact during administration to the pig. The use of thisanimal model in this manner could streamline MRformulation development by enabling the drug devel-opment scientists to screen and compare the PK/PDof prototype MR formulations in a preclinical animal
model that is more relevant to human anatomy andphysiology. Such information can empower scientistsand increase their confidence in selecting the mostappropriate MR formulation for clinical testing.35,36
Glipizide, available commercially under the brandname Glucotrol R©, is a second generation oral hy-poglycemic agent used in the treatment of diabetesmellitus. Glipizide is a weak acid and exhibits pH-dependent solubility. It is absorbed rapidly (in thesmall intestine) and has a rapid onset of action.37,38
The absorption mechanism in the intestine is pri-marily passive diffusion and the driving force is theconcentration gradient of the unionized species in ac-cordance with the pH-partition hypothesis.39 Further-more, the PK of glipizide in humans is characterizedwith high peak blood concentrations within 1–3 h af-ter administration, and short elimination half-livesranging from 2 to 4 h. Therefore, it is routinely admin-istered two to three times daily. Careful adjustmentof the dose is necessary to avoid hypoglycemic symp-toms. Glipizide is also available in a MR, GI therapeu-tic system, tablet dosage form under the brand nameGlucotrol XL R©. The MR formulation allows once-dailyadministration and minimizes peak-to-trough fluctu-ation in plasma glipizide concentration.40,41
To test the hypothesis that the pig is a betterpreclinical, nonprimate animal model for nonclini-cal evaluation of MR formulations than the dog, thisstudy compared the PK/PD of IR and MR glipizidetablet formulations in pigs with the PK collected indogs dosed with the same formulations. The tabletswere administered orally at two different doses, 10and 30 mg in pigs. The PK parameters for the sametwo formulations were evaluated in beagle dogs at a10 mg dose. The relationship between in vitro dissolu-tion and in vivo absorption was also explored for theMR formulation. Moreover, the comparative PK pa-rameters in the pig and dog models were contrastedwith published human PK data to assess the relativepreclinical prediction of potential clinical outcomes.
MATERIALS AND METHODS
Materials
Glucotrol R© and Glucotrol XL R© were purchased fromPurdue University Pharmacy in West Lafayette, Indi-ana. The glipizide reference standard was purchasedfrom the USP (Rockville, Maryland). Trifluoroaceticacid (0.1%) was purchased from EMD ChemicalsInc. (Gibbstown, New Jersey). Monobasic potassiumphosphate was purchased from Fisher Scientific(Fair Lawn, New Jersey). The 5 N NaOH was pur-chased from Red Bird Service (Batesville, Indiana).Catheters, tubing, and other supplies for the PigTurn-Culex-L R© where purchased from Bioanalytical Sys-tems, Inc. (West Lafayette, Indiana), as previously
JOURNAL OF PHARMACEUTICAL SCIENCES DOI 10.1002/jps

COMPARATIVE PK OF GLIPIZIDE FORMULATIONS IN PIGS AND DOGS 3
described.42 Reagents and supplies used in the glu-cose analysis were obtained from Roche Diagnostics,(Indianapolis, Indiana). All other materials wherepurchased from Fischer Scientific (Pittsburgh, Penn-sylvania) unless otherwise noted.
Manufacture of Placebo Tablets
The placebo tablet formulation was generated byblending 49.5% sucrose and 49.5% microcrystallinecellulose for 10 min in Tote R© Tumble Bin Blender(Fort Worth, Texas). After blending, 1.0% of magne-sium stearate was added and blended for an addi-tional 5 min. The blended formulation was then com-pressed with 11 mm round, standard concave toolingon 16 Station Stokes B2 Tablet Press (Philadelphia,Pennsylvania) to a target hardness of 8 kilo pond.
Pig Study
The Purdue Animal Care and Use Committee ap-proved the study protocol (09–103) and the animalswere under the care of a staff veterinarian in the Pur-due Lab Animal Program during the entire course ofthe research. Six immature farm pigs (approximately3.5–4 months old and 21–27 kg in weight) were se-lected for the study. The animals were socialized andtrained to take placebo doses over 14 days. They werethen surgically modified with a jugular catheter, ex-ternalized in the dorsal scapular region, as describedpreviously.42 The catheter was connected to the Culex-L system for automated collection of blood at thespecified intervals below. Following surgical recovery,pigs were placed on a movement responsive cagingsystem (PigTurn R©, Bioanalytical Systems Inc., WestLafayette, Indiana).42 This system rotates the cageopposite to the movement of the animal, so that thecatheter line does not become entangled with move-ment. The animal was connected to the system viaa harness and tether. Rotational movement by thepig is transferred through the tether to a sensor armcentered above the cage, prompting movement of thecage opposite to movement of the animal.42 The an-imal has 270◦ of free rotation before the movementresponse by the cage, so that the cage only rotates tocurtail catheter tangling. This also has the benefit ofproviding a relatively stress-free environment for PKstudies, as the study can be conducted with minimalhuman intervention compared with the manual bleedstudies, which can be very stressful to both the animaland the researcher.42
Following surgical recovery, the animals were al-lowed to acclimate to the movement responsive cagefor 24 h before administration of the active formu-lations. The animals were administered either theIR or MR formulations of glipizide (Glucotrol R© andGlucotrol XL R©, Purdue University Pharmacy) follow-ing a crossover design protocol. Two different doseswere administered using a pill syringe: 10 and 30 mg
Table 1. Dosing Schedule for Administering Placebo; IR, andMR Glipizide Formulations in Pigs
Day Group 1 Group 2
1 Placebo Placebo2 IR, 10 mg MR, 10 mg6 MR, 10 mg IR, 10 mg9 IR, 30 mg MR, 30 mg12 MR, 30 mg IR, 30 mg
dose. The 30 mg dose was achieved by giving three10 mg tablets. The dosing schedule is shown in Ta-ble 1. Blood samples of 1 mL were collected into vialscontaining tri-potassium ethylenediaminetetraaceticacid (K3EDTA). The samples were collected immedi-ately before dosing and at selected time points up to48 h after dose. Vials were collected within 1 h of beingdrawn, centrifuged at 4◦C, and then processed to sep-arate plasma and stored frozen at −80◦C before liq-uid chromatography–tandem mass spectrometry (LC/MS/MS) analysis.
Dog Study
Three fasted male beagle dogs (10.0–10.6 kg) wereeach orally administered single 10 mg IR or 10 mgMR glipizide formulations by placing the tablet di-rectly into the mouth of the animal. Dose administra-tion was verified by observing the swallowing of thetablet by the animal. Dosing of these formulationsoccurred one week apart. Following administrationof either formulation, blood samples were collectedfrom the jugular vein at selected time points over24 h using K3EDTA as an anticoagulant. The sam-ples were stored on ice after collection and processedto plasma by centrifugation. Plasma samples werestored at −80◦C before LC/MS/MS analysis.
Bioanalysis
Glipizide plasma concentrations were determinedwith a LC/MS/MS assay developed at Lilly. The inter-nal standard ([2H11] glipizide) in 200:L of acetoni-trile/methanol (1:1, v/v) was added to plasma samples(0.05 mL), mixed, and centrifuged. The resulting su-pernatants were diluted 25-fold with methanol/water(1:1, v/v) and submitted to LC/MS/MS analysis. Chro-matography was performed using a Betasil C18 col-umn 2 × 20 mm2 5 micron Javelin (Thermo Scientific,Waltham, Massachusetts), and a 5 mM ammoniumbicarbonate methanol solution (flow rate 1.5 mL/min), with elution of the analytes over a 40%–75%methanol gradient. Mass spectrometric detection wasperformed with a mass spectrometer equipped with aturbo ion spray source (API 4000; Applied Biosystems,Foster City, California), using selected reaction mon-itoring in the positive ion mode (m/z transitions of446.1 → 321.1 for glipizide and 457.2 → 321.2 for the
DOI 10.1002/jps JOURNAL OF PHARMACEUTICAL SCIENCES
4 KULKARNI ET AL.
internal standard). Calibration curves were preparedin matrix from 1 to 5000 ng/mL.
Glucose Analysis
Plasma glucose concentrations were determinedusing an automated Cobas c311 Clinical Chem-istry Analyzer (Roche Diagnostics, Indianapolis, In-diana). Samples were received on dry ice andstored at −80◦C before analysis. Samples werethawed and aliquots of each sample were ana-lyzed. Quality control samples were run beforeanalysis of study samples. Glucose concentrationswere reported directly from the analyzer and thedata were analyzed using Watson version 7.4 forWindows (Thermo Fisher Scientific) and Microsoft Of-fice Excel 2007 to determine the effect of the treat-ment groups on the plasma glucose concentrations.
PK Data Analysis
The PK parameters were determined using noncom-partmental analysis from Watson version 7.4 for Win-dows (Thermo Fisher Scientific). Plasma concentra-tions of glipizide below the lower limit of quantita-tion were reported as below quantitation limit, anda value of zero was used for determination of PK pa-rameters and for reporting of mean plasma concen-trations. Plasma samples with concentrations greaterthan the upper limit of quantitation value were de-termined by dilution. The PK parameters calculatedinclude area under the curve of the plasma concen-tration versus time curve (AUC0–48 h), maximum con-centration reached in the plasma concentration ver-sus time curve (Cmax), time to reach the maximumconcentration (tmax), and relative oral BA. The mean,standard deviation, and the coefficient of variation(CV) were reported for these data.
In Vitro Dissolution Studies
A USP Apparatus II (paddle) was utilized to performthe in vitro dissolution test. For the IR formulation,glipizide release was evaluated according to the pro-cedure published in the USP monograph.43 The testwas performed with paddles operating at 50 rpm andthe dissolution medium consisted of 900 mL of potas-sium phosphate buffer pH 6.8 maintained at 37◦Ctemperature. Samples (5 mL) were withdrawn at 15,30, 45 and 60 min, filtered through 0.45:m polyte-trafluoroethylene filter, and analyzed for drug con-tent as described later in this section. Fresh mediumwas replaced after sample withdrawal. For the MRformulation, the dissolution apparatus and mediumwas similar to the IR formulation. The test was run attwo different paddle speeds, 50 and 75 rpm. Samplingtime points were as follows: 30 min, 1, 2, 3, 4, 5, 6, 7,8, 9, 22, and 24 h.
The samples were analyzed by a Reversed PhaseHPLC method using a Zorbax Bonus RP, 75 ×
4.6 mm2, 3.5:m column maintained at 30◦C and anAgilent 1100 HPLC system equipped with an ultra-violet detector set at 276 nm. The sample injectionvolume was 10:L. The mobile phase consisted of a60:40 mixture of water: Acetonitrile and 0.1% trifluo-roacetic acid at a flow rate of 1 mL per min.
An in situ fiber-optic dissolution test of the glip-izide MR formulation was also evaluated using Del-phian Technology L.P.’s Rainbow Dynamic Dissolu-tion MonitorTM (Ardsley, New York). The dissolutionwas performed at 75 rpm speed using a similar appa-ratus and medium as described above for the glipizideMR formulation. The data were collected every 30 minup to 22 h using a fiber-optic probe set at 276 nm wave-length.
In Vitro–In Vivo Correlation
In vitro dissolution profiles were compared within vivo PK data [deconvoluted to provide the timecourse of fraction absorbed (FA)]. Deconvolution ofthe plasma concentration versus time profiles wasperformed using Wagner–Nelson method using theIVIVC toolbox in WinNonlin Enterprise Edition R©
software (Version 5.0.1; Pharsight Corporation, St.Louis, Missouri). The in vitro and in vivo profileswere then compared by plotting fraction of the drugdissolved against FA at matched time points usingWinNonlin. This allows assessment of any differencesbetween in vitro dissolution and in vivo absorption todetermine if a correlation exists or can be achieved.
Statistical Analysis
The PK parameters were calculated as described pre-viously. The means and standard deviations of thePK parameters are reported along with their coeffi-cients of variation to illustrate the relative interani-mal differences. Statistical comparisons of Cmax, tmax,and AUC were evaluated for both the MR formula-tion relative to the IR formulation of the same speciesand for dogs relative to pigs for the same formula-tion. The paired t-test was used on the logarithm-transformed data for the Cmax and AUC comparisonsand the Wilcoxon signed rank test was used for thetmax comparisons within a species. The t-test was usedfor the tmax comparisons between species. The relativebioavailability ratios were not analyzed. Statisticalsignificance is denoted in the tables using the follow-ing notation: NS for not significant, ∗ for p ≤ 0.05, ∗∗ forp ≤ 0.01, and ∗∗∗ for p ≤ 0.001. Statistical significanceis determined relative to two-sided comparisons. Thedata were analyzed using JMP R© statistical software,version 9.0.1 (Cary, North Carolina).
RESULTS AND DISCUSSION
In vitro dissolution for the 10 mg IR glipizidetablet formulation was performed according to the
JOURNAL OF PHARMACEUTICAL SCIENCES DOI 10.1002/jps

COMPARATIVE PK OF GLIPIZIDE FORMULATIONS IN PIGS AND DOGS 5
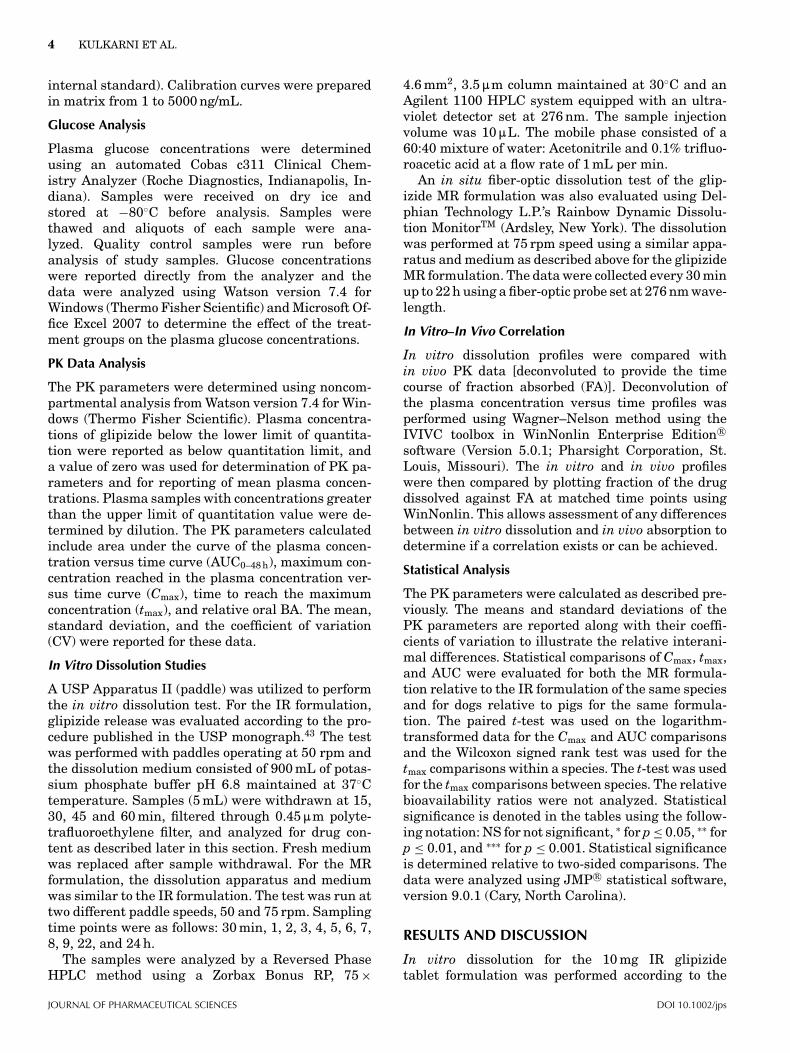
procedure published in the USP monograph.43 Onthe basis of the drug solubility at pH 6.8, 900 mLof the dissolution medium would provide approxi-mately 2.4 times the saturation solubility for a 10 mgdose.44 In other words, although 900 mL of pH 6.8buffer would not provide adequate sink conditions,it would still have the capacity to dissolve approx-imately 24 mg of glipizide. The use of dissolutionmedium of pH values higher than 6.8 would not beconsidered to be biorelevant.44 The monograph statesthat “Not less than 80% of the label claim is dissolvedin 45 minutes.”43 The dissolution profile, as shownin Figure 1a demonstrates that over 80% of the drugwas released within 15 min. In comparison, using thesame dissolution method, the 10 mg MR formulationdemonstrated a much slower rate of release, as il-lustrated in Figure 1b. Figure 1b reveals a dissolu-tion lag period at the early time points of 30 min, 1and 2 h, where there was no measurable drug releasefrom the dosage form. The lag period was evident atboth 50 and 75 rpm paddle speeds. After the initial lagphase, the drug released linearly between the 3 and9 h time points. The release rate had the character-istics of a zero-order release mechanism, as expectedfor an osmotic delivery system. Because of the longdissolution experiment and practical limitations im-posed by manual sampling and injecting into the high-performance liquid chromatography column, drug re-lease was not measured between 9 and 22 h. However,at the 22 h time point, most of the drug had been re-leased from the dosage form. Separate experimentswere conducted using an in situ fiber-optic dissolu-tion to confirm that the drug release was consistent(linear) between 9 and 22 h. The data are shown inFigure 1c.
Glipizide is characterized as a highly permeable,37
passively absorbed molecule with a FA value ofgreater than 95%. Furthermore, glipizide is reportedto undergo complete absorption in healthy humansubjects with approximately 5% of the drug subjectto first pass hepatic metabolism.38 The mean glip-izide plasma concentration–time profiles from the sixpigs administered 10 mg doses of either the IR or MRglipizide formulations are highlighted in Figure 2. Asummary of the mean PK data are also provided inTable 2. The data suggest that the drug is rapidly ab-sorbed from the IR formulation resulting in a meantmax value of 1.33 h. As expected, the rate of absorp-tion is much slower with the MR formulation, whichhad a mean tmax value of 8.67 h. The mean glipizideCmax for the IR formulation, 141.57 ng/mL, was signif-icantly higher than the MR formulation, which had aCmax of 19.51 ng/mL. The mean BA of MR formulationrelative to IR formulation from all dosed animals was92%, which suggested that both the formulations hadsimilar extents of absorption in pigs. The interani-
Figure 1. Mean in vitro dissolution profile and RSD(n = 6) in pH 6.8 phosphate buffer of glipizide 10 mg for-mulations: (a) IR formulation, (b) MR formulation, (c) MRformulation using in situ fiber-optic dissolution at 75 rpmspeed (n = 4).
mal variability in drug exposure (AUC) was moderatewith the CV in the range of 40%–60%.
Both physicochemical and physiological factorsplay critical roles that must be considered in devel-oping MR formulations that achieve the desired PKprofile. Important factors include the dosage forms’GI regional transit and residence times, the drug’s
DOI 10.1002/jps JOURNAL OF PHARMACEUTICAL SCIENCES

6 KULKARNI ET AL.
Figure 2. Mean glipizide plasma concentration (±SD, n =6)–time profiles following administration of 10 mg IR (blackcircle) and 10 mg MR (red square) formulations in pigs.
in vivo solubility and dissolution, and transepithe-lial absorption into the portal vein (and, potentially,the lymphatic system). Similarities between the PKprofile in pigs and the published data in humans40,41
suggest that glipizide absorption and disposition inpigs are potentially similar to humans.
Figure 3 shows the mean plasma concentration—time profiles for the two glipizide formulations dosedat 30 mg. Qualitatively, the plasma profile for the MRformulation at the 30 mg dose appears similar to the10 mg dose. However, there appears to be a bimodalrelease with some absorption occurring within 1–2 hfollowed by an extension in the absorption phase. Itshould also be noted that three 10 mg tablets wereadministered to achieve the 30 mg dose. The discrep-ancy in the PK data at early time points may stemfrom some animals chewing the tablets before swal-lowing. The consequence was dose dumping, wherethe MR formulation behaved like IR formulation insome animals at the 30-mg dose and skewing the data.Glipizide demonstrated dose proportional increasesin AUC across the two doses, 10 and 30 mg, respec-tively.
The PD response (glucose lowering) was assessedby comparing plasma glucose concentrations for the
Figure 3. Mean glipizide plasma concentration (±SD,n = 6)–time profiles following administration of 30 mg (3 ×10 mg) IR (black circle) and 30 mg (3 × 10 mg) MR (redsquare) formulations in pigs.
two glipizide formulations to plasma glucose concen-trations following administration of a placebo formu-lation. Samples for glucose evaluation were taken atthe same time intervals as those samples for PK eval-uation. Figure 4 illustrates a comparison of plasmaglucose concentrations for the three formulations. Atthe 10 mg dose, the mean percentage decrease in glu-cose compared with the placebo dose was 2% and11% for the IR and MR formulations, respectively.At the 30 mg dose, the mean percent decrease in glu-cose was 12% and 14%, respectively, for the IR andMR formulations. As expected, the plasma glucosein pigs decreases upon glipizide exposure. Interest-ingly, the data also reveal that the decrease in glu-cose concentration is formulation dependent. Fromthe 10 mg data, shown in Figure 4, it is apparent thatthe IR glipizide formulation produces a rapid decreasein blood glucose. The glucose concentration returnsto normal baseline levels in about 3 h. In contrast,the MR formulation produces a sustained decrease inplasma glucose for over 16 h. This agrees with pub-lished human data.41 From a statistical perspective,the glucose response of pigs varied by drug releasetype and strength as expected. However, because ofthe variability between subjects and the small sample
Table 2. Mean PK Parameters Following Single Oral Administration of 10 mg IR or MR GlipizideFormulations to Pigs (n = 6)
Dosage Form Parameter Average ±SD CV (%) Statistical Significance (MR to IR)
IR AUC (ng h/mL) 248.28 154.08 62IR Cmax (ng/mL) 141.57 84.12 59IR tmax (h) 1.33 0.52 39MR AUC (ng h/mL) 193.93 105.49 54 NSMR Cmax (ng/mL) 19.51 9.59 49 ∗∗MR tmax (h) 8.67 4.68 54 ∗RBA MR/IR AUC MR/IR 0.92 0.4
Significance denoted as follows: NS for not significant, ∗ for p ≤ 0.05 and ∗∗ for p ≤ 0.01.RBA, relative bioavailability.
JOURNAL OF PHARMACEUTICAL SCIENCES DOI 10.1002/jps

COMPARATIVE PK OF GLIPIZIDE FORMULATIONS IN PIGS AND DOGS 7
Figure 4. Mean plasma glucose concentration versustime after administration of placebo (black circle, solidline), IR (red circle, dotted line), and MR (green triangle,dashed line) glipizide formulations to six pigs. Glipizidedoses administered were 10 mg (top panel) and 30 mg (bot-tom panel).
size, only a few of the differences between the dosedand placebo response were statistically significant.For glucose AUC, there were three statistically signif-icant differences from placebo: 10 mg MR (p = 0.0455),30 mg IR (p = 0.0354), and 30 mg MR (p = 0.0113); allglipizide doses gave statistically lower glucose AUCsthan the placebo response. Only the 30 mg IR glipizidedose gave a statistically lower Cmax than the placebo(p = 0.0287). None of the dosed tmax responses werestatistically longer than the placebo response.
Figure 5 illustrates IVIVC for the MR formulationin pigs. Linear regression analysis shows an R2 of0.99, indicating a good fit of the data. The regressionline deviates from the line of unity (with a slope of ap-proximately 0.68), suggesting at each matched timepoint, FA in vivo is slightly lower than fraction dis-solved in vitro. The data suggest that although thein vitro release has a qualitative relationship withthe FA, additional optimization of the in vitro disso-lution method may be needed to adequately demon-
Figure 5. IVIVC model. Linear regression plot of FA ver-sus fraction dissolved in media determined for the glipizideMR formulation administered in pigs. Solid blue line dis-plays linear regression that had a correlation coefficient(R2) value of 0.99 and slope of 0.68. Dotted black line dis-plays the line of unity.
strate a Level A correlation with in vivo absorption.It is noteworthy that development of a biorelevantdissolution method is an iterative process, which re-quires in vivo data to optimize the in vitro method.5
In the case of glipizide MR formulation, because thedissolution method is not available in any of the stan-dard monographs (i.e., USP), the method was de-veloped on the basis of a literature review. Paddlespeeds ranging from 75 to 100 rpm in a USP Appa-ratus II have been utilized to characterize glipizideMR formulations.44–46 However, the faster in vitro re-lease rate relative to in vivo absorption indicates thatthe fluid hydrodynamics experienced by the MR for-mulation at 50 rpm in a USP dissolution apparatusare different from the hydrodynamics within the pigGI tract. As a result, the drug release rate was muchfaster in vitro than what was observed in vivo. Weare currently performing studies aimed at providinga meaningful IVIVC.
Figure 6 shows the mean glipizide plasma concen-tration versus time plots for IR and MR formulationin three beagle dogs that were administered a 10 mgdose. The corresponding PK parameters are displayedin Table 3. The drug was absorbed rapidly from theIR formulation with a mean tmax of approximately2 h, which was consistent with the results in pigs.However, the mean tmax for the MR formulation was5.3 h, which was significantly shorter than what wasobserved in pigs or values reported in humans. TheBA of the MR formulation as compared with the IRformulation was 21%, which was substantially lowerthan in pigs and humans, and exhibited a high in-teranimal CV of 81%. Statistical analysis of the datasuggests the following: dogs are significantly different
DOI 10.1002/jps JOURNAL OF PHARMACEUTICAL SCIENCES

8 KULKARNI ET AL.
Figure 6. Mean glipizide plasma concentration (±SD, n =3)–time profiles in male Beagle dogs after administration of10 mg IR (black circle) and MR (red square) formulations.
from pigs for both the IR and MR formulations forCmax and AUC. Dogs are not significantly differ-ent from pigs for both the IR and MR formulationsfor tmax.
Several differences between species could accountfor the observed PK differences including regional pH,transit rates, and surface area. On the basis of theIR results, intestinal pH is likely to have contributedless than the differences in regional transit times be-tween species. Differences in the extent of absorptionof the MR formulation in dogs and pigs could be afactor in the observed BA differences in these species.Several differences including gastric pH, surface areawithin the intestine, and regional transit time havebeen noted in dogs and pigs that could be factors thataffect the amount of glipizide absorbed between thesespecies. For example, DeSesso and Williams18 haveestimated surface areas within the small intestinein pigs, dogs, and humans. The estimated total sur-face area in the small intestine is larger in the pig(168–210 m2) compared with the dog (24.75–35 m2),and is closer to the estimated surface area in humans(252 m2). Transit time within the small intestine is ex-pected to correlate with the length of this segment. In
the dog, the transit time is reported to range from 0.5to 2 h, whereas in the pig, the transit time in rangedfrom 3.7 to 4.3 h.18,19 One potential explanation forthe observed short tmax and low BA in dogs is that theMR formulation did not reside in the dog intestinefor a sufficient length of time that would be neces-sary for complete drug release and absorption. Otherdifferences such as motility, emptying time and inter-digestive migrating myoelectric complex, compositionand volume of GI fluids could also contribute to thePK differences in pig and dogs.
CONCLUSION
The in vitro dissolution for the glipizide IR formula-tion was very rapid (>85% in 15 min) and met USPspecifications of not less than 80% release in 45 min.The MR formulation demonstrated a lag phase fol-lowed by a 22 h period of nearly constant rate of re-lease. The in vitro rate of release appears faster thanthe rate of in vivo absorption. Additional method de-velopment is needed to establish a Level A correlationfor the pig. PK evaluation of IR and MR glipizide for-mulations in pigs appears consistent with publishedclinical results. Additional studies in pigs would be re-quired to assess the potential for an IVIVC that wouldenable allometric scaling. At the 10 mg dose, the MRglipizide formulation showed high BA in the pig (92%relative to IR) consistent with clinical results. How-ever, in the dog the MR glipizide demonstrated lowerBA (21% relative to IR). Physiologic differences suchas small intestine surface area and transit time likelycontribute to the observed differences more than pHdifferences between dogs and pigs. In comparing thesurface area in the GI tract and transit time in thesespecies to humans, pigs are more consistent with thedata reported in humans than are dogs. Because ofthese similarities with humans, we believe that thepig is a good model for PK evaluation of prototypeMR monolithic formulations. We intend to further ex-plore this model by testing other MR technologies (hy-drophilic matrix-based release technology).
Table 3. Mean PK Parameters Following Single Oral Administration of 10 mg IR or MRGlipizide Formulations to Beagle Dogs (n = 3)
Statistical Significance
Dosage Form Parameter Average ±SD CV (%) MR to IR Dogs to Pigs
IR AUC (ng h/mL) 20100 1130 6 ∗∗∗IR Cmax (ng/mL) 4390 403 9 ∗∗∗IR tmax (h) 1.67 0.58 35 NSMR AUC (ng h/mL) 4040 3280 81 NS ∗∗∗MR Cmax (ng/mL) 308 181 59 ∗ ∗∗∗MR tmax (h) 5.33 2.31 43 NS NSRBA MR/IR AUC MR/IR 0.21 0.18
Significance denoted as follows: NS for not significant, ∗ for p ≤ 0.05, and ∗∗∗ for p ≤ 0.001.RBA, relative bioavailability.
JOURNAL OF PHARMACEUTICAL SCIENCES DOI 10.1002/jps

COMPARATIVE PK OF GLIPIZIDE FORMULATIONS IN PIGS AND DOGS 9
Finally, the in vitro dissolution methodology willalso be refined to investigate the potential to develop adesired Level A IVIVC. If in vivo absorption from pigscan be correlated with human absorption through theestablishment of an IVIVC in future studies, then thePK studies performed in the pig may also be utilized toselect MR formulations. Moreover, the establishmentof an IVIVC between pigs and humans may poten-tially enable the pig model to be used to establish anin vivo, clinically relevant product quality, and per-formance attributes of MR formulations during man-ufacturing scale-up.
ACKNOWLEDGMENTS
The authors would like to thank Dr. Timothy Kramerfor providing statistical analysis of the in vivo dataand Rose Ajamie for technical assistance with thedog study. We thank Dr. Paul Sirois for reviewingthe manuscript and providing valuable suggestions.The authors would like to acknowledge that all ofporcine studies were conducted in the Purdue Trans-lational Pharmacology (PTP) Core Facility of the Clin-ical Translational Sciences Award (Core Pilot Fund-ing NIH Grant # RR025761). The PTP would also liketo thank Bioanalytical Systems, Inc. and Dr. JeremyMarchant-Forde for providing access to the PigTurn-Culex-L R© units.
REFERENCES
1. Ritschel WA. 1989. Biopharmaceutic and pharmacokinetic as-pects in the design of controlled release peroral drug deliverysystems. Drug Dev Ind Pharm 15:1073–1103.
2. Qiu Y. 2009. Rational design of oral modified-release drugdelivery systems. In Developing solid oral dosage forms: Phar-maceutical theory and practice; Qiu Y, Chen Y, Zhang GZ,Liu L, Porter W, Eds. 1st ed. Academic Press, Waltham, Mas-sachusetts, pp 469–499.
3. Gray V, Kelly G, Xia M, Butler C, Thomas S, Mayock S. 2009.The science of USP 1 and 2 dissolution: Present challenges andfuture relevance. Pharm Res 26:1289–1302.
4. Skelly JP, Barr WH, Benet LZ, Doluisio JT, Goldberg AH, LevyG, Lowenthal DT, Robinson JR, Shah VP, Temple RJ, YacobiA. 1987. Report of the workshop on controlled-release dosageforms: Issues and controversies. Pharm Res 4:75–77.
5. Guidance for industry: Extended release oral dosage forms:Development, evaluation, and application of in vitro/in vivocorrelations. 1997. U.S. Department of Health and Human Ser-vices Food and Drug Administration. Center for Drug Eval-uation and Research (CDER). Accessed July 5, 2012, at:http: / / www.fda.gov/downloads/Drugs/GuidanceCompliance-RegulatoryInformation/Guidances/UCM070239.pdf.
6. Kimura T, Higaki K. 2002. Gastrointestinal transit and drugabsorption. Biol Pharm Bull 25:149–164.
7. Fadda HM, Sousa T, Carlsson AS, Abrahamsson B, WilliamsJG, Kumar D, Basit AW. 2010. Drug solubility in luminalfluids from different regions of the small and large intestine ofhumans. Mol Pharm 7:1527–1532.
8. Coupe AJ, Davis SS, Wilding IR. 1991. Variation in gastroin-testinal transit of pharmaceutical dosage forms in healthy sub-jects. Pharm Res 8:360–364.
9. Collins PJ, Horowitz M, Cook DJ, Harding PE, Shearman DJC.1983. Gastric emptying in normal subjects—A reproducibletechnique using a single scintillation camera and computersystem. Gut 24:1117–1125.
10. Charman WN, Porter CJH, Mithani S, Dressman JB. 1997.Physicochemical and physiological mechanisms for the effectsof food on drug absorption: The role of lipids and pH. J PharmSci 86:269–282.
11. Podczeck F, Mitchell CL, Newton JM, Evans D, Short MB.2007. The gastric emptying of food as measured by gamma-scintigraphy and electrical impedance tomography (EIT) andits influence on the gastric emptying of tablets of differentdimensions. J Pharm Pharmacol 59(11):1527–1536.
12. McConnell EL, Fadda HM, Basit AW. 2008. Gut instincts:Explorations in intestinal physiology and drug delivery. Int JPharm 364:213–226.
13. Karim A, Burns T, Janky D, Hurwitz A. 1985. Food-inducedchanges in theophylline absorption from controlled-release for-mulations. Part II. Importance of meal composition and dosingtime relative to meal intake in assessing changes in absorp-tion. Clin Pharmacol Ther 38:642–647.
14. Yu LX, Zhang H. 2004. Dissolution testing for solid oral drugproducts: Theoretical considerations. Am Pharm Rev 7:26–31.
15. Gao JG, Hussain MA, Motheram R, Gray DAB, Benedek IH,Fiske WD, Doll WJ, Sandefer E, Page RC, Digenis GA. 2007.Investigation of human pharmacoscintigraphic behavior of twotablets and a capsule formulation of a high dose, poorly wa-ter soluble/highly permeable drug (efavirenz). J Pharm Sci96:2970–2977.
16. Donauer N, Lobenberg R. 2007. A mini review of scientific andpharmacopeial requirements for the disintegration test. Int JPharm 345:2–8.
17. Curtis MJ. 2010. The RETHINK project: Impact of toxicitytesting in the minipig as an alternative approach in regula-tory toxicity testing. J Pharmacol Toxicol Methods 62(3):157–162.
18. Desso, JM, Williams, AL. 2008. Contrasting the gastrointesti-nal tracts of mammals: Factors that influence absorption. AnnRep Med Chem 43:353–371.
19. De Zwart LL, Rompelberg CJM, Sips AJAM, Welink J, van En-gelen JGM. 1999. Anatomical and physiological differencesbetween various species used in studies on the pharmacoki-netics and toxicology of xenobiotics. RIVM report 623860010.
20. Kararli TT. 1995. Comparison of the gastrointestinal anatomy,physiology, and biochemistry of humans and commonly usedlaboratory animals. Biopharm Drug Dispos 16:351–380.
21. Sjogren E, Bredberg U, Lennernas H. 2012. The pharmacoki-netics and hepatic disposition of repaglinide in pigs: Mech-anistic modeling of metabolism and transport. Mol Pharm9:823–841.
22. Thorn HA, Lundahl A, Schrickx JA, Dickinson PA, LennernasH. 2011. Drug metabolism of CYP3A4, CYP2C9 and CYP2D6substrates in pigs and humans. Eur J Pharm Sci 43:89–98.
23. Lundahl A, Hedeland M, Bondesson U, Lennernas H. 2011.In vivo investigation in pigs of intestinal absorption, hepa-tobiliary disposition, and metabolism of the 5"-reductase in-hibitor finasteride and the effects of coadministered ketocona-zole. Drug Metab Dispos 39:847–857.
24. Matsson EM, Palm JE, Eriksson UG, Bottner P, Lundahl A,Knutson L, Lennernas H. 2011. Effects of ketoconazole onthe in vivo biotransformation and hepatobiliary transport ofthe thrombin inhibitor AZD0837 in pigs. Drug Metab Dispos39:239–246.
25. Sjogren E, Bredberg U, Allard E, Arvidsson B, Bergquist J, An-dersson TB, Lennernas H. 2010. Hepatic disposition of xime-lagatran and its metabolites in pig; prediction of the impact ofmembrane transporters through a simple disposition model.Pharm Res 27:597–607.
DOI 10.1002/jps JOURNAL OF PHARMACEUTICAL SCIENCES

10 KULKARNI ET AL.
26. Fink-Gremmels J. 2008. Implications of hepatic cytochromeP450-related biotransformation processes in veterinary sci-ences. Eur J Pharmacol 585:502–509.
27. Kohn F, Sharifi AR, Taubert H, Malovrh S, Simianer H. 2007.Breeding for low body weight in Goettingen minipigs. J AnimBreed Genet 125:20–28.
28. Skaanild MT. 2006. Porcine cytochrome P450 and metabolism.Curr Pharm Des 12:1421–1427.
29. Skaanild MT, Friis C. 2000. Expression changes of CYP2A andCYP3A in microsomes from pig liver and cultured hepatocytes.Pharm Toxicol 87:174–178.
30. Soucek P, Zuber R, Anzenbacherova E, Anzenbacher P,Guengerich FP. 2001. Minipig cytochrome P450 3A, 2A and2C enzymes have similar properties to human analogs. BMCPharmacol 1:11–14.
31. Bader A, Hansen T, Kirchner G, Allmeling C, Haverich A,Borlak JT. 2000. Primary porcine enterocyte and hepatocytecultures to study drug oxidation reactions. Br J Pharmacol129:331–342.
32. Anzenbacher P, Soucek P, Aanzenbacherova E, Gut I, HrubyK, Svoboda Z, Kvetina J. 2008. Presence and activity of cy-tochrome P450 isoforms in minipig liver microsomes. Compar-ison with human liver samples. Drug Metab Dispos 26:56–59.
33. DeGraw TR, Knipp G, Matthews D, Marchant-Forde J, MannD, McCainR. 2009. Measuring induction of carbamazepinemetabolism in pigs using automated blood sampling (Abstract#380). AAPS J 11(Suppl 1).
34. Rohde-Johnson C, DeGraw RT, Marchant-Forde J, Knipp GT,McCain RR, Matthews DL. 2009. ECG and pharmacokineticassessment in the freely moving pig. 2009 Minipig ResearchForum of North America, Lansdowne, Virginia:.
35. Petri N, Bergman E, Forsell P, Hedeland M, Bondesson U,Knutson L, Lennernas H. 2006. First-pass effects of verapamilon the intestinal absorption and liver disposition of fexofena-dine in the porcine model. Drug Metab Dispos 34:1182–1189.
36. Sjodin E, Fritsch H, Eriksson U, Logren U, Nordgren A, ForsellP, Knutson L Lennernas H. 2008. Intestinal and hepatobiliarytransport of ximelagatran and its metabolites in pigs. DrugMetab Dispos 36:1519–1528.
37. Skold C, Winiwarter S, Wernevik J, Bergstrom F, EngstromL, Allen R, Box K, Comer J, Mole J, Hallberg A, Lennernas
H, Lundstedt T, Ungell A, Karlen A. 2006. Presentation ofa structurally diverse and commercially available drug dataset for correlation and benchmarking studies. J Med Chem49:6660–6671.
38. Brogden RN, Heel RC, Pakes GE, Speight TM, Avery GS. 1979.Glipizide: A review of its pharmacological properties and ther-apeutic use. Drugs 18:329–353.
39. Gram LK, Rist GM, Lennernas H, Steffansen B. 2009. Impactof carriers in oral absorption: Permeation across Caco-2 cellsfor the organic anions estrone-3-sulfate and glipizide. Eur JPharm Sci 37:378–386.
40. Berelowitz M, Fischette C, Cefalu W, Schade D, SutfinT, Kourides 1994. Comparative efficacy of a once-dailycontrolled-release formulation of glipizide and immediate-release glipizide in patients with NIDDM. Diabetes Care17:1460–1464.
41. Chung M, Kourides I, Canovatchel W, Sutfin T, Messig M,Chaiken RL. 2002. Pharmacokinetics and pharmacodynamicsof extended-release glipizide GITS compared with immediate-release glipizide in patients with type II diabetes mellitus. JClin Pharmacol 42:651–657.
42. Marchant-Forde JN, Matthews DL, Poletto R, McCain RR,Mann DD, McGraw RT, Hampsch J, Peters S, Knipp GT,Kissinger CB. 2012. Plasma cortisol and noradrenalin con-centrations in pigs: Automated sampling of freely moving pigshoused in the PigTurn R© versus manually sampled and re-strained pigs. Anim Welf 21:197–205.
43. The United States Pharmacopoeia and National FormularyUSP 34 NF 29 USP Monographs Glipizide Tablets. 2011.The United States Pharmacopeial Convention, Inc., Rockville,Maryland, pp. 2972:2973.
44. Fassihi R, Jamzad S. 2006. Role of surfactant and pH ondissolution properties of fenofibrate and glipizide—A technicalnote. AAPS PharmSciTech 7:E1–E6.
45. Fassihi R, Jamzad S. 2006. Development of a controlled re-lease low dose class II drug—Glipizide. Int J Pharm 312:24–32.
46. Sankalia JM, Sankalia MG, Mashru RC. 2008. Drug re-lease and swelling kinetics of directly compressed glipizidesustained-release matrices: Establishment of level A IVIVC. JControl Release 129:49–58.
JOURNAL OF PHARMACEUTICAL SCIENCES DOI 10.1002/jps