Is life conceivable without chemotaxis ? without chemotaxis ? Dr. habil. Kőhidai László 2011.
This article was downloaded by: [University of Arizona]On: 27 September 2014, At: 05:36Publisher: Taylor & FrancisInforma Ltd Registered in England and Wales Registered Number: 1072954 Registered office: Mortimer House,37-41 Mortimer Street, London W1T 3JH, UK
Journal of Biomolecular Structure and DynamicsPublication details, including instructions for authors and subscription information:http://www.tandfonline.com/loi/tbsd20
Comparative molecular dynamics simulation studies fordetermining factors contributing to the thermostabilityof chemotaxis protein “CheY”Manish Paula, Mousumi Hazrab, Arghya Barmanc & Saugata Hazrad
a Department of Zoology, Naihati Rishi Bankim Chandra College, West Bengal StateUniversity, Naihati, North 24 Parganas, West Bengal, India.b Department of Microbiology, University of Kalyani, Kalyani, West Bengal, India.c Department of Chemistry, University of Miami, 1301 Memorial Drive, Coral Gables, FL,33146, USA.d Department of Biochemistry, Albert Einstein College of Medicine, 1300 Morris Park Avenue,Bronx, NY, 10461, USA.Published online: 24 Jun 2013.
To cite this article: Manish Paul, Mousumi Hazra, Arghya Barman & Saugata Hazra (2014) Comparative molecular dynamicssimulation studies for determining factors contributing to the thermostability of chemotaxis protein “CheY”, Journal ofBiomolecular Structure and Dynamics, 32:6, 928-949, DOI: 10.1080/07391102.2013.799438
To link to this article: http://dx.doi.org/10.1080/07391102.2013.799438
PLEASE SCROLL DOWN FOR ARTICLE
Taylor & Francis makes every effort to ensure the accuracy of all the information (the “Content”) containedin the publications on our platform. However, Taylor & Francis, our agents, and our licensors make norepresentations or warranties whatsoever as to the accuracy, completeness, or suitability for any purpose of theContent. Any opinions and views expressed in this publication are the opinions and views of the authors, andare not the views of or endorsed by Taylor & Francis. The accuracy of the Content should not be relied upon andshould be independently verified with primary sources of information. Taylor and Francis shall not be liable forany losses, actions, claims, proceedings, demands, costs, expenses, damages, and other liabilities whatsoeveror howsoever caused arising directly or indirectly in connection with, in relation to or arising out of the use ofthe Content.
This article may be used for research, teaching, and private study purposes. Any substantial or systematicreproduction, redistribution, reselling, loan, sub-licensing, systematic supply, or distribution in anyform to anyone is expressly forbidden. Terms & Conditions of access and use can be found at http://www.tandfonline.com/page/terms-and-conditions

Comparative molecular dynamics simulation studies for determining factors contributing tothe thermostability of chemotaxis protein “CheY”
Manish Paula, Mousumi Hazrab, Arghya Barmanc and Saugata Hazrad*aDepartment of Zoology, Naihati Rishi Bankim Chandra College, West Bengal State University, Naihati, North 24 Parganas,West Bengal, India; bDepartment of Microbiology, University of Kalyani, Kalyani, West Bengal, India; cDepartment of Chemistry,University of Miami, 1301 Memorial Drive, Coral Gables, FL 33146, USA; dDepartment of Biochemistry, Albert EinsteinCollege of Medicine, 1300 Morris Park Avenue, Bronx, NY 10461, USA
Communicated by Ramaswamy H. Sarma
(Received 6 November 2012; final version received 22 April 2013)
Comparative molecular dynamics simulations of chemotaxis protein “CheY” from thermophilic origin Thermotogamaritima and its mesophilic counterpart Salmonella enterica have been performed for 10 ns each at 300 and 350K, and20 ns each at 400 and 450K. The trajectories were analyzed in terms of different factors like root-mean-square deviation,root-mean-square fluctuation, radius of gyration, solvent accessible surface area, H-bonds, salt bridge content, and pro-tein–solvent interactions which indicate distinct differences between the two of them. The two proteins also follow dis-similar unfolding pathways. The overall flexibility calculated by the trace of the diagonalized covariance matrix displayssimilar flexibility of both the proteins near their optimum growth temperatures. However, at higher temperatures meso-philic protein shows increased overall flexibility than its thermophilic counterpart. Principal component analysis alsoindicates that the essential subspaces explored by the simulations of two proteins at different temperatures are nonover-lapping and they show significantly different directions of motion. However, there are significant overlaps within thetrajectories and similar direction of motions are observed for both proteins at 300K. Overall, the mesophilic proteinleads to increased conformational sampling of the phase space than its thermophilic counterpart. This is the first everstudy of thermostability of CheY protein homologs by using protein dynamism as a main impact. Our study might beused as a model for studying the molecular basis of thermostability of two homologous proteins from two organismsliving at different temperatures with less visible differences.
Keywords: CheY; signal transduction; MD simulation; GROMACS; thermostability; salt bridge; PCA; proteinengineering
Introduction
Chemotaxis is a biochemical signaling process in whichbacterial flagellar rotation is controlled by several envi-ronmental cues such as pH, chemicals, temperature, etc.Motile bacteria are able to change the direction of theirmigration through solution in response to the concentra-tion gradients of attractants and repellents (Spohn &Scarlato, 2001). Chemotactic behavior requires detectionof the chemical signal, signal transduction, and subse-quent motor response. Chemotaxis helps bacteria tosearch for food and also escape hostile environments(Eisenbach & Caplan, 1998). There are a number ofproteins involved in the bacterial chemotactic signalcascade. Through several studies using molecular biol-ogy, genetics, biochemical, and biophysical methods it
has been established that “Che” proteins play importantroles in the whole process. “Che” proteins are involved insignal transduction and form a “two component system”.Two component signal transduction pathways are definedby the conservation of a histidine kinase autophosphory-lating at a conserved histidine residue and a response reg-ulator with a conserved aspartate phosphorylation site(Allweiss, Dostal, Carey, Edwards, & Freter, 1977). Themembrane receptor proteins initially receive the environ-mental signal and transmit it to the cell interior. Afterreceiving the signal, the cytoplasmic proteins get stimu-lated and amplify the signal, (1) by working as a DNAbinding protein to enhance expression of particular genes,(2) by binding to transcription inducers to perform thesimilar job in an indirect way, and (3) by binding to
*Corresponding author. Email: [email protected] Paul and Mousumi Hazra contributed equally to this work
Journal of Biomolecular Structure and Dynamics, 2014Vol. 32, No. 6, 928–949, http://dx.doi.org/10.1080/07391102.2013.799438
� 2013 Taylor & Francis
Dow
nloa
ded
by [
Uni
vers
ity o
f A
rizo
na]
at 0
5:36
27
Sept
embe
r 20
14
downstream proteins to change their conformationscritical to some biological processes (Hoch, 2000).
The two component system formed by “Che” proteinsis relatively complicated than the models, involving morethan two proteins. During chemotaxis, the sensor CheAreceives signals from transmembrane chemoreceptors withthe help of CheW (Bourret, Davagnino, & Simon, 1993;Gegner, Graham, Roth, & Dahlquist, 1992; Hazelbauer,Berg, & Matsumura, 1993) and then transfers thesignal to the response regulator, CheY, by the process ofphosphorylation. Phosphorylated CheY (CheYP) isdephosphorylated by its autophosphatase activity, a reac-tion enhanced by CheZ (Kuo & Koshland, 1989). A seriesof conformational changes and protein–protein interac-tions occur in between those phosphotransfer eventsinvolving several other proteins (e.g. FliM, FliN, andFliG), which help switch motor to reverse the direction offlagellar rotation from counterclockwise to clockwise.
The main focus of our current study is the protein“CheY”. The length of this protein ranges from 120 to130 residues (Stock, Koshland, & Stock, 1985). CheY iscomposed of central patches of β sheets surrounded by anumber of α helices. The number of α helix and βstrands varies in different bacterial species. CheY proteincontains different flexible loop regions in its structure.Each CheY protein contains one receiver domain andone response regulatory domain, respectively. It plays akey role in the control of the bacterial movements inresponse to environmental chemotactic stimuli (Volz &Matsumura, 1991). The phosphoryl group is received byCheY from a conserved histidine residue of histidinekinase CheA (Djordjevic & Stock, 1998). This leads to aconformational change in the regulatory domain andhelps it to bind with the protein FliM. Binding to FliMleads to a complex series of interactions involving motorproteins and in this way, CheY plays a major role intransmitting chemical stimuli to the bacterial flagella viaa signal transduction cascade (Matsumura, Rydel, Lina-meir, & Vacante, 1984; McEvoy, Hausrath, Randolph,Remington, & Dahlquist, 1998).
The primary target of our study is to understand thefactors contributing towards the thermostability of CheY.We have selected two representatives of the CheY pro-tein, one is thermophilic and the other is mesophilic(Dasgupta & Dattagupta, 2008; Knaggs, Salsbury,Edgell, & Fetrow, 2007; Liang et al., 2009). Thermosta-bility is a property of a protein which could be utilizedto measure the potential of the protein to retain its sec-ondary structure content at its maximum tolerabletemperature. A thermophilic protein can retain its sec-ondary structure more compactly at higher temperaturescompared to its mesophilic counterpart. Proteins that arestable at high temperatures have attracted much interestbecause they have potential industrial applications(Bruins, Janssen, & Boom, 2001; Sagi, Khan, &
Eisenbach, 2003). Thus, it is important to understandhow these thermophilic proteins remain stable at elevatedtemperatures. Such an understanding may help to eluci-date the critical principles of protein engineering andhelp in constructing the design of thermostable proteinsfor industrial applications. Thermostability is dependenton several factors like hydrogen bonding, hydrophobicpacking, helix dipole stabilization, etc. Protein thermosta-bility can also be increased by improving electrostaticinteraction and removing residues that are sensitive tooxidation or deamination. With a proper understandingof those factors, it is possible to perform knowledge-based protein engineering to generate proteins withhigher thermostability for industrial applications (Turner,Mamo, & Karlsson, 2007).
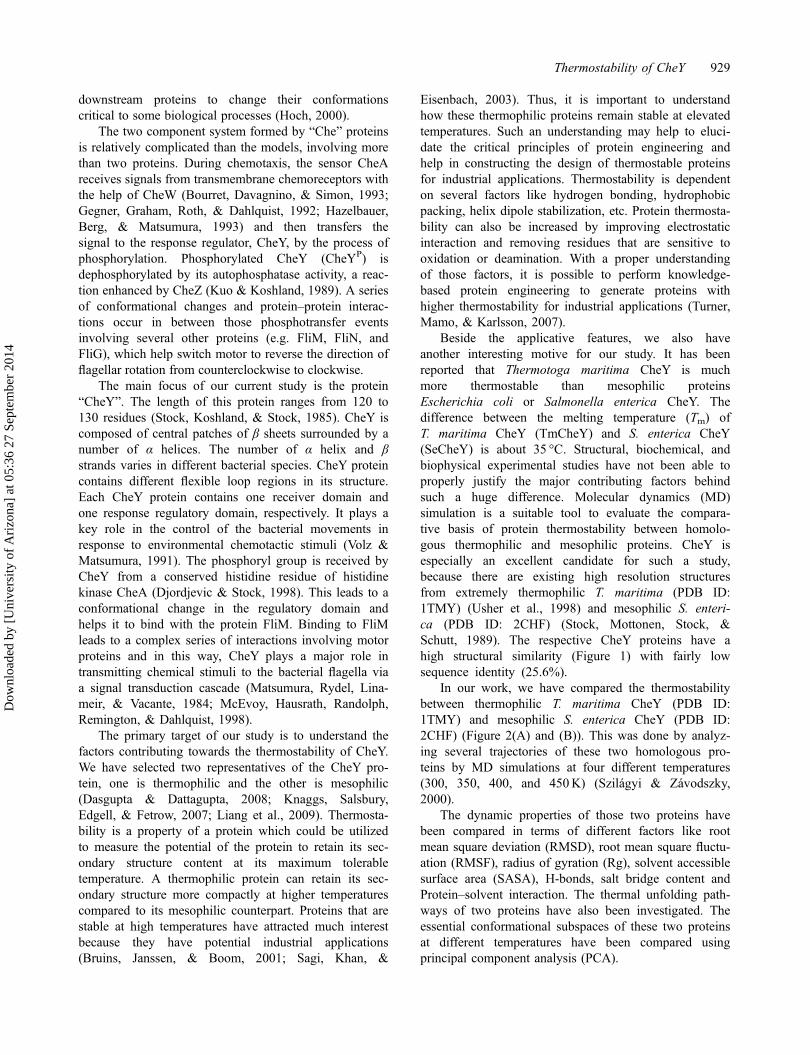
Beside the applicative features, we also haveanother interesting motive for our study. It has beenreported that Thermotoga maritima CheY is muchmore thermostable than mesophilic proteinsEscherichia coli or Salmonella enterica CheY. Thedifference between the melting temperature (Tm) ofT. maritima CheY (TmCheY) and S. enterica CheY(SeCheY) is about 35 °C. Structural, biochemical, andbiophysical experimental studies have not been able toproperly justify the major contributing factors behindsuch a huge difference. Molecular dynamics (MD)simulation is a suitable tool to evaluate the compara-tive basis of protein thermostability between homolo-gous thermophilic and mesophilic proteins. CheY isespecially an excellent candidate for such a study,because there are existing high resolution structuresfrom extremely thermophilic T. maritima (PDB ID:1TMY) (Usher et al., 1998) and mesophilic S. enteri-ca (PDB ID: 2CHF) (Stock, Mottonen, Stock, &Schutt, 1989). The respective CheY proteins have ahigh structural similarity (Figure 1) with fairly lowsequence identity (25.6%).
In our work, we have compared the thermostabilitybetween thermophilic T. maritima CheY (PDB ID:1TMY) and mesophilic S. enterica CheY (PDB ID:2CHF) (Figure 2(A) and (B)). This was done by analyz-ing several trajectories of these two homologous pro-teins by MD simulations at four different temperatures(300, 350, 400, and 450K) (Szilágyi & Závodszky,2000).
The dynamic properties of those two proteins havebeen compared in terms of different factors like rootmean square deviation (RMSD), root mean square fluctu-ation (RMSF), radius of gyration (Rg), solvent accessiblesurface area (SASA), H-bonds, salt bridge content andProtein–solvent interaction. The thermal unfolding path-ways of two proteins have also been investigated. Theessential conformational subspaces of these two proteinsat different temperatures have been compared usingprincipal component analysis (PCA).
Thermostability of CheY 929
Dow
nloa
ded
by [
Uni
vers
ity o
f A
rizo
na]
at 0
5:36
27
Sept
embe
r 20
14
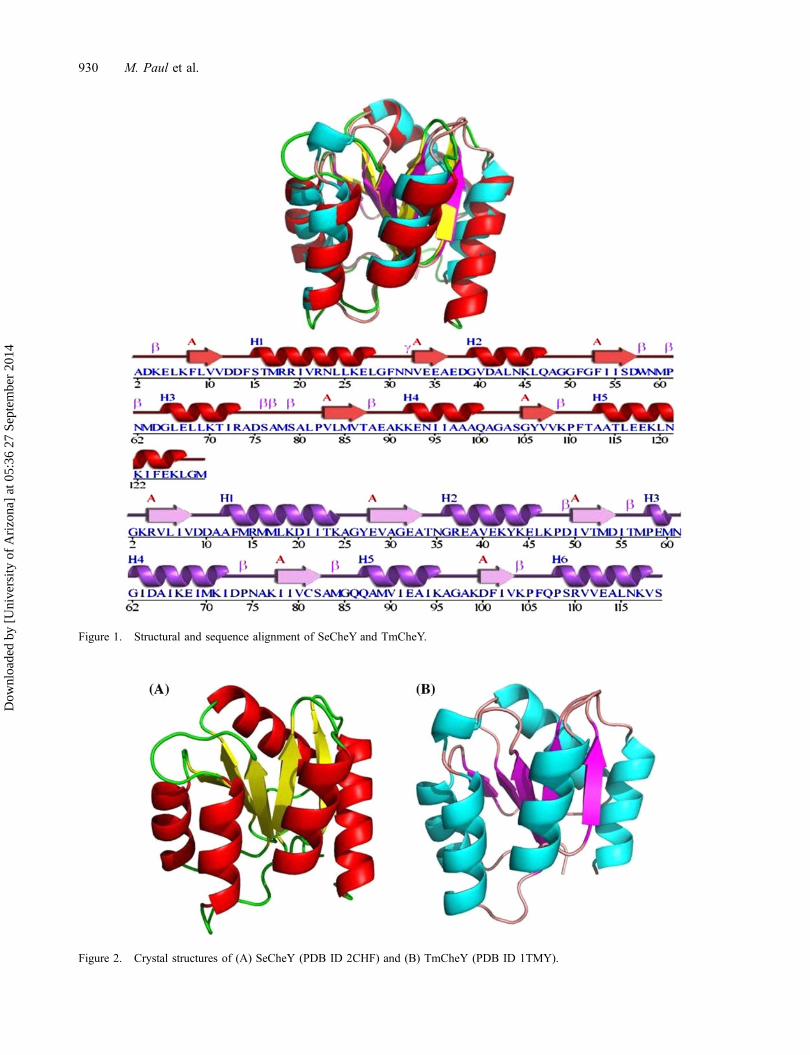
Figure 1. Structural and sequence alignment of SeCheY and TmCheY.
Figure 2. Crystal structures of (A) SeCheY (PDB ID 2CHF) and (B) TmCheY (PDB ID 1TMY).
930 M. Paul et al.
Dow
nloa
ded
by [
Uni
vers
ity o
f A
rizo
na]
at 0
5:36
27
Sept
embe
r 20
14
Materials and methods
The crystal structures of two homologous for the CheYfrom T. maritima (PDB ID: 1TMY) (Usher et al., 1998)and S. enterica (PDB ID: 2CHF) (Stock et al., 1989)were obtained from RCSB Protein Database (PDB)(http://www.rcsb.org/pdb/home/home.do) and used asstarting models for the MD simulations. Crystal structuresof CheY from T. maritima (TmCheY) and S. enterica(SeCheY) have resolutions of 1.90 and 1.80Å,respectively. These two are consisted of residues 2–119and 2–129, respectively.
All MD simulations were performed using the GRO-MACS 4.0.7 (Hess, Kutzner, van der Spoel, & Lindahl,2008) and OPLS-AA all atom force field (Haldar, Paul,Joshi, Dasgupta, & Chattopadhyay, 2012; Huang et al.,2012; Kundu & Roy, 2010; Lindahl, Hess, & van derSpoel, 2001) implemented on Intel Xeon Quad CoreW3530 2.8 8M 1366 Processor with LINUX environ-ment. SeCheY was solvated in a cubic box (dimension6.14� 6.14� 6.14 nm3) of 7080 SPC216 water mole-cules and TmCheY was solvated in a cubic box (dimen-sion 6.13� 6.13� 6.13 nm3) of 7076 SPC216 watermolecules (Miyamoto & Kollman, 1992). Four watermolecules were replaced by Na+ to neutralize the netcharge of the system for SeCheY protein. No counterions were added to TmCheY protein because it wasalready neutralized. All protein atoms were maintained ata distance equal to 1.0 nm from the box edges. The sol-vated systems were subjected to energy minimization for3000 steps by steepest descent minimization method.
After performing energy minimization, both the mini-mized systems were equilibrated for 100 ps at four differ-ent temperatures (300, 350, 400, and 450) by positionrestrained MD simulation in order to maintain pressureand temperature of systems and relax the solvent. Fol-lowing equilibration, both systems were then subjectedto final MD simulations for 10 ns each at 300 and 350K,and for 20 ns each at 400 and 450K temperatures. Peri-odic boundary conditions were applied under isothermaland isobaric conditions using Berendsen Coupling algo-rithm with relaxation time of .1 and .2 ps, respectively(Weber, Hünenberger, & McCammon, 2000). TheLINCS algorithm was used to constrain bond lengthsusing a time step of 2 fs for both systems (Hess, Bekker,Berendsen, & Fraaije, 1997). Electrostatic interactionswere calculated using the Particle Mesh Ewald method,van der Waals, and coulombic interactions were calcu-lated with cutoff at 1.0 nm (Darden, Perera, Li, & Peder-sen, 1999). Secondary structure analysis was performedusing the program DSSP (Kabsch & Sander, 1983). Weused a web-based server BotDB which provides detailedinformation regarding secondary structure includingalpha helices, 310- and 5-helices, beta strands, betabridges, hydrogen bonded turns, and bends. The tools
provided by GROMACS program package were utilizedto analyze different MD trajectories. PyMOL (DeLano,2002) and XMGrace (Vaught, 1996) programs were usedto analyze and to prepare publication quality figures. Thelength of salt bridges in both the homolog CheY proteinswas calculated by web-based ESBRI programming tool(Kumar & Nussinov, 1999). All the salt bridges werecalculated with the cutoff value of .40 nm. The covari-ance matrices of the positional fluctuations of Cα atoms,as well as quantitative characterization of the dynamismof proteins were analyzed with PCA or essential dynam-ics (ED) (Amadei, Ceruso, & Nola, 1999; Amadei,Linssen, & Berendsen, 1993). First 10 eigenvectors forboth the proteins were good enough to analyze. The EDmethod was based on the construction of the covariancematrix of the coordinate fluctuations of the simulatedproteins. The covariance matrix was diagonalized toobtain the eigenvectors and eigenvalues that provideinformation about correlated motions throughout theprotein.
The root-mean-square inner product (RMSIP) wascalculated to measure the degree of overlap between theconformational spaces of the two proteins explored bythe simulation at both same and different temperatures.The formula of RMSIP (de Groot, van Aalten, Amadei,& Berendsen, 1996; van Aalten, de Groot, Findlay,Berendsen, & Amadei, 1997) was defined as:
RMSIP ¼ffiffiffiffiffiffiffiffiffiffiffiffiffiffiffiffiffiffiffiffiffiffiffiffiffiffiffiffiffiffiffiffiffiffiffiffiffiffiffiffiffiffi1
10
X10i¼1
X10j¼1
ðgai � gbj Þ2vuut
where i, j=modes, gai � gbj = ith and jth normalizedeigenvectors of the systems a and b, respectively.
The RMSIP was calculated from the equilibrated por-tion of the trajectories of two proteins. For diagonal ele-ments, the RMSIP was computed by splitting theequilibrated portion of the protein trajectory into twoequal halves. Cosine content (Ci) was another importantfactor to describe the amplitude of corroborative or non-corroborative motion of backbone atom in covariancematrix (Grottesi, Ceruso, Colosimo, & Di Nola, 2002;Kundu & Roy, 2009; Tang & Liu, 2007). Ci of theeigenvector i was calculated as follows:
Ci ¼ 2
T
Z T
0
cosðiptÞpiðtÞdt� �2 Z T
0
p2i ðtÞdt� ��1
where T= upper limit of cosine content, pi= the ampli-tude of the motion along the eigenvector i, t= time, anddt= change of time. The cosine content could be takenvalues between 0 (no cosine) in corroborative motionand 1 (a perfect cosine) in noncorroborative motion.
Thermostability of CheY 931
Dow
nloa
ded
by [
Uni
vers
ity o
f A
rizo
na]
at 0
5:36
27
Sept
embe
r 20
14
Result and discussion
Root mean square deviation
Structures of two proteins can be best compared byusing RMSD. In course of simulation, it measures thedifference between backbone atoms’ positions of the pro-tein, relative to their starting structures. The smaller thedeviation, the more spatially equivalent the two states(starting and simulated) of the proteins are, the more sta-ble the protein structure is.
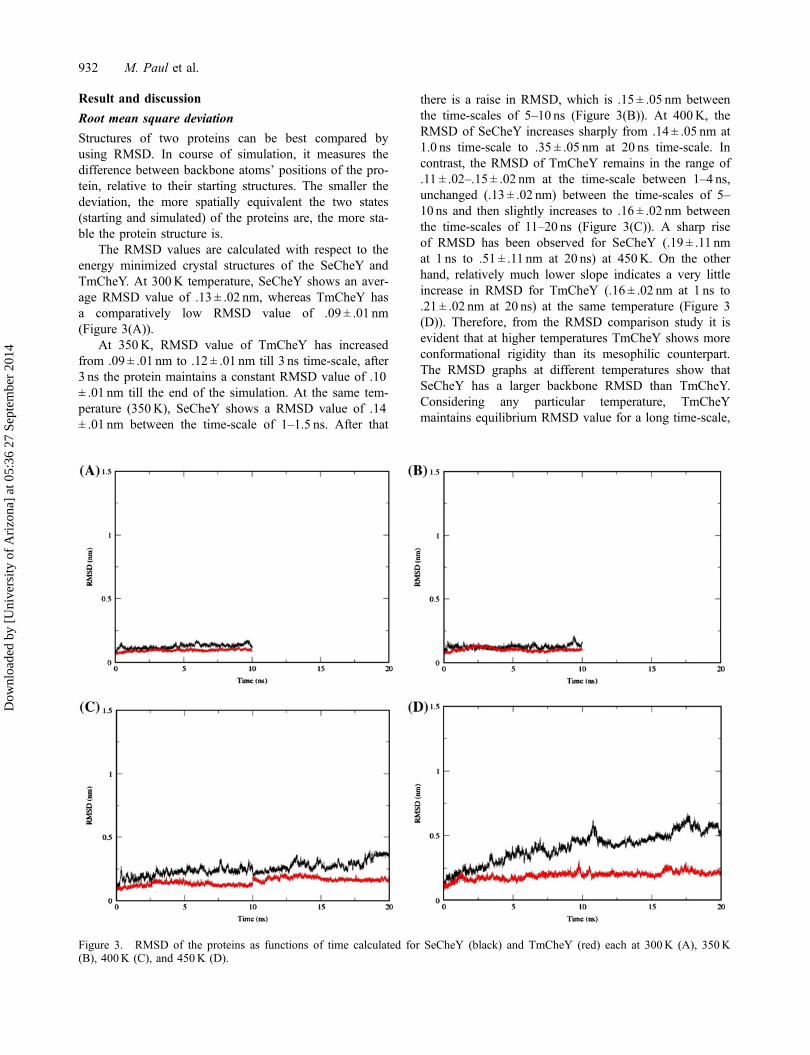
The RMSD values are calculated with respect to theenergy minimized crystal structures of the SeCheY andTmCheY. At 300K temperature, SeCheY shows an aver-age RMSD value of .13 ± .02 nm, whereas TmCheY hasa comparatively low RMSD value of .09 ± .01 nm(Figure 3(A)).
At 350K, RMSD value of TmCheY has increasedfrom .09 ± .01 nm to .12 ± .01 nm till 3 ns time-scale, after3 ns the protein maintains a constant RMSD value of .10± .01 nm till the end of the simulation. At the same tem-perature (350K), SeCheY shows a RMSD value of .14± .01 nm between the time-scale of 1–1.5 ns. After that
there is a raise in RMSD, which is .15 ± .05 nm betweenthe time-scales of 5–10 ns (Figure 3(B)). At 400K, theRMSD of SeCheY increases sharply from .14 ± .05 nm at1.0 ns time-scale to .35 ± .05 nm at 20 ns time-scale. Incontrast, the RMSD of TmCheY remains in the range of.11 ± .02–.15 ± .02 nm at the time-scale between 1–4 ns,unchanged (.13 ± .02 nm) between the time-scales of 5–10 ns and then slightly increases to .16 ± .02 nm betweenthe time-scales of 11–20 ns (Figure 3(C)). A sharp riseof RMSD has been observed for SeCheY (.19 ± .11 nmat 1 ns to .51 ± .11 nm at 20 ns) at 450K. On the otherhand, relatively much lower slope indicates a very littleincrease in RMSD for TmCheY (.16 ± .02 nm at 1 ns to.21 ± .02 nm at 20 ns) at the same temperature (Figure 3(D)). Therefore, from the RMSD comparison study it isevident that at higher temperatures TmCheY shows moreconformational rigidity than its mesophilic counterpart.The RMSD graphs at different temperatures show thatSeCheY has a larger backbone RMSD than TmCheY.Considering any particular temperature, TmCheYmaintains equilibrium RMSD value for a long time-scale,
Figure 3. RMSD of the proteins as functions of time calculated for SeCheY (black) and TmCheY (red) each at 300K (A), 350K(B), 400K (C), and 450K (D).
932 M. Paul et al.
Dow
nloa
ded
by [
Uni
vers
ity o
f A
rizo
na]
at 0
5:36
27
Sept
embe
r 20
14
whereas SeCheY takes longer time to attain the equilib-rium (Table 1). Thus, consistent with the observed ther-mophilicity of TmCheY, changing temperature showslittle effect on the stability of its native structure accord-ing to the MD simulation. For SeCheY, more significantdeviations from the native structures have been observedat higher temperatures compared to the lower ones.
Root-mean-square fluctuation
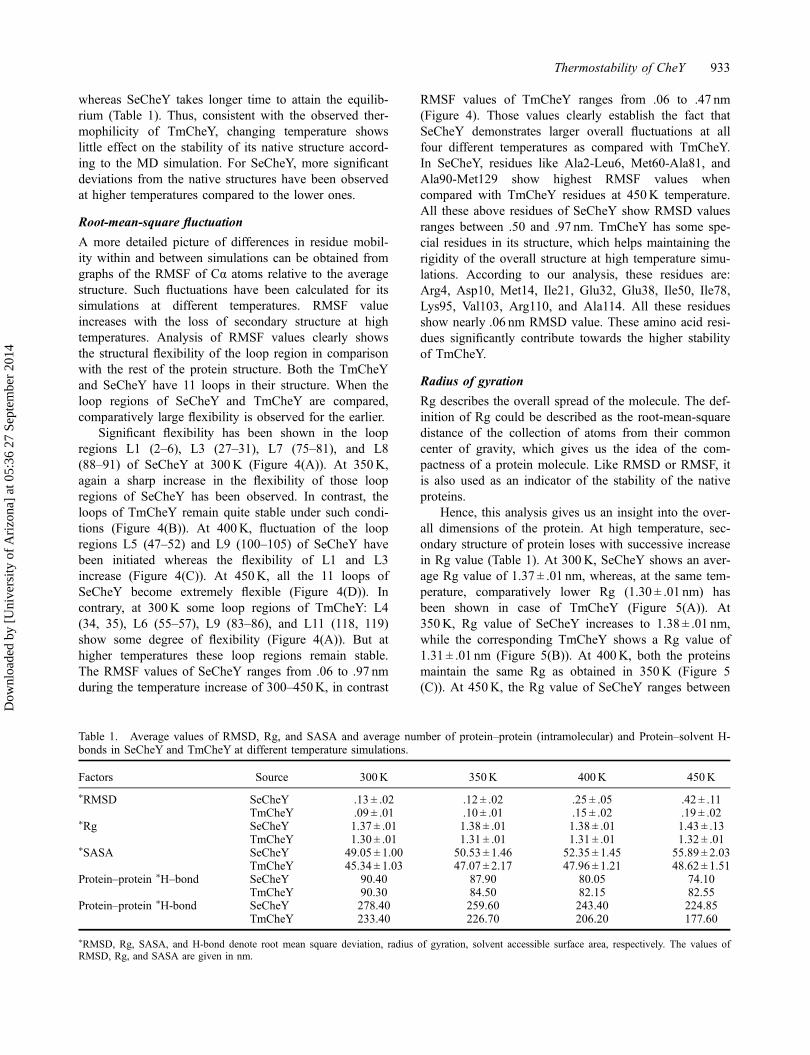
A more detailed picture of differences in residue mobil-ity within and between simulations can be obtained fromgraphs of the RMSF of Cα atoms relative to the averagestructure. Such fluctuations have been calculated for itssimulations at different temperatures. RMSF valueincreases with the loss of secondary structure at hightemperatures. Analysis of RMSF values clearly showsthe structural flexibility of the loop region in comparisonwith the rest of the protein structure. Both the TmCheYand SeCheY have 11 loops in their structure. When theloop regions of SeCheY and TmCheY are compared,comparatively large flexibility is observed for the earlier.
Significant flexibility has been shown in the loopregions L1 (2–6), L3 (27–31), L7 (75–81), and L8(88–91) of SeCheY at 300K (Figure 4(A)). At 350K,again a sharp increase in the flexibility of those loopregions of SeCheY has been observed. In contrast, theloops of TmCheY remain quite stable under such condi-tions (Figure 4(B)). At 400K, fluctuation of the loopregions L5 (47–52) and L9 (100–105) of SeCheY havebeen initiated whereas the flexibility of L1 and L3increase (Figure 4(C)). At 450K, all the 11 loops ofSeCheY become extremely flexible (Figure 4(D)). Incontrary, at 300K some loop regions of TmCheY: L4(34, 35), L6 (55–57), L9 (83–86), and L11 (118, 119)show some degree of flexibility (Figure 4(A)). But athigher temperatures these loop regions remain stable.The RMSF values of SeCheY ranges from .06 to .97 nmduring the temperature increase of 300–450K, in contrast
RMSF values of TmCheY ranges from .06 to .47 nm(Figure 4). Those values clearly establish the fact thatSeCheY demonstrates larger overall fluctuations at allfour different temperatures as compared with TmCheY.In SeCheY, residues like Ala2-Leu6, Met60-Ala81, andAla90-Met129 show highest RMSF values whencompared with TmCheY residues at 450K temperature.All these above residues of SeCheY show RMSD valuesranges between .50 and .97 nm. TmCheY has some spe-cial residues in its structure, which helps maintaining therigidity of the overall structure at high temperature simu-lations. According to our analysis, these residues are:Arg4, Asp10, Met14, Ile21, Glu32, Glu38, Ile50, Ile78,Lys95, Val103, Arg110, and Ala114. All these residuesshow nearly .06 nm RMSD value. These amino acid resi-dues significantly contribute towards the higher stabilityof TmCheY.
Radius of gyration
Rg describes the overall spread of the molecule. The def-inition of Rg could be described as the root-mean-squaredistance of the collection of atoms from their commoncenter of gravity, which gives us the idea of the com-pactness of a protein molecule. Like RMSD or RMSF, itis also used as an indicator of the stability of the nativeproteins.
Hence, this analysis gives us an insight into the over-all dimensions of the protein. At high temperature, sec-ondary structure of protein loses with successive increasein Rg value (Table 1). At 300K, SeCheY shows an aver-age Rg value of 1.37 ± .01 nm, whereas, at the same tem-perature, comparatively lower Rg (1.30 ± .01 nm) hasbeen shown in case of TmCheY (Figure 5(A)). At350K, Rg value of SeCheY increases to 1.38 ± .01 nm,while the corresponding TmCheY shows a Rg value of1.31 ± .01 nm (Figure 5(B)). At 400K, both the proteinsmaintain the same Rg as obtained in 350K (Figure 5(C)). At 450K, the Rg value of SeCheY ranges between
Table 1. Average values of RMSD, Rg, and SASA and average number of protein–protein (intramolecular) and Protein–solvent H-bonds in SeCheY and TmCheY at different temperature simulations.
Factors Source 300K 350K 400K 450K
⁄RMSD SeCheY .13 ± .02 .12 ± .02 .25 ± .05 .42 ± .11TmCheY .09 ± .01 .10 ± .01 .15 ± .02 .19 ± .02
⁄Rg SeCheY 1.37 ± .01 1.38 ± .01 1.38 ± .01 1.43 ± .13TmCheY 1.30 ± .01 1.31 ± .01 1.31 ± .01 1.32 ± .01
⁄SASA SeCheY 49.05 ± 1.00 50.53 ± 1.46 52.35 ± 1.45 55.89 ± 2.03TmCheY 45.34 ± 1.03 47.07 ± 2.17 47.96 ± 1.21 48.62 ± 1.51
Protein–protein ⁄H–bond SeCheY 90.40 87.90 80.05 74.10TmCheY 90.30 84.50 82.15 82.55
Protein–protein ⁄H-bond SeCheY 278.40 259.60 243.40 224.85TmCheY 233.40 226.70 206.20 177.60
⁄RMSD, Rg, SASA, and H-bond denote root mean square deviation, radius of gyration, solvent accessible surface area, respectively. The values ofRMSD, Rg, and SASA are given in nm.
Thermostability of CheY 933
Dow
nloa
ded
by [
Uni
vers
ity o
f A
rizo
na]
at 0
5:36
27
Sept
embe
r 20
14
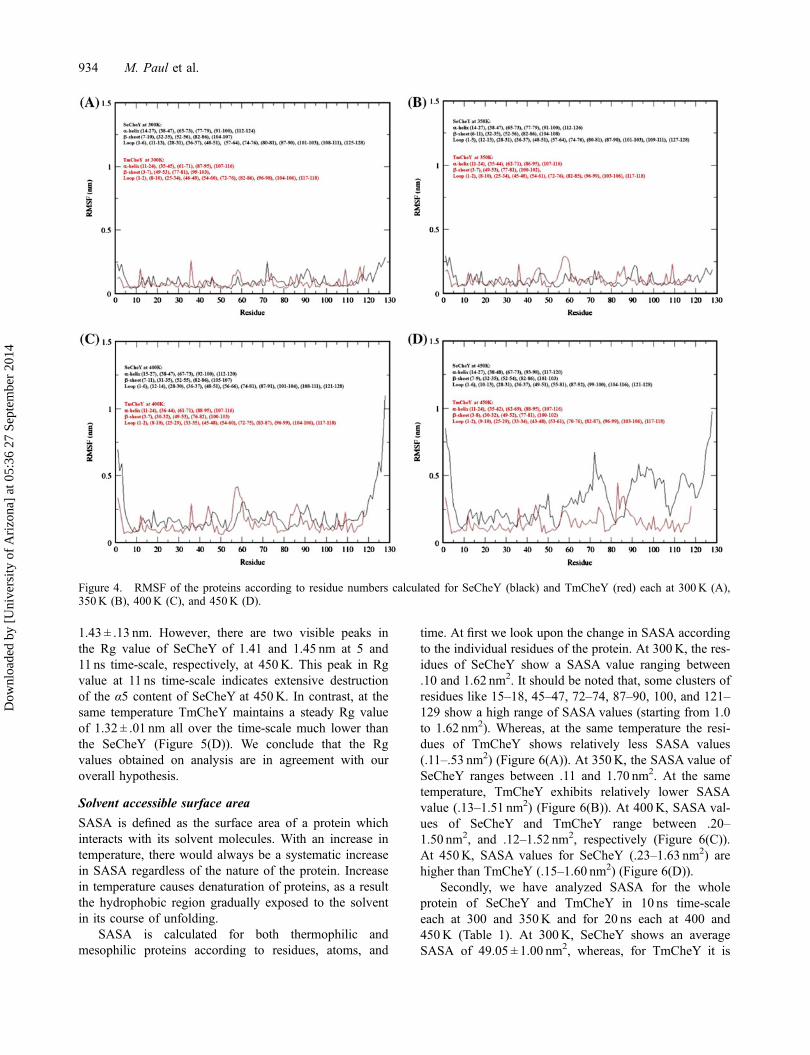
1.43 ± .13 nm. However, there are two visible peaks inthe Rg value of SeCheY of 1.41 and 1.45 nm at 5 and11 ns time-scale, respectively, at 450K. This peak in Rgvalue at 11 ns time-scale indicates extensive destructionof the α5 content of SeCheY at 450K. In contrast, at thesame temperature TmCheY maintains a steady Rg valueof 1.32 ± .01 nm all over the time-scale much lower thanthe SeCheY (Figure 5(D)). We conclude that the Rgvalues obtained on analysis are in agreement with ouroverall hypothesis.
Solvent accessible surface area
SASA is defined as the surface area of a protein whichinteracts with its solvent molecules. With an increase intemperature, there would always be a systematic increasein SASA regardless of the nature of the protein. Increasein temperature causes denaturation of proteins, as a resultthe hydrophobic region gradually exposed to the solventin its course of unfolding.
SASA is calculated for both thermophilic andmesophilic proteins according to residues, atoms, and
time. At first we look upon the change in SASA accordingto the individual residues of the protein. At 300K, the res-idues of SeCheY show a SASA value ranging between.10 and 1.62 nm2. It should be noted that, some clusters ofresidues like 15–18, 45–47, 72–74, 87–90, 100, and 121–129 show a high range of SASA values (starting from 1.0to 1.62 nm2). Whereas, at the same temperature the resi-dues of TmCheY shows relatively less SASA values(.11–.53 nm2) (Figure 6(A)). At 350K, the SASA value ofSeCheY ranges between .11 and 1.70 nm2. At the sametemperature, TmCheY exhibits relatively lower SASAvalue (.13–1.51 nm2) (Figure 6(B)). At 400K, SASA val-ues of SeCheY and TmCheY range between .20–1.50 nm2, and .12–1.52 nm2, respectively (Figure 6(C)).At 450K, SASA values for SeCheY (.23–1.63 nm2) arehigher than TmCheY (.15–1.60 nm2) (Figure 6(D)).
Secondly, we have analyzed SASA for the wholeprotein of SeCheY and TmCheY in 10 ns time-scaleeach at 300 and 350K and for 20 ns each at 400 and450K (Table 1). At 300K, SeCheY shows an averageSASA of 49.05 ± 1.00 nm2, whereas, for TmCheY it is
Figure 4. RMSF of the proteins according to residue numbers calculated for SeCheY (black) and TmCheY (red) each at 300K (A),350K (B), 400K (C), and 450K (D).
934 M. Paul et al.
Dow
nloa
ded
by [
Uni
vers
ity o
f A
rizo
na]
at 0
5:36
27
Sept
embe
r 20
14
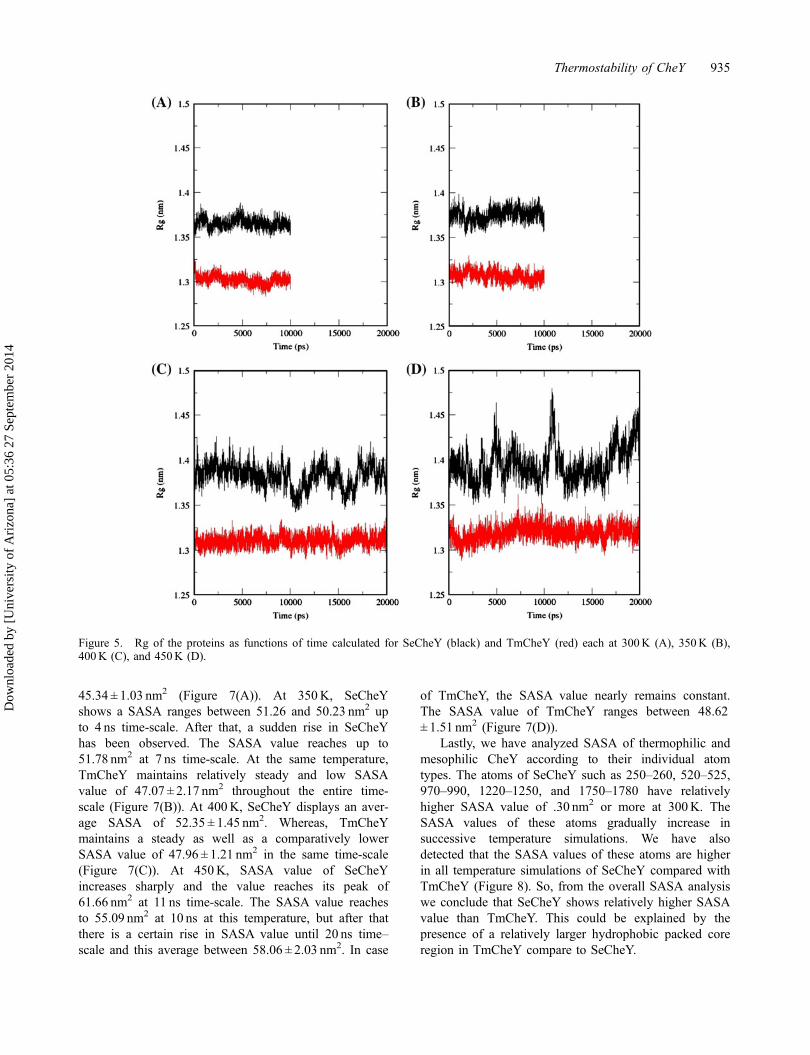
45.34 ± 1.03 nm2 (Figure 7(A)). At 350K, SeCheYshows a SASA ranges between 51.26 and 50.23 nm2 upto 4 ns time-scale. After that, a sudden rise in SeCheYhas been observed. The SASA value reaches up to51.78 nm2 at 7 ns time-scale. At the same temperature,TmCheY maintains relatively steady and low SASAvalue of 47.07 ± 2.17 nm2 throughout the entire time-scale (Figure 7(B)). At 400K, SeCheY displays an aver-age SASA of 52.35 ± 1.45 nm2. Whereas, TmCheYmaintains a steady as well as a comparatively lowerSASA value of 47.96 ± 1.21 nm2 in the same time-scale(Figure 7(C)). At 450K, SASA value of SeCheYincreases sharply and the value reaches its peak of61.66 nm2 at 11 ns time-scale. The SASA value reachesto 55.09 nm2 at 10 ns at this temperature, but after thatthere is a certain rise in SASA value until 20 ns time–scale and this average between 58.06 ± 2.03 nm2. In case
of TmCheY, the SASA value nearly remains constant.The SASA value of TmCheY ranges between 48.62± 1.51 nm2 (Figure 7(D)).
Lastly, we have analyzed SASA of thermophilic andmesophilic CheY according to their individual atomtypes. The atoms of SeCheY such as 250–260, 520–525,970–990, 1220–1250, and 1750–1780 have relativelyhigher SASA value of .30 nm2 or more at 300K. TheSASA values of these atoms gradually increase insuccessive temperature simulations. We have alsodetected that the SASA values of these atoms are higherin all temperature simulations of SeCheY compared withTmCheY (Figure 8). So, from the overall SASA analysiswe conclude that SeCheY shows relatively higher SASAvalue than TmCheY. This could be explained by thepresence of a relatively larger hydrophobic packed coreregion in TmCheY compare to SeCheY.
Figure 5. Rg of the proteins as functions of time calculated for SeCheY (black) and TmCheY (red) each at 300K (A), 350K (B),400K (C), and 450K (D).
Thermostability of CheY 935
Dow
nloa
ded
by [
Uni
vers
ity o
f A
rizo
na]
at 0
5:36
27
Sept
embe
r 20
14

Salt bridges
Salt Bridges most often play very crucial part in the sta-bility of proteins. A salt bridge is actually a combinationof two noncovalent interactions: hydrogen bonding andelectrostatic interactions. This is quite common in pro-teins and contributes towards the stability of the entropi-cally unfavorable folded conformation of proteins.Although noncovalent interactions are known to be rela-tively weak interactions, small stabilizing interactionscan add up to make an important contribution to theoverall stability of a conformer. Especially, it signifi-cantly contributes to the thermal stability of a protein. Itis often observed while comparing between proteinhomologs with different stability, salt bridges becomeone of the most significant factors to be responsible. Inour present study, we have tried to find out the differ-ences in salt bridges between these two structures. Wehave analyzed the variation in the length of the importantsalt bridges in 10 ns at 300 and 350K temperature, andin 20 ns at 400 and 450K for the thermophilic TmCheY(Table 3) and mesophilic SeCheY proteins (Table 2).
Finally, we determine the importance of those saltbridges in maintaining thermostability of TmCheY basedon their length variation at different temperature simula-tions. All four salt bridges of TmCheY remain quite sta-ble at 300 and 350K. Arg15NH2-
Glu32OE1 shows adecrease in its length at 350K. At 300K, the length ofArg15NH2-
Glu32OE1 increases from .17 nm at 1 ns to0.33 nm at 10 ns. However, at 350K, the length of thissalt bridge increases significantly from .17 nm at 1 ns to.41 nm at 10 ns. At 350K, the lengths of the other threesalt bridges do not exceed their length at equilibriumstate. At 400 and 450K, Arg15NH2-
Glu32OE1,Lys42NZ-Glue38OE1, and Lys104NZ-Asp9OD2 maintains acompact length throughout the simulation. It is becausethe α1 and α2 helices remain rigid at 450K temperature.Thus, the three residues Arg15, Glu38 and Lys42 do notshow any significant flexibility. Lys42NZ-Glue38OE1 isreported as the strongest salt bridge in TmCheY structureas its length reduced from .54 nm at starting to .48 nm at450K. The length of Arg15NH2-
Glu32OE1 and Lys104N-Z-Asp9OD2 also decreases from .39 and .29 nm to .37
Figure 6. SASA of the proteins according to residues numbers calculated for SeCheY (black) and TmCheY (red) each at 300K (A),350K (B), 400K (C), and 450K (D).
936 M. Paul et al.
Dow
nloa
ded
by [
Uni
vers
ity o
f A
rizo
na]
at 0
5:36
27
Sept
embe
r 20
14

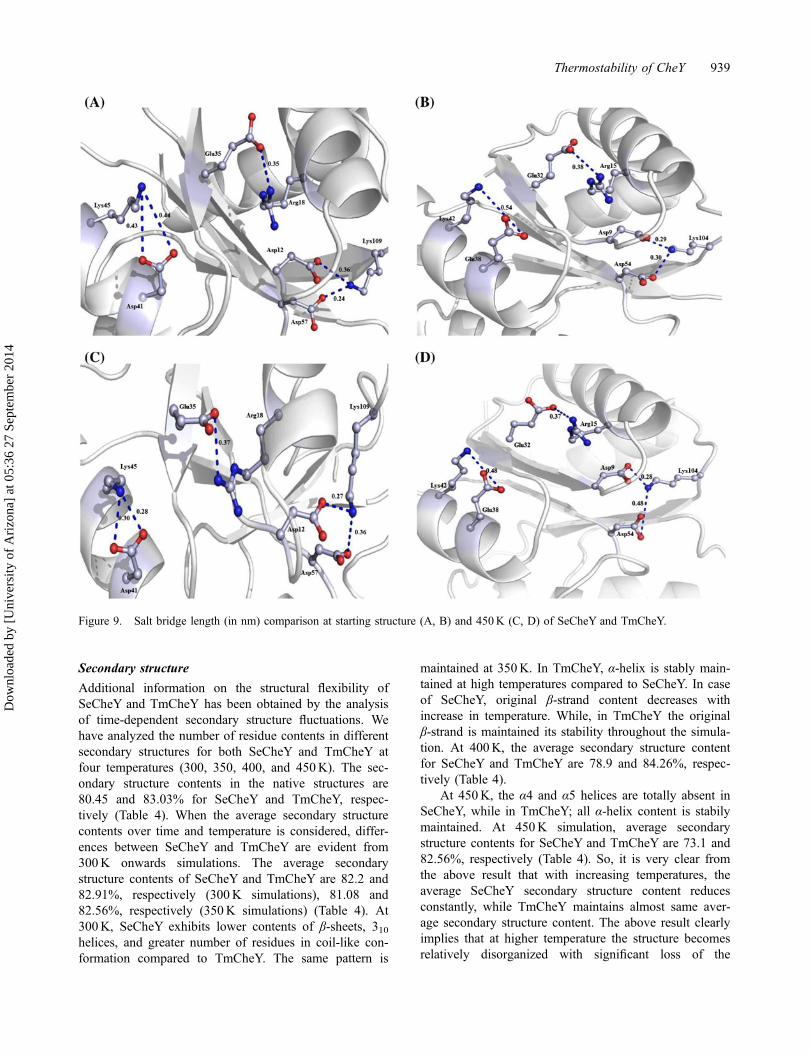
and .28 nm, respectively (Figure 9(A)). This resultimplies that these salt bridges are significantly contribut-ing to the thermostability of TmCheY.
On the other hand, lengths of all five salt bridges ofSeCheY increase significantly at 300 and 350K. The saltbridges: Arg18NH2-
Glu35OE1 and Lys109NZ-Asp57OD1 showa large increase in their length after 300 and 350Ktemperature simulation. The other three salt bridges alsobecome unstable after 350K simulations. The saltbridges like: Arg18NH2 -
Glu35OE1,Lys109NZ-Asp57OD2 are
not able to maintain a steady length at high temperatures(Figure 9(B)). The lengths of these salt bridges increasegradually at high temperatures. At 450K, temperaturethe α1, β1, and β5 structure of SeCheY become
shortened. The shortened parts of these secondary con-tents unfold to become a loop structure (Figure 9(C)).Asp12, Asp57, and Lys109 become more flexible due tothis loop formation. This is the main reason for thestretching of the corresponding salt bridges.
The only exception is Lys45NZ-Asp41OD1, whichmaintains a steady length even at high temperature andthere is a decrease in length at 450K (Figure 9(D)).Therefore, by comparing the salt bridge contentsbetween the two homologues of CheY, it can be easilyinferred that thermophilic TmCheY has a greaternumber of potent salt bridges which are significantcontributors towards its structural stability at highertemperatures.
Figure 7. SASA of the proteins according to time calculated for SeCheY (black) and TmCheY (red) each at 300K (A), 350K (B),400K (C), and 450K (D).
Thermostability of CheY 937
Dow
nloa
ded
by [
Uni
vers
ity o
f A
rizo
na]
at 0
5:36
27
Sept
embe
r 20
14
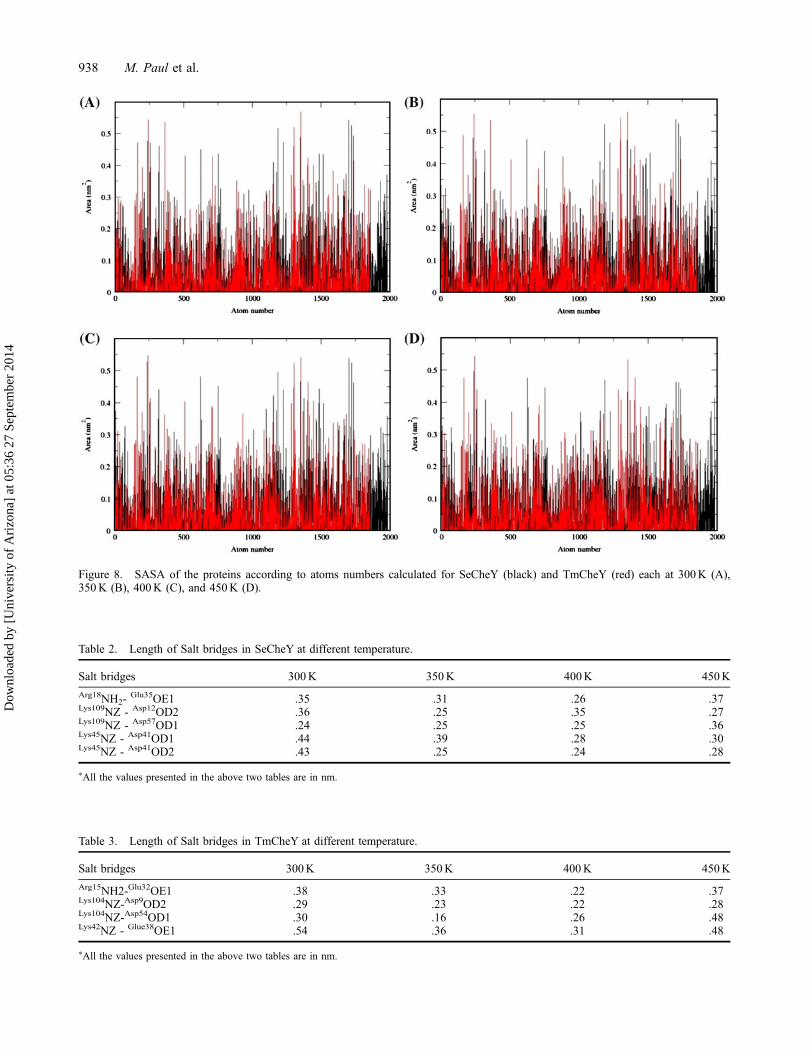
Figure 8. SASA of the proteins according to atoms numbers calculated for SeCheY (black) and TmCheY (red) each at 300K (A),350K (B), 400K (C), and 450K (D).
Table 2. Length of Salt bridges in SeCheY at different temperature.
Salt bridges 300K 350K 400K 450K
Arg18NH2-Glu35OE1 .35 .31 .26 .37
Lys109NZ - Asp12OD2 .36 .25 .35 .27Lys109NZ - Asp57OD1 .24 .25 .25 .36Lys45NZ - Asp41OD1 .44 .39 .28 .30Lys45NZ - Asp41OD2 .43 .25 .24 .28
⁄All the values presented in the above two tables are in nm.
Table 3. Length of Salt bridges in TmCheY at different temperature.
Salt bridges 300K 350K 400K 450K
Arg15NH2-Glu32OE1 .38 .33 .22 .37Lys104NZ-Asp9OD2 .29 .23 .22 .28Lys104NZ-Asp54OD1 .30 .16 .26 .48Lys42NZ - Glue38OE1 .54 .36 .31 .48
⁄All the values presented in the above two tables are in nm.
938 M. Paul et al.
Dow
nloa
ded
by [
Uni
vers
ity o
f A
rizo
na]
at 0
5:36
27
Sept
embe
r 20
14
Secondary structure
Additional information on the structural flexibility ofSeCheY and TmCheY has been obtained by the analysisof time-dependent secondary structure fluctuations. Wehave analyzed the number of residue contents in differentsecondary structures for both SeCheY and TmCheY atfour temperatures (300, 350, 400, and 450K). The sec-ondary structure contents in the native structures are80.45 and 83.03% for SeCheY and TmCheY, respec-tively (Table 4). When the average secondary structurecontents over time and temperature is considered, differ-ences between SeCheY and TmCheY are evident from300K onwards simulations. The average secondarystructure contents of SeCheY and TmCheY are 82.2 and82.91%, respectively (300K simulations), 81.08 and82.56%, respectively (350K simulations) (Table 4). At300K, SeCheY exhibits lower contents of β-sheets, 310helices, and greater number of residues in coil-like con-formation compared to TmCheY. The same pattern is
maintained at 350K. In TmCheY, α-helix is stably main-tained at high temperatures compared to SeCheY. In caseof SeCheY, original β-strand content decreases withincrease in temperature. While, in TmCheY the originalβ-strand is maintained its stability throughout the simula-tion. At 400K, the average secondary structure contentfor SeCheY and TmCheY are 78.9 and 84.26%, respec-tively (Table 4).
At 450K, the α4 and α5 helices are totally absent inSeCheY, while in TmCheY; all α-helix content is stabilymaintained. At 450K simulation, average secondarystructure contents for SeCheY and TmCheY are 73.1 and82.56%, respectively (Table 4). So, it is very clear fromthe above result that with increasing temperatures, theaverage SeCheY secondary structure content reducesconstantly, while TmCheY maintains almost same aver-age secondary structure content. The above result clearlyimplies that at higher temperature the structure becomesrelatively disorganized with significant loss of the
Figure 9. Salt bridge length (in nm) comparison at starting structure (A, B) and 450K (C, D) of SeCheY and TmCheY.
Thermostability of CheY 939
Dow
nloa
ded
by [
Uni
vers
ity o
f A
rizo
na]
at 0
5:36
27
Sept
embe
r 20
14
secondary structure for SeCheY; in contrast, TmCheY isable to retain the secondary structure content.
Hydrogen bonding pattern
When one donor atom and one acceptor atom from twodifferent amino acids remain connected with a bond notexceed .35 nm in length and 30° in angle, then thebonding pattern is called hydrogen bonding pattern. Inthe present analysis, we have considered two types ofH-bonding patterns: (1) intramolecular (protein–protein)H-bond, and (2) protein–solvent H-bond.
Intramolecular (protein–protein) hydrogen bond
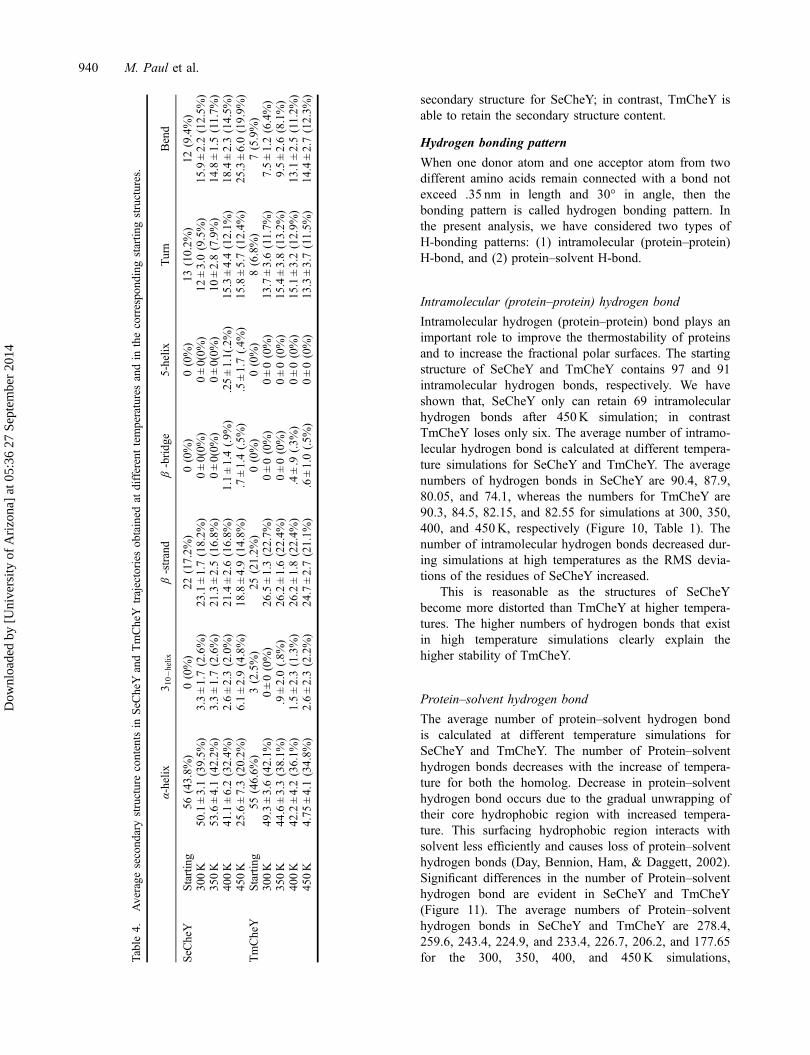
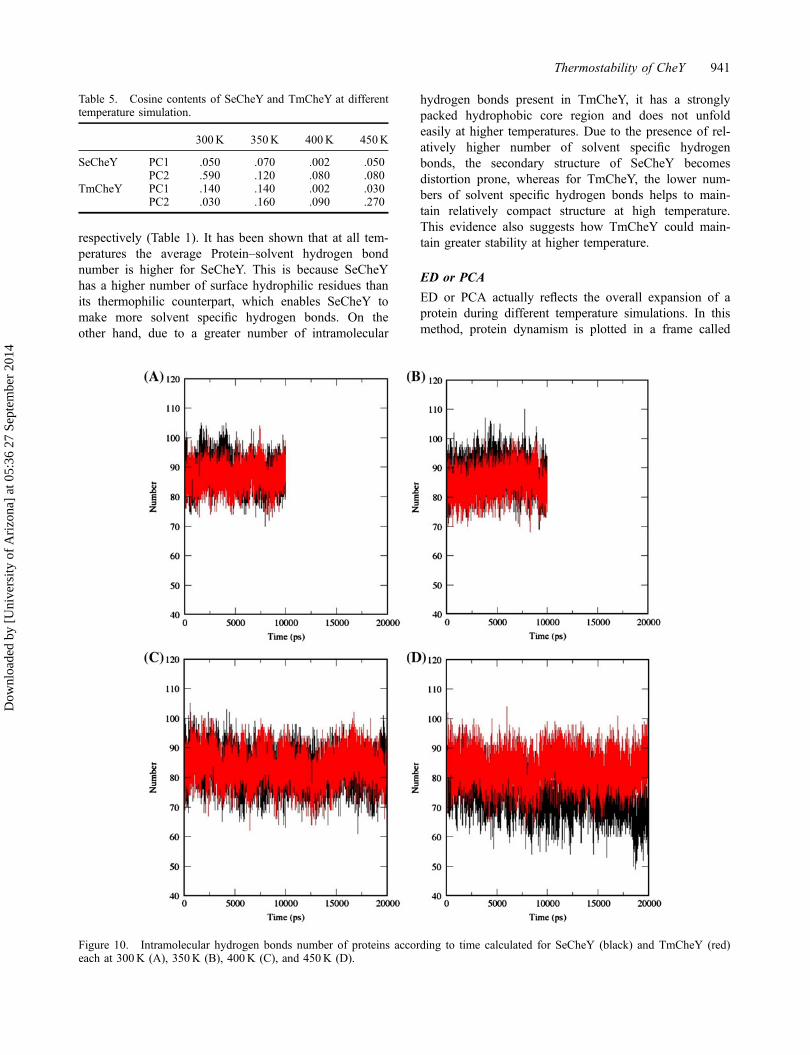
Intramolecular hydrogen (protein–protein) bond plays animportant role to improve the thermostability of proteinsand to increase the fractional polar surfaces. The startingstructure of SeCheY and TmCheY contains 97 and 91intramolecular hydrogen bonds, respectively. We haveshown that, SeCheY only can retain 69 intramolecularhydrogen bonds after 450K simulation; in contrastTmCheY loses only six. The average number of intramo-lecular hydrogen bond is calculated at different tempera-ture simulations for SeCheY and TmCheY. The averagenumbers of hydrogen bonds in SeCheY are 90.4, 87.9,80.05, and 74.1, whereas the numbers for TmCheY are90.3, 84.5, 82.15, and 82.55 for simulations at 300, 350,400, and 450K, respectively (Figure 10, Table 1). Thenumber of intramolecular hydrogen bonds decreased dur-ing simulations at high temperatures as the RMS devia-tions of the residues of SeCheY increased.
This is reasonable as the structures of SeCheYbecome more distorted than TmCheY at higher tempera-tures. The higher numbers of hydrogen bonds that existin high temperature simulations clearly explain thehigher stability of TmCheY.
Protein–solvent hydrogen bond
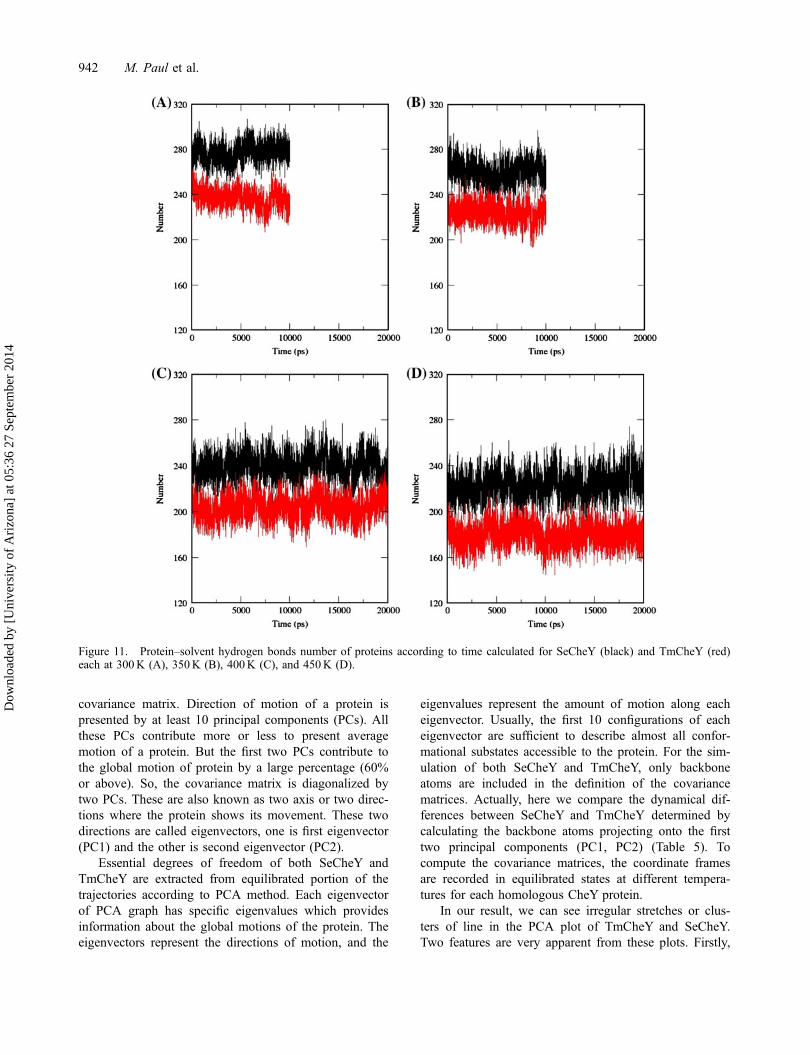
The average number of protein–solvent hydrogen bondis calculated at different temperature simulations forSeCheY and TmCheY. The number of Protein–solventhydrogen bonds decreases with the increase of tempera-ture for both the homolog. Decrease in protein–solventhydrogen bond occurs due to the gradual unwrapping oftheir core hydrophobic region with increased tempera-ture. This surfacing hydrophobic region interacts withsolvent less efficiently and causes loss of protein–solventhydrogen bonds (Day, Bennion, Ham, & Daggett, 2002).Significant differences in the number of Protein–solventhydrogen bond are evident in SeCheY and TmCheY(Figure 11). The average numbers of Protein–solventhydrogen bonds in SeCheY and TmCheY are 278.4,259.6, 243.4, 224.9, and 233.4, 226.7, 206.2, and 177.65for the 300, 350, 400, and 450K simulations,T
able
4.Average
second
arystructurecontentsin
SeC
heYandTmCheY
trajectories
obtained
atdifferenttemperaturesandin
thecorrespo
ndingstartin
gstructures.
α-helix
3 10�
helix
β-strand
β-bridg
e5-helix
Turn
Bend
SeC
heY
Starting
56(43.8%
)0(0%)
22(17.2%
)0(0%)
0(0%)
13(10.2%
)12
(9.4%)
300K
50.1±3.1(39.5%
)3.3±1.7(2.6%)
23.1±1.7(18.2%
)0±0(0%
)0±0(0%
)12
±3.0(9.5%)
15.9±2.2(12.5%
)35
0K
53.6±4.1(42.2%
)3.3±1.7(2.6%)
21.3±2.5(16.8%
)0±0(0%
)0±0(0%
)10
±2.8(7.9%)
14.8±1.5(11.7%
)40
0K
41.1±6.2(32.4%
)2.6±2.3(2.0%)
21.4±2.6(16.8%
)1.1±1.4(.9%
).25±1.1(.2%)
15.3±4.4(12.1%
)18
.4±2.3(14.5%
)45
0K
25.6±7.3(20.2%
)6.1±2.9(4.8%)
18.8±4.9(14.8%
).7±1.4(.5%
).5±1.7(.4%
)15
.8±5.7(12.4%
)25
.3±6.0(19.9%
)TmCheY
Starting
55(46.6%
)3(2.5%)
25(21.2%
)0(0%)
0(0%)
8(6.8%)
7(5.9%)
300K
49.3±3.6(42.1%
)0±0(0%)
26.5±1.3(22.7%
)0±0(0%)
0±0(0%)
13.7±3.6(11.7%
)7.5±1.2(6.4%)
350K
44.6±3.3(38.1%
).9±2.0(.8%
)26
.2±1.6(22.4%
)0±0(0%)
0±0(0%)
15.4±3.8(13.2%
)9.5±2.6(8.1%)
400K
42.2±4.2(36.1%
)1.5±2.3(1.3%)
26.2±1.8(22.4%
).4±.9
(.3%
)0±0(0%)
15.1±3.2(12.9%
)13
.1±2.5(11.2%
)45
0K
4.75
±4.1(34.8%
)2.6±2.3(2.2%)
24.7±2.7(21.1%
).6±1.0(.5%
)0±0(0%)
13.3±3.7(11.5%
)14
.4±2.7(12.3%
)
940 M. Paul et al.
Dow
nloa
ded
by [
Uni
vers
ity o
f A
rizo
na]
at 0
5:36
27
Sept
embe
r 20
14
respectively (Table 1). It has been shown that at all tem-peratures the average Protein–solvent hydrogen bondnumber is higher for SeCheY. This is because SeCheYhas a higher number of surface hydrophilic residues thanits thermophilic counterpart, which enables SeCheY tomake more solvent specific hydrogen bonds. On theother hand, due to a greater number of intramolecular
hydrogen bonds present in TmCheY, it has a stronglypacked hydrophobic core region and does not unfoldeasily at higher temperatures. Due to the presence of rel-atively higher number of solvent specific hydrogenbonds, the secondary structure of SeCheY becomesdistortion prone, whereas for TmCheY, the lower num-bers of solvent specific hydrogen bonds helps to main-tain relatively compact structure at high temperature.This evidence also suggests how TmCheY could main-tain greater stability at higher temperature.
ED or PCA
ED or PCA actually reflects the overall expansion of aprotein during different temperature simulations. In thismethod, protein dynamism is plotted in a frame called
Table 5. Cosine contents of SeCheY and TmCheY at differenttemperature simulation.
300K 350K 400K 450K
SeCheY PC1 .050 .070 .002 .050PC2 .590 .120 .080 .080
TmCheY PC1 .140 .140 .002 .030PC2 .030 .160 .090 .270
Figure 10. Intramolecular hydrogen bonds number of proteins according to time calculated for SeCheY (black) and TmCheY (red)each at 300K (A), 350K (B), 400K (C), and 450K (D).
Thermostability of CheY 941
Dow
nloa
ded
by [
Uni
vers
ity o
f A
rizo
na]
at 0
5:36
27
Sept
embe
r 20
14
covariance matrix. Direction of motion of a protein ispresented by at least 10 principal components (PCs). Allthese PCs contribute more or less to present averagemotion of a protein. But the first two PCs contribute tothe global motion of protein by a large percentage (60%or above). So, the covariance matrix is diagonalized bytwo PCs. These are also known as two axis or two direc-tions where the protein shows its movement. These twodirections are called eigenvectors, one is first eigenvector(PC1) and the other is second eigenvector (PC2).
Essential degrees of freedom of both SeCheY andTmCheY are extracted from equilibrated portion of thetrajectories according to PCA method. Each eigenvectorof PCA graph has specific eigenvalues which providesinformation about the global motions of the protein. Theeigenvectors represent the directions of motion, and the
eigenvalues represent the amount of motion along eacheigenvector. Usually, the first 10 configurations of eacheigenvector are sufficient to describe almost all confor-mational substates accessible to the protein. For the sim-ulation of both SeCheY and TmCheY, only backboneatoms are included in the definition of the covariancematrices. Actually, here we compare the dynamical dif-ferences between SeCheY and TmCheY determined bycalculating the backbone atoms projecting onto the firsttwo principal components (PC1, PC2) (Table 5). Tocompute the covariance matrices, the coordinate framesare recorded in equilibrated states at different tempera-tures for each homologous CheY protein.
In our result, we can see irregular stretches or clus-ters of line in the PCA plot of TmCheY and SeCheY.Two features are very apparent from these plots. Firstly,
Figure 11. Protein–solvent hydrogen bonds number of proteins according to time calculated for SeCheY (black) and TmCheY (red)each at 300K (A), 350K (B), 400K (C), and 450K (D).
942 M. Paul et al.
Dow
nloa
ded
by [
Uni
vers
ity o
f A
rizo
na]
at 0
5:36
27
Sept
embe
r 20
14

the clusters are well defined in TmCheY than SeCheY.Secondly, SeCheY covers a larger region on the plot par-ticularly along PC1 plane compared to that covered byTmCheY (Figures 12 and 13).
It is also clear from all the plots that SeCheYunwrapped comparatively faster than TmCheY with theincrease in temperature. The degree of unwrapping ofSeCheY is also very high compared to TmCheY (Figures12 and 13). At high temperatures, particularly at 450KTmCheY tends to show drastically reduced coveragethan SeCheY (Figure 13(C) and (D)). Our observationthus corroborates with the idea of higher flexibility ofSeCheY than TmCheY at 350K and onwards highertemperatures.
Dynamical differences between SeCheY andTmCheY can be easily understood from the Cα motionprojection onto the first two eigenvectors of SeCheY andTmCheY. The width of the ribbon indicates the ampli-tude of the backbone motion whilst the arrows evidencethe directions. It is shown from the result that SeCheYhas overall more flexibility than TmCheY. The loop
regions of SeCheY are much more flexible than TmCheY(Figures 14 and 15). Significant flexibility of SeCheYthan its thermophilic homolog has been reported at450K simulations (Figure 15(C) and (D)).
Root mean square inner product
The RMSIP is a measurement of the degree of overlapbetween the conformational spaces of the two proteinsexplored by simulation at both same and different tem-peratures. In more simple words, it determines the degreeof overlap or similarity of eigenvector sets of a protein.This actually indicates the expansion of a protein struc-ture as PCA does. But in this method, we can get a com-parative and more detailing of the protein dynamism atsame or different temperature. Here, we have determinedthe RMSIP of SeCheY and TmCheY by comparing theirequilibrated trajectories.
For determining the RMSIP of a protein at same tem-perature, we have compared two halves of the equili-brated portion of the corresponding trajectories ofspecific temperature. For diagonal elements, the RMSIP
Figure 12. PCA for SeCheY and TmCheY. (A) and (C) represent the PCA of SeCheY at 300, and 350K respectively. (B) and (D)represent the PCA of TmCheY at 300, and 350K respectively.
Thermostability of CheY 943
Dow
nloa
ded
by [
Uni
vers
ity o
f A
rizo
na]
at 0
5:36
27
Sept
embe
r 20
14

has been computed by splitting the equilibrated portionof the trajectory into two equal halves. The followingtable shows the different RMSIP values from the com-parison of the essential subspaces of SeCheY andTmCheY spanned by the first 10 eigenvectors at fourdifferent temperatures. The first four rows and columnsof this table shows the RMSIP value of a single proteinat same and four different temperatures. The remainingof the table shows the RMSIP values between two pro-teins both at same and four different temperatures. Thediagonal values of the table represent the RMSIP valuesof both proteins at the same temperature (Table 6). Fromthe table, we have got that RMSIPs between the sameproteins at different temperatures are high. On the con-trary, the RMSIPs of two proteins at different tempera-tures are significantly low. Thus, these data indicate thatthe essential subspaces explored by the simulations ofthe individual protein at different temperature up to450K overlap significantly. Although at higher tempera-tures, the overlap within the same protein decreases butthese values are higher than the overlap values between
the two different proteins at higher temperatures (350and 400K). These results also suggest that each proteinhas variable direction of motion at different simulatedtemperatures. RMSIP reflects the actual subspaces inprotein structure that occur during the temperature simu-lation. Less thermostable protein shows a greater sub-space or dynamism in its structure at high temperaturecomparative to more thermostable protein. The RMSIPvalue also increases with the raising of subspaces in pro-tein structure. Here, we can also see that the RMSIPvalue for SeCheY at both same and different tempera-tures is much higher than its thermophilic counterpart.Thus, the RMSIP data indicates that TmCheY is morethermostable than SeCheY.
Unfolding pathway
The unfolding pathway describes the pattern ofunwrapping of a protein according to time-scale and withraising temperature. In this study, we have investigatedthe comparative unfolding pathway of SeCheY andTmCheY (S-1, S-2).
Figure 13. PCA for SeCheY and TmCheY. (A) and (C) represent the PCA of SeCheY at 400, and 450K respectively. (B) and (D)represent the PCA of TmCheY at 400, and 450K respectively.
944 M. Paul et al.
Dow
nloa
ded
by [
Uni
vers
ity o
f A
rizo
na]
at 0
5:36
27
Sept
embe
r 20
14
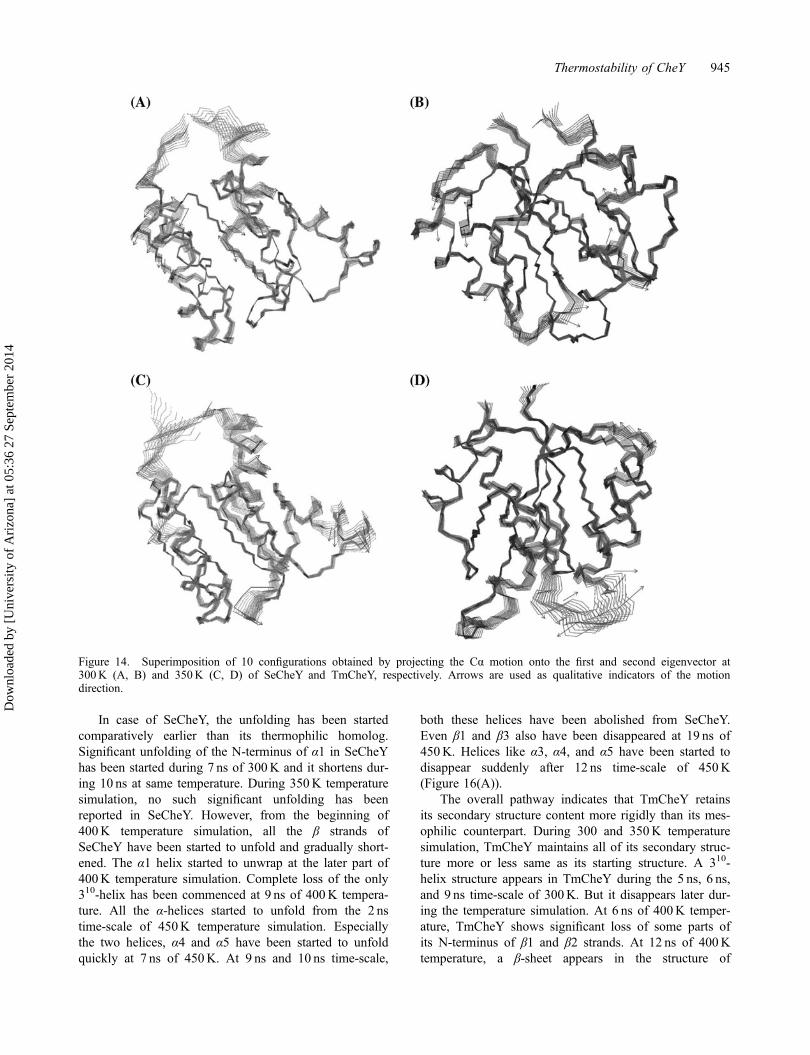
In case of SeCheY, the unfolding has been startedcomparatively earlier than its thermophilic homolog.Significant unfolding of the N-terminus of α1 in SeCheYhas been started during 7 ns of 300K and it shortens dur-ing 10 ns at same temperature. During 350K temperaturesimulation, no such significant unfolding has beenreported in SeCheY. However, from the beginning of400K temperature simulation, all the β strands ofSeCheY have been started to unfold and gradually short-ened. The α1 helix started to unwrap at the later part of400K temperature simulation. Complete loss of the only310-helix has been commenced at 9 ns of 400K tempera-ture. All the α-helices started to unfold from the 2 nstime-scale of 450K temperature simulation. Especiallythe two helices, α4 and α5 have been started to unfoldquickly at 7 ns of 450K. At 9 ns and 10 ns time-scale,
both these helices have been abolished from SeCheY.Even β1 and β3 also have been disappeared at 19 ns of450K. Helices like α3, α4, and α5 have been started todisappear suddenly after 12 ns time-scale of 450K(Figure 16(A)).
The overall pathway indicates that TmCheY retainsits secondary structure content more rigidly than its mes-ophilic counterpart. During 300 and 350K temperaturesimulation, TmCheY maintains all of its secondary struc-ture more or less same as its starting structure. A 310-helix structure appears in TmCheY during the 5 ns, 6 ns,and 9 ns time-scale of 300K. But it disappears later dur-ing the temperature simulation. At 6 ns of 400K temper-ature, TmCheY shows significant loss of some parts ofits N-terminus of β1 and β2 strands. At 12 ns of 400Ktemperature, a β-sheet appears in the structure of
Figure 14. Superimposition of 10 configurations obtained by projecting the Cα motion onto the first and second eigenvector at300K (A, B) and 350K (C, D) of SeCheY and TmCheY, respectively. Arrows are used as qualitative indicators of the motiondirection.
Thermostability of CheY 945
Dow
nloa
ded
by [
Uni
vers
ity o
f A
rizo
na]
at 0
5:36
27
Sept
embe
r 20
14

Figure 15. Superimposition of 10 configurations obtained by projecting the Cα motion onto the first and second eigenvector at400K (A, B) and 450K (C, D) of SeCheY and TmCheY respectively. Arrows are used as qualitative indicators of the motiondirection.
Table 6. RMSIP between the first 10 eigenvectors obtained for different simulation groups.
Se300K Se350K Se400K Se450K Tm300K Tm350K Tm400K Tm450K
Se300K .973⁄ .986 1.000 1.000 .815 .877 1.000 1.000Se350K .988⁄ .887 .815 .820 .865 .879 .889Se400K .868⁄ 1.000 .818 .887 1.000 1.000Se450K .773⁄ .742 .775 1.000 1.000Tm300K .990⁄ .920 .917 .868Tm350K .930⁄ .948 .910Tm400K .952⁄ 1.000Tm450K .942⁄
⁄These values refer to the RMSIP obtained by partitioning simulations in the same group into two halves and calculate their inner products. Se andTm stands for SeCheY and TmCheY respectively.
946 M. Paul et al.
Dow
nloa
ded
by [
Uni
vers
ity o
f A
rizo
na]
at 0
5:36
27
Sept
embe
r 20
14
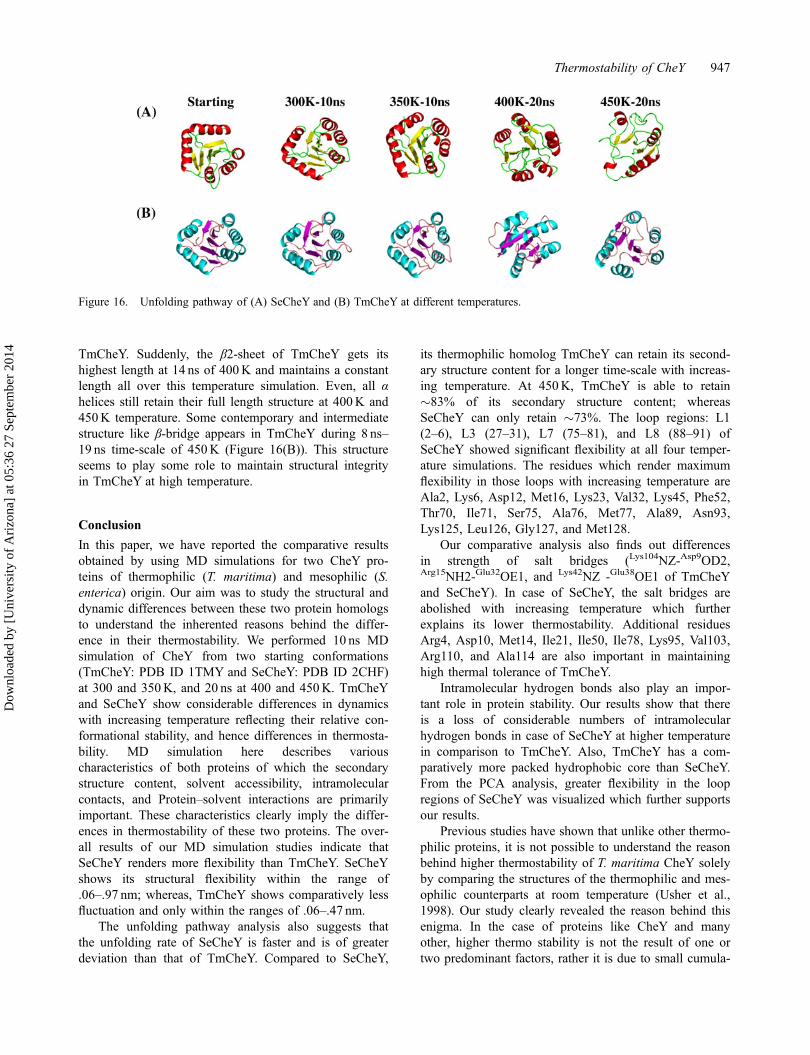
TmCheY. Suddenly, the β2-sheet of TmCheY gets itshighest length at 14 ns of 400K and maintains a constantlength all over this temperature simulation. Even, all αhelices still retain their full length structure at 400K and450K temperature. Some contemporary and intermediatestructure like β-bridge appears in TmCheY during 8 ns–19 ns time-scale of 450K (Figure 16(B)). This structureseems to play some role to maintain structural integrityin TmCheY at high temperature.
Conclusion
In this paper, we have reported the comparative resultsobtained by using MD simulations for two CheY pro-teins of thermophilic (T. maritima) and mesophilic (S.enterica) origin. Our aim was to study the structural anddynamic differences between these two protein homologsto understand the inherented reasons behind the differ-ence in their thermostability. We performed 10 ns MDsimulation of CheY from two starting conformations(TmCheY: PDB ID 1TMY and SeCheY: PDB ID 2CHF)at 300 and 350K, and 20 ns at 400 and 450K. TmCheYand SeCheY show considerable differences in dynamicswith increasing temperature reflecting their relative con-formational stability, and hence differences in thermosta-bility. MD simulation here describes variouscharacteristics of both proteins of which the secondarystructure content, solvent accessibility, intramolecularcontacts, and Protein–solvent interactions are primarilyimportant. These characteristics clearly imply the differ-ences in thermostability of these two proteins. The over-all results of our MD simulation studies indicate thatSeCheY renders more flexibility than TmCheY. SeCheYshows its structural flexibility within the range of.06–.97 nm; whereas, TmCheY shows comparatively lessfluctuation and only within the ranges of .06–.47 nm.
The unfolding pathway analysis also suggests thatthe unfolding rate of SeCheY is faster and is of greaterdeviation than that of TmCheY. Compared to SeCheY,
its thermophilic homolog TmCheY can retain its second-ary structure content for a longer time-scale with increas-ing temperature. At 450K, TmCheY is able to retain�83% of its secondary structure content; whereasSeCheY can only retain �73%. The loop regions: L1(2–6), L3 (27–31), L7 (75–81), and L8 (88–91) ofSeCheY showed significant flexibility at all four temper-ature simulations. The residues which render maximumflexibility in those loops with increasing temperature areAla2, Lys6, Asp12, Met16, Lys23, Val32, Lys45, Phe52,Thr70, Ile71, Ser75, Ala76, Met77, Ala89, Asn93,Lys125, Leu126, Gly127, and Met128.
Our comparative analysis also finds out differencesin strength of salt bridges (Lys104NZ-Asp9OD2,Arg15NH2-Glu32OE1, and Lys42NZ -Glu38OE1 of TmCheYand SeCheY). In case of SeCheY, the salt bridges areabolished with increasing temperature which furtherexplains its lower thermostability. Additional residuesArg4, Asp10, Met14, Ile21, Ile50, Ile78, Lys95, Val103,Arg110, and Ala114 are also important in maintaininghigh thermal tolerance of TmCheY.
Intramolecular hydrogen bonds also play an impor-tant role in protein stability. Our results show that thereis a loss of considerable numbers of intramolecularhydrogen bonds in case of SeCheY at higher temperaturein comparison to TmCheY. Also, TmCheY has a com-paratively more packed hydrophobic core than SeCheY.From the PCA analysis, greater flexibility in the loopregions of SeCheY was visualized which further supportsour results.
Previous studies have shown that unlike other thermo-philic proteins, it is not possible to understand the reasonbehind higher thermostability of T. maritima CheY solelyby comparing the structures of the thermophilic and mes-ophilic counterparts at room temperature (Usher et al.,1998). Our study clearly revealed the reason behind thisenigma. In the case of proteins like CheY and manyother, higher thermo stability is not the result of one ortwo predominant factors, rather it is due to small cumula-
Figure 16. Unfolding pathway of (A) SeCheY and (B) TmCheY at different temperatures.
Thermostability of CheY 947
Dow
nloa
ded
by [
Uni
vers
ity o
f A
rizo
na]
at 0
5:36
27
Sept
embe
r 20
14

tive contributions of several factors like salt bridges,intramolecular H-bonds, compactness of structure, Pro-tein–solvent interactions, etc. Hence, it is practicallyimpossible to understand the reason behind increasedthermostability using techniques which deal with the sta-tic protein structures, for example, crystallography. Thisproblem can be addressed more efficiently using MDsimulations and our study could be used as a model forseveral other such cases. The knowledge we have gainedfrom this study about the contributors of stability ofCheY would enhance our understanding of the underly-ing molecular mechanisms and helps in designing betterthermostable proteins for industrial applications.
Acknowledgments
We are grateful to Dr Kartick Tarafder for his technicalassistance. We thank Prof. Sumit Biswas, Dr Parimal Kar andMr Kohinoor Das for their critical comments on themanuscript.
Supplementary material
The supplementary material for this paper is availableonline at http://dx.doi.10.1080/07391102.2013.799438.
ReferencesAllweiss, B., Dostal, J., Carey, K. E., Edwards, T. F., & Freter,
R. (1977). The role of chemotaxis in the ecology of bacte-rial pathogens of mucosal surfaces. Nature, 266, 448–450.
Amadei, A., Ceruso, M. A., & Nola, A. D. (1999). On the con-vergence of the conformational coordinates basis setobtained by the essential dynamics analysis of proteins’molecular dynamics simulations. Proteins, 36, 419–424.
Amadei, A., Linssen, A. B., & Berendsen, H. J. (1993). Essen-tial dynamics of proteins. Proteins, 17, 412–425.
Bourret, R. B., Davagnino, J., & Simon, M. I. (1993). The car-boxy-terminal portion of the CheA kinase mediates regula-tion of autophosphorylation by transducer and CheW.Journal of Bacteriology, 175, 2097–2101.
Bruins, M. E., Janssen, A. E., & Boom, R. M. (2001). Thermo-zymes and their applications: A review of recent literatureand patents. Applied Biochemistry and Biotechnology, 90,155–186.
Darden, T., Perera, L., Li, L., & Pedersen, L. (1999). Newtricks for modelers from the crystallography toolkit: Theparticle mesh Ewald algorithm and its use in nucleic acidsimulations. Structure, 7, R55–R60.
Dasgupta, J., & Dattagupta, J. K. (2008). Structural determinantsof V. cholerae CheYs that discriminate them in FliM binding:Comparative modeling and MD simulation studies. Journalof Biomolecular Structure & Dynamics, 25, 495–503.
Day, R., Bennion, B. J., Ham, S., & Daggett, V. (2002).Increasing temperature accelerates protein unfolding with-out changing the pathway of unfolding. Journal of Molecu-lar Biology, 322, 189–203.
de Groot, B. L., van Aalten, D. M. F., Amadei, A., & Berend-sen, H. J. (1996). The consistency of large concertedmotions in proteins in molecular dynamics simulations.Biophysical Journal, 71, 707–1713.
DeLano, W. L. (2002). The PyMOL molecular graphics system.San Carlos, CA: DeLano Scientific. Retrieved from http://www.pymol.org.
Djordjevic, S., & Stock, M. A. (1998). Structural analysis ofbacterial chemotaxis proteins: Components of a dynamicsignaling system. Journal of Structural Biology, 124, 189–200.
Eisenbach, M., & Caplan, S. R. (1998). Bacterial chemotaxis:Unsolved mystery of the flagellar switch. Current Biology,8, R444–R446.
Gegner, J. A., Graham, D. R., Roth, A. F., & Dahlquist, F. W.(1992). Phosphorylating and dephosphorylating proteincomplexes in bacterial chemotaxis. Cell, 70, 975–982.
Grottesi, A., Ceruso, M. A., Colosimo, A., & Di Nola, A.(2002). Molecular dynamics study of a hyperthermophilicand a mesophilic rubredoxin. Proteins, 46, 287–294.
Haldar, S., Paul, S., Joshi, N., Dasgupta, A., & Chattopadhyay,K. (2012). The presence of the iron-sulfur motif is impor-tant for the conformational stability of the antiviral protein,Viperin. PLoS ONE, 7, e31797, Retrieved from http://www.ncbi.nlm.nih.gov/pubmed/22363738.
Hazelbauer, G. L., Berg, H. C., & Matsumura, P. (1993). Bac-terial motility and signal transduction. Cell, 73, 15–22.
Hess, B., Bekker, H., Berendsen, H., & Fraaije, J.(1997). LINCS: A linear constraint solver for molecu-lar simulations. Journal of Computational Chemistry,18, 1463–1472.
Hess, B., Kutzner, C., van der Spoel, D., & Lindahl, E. (2008).GROMACS 4: Algorithms for highly efficient, load-bal-anced, and scalable molecular simulation. Journal of Chem-ical Theory and Computation, 4, 435–447.
Hoch, J. A. (2000). Two-component and phosphorelay signaltransduction. Current Opinion in Microbiology, 3, 165–170.
Huang, J., Sun, C., Mitchell, O., Ng, N., Wang, Z. N., & Bou-tis, G. S. (2012). On the inverse temperature transition anddevelopment of an entropic elastomeric force of the elastinmimetic peptide [LGGVG](3, 7). Journal of ChemicalPhysics, 136, 085101, Retrieved from http://www.ncbi.nlm.nih.gov/pmc/articles/PMC3306437/.
Kabsch, W., & Sander, C. (1983). Dictionary of protein second-ary structure: Pattern recognition of hydrogen-bonded andgeometrical features. Biopolymers, 22, 2577–2637.
Knaggs, M. H., Salsbury, F. R., Edgell, M. H., & Fetrow, J. S.(2007). Insights into correlated motions and long-rangeinteractions in CheY derived from molecular dynamics sim-ulations. Biophysical Journal, 92, 2062–2079.
Kumar, S., & Nussinov, R. (1999). Salt bridge stability inmonomeric proteins. Journal of Molecular Biology, 293,1241–1255.
Kundu, S., & Roy, D. (2009). Comparative structural studies ofpsychrophilic and mesophilic protein homologues bymolecular dynamics simulation. Journal of MolecularGraphics and Modeling, 27, 871–880.
Kundu, S., & Roy, D. (2010). Structural study of carboxylester-ase from hyperthermophilic bacteria Geobacillus stearother-mophilus by molecular dynamics simulation. Journal ofMolecular Graphics and Modelling, 28, 820–827.
Kuo, S., & Koshland, D. E. (1989). Multiple kinetic states forthe flagellar motor switch. Journal of Bacteriology, 171,6279–6287.
Liang, S., Li, L., Hsu, W. L., Pilcher, M. N., Uversky, V.,Zhou, Y., … Meroueh, S. O. (2009). Exploring the molecu-lar design of protein interaction sites with moleculardynamics simulations and free energy calculations. Bio-chemistry, 48, 399–414.
948 M. Paul et al.
Dow
nloa
ded
by [
Uni
vers
ity o
f A
rizo
na]
at 0
5:36
27
Sept
embe
r 20
14
Lindahl, E., Hess, B., & van der Spoel, D. (2001). Gromacs3.0: A package for molecular simulation and trajectoryanalysis. Journal of Molecular Modeling, 7, 306–317.
Matsumura, P., Rydel, J. J., Linameir, R., & Vacante, D.(1984). Overexpression and sequence of the Escherichiacoli cheY gene and biochemical activities of the CheY pro-tein. Journal of Bacteriol, 160, 36–41.
McEvoy, M. M., Hausrath, A. C., Randolph, G. B., Reming-ton, S. J., & Dahlquist, F. W. (1998). Two binding modesreveal flexibility in kinase response regulator interactionsin the bacterial chemotaxis pathway. PNAS USA, 95,7333–7338.
Miyamoto, S., & Kollman, P. A. (1992). SETTLE: An analyti-cal aersion of the SHAKE and RATTLE algorithm for rigidwater models. Journal of Computational Chemistry, 13,952–962.
Sagi, Y., Khan, S., & Eisenbach, M. (2003). Binding of thechemotaxis response regulator CheY to the isolated, intactswitch complex of the bacterial flagellar motor. The Journalof Biological Chemistry, 278, 25867–25871.
Spohn, G., & Scarlato, V. (2001). Motility, Chemotaxis, andFlagella. Helicobacter pylori: Physiology and Genetics.Washington, DC: ASM Press.
Stock, A., Koshland, D. E. Jr., & Stock, J. (1985). Homologiesbetween the Salmonella typhimurium CheY protein andproteins involved in the regulation of chemotaxis, mem-brane protein synthesis, and sporulaton. PNAS USA, 82,7989–7993.
Stock, A. M., Mottonen, J. M., Stock, J. B., & Schutt, C. E.(1989). Three-dimensional structure of CheY, the responseregulator of bacterial chemotaxis. Nature, 337, 745–749.
Szilágyi, A., & Závodszky, P. (2000). Structural differencesbetween mesophilic, moderately thermophilic and extre-mely thermophilic protein subunits: Results of a compre-hensive survey. Structure, 8, 493–504.
Tang, L., & Liu, H. (2007). A comparative molecular dynamicsstudy of thermophilic and mesophilic ribonuclease HIenzymes. Journal of Biomolecular Structure and dynamics,24, 379–392.
Turner, P., Mamo, G., & Karlsson, E. N. (2007). Potential andutilization of thermophiles and thermostable enzymes inbiorefining. Microbial Cell Factories, 6, 9–31.
Usher, K. C., de la Cruz, A. F., Dahlquist, F. W., Swanson, R.V., Simon, M. I., & Remington, S. J. (1998). Crystal struc-tures of CheY from Thermotoga maritima do not supportconventional explanations for the structural basis ofenhanced thermostability. Protein Science, 7, 403–412.
van Aalten, D. M. F., de Groot, B. L., Findlay, J. B. C., Ber-endsen, H. J., & Amadei, A. (1997). A comparison of tech-niques for calculating protein essential dynamics. Journalof Computational Chemistry, 18, 169–181.
Vaught, A. (1996). Graphing with gnuplot and xmgr. LinuxJournal, 1996. Retrieved from http://dl.acm.org/citation.cfm?id=326334
Volz, K., & Matsumura, P. (1991). Crystal structure of Esche-richia coli CheY refined at 1.7-A resolution. The Journalof Biological Chemistry, 266, 15511–15519.
Weber, W., Hünenberger, P. H., & McCammon, J. A. (2000).Molecular dynamics simulations of a polyalanine octapep-tide under Ewald boundary conditions: Influence of artifi-cial periodicity on peptide conformation. The Journal ofPhysical Chemistry B, 104, 3668–3675.
Thermostability of CheY 949
Dow
nloa
ded
by [
Uni
vers
ity o
f A
rizo
na]
at 0
5:36
27
Sept
embe
r 20
14