Comparative Aboriginal Policing Models: Canada, United States ...
Upload
truongkienCategory
view
218download
0
Comparative Indicators ofEducation in the United States and Other G-20 Countries: 2015December 2015
NCES 2016-100 U.S. DEPARTMENT OF EDUCAT ION


Comparative Indicators of Education in the United States and Other G-20 Countries: 2015
DECEMBER 2015
Maria StephensLaura K. WarrenAriana L. Harner American Institutes for Research
Eugene OwenProject OfficerNational Center for Education Statistics
NCES 2016-100
U.S. DEPARTMENT OF EDUCATION

U.S. Department of Education Arne Duncan Secretary
Institute of Education Sciences Ruth Neild Deputy Director for Policy and Research Delegated Duties of the Director
National Center for Education Statistics Peggy G. Carr Acting Commissioner
The National Center for Education Statistics (NCES) is the primary federal entity for collecting, analyzing, and reporting data related to education in the United States and other nations. It fulfills a congressional mandate to collect, collate, analyze, and report full and complete statistics on the condition of education in the United States; conduct and publish reports and specialized analyses of the meaning and significance of such statistics; assist state and local education agencies in improving their statistical systems; and review and report on education activities in foreign countries.
NCES activities are designed to address high-priority education data needs; provide consistent, reliable, complete, and accurate indicators of education status and trends; and report timely, useful, and high-quality data to the U.S. Department of Education, the Congress, the states, other education policymakers, practitioners, data users, and the general public. Unless specifically noted, all information contained herein is in the public domain.
We strive to make our products available in a variety of formats and in language that is appropriate to a variety of audiences. You, as our customer, are the best judge of our success in communicating information effectively. If you have any comments or suggestions about this or any other NCES product or report, we would like to hear from you. Please direct your comments to
National Center for Education Statistics Institute of Education Sciences U.S. Department of Education 1990 K Street NW Washington, DC 20006-5651
December 2015
The NCES Home Page address is http://nces.ed.gov. The NCES Publication and Products address is http://nces.ed.gov/pubsearch.
This report was prepared for the National Center for Education Statistics under Contract No. ED-IES-12-D-0002 with the American Institutes for Research. Mention of trade names, commercial products, or organizations does not imply endorsement by the U.S. Government.
Suggested CitationStephens, M., Warren, L.K., and Harner, A.L. (2015). Comparative Indicators of Education in the United States and Other G-20 Countries: 2015 (NCES 2016-100). U.S. Department of Education, National Center for Education Statistics. Washington, DC: U.S. Government Printing Office
For ordering information on this report, write to
ED Pubs, U.S. Department of Education P.O. Box 22207 Alexandria, VA 22304
or call toll free 1-877-4-ED-Pubs or order online at http://www.edpubs.gov.
Content Contact Mary Coleman 202-502-7409 [email protected]

SUMMARYIntroductionComparative Indicators of Education in the United States and Other G-20 Countries: 2015 is a comparison of the education system in the United States with those in the other Group of 20 (G-20) countries: Argentina, Australia, Brazil, Canada, China, France, Germany, India, Indonesia, Italy, Japan, Mexico, the Republic of Korea, the Russian Federation, Saudi Arabia, South Africa, Turkey, and the United Kingdom. (We do not show data for the European Union, although it is included in the G-20, since it is a political entity that represents a number of countries, not a single education system.) The G-20 countries, which are among the most economically developed, represent 85 percent of the world’s economy and two-thirds of its population. These countries are some of the United States’ largest economic partners.
The report draws on the most current information about edu- ation from the International Indicators of Education Systems (INES) project at the Organization for Economic Cooperation and Development (OECD), as reported in the Education at a Glance series, as well as international assessments that range from grade 4 through adulthood. These international assess-ments include the Progress in International Reading Literacy Study (PIRLS), which assesses fourth-graders in reading; the Trends in International Mathematics and Science Study (TIMSS), which assesses fourth- and eighth-graders in mathematics and science; the Program for International Student Assessment (PISA), which assesses 15-year-old students (regardless of grade) in mathematics, reading, science, and, occasionally, other subjects; and the Program for the International Assessment of Adult Competencies (PIAAC), which assesses adults, ages 16 to 65, in literacy, numeracy, and problem solving in technology-rich environments.
The Comparative Indicators of Education report series has been published on a biennial basis since it began in 2002, although this year’s is the first to expand its focus to the G-20 countries, having previously been focused on the G-8 countries. Please note that many of the report’s indicators do not contain data for the complete set of G-20 countries. Data are not reported when a country does not participate in a study or when its data do not meet reporting standards for a study.
The main fi dings of this report are summarized below. These highlights are organized around the five major sections of the report—population and school enrollment; academic performance; contexts for learning; expenditure for education; and education returns: educational attainment and income.
Population and School EnrollmentThe four indicators in this section primarily draw on data from the OECD’s Education at a Glance 2013: OECD Indicators.
School-Age Population
In the United States in 2012, there were 106.2 million 5- to 29-year-olds, representing 34 percent of the total population. Although students outside this age range enroll in school this is called the school-age population for purposes of comparison. In the other G-20 countries, the school-age population ranged from 25 percent of the total population in Italy and Japan to 50 percent in Saudi Arabia and South Africa. Eleven countries experienced growth in the population of 5- to 29-year-olds from 2002 to 2012, including the United States, with a gain of 5 percentage points. However, as a percentage of the total population, 5- to 29-year-olds declined in the United States and all other reporting G-20 countries (indicator 1).
Enrollment in Formal Education
In France, Germany, Italy, and the United Kingdom, the percent- age of 3- to 4-year-olds enrolled in preprimary or primary education programs in 2011 was above 90 percent, whereas in the United States, the rate was 64 percent. In the United States, it was not until age 6 that at least 90 percent of the population was enrolled in formal education. G-20 countries with enrollment rates below 20 percent among 3- to 4-year-olds included Indonesia and Turkey. In all G-20 countries except France and Italy, a higher percentage of 3- to 4-year-olds were enrolled in 2011 than in 2001. Among 5- to 14-year-olds, all reporting G-20 countries had universal or near universal (more than 90 percent) school participation in 2011. At ages 15–19, participation rates again varied—from 34 percent in China to 92 percent in Germany, with U.S. participation at 80 percent—which may reflect different policies regarding the age at which compulsory education ends. In the United States and four other countries, compulsory education ends at age 17. In 11 countries, compulsory education ends when students are between ages 11 and 16. In Germany, attendance is required until 18 (the highest of the G-20 countries). There were few changes in enrollment rates between 2001 and 2011 among 5- to 14-year-olds or 15- to 19-year-olds in the G-20 countries (indicators 2 and 3).

International and Foreign Students in Higher Education
International students1 made up a smaller percentage of enroll-ment in higher education2 in the United States (3 percent) in 2011 than in every other G-20 country with data, including Australia (20 percent), the United Kingdom (17 percent), Canada (7 percent), and Japan (4 percent). (At the same time, the absolute number of international students in the United States was larger than in any other G-20 country reporting data [OECD 2013, web table C4.7]). Within higher education, international students made up a smaller percentage of enrollment in academic higher education below the doctoral level than at the doctoral level in every reporting G-20 country except Germany. Foreign students3 made up less than 5 percent of total enrollment in higher education in 8 out of the 10 countries reporting this measure, including Brazil, China, Indonesia, Italy, Korea, the Russian Federation, Saudi Arabia, and Turkey. Foreign students also made up a smaller percentage of enrollment in academic higher education below the doctoral level than at the doctoral level in 6 of 7 countries with data for both levels (indicator 4).
Academic Performance
The 10 indicators in this section draw on student and adult results from the four international assessments described in the introduction (i.e., PIRLS, TIMSS, PISA, and PIAAC), each of which has a different number of participating G-20 countries (see Exhibit 1 in the main body of the report). Most of the indicators are from the most recent administrations of each assessment, though the three indicators on changes also draw on earlier administrations.
Recent Performance
At the fourth-grade level in reading in 2011, 86 percent of U.S. students performed at least at the Intermediate level on a set of international benchmarks set by PIRLS to describe the knowledge and skills of students at various points on a performance scale. The percentage of students in the United States and the Russian Federation reaching the Advanced benchmark was larger than the percentage in most other participating G-20 countries and the percentage reaching only the Low benchmark was smaller. In mathematics and science, U.S. and Russian fourth-graders again performed similarly, but generally behind students from Japan and the Republic of Korea. For example, 13 and 15 percent of U.S. fourth-graders reached the Advanced benchmark in mathematics and science, respectively, compared with 39 and 29 percent of Korean fourth-graders (indicator 5). At the eighth-grade level, 7 percent of U.S. students reached the Advanced benchmark in mathematics, as did 10 percent in science; in both subjects, the U.S. percentages were lower than those of students in four of the 10 participating G-20 countries: Japan, the Republic of Korea, the Russian Federation, and the United Kingdom (England) (indicator 6).
At age 15 in reading in 2012, 8 percent of U.S. students reached the high end of the performance scale (defined in PISA as profi ciency levels 5 and 6), while 17 percent reached only the lower end (level 1 or below). The United States had larger percentages of high performers and smaller percentages of low performers than 9 of the 14 participating G-20 countries, but Australia, Canada, France, Japan, and the Republic of Korea each had larger percentages of high performers and smaller percentages of low performers than the United States. Nine percent of U.S. 15-year-old students reached the high end of the performance scale in mathe-matics and 7 percent did so in science, which was lower than in 7 and 6 countries, respectively (indicator 7).
In 2012, the percentage of adults ages 16 to 65 who reached the high end of the performance scale in literacy (defined in PIAAC as level 4 or 5) ranged from 3 percent in Italy to 23 percent in Japan. In the United States, 12 percent of adults reached level 4 or 5. The percentage of adults at the low end of the scale (i.e., at level 1 or below) ranged from 5 percent in Japan to 28 percent in Italy. In numeracy, the percentage of adults at the high end of the performance scale ranged from 4 percent in Italy to 19 percent in Japan. The percentage of adults at the low end of the performance scale ranged from 8 percent in Japan to 32 percent in Italy (indicator 8).
Performance on Content Subscales
The overall performance scales in reading, mathematics, and science described in indicators 5 through 7 are composed of subscales that allow a more detailed look at student performance within each content area. In fourth-grade reading, the subscales are related to the purposes for reading. The United States had a mean score of 563 on the reading for literary experience subscale, which was higher than the scores in 8 of 10 other G-20 countries. On the reading to acquire and use information subscale, the U.S. mean score was 553, which was higher than the scores in seven other G-20 countries (indicator 9).
In mathematics and science, subscales at both the fourth and eighth grades are related to content subdomains (such as algebra in mathematics or chemistry in science). In mathematics, the United States was relatively weaker in geometric shapes and measures in the fourth grade and geometry in the eighth grade, with more countries outperforming the United States on these sub- scales than on the other mathematics subscales, including number (both grades), data display (grade 4), data and chance (grade 8), and algebra (grade 8). In science, U.S. differences on the subscales were not as apparent (indicators 9 and 10).
Mathematics subscales on the assessment of 15-year-olds also are related to content subdomains. U.S. 15-year-olds were relatively stronger on change and relationships and uncertainty and data, outperforming students in more countries on these subscales than on the quantity and space and shape subscales (indicator 11).
1 “International students” refer to students who have left their country of origin (i.e., where they obtained their prior education) for the purpose of studying.2 As used in this report, “higher education” refers to the International Standard Classification of Education (ISCED97) level 5A (academic higher education below the doctoral level), level 5B (vocational higher education), and level 6 (academic higher education at the doctoral level), except where specific data exclusions are noted.3 “Foreign students” refer to students who are not citizens of the countries in which they are enrolled, but may be long-term residents or have been born in that country.
iv SUMMARY

Changes in Performance
PIRLS, TIMSS, and PISA, the three main international student assessments, are each administered regularly, allowing an examination of changes in student performance across time. At the fourth grade, four G-20 countries increased their scores in at least one subject from the most recent prior assessment, whereas four countries decreased their scores in at least one subject. Japan and the United States showed the most consistent differences over the recent time period, with the United States improving its 2011 reading and mathematics scores from 2006 (reading) and 2007 (mathematics) and Japan improving its 2011 mathematics and science scores from 2007. Both countries (among others) also demonstrated longer term gains in these subjects from 2001 (reading) or 1995 (mathematics and science). Indonesia and the United Kingdom (England) were the other two G-20 countries that showed recent gains (in reading, in both cases). In contrast, reading scores decreased in Germany and Italy from 2006 to 2011 and science scores decreased in Australia, Italy, and the United Kingdom (England) from 2007 to 2011 (indicator 12).
At the eighth grade, five G-20 countries’ scores increased in one or two subjects (mathematics and/or science) from the most recent prior assessment, whereas one country’s scores decreased in at least one subject. The Republic of Korea, the Russian Federation, Saudi Arabia, and Turkey showed the most consistent differences over the recent time period, with all three countries increasing scores in both mathematics and science from 2007 to 2011. The Republic of Korea and the Russian Federation also had longer term increases in both subjects from 1995 to 2011. In contrast, students’ scores decreased in Indonesia in science from 2007. The United States showed no measurable changes in mathematics or science from 2007, though there were longer term increases from 1995 to 2011 in both subjects (indicator 13).
Among 15-year-old students, five G-20 countries increased their scores in at least one of three subjects tested (reading, mathematics, and/or science literacy) from 2009 to 2012: France, Germany, Japan, Russian Federation, and Turkey. In contrast, three countries decreased their scores in at least one subject: Australia, Canada, and Mexico. The Russian Federation again showed the most consistent differences over this time period, with increases in both reading and mathematics scores from 2009 (as well as longer term increases from 2000 and 2003, respectively). France, Germany, Japan, and Turkey had score increases in reading from 2009 to 2012. In contrast, Australia’s, Canada’s, and Mexico’s performance declined in mathematics over the same time period. In Canada, students’ mean scores decreased in all three subjects over the long term (2000 to 2012). The United States showed no measurable change in any of the subjects over any of the measured time periods (indicator 14).
Contexts for Learning
The eight indicators in this section draw on student and teacher questionnaire data from the most recent administrations of the international student assessments (i.e., PIRLS, TIMSS, and PISA).
Students’ Attitudes
In PIRLS 2011, fourth-grade students were asked various questions about how much they liked reading, their motivation to read, and their confidence in reading. Their responses were used to create three indices: like to read, motivated to read, and confident in reading. In the United States, the highest percentages of both female and male students were motivated to read and the lowest percentages liked to read, a pattern generally mirrored in the other G-20 countries. Whereas the percentages of females and males who were motivated to read ranged from 67 to 92 percent and 57 to 90 percent, respectively, across countries, the percent-ages of females and males who liked to read ranged from 30 to 43 percent and 13 to 28 percent, respectively. In at least 8 of 11 G-20 countries (including the United States), higher percentages of female students than male students had a positive attitude on each of the three indices. For example, 33, 74, and 43 percent of U.S. females liked to read, were motivated to read, and were confident in reading, respectively. For U.S. males, the respective percentages were 20, 67, and 37 percent (indicator 15).
Fourth- and eighth-grade students were asked similar questions in TIMSS 2011 to develop indices about their attitudes toward mathematics and science. In mathematics, there were no differences in the United States and three other countries (the Russian Federation, the United Kingdom [England], and the United Kingdom [Northern Ireland]) between the percentages of male and female fourth-graders who liked learning mathematics. (In the United States, 45 percent of males and 44 percent of females liked learning mathematics.) In the seven countries in which there were gender differences, males’ attitudes were more positive than females’ in five countries and females’ attitudes were more positive than males’ in two countries (Saudi Arabia and Turkey). Differences were similar at the eighth-grade level, with six countries (including the United States, with a difference of 2 percent) having a higher percentage of males than females who liked learning mathematics, but one country having a higher percentage of females than males (Turkey) (indicator 16).
In PISA 2012, 15-year-old students were asked about the extent to which they agreed with a statement about interest in mathematics. In 12 of 15 participating G-20 countries, higher percentages of male than female students were interested in what they learned in mathematics (defined as those who agreed or strongly agreed), with differences ranging from 2 percentage points in Mexico to 17 percentage points in Germany. The difference between the percentages of U.S. males and females who were interested in what they learned in mathematics was 7 percentage points (indicator 16).
In science, there were no differences in five countries, including the United States, between the percentages of male and female fourth-graders who liked learning science (TIMSS 2011). (In the United States, 57 percent of males and 55 percent of females liked learning science.) In the six countries in which there were gender differences, males’ attitudes were more positive than females’ in three countries and females’ attitudes were more positive than males’ in three countries. In contrast to fourth grade,
SUMMARY v

gender differences were more widespread at the eighth-grade level: higher percentages of males than females liked learning science in all countries except Turkey (in which more females liked learning science) and Saudi Arabia (in where there were no gender differences). In the United States, 33 percent of males liked learning science, compared to 25 percent of females (indicator 17).
Teachers’ Instructional Practices, Participation in Professional Development, and Career Satisfaction
Strategies to help students with reading. In 2011, teachers participating in PIRLS were asked which strategies they usually used to assist fourth-graders having difficulty reading, including: asking parents to help their child with reading, working with students individually, and waiting to see if performance improved with maturation. The first two strategies were used more frequently than the third among teachers in the 11 G-20 countries participating in PIRLS. For example, the percen-tage of fourth-graders whose teachers reported asking parents to help their child with reading ranged from 88 percent in France to 100 percent in Germany and the Russian Federation, and the percen- tage whose teachers reported working with students individually ranged from 77 percent in Germany and Indonesia to 97 percent in the Russian Federation. (The U.S. percentages for these strategies were 95 percent and 94 percent, respectively.) In contrast, the percentage of fourth-graders whose teachers reported waiting to see if performance improved with maturation ranged more widely, from 22 percent in the United Kingdom (Northern Ireland) to 79 percent in Saudi Arabia; this strategy was reported by 37 percent of fourth-graders’ teachers in the United States.
In terms of access to reading professionals, the United States had the highest percentage of fourth-graders whose teachers indicated that such professionals were always available (45 percent), as well as the lowest percentage of fourth-graders whose teachers indicated that they were never available (12 percent) (indicator 18).
Collaboration in mathematics instruction. In 2011, teachers’ reports also indicated varying levels of collaboration in mathematics instruction (categorized as sometimes collaborative, collaborative, or very collaborative), based on how often they engaged in certain interactions with other teachers. At the fourth-grade level, the United States was the only country in which a larger percentage of students had teachers who were very collaborative (49 percent) than who had teachers who were only collaborative (40 percent) or sometimes collaborative (11 percent). At the eighth-grade level, there were no countries in which higher percentages of students had teachers who were very collaborative than had other teachers in other categories; instead, in all countries except the United States and Indonesia, higher percentages of students had teachers who were collaborative. In the United States and Indonesia, there were no measurable differences between the percentage of students who had teachers in the very collaborative and collaborative categories (39 and 40 percent, respectively, in the United States; 45 and 50 percent, respectively, in Indonesia) (indicator 19).
Participation in professional development. A lower percentage of fourth-grade students than eighth-grade students had teachers who reported participating in professional development in various areas of both mathematics and science in the 2 years prior to the TIMSS assessment in 2011. In the United States, the percentage of fourth-grade students whose teachers participated in professional development in mathematics ranged from 49 percent in the area of integrating information technology to 68 percent in the area of mathematics content, the latter of which represented the highest rate of participation across the participating G-20 countries in that area. The percentage of eighth-grade students in the United States whose teachers participated in professional development in mathematics ranged from 61 percent in the area of assessment to 73 percent in the areas of mathematics content and pedagogy (indicator 20). In science, in the United States and nearly all other reporting G-20 countries, less than half of fourth-grade students’ teachers reported participating in professional development in any of the four areas of professional development identified. The percentage of eighth-grade students in the United States whose teachers participated in professional development in science ranged from 57 percent in the area of assessment to 75 percent in the area of science content (indicator 21).
Career satisfaction of reading teachers. In terms of teachers’ satisfaction with their careers as reading teachers, across all participating G-20 countries except France, less than 10 percent of fourth-graders had teachers with low career satisfaction in 2011, with percentages ranging from 2 percent in Saudi Arabia to 6 percent in Australia, the United Kingdom (England), and the United States. In France 17 percent of fourth-graders had teachers with low career satisfaction. Higher levels of career satisfaction were more common: in 8 of the 11 participating G-20 countries, at least half of the fourth-graders had teachers with high career satisfaction, with a high of 89 percent in Indonesia. In the United States, 47 percent of fourth-graders had teachers with high career satisfaction, and an equal percentage had teachers with medium career satisfaction (indicator 22).
Expenditure for Education
The two indicators in this section draw on data from the OECD’s Education at a Glance 2013: OECD Indicators.
Public School Teachers’ Starting Salaries
Of the 14 G-20 countries reporting data in 2011—Argentina, Australia, Canada, France, Germany, Indonesia, Italy, Japan, Mexico, the Republic of Korea, Turkey, the United Kingdom (England and Scotland), and the United States—Germany reported the highest average starting salary of public school teachers at both the primary and upper secondary levels, followed by the United States. In most G-20 countries in 2011 (Germany and Turkey being the exceptions), public school teachers at the beginning of their careers earned less than the average gross domestic product (GDP) per capita in their respective countries (indicator 23).
vi SUMMARY

Expenditure for Education
In 2010, the total expenditures per student and the portion of these expenditures devoted to core education services were higher in the United States than in all other reporting G-20 countries at both the combined primary and secondary education levels and the higher education level.4 (The other reporting countries were Argentina, Australia, Brazil, Canada, France, Italy, Japan, Mexico, the Republic of Korea, the Russian Federation, Turkey, and the United Kingdom.) Annual expenditures per student on core education services in the United States were about $10,900 at the combined primary and secondary education levels and about $19,700 at the higher education level. In the other G-20 countries reporting data, annual expenditures per student on core education services ranged from about $1,900 in Turkey to $9,600 in Australia at the combined primary and secondary levels and from about $5,900 in Italy to $15,100 in Canada at the higher education level. In 2010 the Republic of Korea and the United States spent a higher percentage of gross domestic product (GDP), 6.8 percent, than any other reporting country. Between 2000 and 2010 spending at all levels of education tended to hold steady or increase in the reporting countries (indicator 24).
Education Returns: Educational Attainment and IncomeThe five indicators in this section draw on data from the OECD’s Education at a Glance 2013: OECD Indicators.
Graduation Rates and Educational Attainment
In 2011, graduation rates from upper secondary education were above 90 percent in four of the G-20 countries reporting data: Japan (96 percent), the Republic of Korea and the United Kingdom (93 percent), and Germany (92 percent). The lowest graduation rate was in Mexico, at 49 percent; in the United States, the graduation rate was 77 percent. Differences in graduation rates between males and females were generally small; the largest differences were in Mexico and the United States, where females had a 7 percentage-point higher rate than males. Graduation rates from higher education below the doctoral level ranged from a low of 18 percent in Saudi Arabia to a high of 55 percent in the United Kingdom. The graduation rate in the United States was 39 percent (indicator 25).
Across the typical working age population (i.e., 25- to 64-year-olds), the average highest level of educational attainment in G-20 countries was upper secondary education. This was the case in France, Germany, Japan, the Republic of Korea, South Africa, the United Kingdom, and the United States. Higher percentages of young adults (25- to 34-year-olds) had completed higher education than working age adults in all but one of the G-20 countries. Only in Germany were the rates of completion of higher education by young adults and 25- to 64-year-olds the same (28 percent), although the differences were small in Brazil and the United States (with 1-percentage-point differences) and the Russian Federation (with a 3-percentage-point difference) (indicator 26).
First University Degrees
In 2011, a greater percentage of first university degrees were awarded in the field of social sciences, business, and law than in any other field in all G-20 countries reporting data, except Germany and the Republic of Korea (which awarded the highest percentage of their degrees in the field of mathematics, science, and engineering) and Saudi Arabia (which awarded the highest percen- tage of its degrees in the field of arts and humanities). In the United States, 41 percent of first university degrees were awarded in the field of social sciences, business, and law, whereas 16 percent were awarded in the field of science, mathematics, and engineering (among the lowest percentages in any of the G-20 countries). The arts and humanities was the field of study in which the smallest percentage of first university degrees were awarded in six countries. In nine countries, the smallest percentage of first university degrees were awarded in education (including the United States, at 6 percent) (indicator 27).
Employment Rates
In the United States and all other G-20 countries reporting data in 2011, adults with higher educational attainment had higher employment rates than adults with lower educational attainment. However, while in every reporting G-20 country, employment rates rose with each successively higher education level, the specific advantage of higher levels of education varied by system. For example, the difference in employment rates between adults with upper secondary education and those with lower secondary education ranged from 3 percentage points in Brazil to 22 percentage points in the United Kingdom; the U.S. difference was 16 points. Examining differences in employment rates by sex shows that, in all reporting G-20 countries, men at all education levels had higher employment rates than women with comparable education. In the United States, for example, the employment rate was 86 percent for men with academic higher education (vs. 76 percent for women); 72 percent for men with upper secondary education (vs. 62 percent for women); and 61 percent for men with lower secondary education or below (vs. 40 percent for women) (indicator 28).
Distribution of Population by Education and Income
In all reporting G-20 countries, higher levels of education were associated with higher income (as well as lower levels of low income). At each successively higher level of education, there were larger percentages of adults ages 25 to 64 who earned more than the median income and more than twice the median income (as well as lower percentages who earned at or below half of the median income). At both the lower secondary education or below and upper secondary education levels, the United States had the lowest percentages of 25- to 64-year-olds who earned more than the median income. For U.S. adults with academic higher education, 68 percent earned more than the median income (indicator 29).
4 Expenditures on core services pertain to spending on instructional services, including faculty/staff salaries, professional development, and books and other school materials.
SUMMARY vii

ACKNOWLEDGMENTSMuch of the work for this report was performed by staff in the Education Program at the American Institutes for Research (AIR) and was funded by the National Center for Education Statistics (NCES). It is based on a similar publication produced by the French Ministry of Education.
The following international colleagues reviewed the descriptions of the countries in appendix A and offered useful comments for updating them: Liliana Pascual of the Ministry of Education (Buenos Aires, Argentina); Sue Thomson of the Australian Council for Educational Research (Melbourne, Australia); João Galvão Bacchetto of the National Institute of Educational Studies and Research Anísio Teixeira (Brasilia, Brazil); Tamara Knighton of Statistics Canada and Pierre Brochu of the Council of Ministers
of Education (Toronto, Canada); Wang Lei of the National Education Examinations Authority (Beijing, China); Christine Sälzer of the TUM School of Education (Munich, Germany); Irène Verlet of the Ministry of Education (Paris, France); Ryo Watanabe of the National Institute for Educational Research (Tokyo, Japan); Mi-Young Song of the Korea Institute for Curriculum and Evaluation (Seoul, Republic of Korea); María Antonieta Díaz Gutiérrez of the National Institute for the Evaluation of Education (Mexico City, Mexico); Galina Kovalyova of the Russian Academy of Education (Moscow, Russian Federation); Ali Panal of the Ministry of National Education (Ankara, Turkey); and Sigrid Boyd of the National Foundation for Educational Research (Slough, United Kingdom).5
The authors would like to acknowledge the late Dr. Eugene H. Owen, whose leadership was instrumental in the launch of the G-8 indicator series and its expansion to the G-20 countries in the current volume. Dr. Owen was Senior Advisor for International Assessments at NCES for many years and the project officer for this report and the preceding volumes in the series. Dr. Owen passed away suddenly on March 23, 2015. He will be remembered for his seminal contributions to the field of international student assessment; his kind, generous spirit; his great sense of humor; and his unmatched brilliance. His expertise, dedication, and friendship will be deeply missed.
5 Country descriptions for India, Indonesia, Italy, Saudi Arabia, and South Africa did not receive third-party verification from international colleagues.
viii ACKNOWLEDGMENTS

CONTENTS
Page
Summary .......................................................................................................................................................................................iii
Acknowledgments ....................................................................................................................................................................viii
List of Tables ................................................................................................................................................................................. xi
List of Exhibit and Figures ............................................................................................................................................................xii
Introduction ..................................................................................................................................................................................1
What’s N ew in 2015? ............................................................................................................................................................2
Education Levels Used for the Indicators ...........................................................................................................................2
Mapping G-20 Countries’ Education Systems to the ISCED97 ........................................................................................3
Organization of the Report ..................................................................................................................................................3
Data Sources .........................................................................................................................................................................4
Availability of Country Data ................................................................................................................................................4
Data Quality and Response Rates .....................................................................................................................................5
Statistical Testing ...................................................................................................................................................................5
Earlier Reports in This Series ..................................................................................................................................................6
Indicators
Part I: Population and School Enrollment ..................................................................................................................................7
1: School-Age Population .............................................................................................................................................8
2: Enrollment in Formal Education .............................................................................................................................11
3: Trends in Enrollment in Formal Education .............................................................................................................14
4: International and Foreign Students in Higher Education ....................................................................................16
Part II: Academic Performance ...............................................................................................................................................19
5: Reading, Mathematics, and Science Performance of Fourth-Grade Students ..............................................20
6: Mathematics and Science Performance of Eighth-Grade Students ................................................................23
7: Reading, Mathematics, and Science Literacy Performance of 15-Year-Old Students ..................................26
8: Adult Performance in Literacy, Numeracy, and Problem Solving in Technology-Rich Environments ...........29
9: Performance of Fourth-Grade Students on Subscales in Reading, Mathematics, and Science ..................32
10: Performance of Eighth-Grade Students on Subscales in Mathematics and Science ....................................36
11: Performance of 15-Year-Old Students on Subscales in Mathematics Literacy ................................................39
12: Changes in the Reading, Mathematics, and Science Performance of Fourth-Grade Students ..................41
13: Changes in the Mathematics and Science Performance of Eighth-Grade Students ....................................43
14: Changes in 15-Year-Olds’ Performance in Reading, Mathematics, and Science Literacy ...........................45
Part III: Contexts for Learning ....................................................................................................................................................47
15: Gender Differences in Students’ Attitudes Toward Reading ..............................................................................48
16: Gender Differences in Students’ Attitudes Toward Mathematics .....................................................................51
CONTENTS ix

Page
17: Gender Differences in Students’ Attitudes Toward Science ..............................................................................55
18: Fourth-Grade Teachers’ Strategies for Assisting Students Having Difficulty Reading ......................................57
19: Teacher Collaboration in Mathematics Instruction .............................................................................................59
20: Teacher Professional Development in Mathematics ..........................................................................................61
21: Teacher Professional Development in Science ...................................................................................................64
22: Fourth-Grade Reading Teachers’ Career Satisfaction .......................................................................................67
Part IV: Expenditure for Education ...........................................................................................................................................70
23: Public School Teachers’ Starting Salaries ..............................................................................................................71
24: Change in Annual Expenditures for Education ....................................................................................................73
Part V: Education Returns: Educational Attainment and Income .......................................................................................77
25: Graduation Rates by Sex ........................................................................................................................................78
26: Educational Attainment in the Adult Population ................................................................................................80
27: First University Degrees by Field of Study ...............................................................................................................83
28: Employment Rates ..................................................................................................................................................86
29: Distribution of Population by Education and Income .........................................................................................90
References .................................................................................................................................................................................92
Appendix A: The Education Systems of the G-20 Countries .................................................................................................93
Reader’s Guide: Education System Charts .....................................................................................................................94
The Education System in Argentina .................................................................................................................................96
The Education System in Australia ....................................................................................................................................98
The Education System in Brazil ........................................................................................................................................101
The Education System in Canada ..................................................................................................................................103
The Education System in China ......................................................................................................................................105
The Education System in France .....................................................................................................................................107
The Education System in Germany ................................................................................................................................109
The Education System in India ........................................................................................................................................112
The Education System in Indonesia ................................................................................................................................114
The Education System in Italy ..........................................................................................................................................116
The Education System in Japan .....................................................................................................................................118
The Education System in Mexico ....................................................................................................................................120
The Education System in the Republic of Korea ...........................................................................................................122
The Education System in the Russian Federation ..........................................................................................................124
The Education System in Saudi Arabia ..........................................................................................................................126
The Education System in South Africa ............................................................................................................................128
The Education System in Turkey ......................................................................................................................................130
The Education System in the United Kingdom ..............................................................................................................132
The Education System in England, Northern Ireland, and Wales ........................................................................132
The Education System in Scotland ..........................................................................................................................134
The Education System in the United States ...................................................................................................................136
x CONTENTS

LIST OF TABLESTable Page
1-1. Total population and population ages 5 to 29, 5 to 19, and 20 to 29, by country: 2002 and 2012 .....................9
1-2. Percentage of population ages 5 to 29, 5 to 19, and 20 to 29, by country: 2002 and 2012 ................................9
2-1. Percentage of population ages 3 to 29 enrolled in formal education, by age group and country: 2011 ......12
3-1. Percentage of population ages 3 to 29 enrolled in formal education, by age group and country: 2001 and 2011 ..............................................................................................................................................................15
23-1. Public school teachers’ average starting salaries in U.S. dollars expressed as a ratio of gross domestic product (GDP) per capita in U.S. dollars, by education level and country: 2011 ...............................................72
27-1. Number of first university degree recipients, by field of study and country: 2011 ...............................................85
29-1. Percentage of the population ages 25 to 64, by highest level of education, income, and country: 2011 .....91
CONTENTS xi

LIST OF EXHIBIT AND FIGURESPageExhibit
1-1. G-20 country coverage in indicators, by data source .............................................................................................5
Figure
1-1. Percentage change in population ages 5 to 29, 5 to 19, and 20 to 29, by country: 2002 to 2012 ...................10
2-1. Age range at which more than 90 percent of the population is enrolled in formal education and ending age of compulsory education, by country: 2011.......................................................................................13
4-1. Percentage of students enrolled in higher education who are international students, by higher education program and country: 2011 ....................................................................................................................17
4-2. Percentage of students enrolled in higher education who are foreign students, by higher education program and country: 2011 .......................................................................................................................................18
5-1. Percentage distribution of fourth-grade students across international benchmarks in reading, mathematics, and science, by country: 2011 .........................................................................................................22
6-1. Percentage distribution of eighth-grade students across international benchmarks in mathematics and science, by country: 2011...................................................................................................................................25
7-1. Percentage distribution of 15-year-old students across proficiency levels in reading, mathematics, and science literacy, by country: 2012 .....................................................................................................................28
8-1. Percentage distribution of adults ages 16 to 65 across PIAAC proficiency levels in literacy, numeracy, and problem solving in technology-rich environments, by country: 2012 ...........................................................31
9-1. Average scores of fourth-grade students in reading literacy, by purpose of reading and country: 2011 .......34
9-2. Average scores of fourth-grade students in mathematics and science, by content domain and country: 2011 ................................................................................................................................................................35
10-1. Average scores of eighth-grade students in mathematics and science, by content domain and country: 2011 ................................................................................................................................................................38
11-1. Average scores of 15-year-old students in mathematics literacy, by content subscale and country: 2012 ...............................................................................................................................................................................40
12-1. Changes in fourth-grade average scores in reading, mathematics, and science, by country: Selected years, 1995−2011 .........................................................................................................................................42
13-1. Changes in eighth-grade average scores in mathematics and science, by country: 1995, 2007, and 2011 .......................................................................................................................................................................44
14-1. Changes in 15-year-olds’ average scores in reading, mathematics, and science literacy by country: Selected years, 2000−2012 .........................................................................................................................................46
15-1. Percentage of fourth-grade students who liked reading, based on the Students Like to Read Index, by sex and country: 2011 .................................................................................................................................................49
15-2. Percentage of fourth-grade students who were motivated to read, based on the Students Motivated to Read Index, by sex and country: 2011 .................................................................................................................49
15-3. Percentage of fourth-grade students who expressed confidence in reading, based on the Students Confident in Reading Index, by sex and country: 2011 ..........................................................................................50
16-1. Percentage of fourth-grade students who liked learning mathematics, based on the Students Like Learning Mathematics index, by sex and country: 2011 ........................................................................................53
16-2. Percentage of eighth-grade students who liked learning mathematics, based on the Students Like Learning Mathematics index, by sex and country: 2011 ........................................................................................53
xii CONTENTS

Figure Page
16-3. Percentage of 15-year-old students who expressed interest in mathematics, based on a measure of students’ intrinsic motivation to learn mathematics, by sex and country: 2012 ..................................................54
17-1. Percentage of fourth-grade students who liked learning science, based on the Students Like Learning Science Index, by sex and country: 2011 .................................................................................................................56
17-2. Percentage of eighth-grade students who liked learning science, based on the Students Like Learning Science Index, by sex and country: 2011 .................................................................................................56
18-1. Percentage of fourth-grade students whose teachers reported employing specific strategies to assist students having difficulty reading, by country: 2011 .....................................................................................58
18-2. Percentage distribution of fourth-grade students, by teacher reports of the availability of specialized reading professionals and country: 2011 ..................................................................................................................58
19-1. Percentage distribution of fourth-grade students, by extent of mathematics teachers’ collaboration on instruction and country: 2011 ...............................................................................................................................60
19-2. Percentage distribution of eighth-grade students, by extent of mathematics teachers’ collaboration on instruction and country: 2011 ...............................................................................................................................60
20-1. Percentage of fourth- and eighth-grade students whose teachers reported that they participated in various professional development activities in mathematics in the 2 years prior to the assessment, by area of professional development and country: 2011 ...........................................................................................63
21-1. Percentage of fourth- and eighth-grade students whose teachers reported that they participated in various professional development activities in science in the 2 years prior to the assessment, by area of professional development and country: 2011 ...........................................................................................66
22-1. Percentage distribution of fourth-grade students, by reading teacher’s reported level of career satisfaction and country: 2011 ...................................................................................................................................69
22-2. Change in percentage of fourth-grade students, by reading teachers’ reported level of career satisfaction and country: 2006 and 2011 ..................................................................................................................69
23-1. Public school teachers’ average starting salaries (in thousands of U.S. dollars), by education level and country: 2011 ........................................................................................................................................................72
24-1. Annual public and private expenditures per student on core services and total services (in thousands of U.S. dollars), by education level and country: 2010............................................................................................75
24-2. Annual public and private education expenditures as a percentage of gross domestic product (GDP), by education level and country: 2000 and 2010 ........................................................................................76
25-1. Graduation rates in upper secondary education, by sex and country: 2011 .....................................................79
25-2. Graduation rates in academic higher education below the doctoral level, by sex and country: 2011 .........79
26-1. Percentage distribution of the population ages 25 to 64, by highest level of education completed and country: 2011 ........................................................................................................................................................81
26-2. Percentage of the population ages 25 to 34 who completed higher education, by sex and country: 2011 ...............................................................................................................................................................................82
27-1. Percentage distribution of first university degrees awarded, by field of study and country: 2011 ....................84
28-1. Employment rates of adults ages 25 to 64, by highest level of education and country: 2011 ..........................88
28-2. Employment rates of adults ages 25 to 64, by sex, highest level of education, and country: 2011 ..................89
29-1. Percentage of population ages 25 to 64 who earned more than the median income, by highest level of education and country: 2011 .......................................................................................................................91
A-1. Levels of education in Argentina, by age and year of schooling: 2013 ...............................................................96
A-2. Levels of education in Australia, by age and year of schooling: 2013 .................................................................98
A-3. Levels of education in Brazil, by age and year of schooling: 2013 .....................................................................101
A-4. Levels of education in Canada, by age and year of schooling: 2013 ...............................................................103
A-5. Levels of education in China, by age and year of schooling: 2013 ...................................................................105
CONTENTS xiii

Figure
A-6. Levels of education in France, by age and year of schooling: 2013 ..................................................................107
A-7. Levels of education in Germany, by age and year of schooling: 2013 .............................................................109
A-8. Levels of education in India, by age and year of schooling: 2013 .....................................................................112
A-9. Levels of education in Indonesia, by age and year of schooling: 2013 .............................................................114
A-10. Levels of education in Italy, by age and year of schooling: 2013 .......................................................................116
A-11. Levels of education in Japan, by age and year of schooling: 2013 ...................................................................118
A-12. Levels of education in Mexico, by age and year of schooling: 2013 .................................................................120
A-13. Levels of education in the Republic of Korea, by age and year of schooling: 2013 ........................................122
A-14. Levels of education in the Russian Federation, by age and year of schooling: 2013 .......................................124
A-15. Levels of education in Saudi Arabia, by age and year of schooling: 2013 .......................................................126
A-16. Levels of education in South Africa, by age and year of schooling: 2013 .........................................................128
A-17. Levels of education in Turkey, by age and year of schooling: 2013 ...................................................................130
A-18-1. Levels of education in England, Northern Ireland, and Wales, by age and year of schooling: 2013 .............132
A-18-2. Levels of education in Scotland, by age and year of schooling: 2013 ..............................................................134
A-19. Levels of education in the United States, by age and year of schooling: 2013 ................................................136
Page
xiv CONTENTS

Introduction

INTRODUCTIONSince the 1960s, the United States has participated actively in international projects that are designed to provide key information about the performance of the U.S. education system relative to education systems in other countries. These projects include the International Indicators of Education Systems (INES) project at the Organization for Economic Cooperation and Development (OECD); the Progress in International Reading Literacy Study (PIRLS); the Trends in International Mathematics and Science Study (TIMSS); the Program for International Student Assessment (PISA); and, more recently, the Program for the International Assessment of Adult Competencies (PIAAC). This report draws on the most current information available to present a set of education indicators that compare the education system in the United States with those in other economically developed countries. Updated information from these various projects will be incorporated in subsequent reports.
Although the international education projects cited above involve many countries worldwide, the comparisons in this report focus on the Group of 20 (G-20) countries: Argentina, Australia, Brazil, Canada, China, France, Germany, India, Indonesia, Italy, Japan, Mexico, the Republic of Korea, the Russian Federation, Saudi Arabia, South Africa, Turkey, the United Kingdom, and the United States.1 These are among the most industrialized countries in the world. The G-20 countries were selected as a comparison group because of the similarities in their economic development and because the group includes many of the United States’ major economic partners. The leaders of these countries meet regularly to discuss economic and other policy issues.
What’s New in 2015? This is the sixth report in the Comparative Indicators of Education series published by the National Center for Education Statistics (NCES). Whereas all of the prior reports focused on the G-8 countries, this report expands its focus to include the G-20 countries.
About two-thirds of the indicators use 2011 data from PIRLS or TIMSS or 2012 data from PISA or PIAAC. Using these recent data available from all the international assessments in which the United States participates, the report is able to compare the performance of students across the span of primary and secondary education, as well as of adults, in a variety of key subjects and competency areas, such as reading and mathematics. The section on academic performance, for example, includes indicators providing (a) snapshots of performance (or the percentages of the population reaching different proficiency levels or international benchmarks in a variety of content domains) from fourth grade through adulthood; (b) a closer look at student achievement
in content subdomains in reading, mathematics, and science; and (c) an examination of changes in student performance over time in reading, mathematics, and science. The student and teacher questionnaires that accompany the international student assessments are also used to provide data for some updated and some new indicators describing the contexts of learning in the G-20 countries. Notably, all of the assessment data and nearly all the related tests for statistical significance were obtained using the NCES International Data Explorer (IDE), which is an online tool (found at http://nces.ed.gov/surveys/international/ide/) allowing users to create statistical tables and charts using data from international assessments.
Most of the remaining one-third of the indicators draw on the international education data compiled by the OECD in the 2013 edition of Education at a Glance or provided in its online database. These data were largely used to update several indicators that have been presented previously.
Education Levels Used for the IndicatorsMany of the indicators in this report refer to at least one of the following education levels: preprimary education, primary education, secondary education, and higher education. A brief overview of the education levels is presented here to provide the reader with a frame of reference (see appendix A for more detailed descriptions of countries’ education systems). To ensure comparability in the indicators, each country aligned its national education data to correspond with the definitions of education levels that were developed for the 1997 revision of the International Standard Classification of Education (ISCED97) (United Nations Educational, Scientific and Cultural Organization 1997). The following descriptions highlight the key features of (1) education programs from preprimary through secondary education and (2) higher education programs.
Preprimary education includes programs of education for children at least 3 years of age that involve organized, center-based instructional activities; in most countries, preprimary education is not compulsory. Primary education includes programs that are designed to give students a sound basic education in reading, writing, and mathematics, along with an elementary understanding of other subjects, such as history, geography, science, art, and music. In the international classification, primary education usually begins at the start of compulsory education (around age 6) and lasts for 6 years. In the United States, this is generally synonymous with elementary education. Secondary education encompasses two stages: lower secondary education and upper secondary education. Lower secondary education includes programs that are
1 Although the European Union is a member of the G-20, it is not included in the indicators since it is a political entity that represents a number of countries (including some for which data are already included in the indicators).
2 INTRODUCTION

designed to complete basic education; the standard duration in the international classification is 3 years. Upper secondary education is designed to provide students with more in-depth knowledge of academic or vocational subjects and to prepare them for higher level academic or vocational studies or entry into the labor market. The standard duration of upper secondary education in the international classification is 3 years. In the United States, lower secondary education and upper secondary education generally correspond to junior high school and high school, respectively.
Higher education includes tertiary programs2 that fall into three main categories:
• Academic higher education below the doctoral level. These largely theory-based programs are intended to provide sufficien qualifications to gain entry into advanced research programs and professions with high skill requirements. To be classifiedas such, a degree program must last at least 3 years and is typically preceded by at least 13 years of formal schooling. In the United States, bachelor’s, master’s, and first professional degree programs are classified at this level.
• Vocational higher education. These programs provide a higher level of career and technical education and are designed to prepare students for the labor market. In the international classification, these programs last 2 to 4 years. In the United States, associate’s degree programs are classified at this level
• Doctoral level of academic higher education. These programs usually require the completion of a research thesis or disser-tation. In the United States, master’s degree programs and doctoral degree programs are classified at this level
The international classification also includes an education level that straddles the boundary between upper secondary and higher education: postsecondary nontertiary education. These programs of study—which are primarily vocational in nature—are generally taken after the completion of upper secondary education. They are often not significantly more advanced than upper secondary programs, but they serve to broaden the knowledge of participants who have already completed upper secondary education. In the United States, these programs are often in the form of occupationally specific vocational certifica e programs, such as 1-year certific tion programs offered at technical institutes or community colleges.3
Mapping G-20 Countries’ Education Systems to the ISCED97
Matching the education levels of individual education systems to the ISCED97 classification can be challenging, because the particulars of individual countries seldom fit the ISCED97 perfectly. Using ISCED97 classifications as a starting point, NCES worked with education professionals in other G-20 countries to create a general overview of each country’s education system. As an aid to the reader, schematics of how the ISCED97 applies to each of the
G-20 education systems are provided in appendix A, accompanied by text describing each system in greater detail.
Organization of the ReportFollowing this introductory section, the report presents 29 indicators, each of which compares a different aspect of the U.S. education system and the education systems of the other G-20 countries. The indicators are organized into the following sections:
• population and school enrollment;• academic performance;• contexts for learning;• expenditure for education; and• education returns: educational attainment and income.
The first section, population and school enrollment, presents indicators that suggest the potential demand for education in countries as measured by the size and growth of their school-age population and current and past levels of enrollment in formal education. The section concludes with an indicator that examines the extent to which international or foreign students are enrolled in higher education across the G-20 countries.
The next section, academic performance, has indicators spanning school levels and adulthood, as well as subject areas including reading literacy, mathematics, science, and problem solving in technology-rich environments. The indicators present findings on student performance in the G-20 countries, including the distribu-tion of achievement across proficiency levels, average performance on content subscales, and changes in average performance on overall scales in reading, mathematics, and science.
The third section highlights a range of key policy-relevant issues pertaining to contexts for learning across the G-20 countries. This section presents data on differences between males’ and females’ attitudes toward learning across the grades, as well as on teachers’ reports of their instructional strategies, opportunities for collaboration and professional development, and job satisfaction and morale.
The fourth section provides a comparative look at expenditure for education, including one indicator on public school teachers’ salaries in primary and secondary education and one on annual changes in education expenditures.
The final section, education returns: educational attainment and income, focuses on graduation rates, educational attainment and degrees, employment rates, and earnings (including disaggregation by sex and field of study)
Each indicator is presented in a two-part format. The first part presents key findings and highlights how the United States compares with its G-20 peers (for which data are available) on the issue examined in the indicator. A section that defines the terms
2 In the international classification, more advanced postsecondary education (such as attending a 4-year college or university) is referred to as “tertiary education.” In the current report, the term “higher education” is used because this term is more familiar to American readers. 3 In an indicator on annual education expenditures (indicator 24), postsecondary nontertiary education data are included with secondary education and/or higher education data for one or more countries as specified in the figures. In indicators on the percentage distribution of the population by highest level of education completed (indicator 26), employment rates (indicator 28), and the distribution of the population by education and income (indicator 29), postsecondary nontertiary education data are included with upper secondary education data for all G-20 countries reporting data.
INTRODUCTION 3

used in the indicator and describes key features of the methodology used to produce it follows the key findings. The second part presents graphical depictions of the data that support the key findings These tables and figures also include the specific data source for the indicator and more detailed notes on interpreting the data.
Data SourcesThere are five main sources of data for this report:
• INES. INES data come primarily from tables in Education at a Glance 2013: OECD Indicators or from the OECD’s online Education Database. These data are derived from annual data collections carried out by the OECD, with member countries’ data coming from a variety of national data sources, including administrative data collections, school surveys, household surveys, and national financial reports. Most of the INES indicator data for the United States come from the U.S. Census Bureau’s Current Population Survey, the NCES Common Core of Data, the NCES Integrated Postsecondary Education Data System, and the NCES Schools and Staffing Surve .
• PIRLS. PIRLS is an assessment of fourth-grade students’ reading literacy that is conducted on a 5-year cycle under the auspices of the International Association for the Evaluation of Educational Achievement (IEA). Indicators in this report draw on data primarily from 2011, but also from the 2006 and 2001 cycles.
• TIMSS. TIMSS is an assessment of fourth- and eighth-grade mathematics and science achievement that is conducted on a 4-year cycle under the auspices of the IEA. Indicators in this report draw on data primarily from 2011, but also from the 2007 and 1995 cycles.
• PISA. PISA is an assessment of 15-year-old students that is conducted on a 3-year cycle under the auspices of the OECD. In 2012, it had a major focus on mathematics literacy. Indicators in this report draw on data primarily from 2012, but also from 2009, 2006, 2003, and 2000.
• PIAAC. PIAAC is a new OECD assessment focused on adult competencies, including literacy, numeracy, and problem-solving in technology-rich environments and first administered in 2012.
Data for indicator 1, on the school-age population, are from the International Data Base (IDB) of the U.S. Census Bureau.
Many of the indicators in this report present student data. Some of the indicators show
• students’ mean scores (e.g., indicators 9–14); • the percentage of students or adults meeting certain perfor-
mance levels, such as the percentage of students reaching established achievement benchmarks or proficiency levels (e.g., indicators 5–8); or
• the percentage of students categorized into particular groups based on their self-reported views, such as the percentage of students who are “confident in reading” (e.g., indicators 15–17).
Other indicators use the student as the unit of analysis, but the data are reported from the perspective of teachers, such as the percentage of students whose teachers reported participating in professional development (e.g., indicators 18–22).
In several other indicators, the unit of analysis is not the student. For example, the unit of analysis may be
• the teacher, as in public school teachers’ starting salaries (indicator 23); or
• postsecondary degrees, as in first university degrees by field of study (indicator 27).
When interpreting the data presented in this report, it is important for readers to be aware of limitations based on the source of information and problems that may exist in verifying comparability in reporting.
Except for indicator 23, which explicitly states that the data pertain only to public school teachers, the indicators in this report include data from both public and private schools.
Availability of Country DataIt should be noted that many of the indicators in this report do not contain data for the complete set of G-20 countries. That is, specific countries are sometimes not included or are only partially included in an indicator. This is the result of source data not being reported, specific countries or jurisdictions within a country not participating in a particular survey, or a country’s data not meeting reporting standards. Therefore, these countries do not appear in indicators using these data. However, every G-20 country is featured in at least one indicator. Countries that are only partially included are noted in the respective tables and figures.
One country warrants special mention: the United Kingdom. The United Kingdom—which includes England, Northern Ireland, Scotland, and Wales—participated in the various cycles of PISA as a unified education system; thus, results are reported for the United Kingdom as a whole in indicators drawing on PISA data. However, in TIMSS and PIRLS, England, Northern Ireland, and Scotland participated as individual jurisdictions. Results are reported for these jurisdictions separately—the United Kingdom (England) or the United Kingdom (Northern Ireland), for example—in indicators drawing on TIMSS and PIRLS data. In PIAAC, only England and Northern Ireland participated and their results are shown in a combined fashion. Except for starting salary data all other results not mentioned are reported for the United Kingdom as a whole.4
Additionally, because some of the indicators of academic perfor-mance focus on the most recent administration (e.g., 2011 for TIMSS and PIRLS and 2012 for PISA) and some focus on changes across years, the countries included in the indicators may vary even though they draw from the same assessment program’s data. For example, Scotland did not participate in PIRLS 2011,
4 Data are available for subnational jurisdictions in three other countries: Canada, China, and the United States. However in contrast to the United Kingdom, these data have been excluded from the report for several reasons. First, none of the Canadian, Chinese, or U.S. subnational jurisdictions have the level of autonomy that the United Kingdom’s subnational jurisdictions have, which are autonomous except in foreign affairs. Second, whereas the United Kingdom’s subnational jurisdictions represent a large percentage of the total population and there is little variation economically across the jurisdictions, this is not the case for the subnational jurisdictions in the other countries.
4 INTRODUCTION

but it did participate in 2001 and 2006; thus, it appears in the indicator on changes but not in the indicator on 2011 results. Any country participating in at least two of the years presented in the three-time-point trend indicators was included in those indicators.
In general, the countries shown in exhibit 1-1 below are included in indicators using the identified sources. For example, the countries
participating in PIRLS 2011, or at least two other cycles of PIRLS, include Australia, Canada, France, Germany, Indonesia, Italy, the Russian Federation, Saudi Arabia, the United Kingdom (including England, Northern Ireland, and Scotland), and the United States. In indicators using INES data, the reporting G-20 countries vary somewhat; these are shown in each indicator.
Exhibit 1-1. G-20 country coverage in indicators, by data source
G-20 CountriesPIRLS (2011 or at least
two other cycles)TIMSS (2011 or at least
two other cycles)PISA (2012 or at least
two other cycles) PIAAC (2012) INES
Argentina P VariesAustralia P P P P VariesBrazil P VariesCanada1 P P P VariesChina VariesFrance P P VariesGermany P P P P VariesIndia VariesIndonesia P P P VariesItaly P P P P VariesJapan P P P VariesRepublic of Korea P P P VariesMexico P VariesRussian Federation P P P VariesSaudi Arabia P P VariesSouth Africa VariesTurkey P P VariesUnited Kingdom P Varies
England P P P Northern Ireland P P P Scotland P P
United States P P P P Varies1 Although Canada did not participate in TIMSS 2011 as a unified education system, several Canadian provinces participated individually; however, their results are not shown in this report.
While every effort was made to use the most up-to-date data available across the G-20 countries (usually from 2010, 2011, or 2012), data from earlier years were sometimes used if more recent data were not available. To make this clear to the reader, these occurrences are noted in relevant tables and figures
Data Quality and Response RatesEach of the international assessments has established technical standards of data quality, including participation and response rate standards, which countries must meet in order to be included in the comparative results. For the student assessments (PIRLS, TIMSS, and PISA), response rate standards were set using composites of response rates at the school, classroom, student, and teacher levels, and response rates were calculated with and without the inclusion of substitute schools that were selected to replace schools refusing to participate.5 For the adult assessment (PIAAC), response rate standards were based on the participant response rate and
were calculated with and without the inclusion of substitutes. These standards are described in detail in the respective technical reports (Martin and Mullis 2013; OECD 2014; OECD in press).
Consistent with NCES statistical standards, item response rates below 85 percent are footnoted in the tables and figures of this report, as are instances where reporting standards are not met because there are too few observations to provide reliable estimates.
Statistical Testing
Eleven of the indicators presented in this report (indicators 1–4 and 23–29) are derived either from administrative records that are based on universe collections or from national sample surveys for which standard errors were not available. Consequently, for these indicators, no tests of statistical significance were conducted to establish whether observed differences from the U.S. average were statistically significant. However, for the 18 other indicators
5 International requirements state that each country must make every effort to obtain cooperation from the sampled schools, but the requirements also recognize that this is not always possible. Thus, it is allowable to use substitute schools as a means to avoid sample size loss associated with school nonresponse. To do this, each sampled school was assigned two substitute schools in the sampling frame. Substitutes for noncooperating sampled schools were identified by assigning as substitute schools the schools that immediately preceded and followed the sampled school in the frame. The sampling frame was sorted by the stratification variables and by a measure of size to ensure that any sampled school’s substitute had similar characteristics.
INTRODUCTION 5

derived from PIRLS, TIMSS, PISA, and PIAAC data (indicators 5–22), standard t tests were calculated for comparisons of estimates within or between countries (e.g., to test whether a U.S. estimate is statistically different from other G-20 countries’ estimates). Differences were reported if they were found to be statistically significant at the .05 level, using two-tailed tests of significancefor comparisons of independent samples. No adjustments were made for multiple comparisons. Where feasible, these differences are noted in the figures with an asterisk. The exceptions are the figures for indicators 5 through 8 and 20 through 21, where their presentation would be too distracting.
Percentage-point differences presented in the text were computed from unrounded numbers; therefore, they may differ from computations made using the rounded whole numbers that appear in the tables and figures
Earlier Reports in This SeriesPrior to this report, NCES produced five earlier reports—in 2011, 2009, 2006, 2004, and 2002—in this series. The earlier reports covered only the G-8 countries:
• The 2011 report can be found at http://nces.ed.gov/pubsearch/pubsinfo.asp?pubid=2012007.
• The 2009 report can be found at http://nces.ed.gov/pubsearch/pubsinfo.asp?pubid=2009039.
• The 2006 report can be found at http://nces.ed.gov/pubsearch/pubsinfo.asp?pubid=2007006.
• The 2004 report can be found at http://nces.ed.gov/pubsearch/pubsinfo.asp?pubid=2005021.
• The 2002 report can be found at http://nces.ed.gov/pubsearch/pubsinfo.asp?pubid=2003026.
General information about the International Activities Program at NCES, including work on international comparisons in education, can be found at http://nces.ed.gov/surveys/international.
6 INTRODUCTION

INDICATORS PART IINDICATORS PART IPopulation and School Enrollment
The indicators in this section provide data on the population and school enrollment of the G-20 countries.
• Indicator 1 examines the school-age population as a percentage of the overall population. It focuses on the age group most likely to be enrolled in education, as well as on two subsets of that age group: those most likely to be enrolled in primary or secondary education and those generally of higher education age.
• Indicators 2 and 3 describe the percentage of the population that is enrolled in formal education in the G-20 countries and changes in enrollment over a 10-year period. They focus on the four age groups that generally correspond to the
ages of those enrolled in preprimary education, primary and lower secondary education, upper secondary education, and higher education.
• Indicator 4 describes the prevalence of international and foreign students studying in higher education in the G-20 countries, including students in academic programs below the doctoral level and at the doctoral level. It provides an indication of the internationalization of higher education and student mobility.
The indicators in this section draw primarily on data from Education at a Glance 2013: OECD Indicators (OECD 2013a).

Indicator 1SCHOOL-AGE POPULATION
G-20 Countries Included: Argentina, Australia, Canada, China, France, Germany, India, Indonesia, Italy, Japan, Mexico, Republic of Korea, Russian Federation, Saudi Arabia, South Africa, Turkey, United Kingdom, United States
From 2002 to 2012, the school-age population (includingboth 5- to 19-year-olds and 20- to 29-year-olds) decreased in Japan and the Republic of Korea, but increased in Argentina, Australia, India, Saudi Arabia, Turkey, and the United States. However, in all G-20 countries, there was a decline in the school-age population as a percentage of the total population from 2002 to 2012.
This indicator describes the size of the school-age population in the G-20 countries both in absolute numbers and in terms of the percentage of the population. It focuses on the age group most likely to be enrolled in education (i.e., 5- to 29-year-olds), as well as on two subsets of that age group: those most likely to be enrolled in primary or secondary education (i.e., 5- to 19-year-olds) and those generally of postsecondary or higher education age (i.e., 20- to 29-year-olds). The indicator also describes changes in the percentage of the school-age population over time, from 2002 to 2012.
In 2012, the total population across the G-20 countries ranged from 22 million in Australia to 1.3 billion in China, and the school-age population of 5- to 29-year-olds ranged from 7.2 million in Australia to 554.8 million in India (table 1-1). In the United States, there were 106.2 million 5- to 29-year-olds, which represented 34 percent of the total population (table 1-2). In the other G-20 countries, the school-age population ranged from 25 percent of the total population in Italy and Japan to 50 percent in Saudi Arabia and South Africa.
The subpopulation of 5- to 19-year-olds represented 20 percent of the total population in the United States in 2012 (table 1-2).
The U.S. percentage of 5- to 19-year-olds was higher than the percentages in 10 other G-20 countries and lower than the percentages in 8 other countries. The percentages of 5- to 19-year-olds in the other G-20 countries ranged from 14 percent in Germany, Italy, and Japan to 29 percent in India, Saudi Arabia, and South Africa.
The subpopulation of 20- to 29-year-olds represented 14 percent of the total population in the United States in 2012, which was below the percentages in 11 other countries. The percentages in the other G-20 countries ranged from 11 percent in Italy and Japan to 21 percent in Saudi Arabia and South Africa.
From 2002 to 2012, the school-age population and both subsets of that population decreased in Japan and the Republic of Korea, but increased in Argentina, Australia, India, Saudi Arabia, Turkey, and the United States (figure 1-1). The other G-20 countries experienced varied population changes over the same time period. For example, in Canada, China, Germany, and the Russian Federation, the population of 5- to 29-year-olds and 5- to 19-year-olds decreased, but the population of 20- to 29-year-olds increased. In Brazil, Mexico, South Africa, and the United Kingdom, the population of 5- to 29-year-olds and 20- to 29-year-olds increased, while the population of 5- to 19-year-olds decreased.
However, despite the net percentage increases in the school-age population just described for some countries, in all reporting G-20 countries, there was a decline in the school-age population as a percentage of the total population from 2002 to 2012.
Definitions and Methodologie
In each country, the percentage of the population of 5- to 29-year-olds in 2002 and 2012 was calculated by dividing the population of 5- to 29-year-olds by the total population. The percentage change in the population of 5- to 29-year-olds was calculated by subtracting the population of 5- to 29-year-olds in 2002 from this population in 2012 and dividing by the 2002
population of 5- to 29-year-olds. These calculations were applied in the same way to the 5- to 19-year-old and 20- to 29-year-old age groups. As a percentage of the total population, an age group (e.g., 5- to 29-year-olds) might have declined from 2002 to 2012 even though its size increased. This would occur if there was a higher rate of increase in the total population than in the specific age group
8 INDICATORS PART I: POPULATION AND SCHOOL ENROLLMENT

Indicator 1
Table 1-1. Total population and population ages 5 to 29, 5 to 19, and 20 to 29, by country: 2002 and 2012[In millions]
Age group and year Argentina Australia Brazil Canada China France Germany India Indonesia Italy Japan MexicoRepublic of Korea
Russian Federation
Saudi Arabia
South Africa Turkey
United Kingdom
United States
Total population (all ages)2002 38.0 19.5 179.2 31.6 1,277.6 62.0 82.5 1,040.3 220.3 58.1 127.4 102.5 47.4 145.5 22.3 46.1 69.5 59.6 287.62012 42.2 22.0 199.3 34.3 1,343.2 65.6 81.3 1,205.1 248.6 61.3 127.4 115.0 48.9 142.5 26.5 48.8 79.7 63.0 313.8
Population ages 5 to 292002 16.3 6.8 84.2 10.5 533.3 20.0 22.7 510.6 106.7 16.2 36.7 51.2 18.1 51.7 11.9 23.4 33.4 19.0 100.72012 17.0 7.2 85.0 10.4 477.1 20.0 21.1 554.8 108.2 15.2 31.3 51.8 15.2 43.9 13.2 24.6 34.5 19.6 106.2
Population ages 5 to 192002 10.0 4.0 51.7 6.2 326.9 11.8 13.3 324.6 64.7 8.5 19.4 32.6 10.1 29.9 7.6 15.3 20.7 11.5 61.72012 10.4 4.1 50.7 5.8 252.0 12.0 11.4 348.1 67.4 8.6 17.8 32.1 8.7 20.7 7.7 14.2 20.8 10.9 62.7
Population ages 20 to 292002 6.3 2.8 32.5 4.2 206.4 8.2 9.4 186.0 42.0 7.7 17.2 18.6 8.0 21.8 4.3 8.1 12.8 7.5 38.92012 6.6 3.1 34.3 4.6 225.1 8.0 9.7 206.7 40.8 6.6 13.4 19.7 6.6 23.2 5.5 10.4 13.7 8.7 43.5
NOTE: Detail may not sum to totals because of rounding. SOURCE: U.S. Department of Commerce, U.S. Census Bureau. (2012). International Data Base (IDB), Midyear Population by Five Year Age Groups and Sex, 2002 and 2012.
Table 1-2. Percentage of population ages 5 to 29, 5 to 19, and 20 to 29, by country: 2002 and 2012
Age group and year Argentina Australia Brazil Canada China France Germany India Indonesia Italy Japan MexicoRepublic of Korea
Russian Federation
Saudi Arabia
South Africa Turkey
United Kingdom
United States
Population ages 5 to 292002 43.0 35.0 47.0 33.1 41.7 32.3 27.6 49.1 48.4 27.9 28.8 49.9 38.2 35.5 53.3 50.8 48.1 31.9 35.02012 40.3 32.8 42.6 30.3 35.5 30.5 25.9 46.0 43.5 24.8 24.6 45.0 31.2 30.8 49.8 50.3 43.3 31.1 33.8
Population ages 5 to 192002 26.4 20.5 28.9 19.7 25.6 19.0 16.1 31.2 29.4 14.7 15.3 31.8 21.3 20.6 34.1 33.2 29.7 19.2 21.52012 24.6 18.6 25.4 16.8 18.8 18.3 14.0 28.9 27.1 14.0 14.0 27.9 17.8 14.5 28.9 29.0 26.1 17.4 20.0
Population ages 20 to 292002 16.6 14.5 18.1 13.4 16.2 13.3 11.4 17.9 19.1 13.3 13.5 18.1 17.0 15.0 19.2 17.5 18.4 12.6 13.52012 15.7 14.2 17.2 13.5 16.8 12.2 11.9 17.2 16.4 10.8 10.6 17.1 13.4 16.2 20.9 21.3 17.2 13.7 13.8
NOTE: Detail may not sum to totals because of rounding. SOURCE: U.S. Department of Commerce, U.S. Census Bureau. (2012). International Data Base (IDB), Midyear Population by Five Year Age Groups and Sex, 2002 and 2012.
INDICATORS PART I: POPULATION AND SCHOOL ENROLLMENT 9

Indicator 1
Figure 1-1. Percentage change in population ages 5 to 29, 5 to 19, and 20 to 29, by country: 2002 to 2012
4 3 5 52
10
-1
-8
9 9
-11
-23
2
-3
#
-7
-15
3
9 711
-6
-14 -15
-8
-22
16
-2
-16-19
-31
-14
11
15
-7
29
31
83
-4
15
52
12
1
-2
16
-3
14
-15
6
29
Country
20 to 29 years5 to 19 years5 to 29 years
-40
-30
-20
-10
10
20
Percent change
30
40
0
Argentina Australia Brazil Canada China France Germany India Indonesia Italy Japan Mexico Republicof Korea
RussianFederation
SaudiArabia
SouthAfrica
Turkey UnitedKingdom
UnitedStates
# Rounds to zero. SOURCE: U.S. Department of Commerce, U.S. Census Bureau. (2012). International Data Base (IDB), Midyear Population by Five Year Age Groups and Sex, 2002 and 2012.
10 INDICATORS PART I: POPULATION AND SCHOOL ENROLLMENT

Indicator 2ENROLLMENT IN FORMAL EDUCATION
G-20 Countries Included: Argentina, Australia, Brazil, Canada, China, France, Germany, Indonesia, Italy, Japan,Mexico, Republic of Korea, Russian Federation, Saudi Arabia, South Africa, Turkey, United Kingdom, United States
In 2011, the percentage of 15- to 19-year-olds enrolled in formal education programs ranged from 34 percent in China to 92 percent in Germany.
This indicator describes the percentage of the population enrolled in formal education in the G-20 countries. It focuses on four age groups (3- to 4-year-olds, 5- to 14-year-olds, 15- to 19-year-olds, and 20- to 29-year-olds) and the percentage of the population in these groups enrolled in formal education (generally corresponding to preprimary education, primary and lower secondary education, upper secondary education, and higher education, respectively). It also examines the age ranges at which 90 percent or more of the population is enrolled in formal education in the G-20 countries and the age at which compulsory education ends.
In 2011, almost all 3- to 4-year-old children in France (99 percent) were enrolled in preprimary or primary education programs (table 2-1). In several other G-20 countries (Germany, Italy, and the UnitedKingdom), the enrollment rates of 3- to 4-year-olds also exceeded90 percent. The lowest enrollment rates were in Turkey (12 percent) and Indonesia (17 percent). In the United States, 64 percent of3- to 4-year-olds were enrolled in preprimary or primary education,and it was not until age 6 that at least 90 percent of the population was enrolled in formal education (figure 2-1)
In 2011, the United States and all other reporting G-20 countries had universal or near universal school participation of children ages 5–14 (table 2-1). The lowest enrollment rate for this age group was in the Russian Federation, at 92 percent.
The United States had an enrollment rate of 80 percent in 2011 for youth ages 15–19. In the other G-20 countries reporting data, the percentage of 15- to 19-year-olds enrolled in formal education programs ranged from 34 percent in China to 92 percent in Germany (table 2-1).
The large variation in enrollment among 15- to 19-year-olds may reflect, in part, different policies regarding the age at which compulsory education should end. Compulsory education ends at age 17 in Argentina, Australia, Brazil, the Russian Federation, and the United States; at age 16 in Canada, France, Italy, and the United Kingdom; at age 15 in Indonesia, Japan, Mexico, and South Africa; and at age 14 in the Republic of Korea and Turkey (figure 2-1).6 Saudi Arabia has the lowest age when compulsory education ends (age 11), while Germany has the highest (age 18). Enrollment rates were at 90 percent or higher through the end of compulsory education in Canada, France, Germany, Italy, Japan, the Republic of Korea, and the United Kingdom, but fell below this level in the other G-20 countries reporting data, including the United States.
Enrollment rates for 20- to 29-year-olds were below 30 percent in every G-20 country reporting data, except Australia, Germany, and the Republic of Korea (table 2-1). The U.S. enrollment rate of 27 percent was lower than the rates in Argentina (28 percent), Australia (33 percent), Germany (32 percent), and the Republic of Korea (30 percent), but higher than the rates in the other G-20 countries.
Definitions and Methodologie
“Formal education” is defined as education provided in the system of schools, colleges, universities, and other formal education institutions; it normally constitutes a continuous ladder of full-time education for children and young adults.
The percentage of the population at given ages enrolled in education is called an “enrollment rate.” In this indicator, the term “enrollment rate” refers to the “net enrollment rate” and is defined as the number of students in a particular age group enrolled in education divided by the population of that same age group.
The reference year is 2011 for population and enrollment data in all countries except Argentina and Canada, which have a reference year of 2010. However, because of different reference dates for school enrollment and population data within the
reference year, enrollment rates may exceed 100 percent for some countries and some age groups.
Enrollments include all full-time and part-time students in public and private institutions. Enrollment in preprimary education programs (generally the 3- to 4-year-old age group) includes only children in preschool, nursery, or center-based day-care programs and excludes children in day-care programs operated in homes.
Compulsory education ends at the age at which individuals are no longer legally required to participate in formal education. For example, if compulsory education ends at age 18, it indicates that all students are legally obliged to participate in formal education until they reach that age. Universal enrollment indicates an enrollment rate of over 90 percent.
6 In some countries, the ending age of compulsory education is an average. For example, in the United States the age varies across states, ranging from 16 to 18, but the average age is 17 and the modal age is 18 (Snyder and Dillow 2013, table 197).
INDICATORS PART I: POPULATION AND SCHOOL ENROLLMENT 11

Indicator 2
Table 2-1. Percentage of population ages 3 to 29 enrolled in formal education, by age group and country: 2011
Country
Percentage of students enrolled in formal education
3- to 4-year-olds1 5- to 14-year-olds 15- to 19-year-olds 20- to 29-year-olds
Argentina2 56
100 72 28Australia 40 99 84 33Brazil 47 95 77 21Canada2 24 99 81 25China — — 34 —France 99 99 84 20Germany 93 99 92 32Indonesia 17 94 61 10Italy 94 99 81 21Japan 85 100 — —Mexico 72 100 56 12Republic of Korea 82 99 86 30Russian Federation 73 92 78 22Turkey 12 95 64 21United Kingdom 91 100 78 19United States 64 96 80 27
— Not available. 1 Data show students age 4 and under as a percentage of the population of 3- to 4-year-olds. 2 Reference year is 2010 rather than 2011.NOTE: The reference year is 2011 for population and enrollment data in all countries except Argentina and Canada, which have a reference year of 2010. However, reference dates may differ within that year; thus, the percentages shown in the table are approximations. As described in the source cited below, enrollment rates for some countries were reported as slightly exceeding 100 percent in one or more age groups (e.g., 5- to 14-year-olds) due to different reference dates for school enrollment and population data. Enrollment in formal education at the preprimary education level includes children in preschool, nursery, or center-based programs and excludes children in home-based early childhood education. Data for Saudi Arabia or South Africa are not available.SOURCE: Organization for Economic Cooperation and Development (OECD). (2013a). Education at a Glance 2013: OECD Indicators, table C1.1a. Paris: Author.
12 INDICATORS PART I: POPULATION AND SCHOOL ENROLLMENT

Indicator 2
Figure 2-1. Age range at which more than 90 percent of the population is enrolled in formal education and ending age of compulsory education, by country: 2011
5
1717 17
15 1516
6 65
17 17
34 4 4
3
7
14 14
6
1514
6 6
11
4
7
13
17 17 17
1515151514
161616
1818
1616 16
1716
Country
Age range at which more than 90 percent of population enrolled in formal education
Ending age of compulsory education
0
2
4
6
8
10
12
14
16
18
20
Age
Argentina1 Australia Brazil Canada1,2 France Germany Indonesia Italy Japan Mexico Republicof Korea
RussianFederation
SaudiArabia3
SouthAfrica3
Turkey UnitedKingdom
United States4
1 Reference year is 2010 rather than 2011.2 Canada reports an ending age of compulsory education of 16 in 2011. This age, however, differs across Canada due to responsibilities and oversight for education taking place at the regional or local level.3 Data for Saudi Arabia and South Africa are not available for the age range at which more than 90 percent of the population is enrolled.4 The average ending age of compulsory education in the United States is 17. This age varies across states, ranging from 16 to 18; the modal age is 18 [Snyder, T.D., and Dillow, S.A. (2011). Digest of Education Statistics 2011 (NCES 2012-001), table 175. National Center for Education Statistics, Institute of Education Sciences, U.S. Department of Education].NOTE: Enrollment in formal education at the preprimary education level includes children who attended preschool, nursery, or center-based programs and excludes children in home-based early childhood education. The ending age of compulsory education is the age at which individuals are no longer required to participate in formal education. For example, an ending age of 18 indicates that all students under 18 are legally obliged to participate in formal education. Data are not available for China.SOURCE: Organization for Economic Cooperation and Development (OECD). (2013a). Education at a Glance 2013: OECD Indicators, table C1.1a. Paris: Author.
INDICATORS PART I: POPULATION AND SCHOOL ENROLLMENT 13

Indicator 3TRENDS IN ENROLLMENT IN FORMAL EDUCATION
G-20 Countries Included: Argentina, Australia, Brazil, Canada, China, France, Germany, Indonesia, Italy, Japan, Mexico, Republic of Korea, Russian Federation, Turkey, United Kingdom, United States
The United Kingdom was the only reporting G-20 country to show a decrease between 2001 and 2011 in the enrollment rate for 20- to 29-year-olds—the age group that corresponds most closely to the typical ages of enrollment in higher education.
This indicator describes changes in the percentage of the population enrolled in formal education between 2001 and 2011. Like Indicator 2, it focuses on the four age groups—3- to 4-year-olds, 5- to 14-year-olds, 15- to 19-year-olds, and 20- to 29-year-olds—that generally correspond to the ages of the children and adults enrolled in preprimary education, primary and lower secondary education, upper secondary education, and higher education, respectively.
In all G-20 countries reporting data except France and Italy (where rates were already over 90 percent), the percentage of 3- to 4-year-old children enrolled in preprimary or primary education programs increased from 2001 to 2011 (table 3-1). The largest increase (from 18 to 82 percent) occurred in the Republic of Korea. In the United States, the enrollment rate of 3- to 4-year-olds increased from 47 percent in 2001 to 64 percent in 2011.
There were fewer changes in the percentage of 5- to 14-year-olds enrolled in formal education, mainly because of the strong correspondence in many systems between this age group
and the ages covered by compulsory education, resulting in high rates of enrollment. For example, in both 2001 and 2011, Argentina, Australia, France, Germany, Italy, Japan, and the United Kingdom had at least 99 percent school participation of children ages 5–14. The United States had 100 percent school participation of children ages 5–14 in 2001 and 96 percent in 2011.
For youth ages 15–19, enrollment in formal education programs showed little change from 2001 to 2011, with increases of only 2 percentage points in Brazil (from 75 to 77 percent) and Germany (from 90 to 92 percent) and a decrease of 2 percentage points in France (from 86 to 84 percent). The biggest increase in the enrollment rate of 15- to 19-year-olds from 2001 to 2011 was in Turkey (from 30 to 64 percent), followed by increases in Indonesia (from 45 to 61 percent) and Mexico (from 42 to 56 percent).
Comparing 2001 and 2011, the United Kingdom was the only reporting G-20 country to show a decrease between 2001 and 2011 in the enrollment rate for 20- to 29-year-olds—the age group that corresponds most closely to the typical ages of enrollment in higher education. In the United Kingdom, the enrollment rate decreased from 23 to 19 percent. The biggest change in enrollment rates among 20- to 29-year-olds was an increase in Turkey, from 5 to 21 percent. In the United States, the enrollment rate increased from 23 to 27 percent.
Definitions and Methodologie
“Formal education” is defined as education provided in the system of schools, colleges, universities, and other formal education institutions; it normally constitutes a continuous ladder of full- time education for children and young adults.
“Higher education” is used synonymously with “tertiary edu- cation,” which includes “tertiary type A” programs (ISCED97 5A), which are largely theoretically based and designed to provide qualifications for entry into advanced research programs and professions with high skill requirements; “tertiary type B” programs (ISCED97 5B), which are more occupationally oriented and lead to direct labor market access; and advanced research programs (ISCED97 6), which lead directly to the award of an advanced research qualification (e.g., a Ph.D.). For more information on the ISCED97 levels, see appendix A.
The percentage of the population at given ages enrolled in education is called an “enrollment rate.” In this indicator, the term “enrollment rate” refers to the “net enrollment rate” and is definedas the number of students in a particular age group enrolled in education divided by the population of that same age group.
The reference years are 2001 and 2011 for population and enroll-ment data in all countries except Argentina and Canada, where the reference years are 2001 and 2010. However, because of different reference dates for school enrollment and population data within the reference year, enrollment rates may exceed 100 percent for some countries and some age groups.
Enrollments include all full-time and part-time students in public and private institutions. Enrollment in preprimary education programs (generally the 3- to 4-year-old age group) includes only children in preschool, nursery, or center-based day-care programs and excludes children in day-care programs operated in homes.
Percentage-point differences presented in the text were computed from unrounded numbers; therefore, they may differ from computations made using the rounded whole numbers that appear in table 3-1.
14 INDICATORS PART I: POPULATION AND SCHOOL ENROLLMENT

Indicator 3
Table 3-1. Percentage of population ages 3 to 29 enrolled in formal education, by age group and country: 2001 and 2011
Country Year
Percentage of students enrolled in formal education
3- to 4-year-olds1 5- to 14-year-olds 15- to 19-year-olds 20- to 29-year-olds
Argentina 2001 39 100 66 23 20102 56 100 72 28
Australia 2001 38 100 81 28 2011 40 99 84 33
Brazil 2001 25 90 75 21 2011 47 95 77 21
Canada 2001 21 97 75 21 20102 24 99 81 25
China 2001 # 82 — — 2011 — — 34 —
France 2001 100 100 86 20 2011 99 99 84 20
Germany 2001 70 100 90 24 2011 93 99 92 32
Indonesia 2001 # 86 45 3 2011 17 94 61 10
Italy 2001 99 99 73 17 2011 94 99 81 21
Japan 2001 77 100 — — 2011 85 100 — —
Mexico 2001 35 95 42 9 2011 72 100 56 12
Republic of Korea 2001 18 93 79 25 2011 82 99 86 30
Russian Federation 2001 — 83 71 15 2011 73 92 78 22
Turkey 2001 # 84 30 5 2011 12 95 64 21
United Kingdom 2001 81 99 75 23 2011 91 100 78 19
United States 2001 47 100 78 23 2011 64 96 80 27
— Not available.# Rounds to zero.1 Data show students age 4 and under as a percentage of the population of 3- to 4-year-olds.2 Reference year is 2010 rather than 2011.NOTE: Reference dates may differ within the given years; thus, percentages shown in the table are approximations. As described in the source cited below, enrollment rates for some countries were reported as slightly exceeding 100 percent in one or more age groups (e.g., 5- to 14-year-olds) due to different reference dates for school enrollment and population data. Enrollment in formal education at the preprimary education level includes children in preschool, nursery, and center-based programs and excludes children in home-based early childhood education. SOURCE: Organization for Economic Cooperation and Development (OECD). (2003). Education at a Glance 2003: OECD Indicators, table C1.2. Paris: Author; and OECD. (2013a). Education at a Glance 2013: OECD Indicators, table C1.1a. Paris: Author.
INDICATORS PART I: POPULATION AND SCHOOL ENROLLMENT 15

Indicator 4
INTERNATIONAL AND FOREIGN STUDENTS IN HIGHER EDUCATION
G-20 Countries Included: Australia, Brazil, Canada, China, France, Germany, Indonesia, Italy, Japan, Republic of Korea, Russian Federation, Saudi Arabia, South Africa, Turkey, United Kingdom, United States
International students made up a smaller percentage of enrollment in higher education in the United States (3 percent) than in every other G-20 country with data, including Australia(20 percent), the United Kingdom (17 percent), Canada (7 percent), and Japan (4 percent).
This indicator presents the prevalence of international and foreign students studying in higher education in the G-20 countries in 2011, including students in academic programs below the doctoral level and at the doctoral level. International students refer to students who have left their country of origin (i.e., where they obtained their prior education credential) for the purpose of studying; six G-20 countries report data for these students. Foreign students refer to students who are not citizens of the countries in which they are enrolled, but may be long-term residents or may have been born in that country; 10 G-20 countries report data for these students. Both types of data provide information on the internationalization of higher education; however, the former measure may provide a more accurate measure of student mobility.
In higher education overall, the United States had the smallest percentage of international students (3 percent) of the five G-20 countries with data, including Australia (20 percent), the United Kingdom (17 percent), Canada (7 percent), and Japan (4 percent) (Germany did not report data at the overall level) (figure 4-1). However, while the relatively small U.S. percentage suggests that the impact of international students on the overall education system is low, the absolute number of international students in the United States is larger than in any other G-20 country reporting data (OECD 2013, web table C4.7).
International students made up a smaller percentage of enrollment in academic higher education below the doctoral level than at the doctoral level in every reporting G-20 country except Germany. (Australia had the largest percentage of international students enrolled below the doctoral level, at 21 percent.) At the doctoral level, international students made up more than 20 percent of enrollment in four of the six G-20 countries reporting data: the United Kingdom (41 percent), Australia (31 percent), the United States (28 percent), and Canada (22 percent). Japan followed closely, with international students making up 18 percent of enrollment at the doctoral level. In Germany, international students made up only 6 percent of enrollment at the doctoral level.
In higher education overall, foreign students made up less than 5 percent of total enrollment in 8 of the 10 G-20 countries reporting this measure (figure 4-2). In South Africa and France, foreign students made up 7 percent and 12 percent, respectively, of the total enrollment in higher education.
Similar to the data reported for international students, all seven countries that reported data for foreign students at all levels had smaller percentages of enrollment in academic higher education below the doctoral level than at the doctoral level, except Indonesia (where enrollment rounded to zero at both levels). Below the doctoral level, foreign students made up the largest percentage of enrollment in France, at 13 percent, while they made up less than 4 percent of enrollment in the rest of the G-20 countries reporting data. At the doctoral level, foreign students made up 42 percent of enrollment in France, followed by 11 percent in Italy and 8 percent in the Republic of Korea. In Turkey, Brazil, China, and Indonesia, foreign students made up less than 4 percent of enrollment at the doctoral level.
Definitions and Methodologie
“Higher education” is used synonymously with “tertiary education,” which includes “tertiary type A” programs (ISCED97 5A), which are largely theoretically based and designed to provide qualificationsfor entry into advanced research programs and professions with high skill requirements; “tertiary type B” programs (ISCED97 5B), which are more occupationally oriented and lead to direct labor market access; and advanced research programs (ISCED97 6), which lead directly to the award of an advanced research qualification(e.g., a Ph.D.). “Academic higher education below the doctoral level” is synonymous with “tertiary type A” (ISCED97 5A).“ Academic education at the doctoral level” includes ISCED97 6. For more information on the ISCED97 levels, see appendix A.
International students refer to students who have left their country of origin (i.e., where they obtained their prior education) for the purpose of studying. Foreign students refer to students who are not citizens of the countries in which they are enrolled, but may be long-term residents or may have been born in that country. As described in the accompanying figures, education levels are defined according to the 1997 International Standard Classification of Education (ISCED97). For more information on the ISCED97 levels, see appendix A.
16 INDICATORS PART I: POPULATION AND SCHOOL ENROLLMENT

Indicator 4
Figure 4-1. Percentage of students enrolled in higher education who are international students, by higher education program and country: 2011
0
20
40
60
80
100
Percent
Doctoral level4Higher education total2
Country
Academic programs below the doctoral level3
20
Australia Canada1 Japan United Kingdom United StatesGermany
21
31
7 7
22
8 6 4 3
18 17 18
41
28
33
— Not available. 1 Reference year is 2010 rather than 2011.2 Includes ISCED97 levels 5A (academic higher education below the doctoral level), 5B (vocational higher education), and 6 (doctoral level of academic higher education).3 Includes ISCED97 level 5A (academic higher education below the doctoral level).4 Includes ISCED97 level 6 (doctoral level of academic higher education).NOTE: The term “international students” refers to students who have moved from their country of origin for the purpose of studying. Countries of origin include 31 OECD countries, 176 non-OECD countries, and some nonspecified countries. Education levels are defined according to the 1997 International Standard Classification of Education (ISCED97). For more information on the ISCED97 levels, see appendix A in this report. This figure includes the 6 countries that collect data on international students; the other 10 countries in this indicator collect data on foreign students as in figure 4-2.SOURCE: Organization for Economic Cooperation and Development (OECD). (2013a). Education at a Glance 2013: OECD Indicators, table C4.1. Paris: Author.
INDICATORS PART I: POPULATION AND SCHOOL ENROLLMENT 17

Indicator 4
Figure 4-2. Percentage of students enrolled in higher education who are foreign students, by higher education program and country: 2011
0
20
40
60
80
100
Percent
Brazil China France Italy Republic ofKorea
Saudi Arabia
South Africa1
Turkey
Doctoral level6Higher education total4 Academic programs below the doctoral level5
2 1
12 13
42
4 411
2 28
2 2 37
1 1 3
Russian Federation2,3
Indonesia1
# # #####
Country
# Rounds to zero.— Not available. 1 Reference year is 2010 rather than 2011.2 Excludes private institutions.3 Data for Russian Federation for the doctoral level are not available.4 Includes ISCED97 levels 5A (academic higher education below the doctoral level), 5B (vocational higher education), and 6 (doctoral level of academic higher education).5 Includes ISCED97 level 5A (academic higher education below the doctoral level).6 Includes ISCED97 level 6 (doctoral level of academic higher education).NOTE: The term “foreign students” refers to students who are not citizens of the countries in which they are enrolled, but may be long-term residents or may have been born in that country. Countries of origin include 31 OECD countries, 176 non-OECD countries, and some nonspecified countries. Education levels are defined according to the 1997 International Standard Classification of Education (ISCED97). For more information on the ISCED97 levels, see appendix A in this report. This figure includes the 10 countries that collect data on foreign students; the other 6 countries in this indicator collect data on international students as in figure 4-1.SOURCE: Organization for Economic Cooperation and Development (OECD). (2013a). Education at a Glance 2013: OECD Indicators, table C4.1. Paris: Author; and OECD (2012). Education at a Glance 2012: OECD Indicators , table C4.1. Paris: Author.
18 INDICATORS PART I: POPULATION AND SCHOOL ENROLLMENT

INDICATORS PART IIINDICATORS PART IIAcademic Performance
Together, the indicators in the academic performance section provide an overview of academic performance in 2011 or 2012 (indicators 5–8) in key content areas, a more detailed look at academic performance in particular aspects of those content areas (indicators 9–11), and an examination of changes over time in mean student performance (indicators 12–14).
• Indicators 5–7 describe the distribution of students across performance levels corresponding to international bench-marks in reading, mathematics, and science at the fourth and eighth grades and at 15 years of age.
• Indicator 8 describes the distribution of adults across levels of proficiency in literacy, numeracy, and problem solving in technology-rich environments. This is the first indicator in the G-8/G-20 series to use data from the new OECD assessment of adults.
• Indicators 9–11 examine the mean performance of students on reading, mathematics, and science subscales at the fourth and eighth grades and at 15 years of age. These indicators
show relative strengths and weaknesses in subcontent areas within countries and differences in those strengths and weaknesses across countries.
• Indicators 12–14 present changes in countries’ mean scores in reading, mathematics, and science over time and across grades and ages.
The indicators in this section draw on data from the Progress in International Reading Literacy Study (PIRLS), which assesses reading literacy in the fourth grade every 5 years; the Trends in International Mathematics and Science Study (TIMSS), which assesses mathematics and science achievement in the fourth and eighth grades every 4 years; the Program for International Student Assessment (PISA), which assesses 15-year-old students in reading, mathematics, and science literacy every 3 years; and the Program for the International Assessment of Adult Competencies (PIAAC), which assesses literacy, numeracy, and problem solving in technology-rich environments.

Indicator
20 INDICATORS PART II: ACADEMIC PERFORMANCE
5READING, MATHEMATICS, AND SCIENCE PERFORMANCE OF FOURTH-GRADE STUDENTS
G-20 Countries Included: Australia, Canada, France, Germany, Indonesia, Italy, Japan, Republic of Korea, Russian Federation, Saudi Arabia, Turkey, United Kingdom (England and Northern Ireland), United States
At the high-performing end of the PIRLS 2011 reading literacy scale, 19 percent of fourth-grade students in the United Kingdom (Northern Ireland) and the Russian Federation, 18 percent in the United Kingdom (England), and 17 percent in the United States scored at or above the Advanced interna-tional benchmark.
Indicator 5 draws on data from PIRLS 2011 and TIMSS 2011 to describe fourth-grade students’ performance in reading, math-ematics, and science in terms of four international achievement benchmarks (Low, Intermediate, High, and Advanced), which were established to describe the knowledge and skills that students display at different points on a performance scale (described in “Definitions and Methodology” below). For each subject, the indicator first describes the percentage of students reaching at least the Intermediate level of performance. Next, the indicator describes the percentage of students reaching the highest international benchmark (Advanced), followed by the percentage reaching only the Low benchmark.
In reading in 2011, at least three-quarters of fourth-grade students in 9 out of 11 G-20 countries scored at least at the Intermediate international benchmark (that is, at Intermediate, High, or Advanced), including 86 percent of U.S. students (figure 5-1). At the high-performing end of the scale, 19 percent of fourth-grade students in the United Kingdom (Northern Ireland) and the Russian Federation, 18 percent in the United Kingdom (England), and 17 percent in the United States reached the Advanced international benchmark. Seven countries had smaller percentages of students reaching the advanced level than the United States, ranging from less than 1 percent in Indonesia to 13 percent in Canada. At the opposite end of the scale, the United States had among the smallest percentages of students reaching only the Low international benchmark (11 percent), with only the Russian Federation having a smaller percentage (7 percent) and the percentages in the remaining countries ranging from 10 to 38 percent. In Indonesia and Saudi Arabia, over one-third of the students did not reach the Low international benchmark.
In mathematics in 2011, at least three-quarters of fourth-grade students in 7 out of 11 G-20 countries reached the Intermedi-ate international benchmark or higher, including 81 percent of U.S. students (figure 5-1). At the Advanced benchmark, the Republic of Korea and Japan stand out, with 39 and 30 percent of students, respectively, at this level. In addition to these two countries, the United Kingdom (Northern Ireland) (24 percent) and the United Kingdom (England) (18 percent) had higher percentages at the Advanced benchmark than the United States (13 percent). The Russian Federation also had 13 percent, and five countries had lower percentages. At the Low benchmark, Japan, the Republic of Korea, and the United Kingdom (Northern Ireland) had lower percentages of students—all at 11 percent or less—than the United States (15 percent). The U.S. percentage was similar to those in the Russian Federation (15 percent), the United Kingdom (England) (16 percent), and Germany (17 percent). Four countries had higher percentages than the United States, ranging from 20 percent in Australia to 31 percent in Saudi Arabia. Forty-five percent of students in Saudi Arabia did not reach the Low international benchmark.
In science in 2011, three-quarters or more of fourth-grade students in 7 out of 11 G-20 countries reached at least the Intermediate international benchmark, including 81 percent of U.S. students (figure 5-1). At the Advanced international bench-mark, the Republic of Korea had the largest percentage of students (29 percent). The United States had 15 percent of students at this level, similar to the Russian Federation (16 percent) and Japan (14 percent) and ahead of seven countries, in which the percentages ranged from 3 percent in Saudi Arabia and Turkey to 11 percent in the United Kingdom (England). At the Low international bench-mark, the Republic of Korea and Japan had the lowest percentage of students (under 10 percent each). Fourteen percent of students in the United States reached only this benchmark, similar to the Russian Federation (12 percent) and ahead of the remaining countries, in which the percentages ranged from 18 percent in Germany and the United Kingdom (England) to 28 percent in Turkey and Saudi Arabia. Thirty-seven percent of students in Saudi Arabia did not reach the Low international benchmark.
Definitions and Methodolog
In PIRLS 2011 and TIMSS 2011 at the fourth grade, countries were required to sample students in the grade that corresponded to the end of 4 years of formal schooling, providing that the mean age at the time of testing was at least 9.5 years. As defined by PIRLS and TIMSS, the first year of formal schooling begins with the first year of primary school (ISCED97 level 1), which should mark the beginning of formal instruction in reading, writing, and mathematics. (Note that kindergarten is not counted.) For most countries, the target grade was fourth grade or its national equivalent.
PIRLS and TIMSS scores are reported on a scale from 0 to 1,000, with the scale average fixed at 500 and the standard deviation fixed at 100. Since both the PIRLS and TIMSS achievement scales
were designed to reliably measure student achievement over time, the metric of the scales was established originally in 2001 for PIRLS and 1995 for TIMSS, the first year in which each assessment was administered.
In order to describe concretely the knowledge and skills displayed along the performance scales, PIRLS and TIMSS established four international achievement benchmarks (Low, Intermediate, High, and Advanced). Information about the rationale underlying the benchmarks and the procedures used to set the cutpoints is available in Methods and Procedures in TIMSS and PIRLS 2011 (Martin and Mullis 2013). Four points on the scales were identified for use as international benchmarks: 400 for

Indicator
INDICATORS PART II: ACADEMIC PERFORMANCE 21
5
the Low benchmark, 475 for the Intermediate benchmark, 550 for the High benchmark, and 625 for the Advanced benchmark. These were selected to represent the range of performance shown by students internationally.
Fourth-grade students at the Low benchmark display basic reading skills, such as retrieving explicitly stated details from literary and informational texts. Students at the Intermediate benchmark demonstrate some reading proficiency. They can identify central events, plot sequences, and relevant story details and make some inferences and connections across parts of the text. At the High benchmark, students are competent readers who can recognize some textual features, such as figurative language and abstract messages. They can make inferences on the basis of abstract or embedded information and integrate information to recognize main ideas and provide explanations. Students at the Advanced benchmark demonstrate the highest level of reading proficienc . They can interpret figurative language, distinguish and interpret complex information from different parts of text, and integrate ideas across text to provide interpretations about characters’ intentions and feelings.
At the fourth-grade level in mathematics, students at the Low benchmark have some basic mathematical knowledge, such as an understanding of whole numbers and the properties of basic geometric shapes. At the Intermediate benchmark, students can apply basic mathematical knowledge in straightforward situations, such as performing operations with 3- and 4-digit numbers and decimals and extending simple patterns. At the High benchmark, students can apply their knowledge and understanding
to solve multistep word problems involving addition, multipli-cation, and division and problems requiring the use of data in tables and graphs. Students at the Advanced benchmark can apply their understanding and knowledge in a wide variety of relatively complex situations to solve problems involving fractions, decimals, proportions, area, and rotation.
At the fourth-grade level in science, students at the Low bench- mark have some elementary knowledge of the Earth, life, and physical sciences, such as simple facts about human health, ecosystems, and the behavioral and physical characteristics of animals. At the Intermediate benchmark, students can apply basic knowledge and understanding to practical situations in the sciences, such as knowing some basic information related to the characteristics of living things, their reproduction and life cycles, and their interaction with the environment. At the High benchmark, students can apply knowledge and understanding to explain everyday phenomena, such as demonstrating some knowledge of life processes, the solar system, and properties of matter. Students at the Advanced benchmark can apply know-ledge and understanding in beginning scientific inquiry, such as demonstrating understanding of the properties of light and relationships among physical properties of materials.
In each of the assessments, there may be students who do not reach the Low benchmark, indicating that their abilities could not be described based on their responses. These students are indicated by the percentages for Below Low in the figures and are referred to as those not reaching the Low benchmark in the text.

22 INDICATORS PART II: ACADEMIC PERFORMANCE
Indicator
5
Figure 5-1. Percentage distribution of fourth-grade students across international benchmarks in reading, mathematics, and science, by country: 2011
IntermediateLowBelow low AdvancedHigh
Canada France Germany Italy RussianFederation
U.K.(England)
UnitedStates
0
20
40
60
80
100
Australia Indonesia SaudiArabia
U.K.(N. Ireland)
13
2934
38
35
31
3939
41
2013 10 11
26
1910
18 19 17
2929 30
137
10
23
35
12
10 13
34
17
7
32 36
44
7
383936
3729
38
2 5 2 1 5 3 2
145
2
#Percent Reading
0
20
40
60
80
100
Percent Mathematics
Germany Italy Japan RussianFederation
U.K.(England)
UnitedStates
Australia Republic ofKorea
SaudiArabia
U.K.(N. Ireland)
43
17
10 5
35
20
10
25 32
315
31
17
35
40
24
13
2345
3039
34
41
24
7 3
5
1
1611 15
18 2413
28
2634
34
3531
23
26
30
17
#
4
7 4 4
41
2
Turkey
6 3
17
5
0
20
40
60
80
100
Percent
Germany Italy Japan RussianFederation
U.K.(England)
UnitedStates
Australia Republic ofKorea
SaudiArabia
U.K.(N. Ireland)
Country
Turkey
Science
39
18
7 7
36
20
9
28 32
39
19
29
8
12
28
23
34
16
3337
1429
3643
5
18
11
33
31
24
28
30
15
7
44
8
22
2014
515
41
32
35
28
4 21 1
3
4
3
4
10
6
# Rounds to zero.NOTE: PIRLS and TIMSS scores are reported on a scale from 0 to 1,000, with the scale average fixed at 500 and the standard deviation fixed at 100. Four points on the scale were identified for use as international benchmarks: 400 for the Low benchmark, 475 for the Intermediate benchmark, 550 for the High benchmark, and 625 for the Advanced benchmark. Below low indicates the percentage of students not reaching the Low international benchmark. Japan, the Republic of Korea, and Turkey did not participate in PIRLS 2011; Canada, France, and Indonesia did not participate in TIMSS 2011 at the fourth grade. Detail may not sum to totals due to rounding.SOURCE: International Association for the Evaluation of Educational Achievement (IEA), Progress in International Reading Literacy Study (PIRLS), 2011; and Trends in International Mathematics and Science Study (TIMSS), 2011.

Indicator
INDICATORS PART II: ACADEMIC PERFORMANCE 23
6MATHEMATICS AND SCIENCE PERFORMANCE OF EIGHTH-GRADE STUDENTS
G-20 Countries Included: Australia, Indonesia, Italy, Japan, Republic of Korea, Russian Federation, Saudi Arabia, Turkey, United Kingdom (England), United States
Nearly half (47 percent) of eighth-graders in the Republic of Korea reached the Advanced international benchmark in mathematics, compared with 7 percent in the United States.
This indicator draws on data from TIMSS 2011 to describe eighth-grade students’ performance in mathematics and science in terms of four international achievement benchmarks (Low, Intermediate, High, and Advanced), which were established to describe the knowledge and skills that students display at differ-ent points on a performance scale (described in “Definitions and Methodology” below). For each subject, the indicator first describes the percentage of students reaching at least the Intermediate level of performance. Next, the indicator describes the percentage of students reaching the highest international benchmark (Advanced), followed by the percentage reaching only the Low benchmark.
In mathematics in 2011, three-quarters or more of eighth-grade students in 3 out of 10 G-20 countries reached the Intermediate international benchmark or higher (that is, at Intermediate, High, or Advanced); these countries were Japan, the Republic of Korea, and the Russian Federation (figure 6-1). However, only 68 percent of U.S. students reached this level of performance. At the Advanced benchmark, the Republic of Korea and Japan stand out, with 47 and 27 percent of students, respectively, reaching this level. In addition to these two countries, the Russian Federation (14 percent), Australia (9 percent), and the United Kingdom (England) (8 percent) had higher percentages at the Advanced benchmark than the United States (7 percent). Turkey had the same percentage at this level as the United States, and three countries had a smaller percentage (3 percent or less). The Republic of Korea was the only country in which less than 10 percent of students reached only the Low international benchmark. In addition to Korea, Japan (10 percent), the Russian
Federation (16 percent), and the United Kingdom (England) (23 percent) had lower percentages of students at the Low benchmark than the United States (24 percent). The remaining five countries had higher percentages at the Low benchmark, ranging from 26 percent in Australia, Italy, and Turkey to 28 percent in Indonesia. One-third of the students in Turkey and over half of the students in Saudi Arabia and Indonesia did not reach the Low international benchmark.
In science in 2011, at least three-quarters of eighth-grade students in 4 out of 10 G-20 countries reached the Intermediate international benchmark or higher; these countries were Japan, the Republic of Korea, the Russian Federation, and the United Kingdom (England) (figure 6-1). In the United States, 73 percent of students reached this level of performance. At the Advanced benchmark, the Republic of Korea, Japan, the Russian Federation, and the United Kingdom (England) had larger percentages of eighth-grade students (20, 18, 14, and 14 percent, respectively) than the United States (10 percent). The U.S. percentage was not measurably different from the percentages in Australia (11 percent) and Turkey (8 percent), but was larger than those in Italy (4 percent) and Saudi Arabia and Indonesia (1 percent or less). Japan and the Republic of Korea each had 11 percent of students reaching only the Low international benchmark. In addition to these countries, the Russian Federation (15 percent) had a lower percentage of students at the Low benchmark than the United States (19 percent). The U.S. percentage was not measurably different from the percentages in the United Kingdom (England) (17 percent) and Australia (22 percent), but was lower than those in Italy and Turkey (25 percent each) and Indonesia and Saudi Arabia (34 percent each). Almost half of the students in Indonesia and one-third of the students in Saudi Arabia did not reach the Low international benchmark.
Definitions and Methodolog
In TIMSS 2011 at the eighth grade, countries were required to sample students in the grade that corresponded to the end of 8 years of formal schooling, providing that the mean age at the time of testing was at least 13.5 years. As defined by TIMSS, the first year of formal schooling begins with the first year of primary school (ISCED97 level 1), which should mark the beginning of formal instruction in reading, writing, and mathematics. (Note that kindergarten is not counted.) For most countries, the target grade was eighth grade or its national equivalent.
TIMSS scores are reported on a scale from 0 to 1,000, with the scale average fixed at 500 and the standard deviation fixed at 100. Since the TIMSS achievement scales were designed to reliably measure student achievement over time, the metric of the scales was established originally in 1995, the first year in which the assessment was administered.
In order to describe concretely the knowledge and skills displayed along the performance scales, TIMSS established four international achievement benchmarks (Low, Intermediate, High, and Advanced). Information about the rationale underlying the benchmarks and the procedures used to set the cutpoints is available in Methods and Procedures in TIMSS and PIRLS 2011 (Martin and Mullis 2013). Four points on the scales were identi- fied for use as international benchmarks: 400 for the Low benchmark, 475 for the Intermediate benchmark, 550 for the High benchmark, and 625 for the Advanced benchmark. These were selected to represent the range of performance shown by students internationally.
At the eighth-grade level in mathematics, students at the Low benchmark have some basic mathematical knowledge, such as an understanding of whole numbers and decimals, operations,

Indicator
24 INDICATORS PART II: ACADEMIC PERFORMANCE
6
and basic graphs. At the Intermediate benchmark, students can apply basic mathematical knowledge in straightforward situations, such as understanding simple algebraic relationships. At the High benchmark, students can apply their knowledge and understanding in a variety of relatively complex situations, such as showing basic procedural knowledge related to algebraic expressions. Students at the Advanced benchmark can reason with information, draw conclusions, make generalizations, and solve linear equations.
At the eighth-grade level in science, students at the Low bench-mark can recognize some basic facts from the life and physical sciences, such as having some knowledge of the human body and demonstrating some familiarity with physical phenomenon. At the Intermediate benchmark, students recognize and apply their understanding of basic scientific knowledge in various contexts, such as applying their knowledge of human health, life cycles,
adaptation, and heredity, and analyze information about ecosystems. At the High benchmark, students demonstrate an understanding of concepts related to science cycles, systems, and principles, such as aspects of human biology and of the characteristics, classification, and life processes of organ-isms. Students at the Advanced benchmark communicate an understanding of complex and abstract concepts in biology, chemistry, physics, and Earth science, such as demonstrating some conceptual knowledge about cells and the characteristics, classification, and life processes of organisms.
Additionally, there may be students who do not reach the Low benchmark, indicating that their abilities could not be described based on their responses. These students are indicated by the percentages for Below Low in the figures and referred to as not reaching the Low benchmark in the text.

Indicator
INDICATORS PART II: ACADEMIC PERFORMANCE 25
6
Figure 6-1. Percentage distribution of eighth-grade students across international benchmarks in mathematics and science, by country: 2011
Indonesia Italy Japan RussianFederation
U.K.(England)
UnitedStates
Australia Republic ofKorea
SaudiArabia
Turkey0
20
40
60
80
100
Percent Mathematics
12
57
9
34
26
11
20
39
26
21
10 3
26
27
1016
30
47
6
32
16
32
14
5
15
27
5
53
20
26
13
7
33
33
23
24
8
12
37
24
24
7
81
2 3
28
#
34
1
Percent Science
0
20
40
60
80
100
Indonesia Italy Japan RussianFederation
U.K.(England)
UnitedStates
Australia Republic ofKorea
SaudiArabia
Country
Turkey
IntermediateLowBelow low AdvancedHigh
11
35
22
8
25
2
3
4 1
43
17
34
46
38
25
10
2318
29
11
39
20
29
11
37
14
33
15
34
34
32
7
25
14
31
19
7
31
8
27
25
21
18
10
33
7
30
17
#
# Rounds to zero.NOTE: TIMSS scores are reported on a scale from 0 to 1,000, with the scale average fixed at 500 and the standard deviation fixed at 100. Four points on the scale were identified for use as international benchmarks: 400 for the Low benchmark, 475 for the Intermediate benchmark, 550 for the High benchmark, and 625 for the Advanced benchmark. Below low indicates the percentage of students not reaching the Low international benchmark. Detail may not sum to totals due to rounding.SOURCE: International Association for the Evaluation of Educational Achievement (IEA), Trends in International Mathematics and Science Study (TIMSS), 2011.

Indicator 7READING, MATHEMATICS, AND SCIENCE LITERACY PERFORMANCE OF 15-YEAR-OLD STUDENTS
G-20 Countries Included: Argentina, Australia, Brazil, Canada, France, Germany, Indonesia, Italy, Japan, Mexico, Republic of Korea, Russian Federation, Turkey, United Kingdom, United States
In reading literacy among 15-year-olds, the United States had larger percentages of high performers and smaller percentages of low performers than 9 of the 14 other participating G-20 countries, but Australia, Canada, France, Japan, and the Republic of Korea each had larger percentages of high performers and smaller percentages of low performers than the United States.
Indicator 7 draws on data from PISA 2012 to describe 15-year-old students’ performance in reading, mathematics, and science literacy. Similar to other indicators in this section, it examines the percentages of students reaching different levels of proficiencyon a performance scale. In PISA, the proficiency levels range from below level 1 to level 6 in all three subjects. For each subject, the indicator focuses on the percentages of students at the high and low ends of the scale (that is, those at level 5 or 6 and those at level 1 or below, respectively).
In 2012, the percentage of students reaching the high end of the performance scale in reading literacy (i.e., at level 5 or 6) in the participating G-20 countries ranged from 1 percent or less in Argentina, Brazil, Indonesia, and Mexico to 18 percent in Japan. In the United States, 8 percent of students reached level 5 or 6. The percentage of students at the low end of the performance scale (i.e., at level 1 or below) ranged from 8 percent in the Republic of Korea to 55 percent in Indonesia; it was 17 percent in the United States. The United States had larger percentages of high performers and smaller percentages of low performers than 6 of the 14 other participating G-20 countries, but Australia, Canada, Japan, and the Republic of Korea each had larger percentages of high performers and smaller percentages of low performers than
the United States. There were no measurable differences in the percentages of high or low performing students between the United States and the remaining 4 countries.
In mathematics literacy, the percentage of students at the high end of the performance scale ranged from 1 percent or less in Argentina, Brazil, Indonesia, and Mexico to 31 percent in the Republic of Korea. In the United States, 9 percent of students reached level 5 or 6, which was not measurably different from two participating G-20 countries, higher than in five countries, and lower than in Australia, Canada, France, Germany, Japan, the Republic of Korea, and the United Kingdom. The percentage of students at the low end of the performance scale ranged from 9 percent in the Republic of Korea to 76 percent in Indonesia. All but four of the participating G-20 countries (Canada, Germany, Japan, and the Republic of Korea) had higher percentages of students at level 1 or below than at level 5 or 6. The percentage of U.S. students at level 1 or below was 26 percent, which was higher than in all but 5 of the 14 other participating G-20 countries.
In science literacy, the percentage of students at the high end of the performance scale ranged from less than 1 percent in Argentina, Brazil, Indonesia, and Mexico to 18 percent in Japan. In the United States, 7 percent of 15-year-olds reached level 5 or 6, which was not measurably different from two participating G-20 countries, higher than in six countries, and lower than in Australia, Canada, Germany, Japan, the Republic of Korea, and the United Kingdom. The percentage of students at the low end of the performance scale ranged from 7 percent in the Republic of Korea to 67 percent in Indonesia. The percentage of U.S. students at level 1 or below was 18 percent, which was lower than in all but 6 of the 14 other participating G-20 countries.
Definitions and Methodolog
In PISA 2012, countries were required to sample students who were between the ages of 15 years and 3 months and 16 years and 2 months at the time of the assessment and who had completed at least 6 years of formal schooling, regardless of the type of institution in which they were enrolled.
PISA scores are reported on a scale from 0 to 1,000, with the scale average fixed at 500 and the standard deviation fixed at 100. The PISA achievement scales were designed to reliably measure student achievement over time, and the metric of the scales was established for reading in 2000, mathematics in 2003, and science in 2006.
To help in interpreting what students’ scores mean in substantive terms, the scale is divided into levels, based on a set of statistical principles. Based on the tasks that are located within each level, certain kinds of skills and knowledge are needed to complete them successfully. The cutpoint scores for each level differ between subjects, but in each subject there may be students who perform
below level 1. (In the case of reading literacy, level 1 includes two sublevels, level 1a and 1b.)
In reading literacy, toward the top of the scale, students can handle texts that are unfamiliar in either form or content. They can find information in such texts, demonstrate detailed understanding, and infer which information is relevant to the task. They are also able to critically evaluate such texts and build hypotheses about them, drawing on specialized knowledge and accommodating concepts that may be contrary to expectations. Near the bottom of the scale, students begin to demonstrate the reading literacy competencies that will enable them to participate effectively and productively in life. Questions require recognizing the main idea in a text, understanding relationships, or construing meaning within a limited part of the text when the information is not prominent and the reader must make low-level inferences. The levels, with score-point cutoffs in parentheses, are 1b (262.04 to less than 334.75), 1a (334.75 to less than
26 INDICATORS PART II: ACADEMIC PERFORMANCE

Indicator
INDICATORS PART II: ACADEMIC PERFORMANCE 27
7
407.47), 2 (407.47 to less than 480.18), 3 (480.18 to less than 552.89), 4 (552.89 to less than 625.61), 5 (625.61 to less than 698.32), and 6 (above 698.32).
In mathematics literacy, toward the top of the scale, the tasks typically involve a number of different elements and require high levels of interpretation. Usually, the situations described are unfamiliar and so require some degree of thoughtful reflectionand creativity. Typical activities involved include interpreting complex and unfamiliar data, imposing a mathematical construc-tion on a complex real-world situation, and using mathematical modeling processes. Near the bottom of the scale, questions set in simple and relatively familiar contexts require only the most limited interpretation of a situation and direct application of well-known mathematical concepts. Typical activities include reading a value directly from a graph or table, performing a very simple and straightforward arithmetic calculation, ordering a small set of numbers correctly, counting familiar objects, using a simple currency exchange rate, and identifying and listing
simple combinatorial outcomes. The levels, with score-point cutoffs in parentheses, are 1 (357.77 to less than 420.07), 2 (420.07 to less than 482.38), 3 (482.38 to less than 544.68), 4 (544.68 to less than 606.99), 5 (606.99 to less than 669.30), and 6 (above 669.30).
In science literacy, typical questions near the top of the scale involve interpreting complex and unfamiliar data, imposing a scientific explanation on a complex real-world situation, and applying scientific processes to unfamiliar problems. At this part of the scale, questions tend to have several scientific or technol-ogical elements that need to be linked by students, requiring several interrelated steps. On the bottom of the scale, questions require less scientific knowledge and are applied in familiar contexts, with easy scientific explanations that arise directly from given evidence. The levels, with score-point cutoffs in parentheses, are 1 (334.94 to less than 409.54), 2 (409.54 to less than 484.14), 3 (484.14 to less than 558.73), 4 (558.73 to less than 633.33), 5 (633.33 to less than 707.93), and 6 (above 707.93).

28 INDICATORS PART II: ACADEMIC PERFORMANCE
Indicator 7
Figure 7-1. Percentage distribution of 15-year-old students across proficiency levels in reading, mathematics, and science literacy, by country: 2012
Level 3Level 2Level 1 or below Level 5 or 6Level 4
0
20
40
60
80
100
Percent Reading literacy
Germany Italy Japan RussianFederation
UnitedStates
Australia Republic ofKorea
UnitedKingdom
TurkeyArgentina MexicoIndonesiaFranceCanadaBrazil
15
27
54
14
14
2# #
12
29
22
14
23
16
30
49
13
31
19
11
26
13
26
19
19
23
9
30
22
14
25
11
32
55
7
30
24
20
2018
27
17
10
28
20
34
41
14
31
16
8
31
8
30
25
17
20
9
30
23
17
21
29
31
22
145
28
29
22
15
4 4
0
20
40
60
80
100
Percent
Argentina Germany Italy Japan RussianFederation
UnitedStates
Australia Republic ofKorea
UnitedKingdom
TurkeyMexicoIndonesiaFranceCanadaBrazil
Mathematics literacy# 2
9
22
66
15
25
22
20
19
9
20
67
16
26
21
14
22
13
24
22
22
19
17
24
19
18
22
17
76
25
24
25
25
17
24
11
13
28
5521
2423
26
16
25
23
1817
26
10
26
27
16
15
9
2622
42
24
10
1724
31
912813 1#
41
6 6
0
20
40
60
80
100
Percent
Argentina
Country
Germany Italy Japan RussianFederation
UnitedStates
Australia Republic ofKorea
UnitedKingdom
TurkeyMexicoIndonesiaFranceCanadaBrazil
Science literacy
15
31
51
14
29
22
14
23
13
31
54
11 8 12
26
67
30
26
19
28
16
30
8
14
37
47
34
18
7
6
1918
7
30
29
27
19
28
22
2325
35
11
31
30
16
181526
19
12 711
32
21
10
25
29
23
19
21
29
21
12
26
# 3 # 3 1 # 2 24
# Rounds to zero.NOTE: PISA scores are reported on a scale from 0 to 1,000, with the scale average fixed at 500 and the standard deviation fixed at 100. See the “Definitions and Methodology” section of Indicator 7 for specific score cutpoints at each proficiency level for each subject. Proficiency levels define student performance along a continuum, with level 1 or below indicative of the lowest performing students and levels 5 and 6 being indicative of the highest performing students. Detail may not sum to totals due to rounding.SOURCE: Organization for Economic Cooperation and Development, Program for International Student Assessment (PISA), 2012.

Indicator
INDICATORS PART II: ACADEMIC PERFORMANCE 29
8ADULT PERFORMANCE IN LITERACY, NUMERACY, AND PROBLEM SOLVING IN TECHNOLOGY-RICH ENVIRONMENTS
G-20 Countries Included: Australia, Canada, France, Germany, Italy, Japan, Republic of Korea, United Kingdom (England and Northern Ireland), United States
In 2012, the percentage of adults reaching the high end of the performance scale on the literacy scale in PIAAC (i.e., those at level 4 or 5) in the participating G-20 countries ranged from 3 percent in Italy to 23 percent in Japan. In the United States, 12 percent of adults reached level 4 or 5 in literacy.
This indicator draws on data from the 2012 Program for the International Assessment of Adult Competencies (PIAAC), a new assessment of adults ages 16 to 65 in literacy, numeracy, and problem solving in technology-rich environments. Similar to the other indicators in this section, it examines the percentages of adults reaching different levels of proficiency on a performance scale. (In PIAAC, the proficiency levels range from below level 1 to level 5 in literacy and numeracy and from below level 1 to level 3 in problem-solving in technology-rich environments.) For literacy and numeracy, the indicator focuses on the percentages of adults at the high and low ends of the scale (that is, those at level 4 or 5 and those at level 1 or below, respectively). For problem solving in technology-rich environments, because there are fewer levels designated along the performance scale, the indicator focuses on those adults reaching levels 2 and 3.
In 2012, the percentage of adults reaching the high end of the performance scale in literacy (i.e., at level 4 or 5) in the nine participating G-20 countries ranged from 3 percent in Italy to 23 percent in Japan (figure 8-1). In the United States, 12 percent of adults reached level 4 or 5, which was not measurably differ than in Germany and the United Kingdom (England/Northern Ireland); higher than in France, Italy, and the Republic of Korea; and lower than in Australia, Canada, and Japan. The percentage of adults at the low end of the performance scale (i.e., at level 1 or below) ranged from 5 percent in Japan to 28 percent in Italy. All of the participating G-20 countries except Japan and Australia had higher percentages of adults at level 1 or below than
at level 4 or 5. The percentage of U.S. adults at level 1 or below was 18 percent, which was lower than in France and Italy but higher than in Australia, Japan, and the Republic of Korea.
In numeracy, the percentage of adults at the high end of the performance scale ranged from 4 percent in Italy to 19 percent in Japan. In the United States (and France), 9 percent of adults reached level 4 or 5, which was higher than in Italy and the Republic of Korea, but lower than in the other participating G-20 countries. The percentage of adults at the low end of the performance scale ranged from 8 percent in Japan to 32 percent in Italy. All but one of the participating G-20 countries (Japan) had higher percentages of adults at level 1 or below than at level 4 or 5. The percentage of U.S. adults at level 1 or below was 30 percent, which was higher than in all participating countries except France and Italy.
Comparing literacy and numeracy, there were higher percentages of adults at level 1 or below in numeracy than in literacy in all participating G-20 countries except Germany. In three of those countries (Australia, Japan, and the United States), there were lower percentages of adults at level 4 or 5 in numeracy than in literacy, as well. Germany and Italy, on the other hand, had higher percentages of adults at level 4 or 5 in numeracy than in literacy.
In problem solving in technology-rich environments (where the proficiency levels ranged from below level 1 to level 3), over half of the participating adults in Japan reached proficiency level 2 or 3 (though it should be noted that response rates for Japan were 50 percent). Thirty-nine percent of participating U.S. adults reached level 2 or 3, which was lower than in any other participating G-20 country except the United Kingdom (England/Northern Ireland). In all countries except Japan, where 13 percent of adults reached this level, the percentage of adults at level 3 was between 5 and 9 percent.
Definitions and Methodolog
The Program for the International Assessment of Adult Competencies (PIAAC) is a household study that has been developed under the auspices of the Organization for Economic Cooperation and Development (OECD). In the United States, data were collected in 2011 and 2012 for the first administration of PIAAC from a nationally representative sample of 5,000 adults between the ages of 16 and 65. The goal of PIAAC is to assess and compare the basic skills and the broad range of competencies of adults around the world. Specificall , PIAAC measures relation-ships between individuals’ educational background, workplace experiences and skills, occupational attainment, use of information and communications technology, and cognitive skills in the areas of literacy, numeracy, and problem solving. The literacy, numeracy, and problem-solving scales each range from 0 to 500.
Literacy is defined by PIAAC as understanding, evaluating, using, and engaging with written texts to participate in society, to achieve one’s goals, and to develop one’s knowledge and potential. Adults performing below proficiency level 1 (a score lower than 176) are able to read brief texts on familiar topics and to locate a single piece of specific information. Only basic vocabulary knowledge is required. Adults reaching level 1 (a score from 176 to 225) are able to read relatively short digital or print texts to locate a single piece of information that is identical to or synonymous with the information given in the question or directive. Adults reaching level 4 (a score from 326 to 375) can perform multi-step operations to integrate, interpret, or synthesize information from complex or lengthy texts of a variety of types. Complex inferences and application of background knowledge

Indicator
30 INDICATORS PART II: ACADEMIC PERFORMANCE
8
may be needed to perform the task successfully. Adults reaching proficiency level 5 (a score higher than 376) are able to search for and integrate information across multiple, dense texts; construct syntheses of similar and contrasting ideas or points of view; and evaluate evidence-based arguments.
Numeracy is defined by PIAAC as the ability to access, use, interpret, and communicate mathematical information and ideas, in order to engage in and manage the mathematical demands of a range of situations in adult life. Adults performing below proficiency level 1 (a score lower than 176) in numeracy are capable of carrying out simple processes such as counting, sorting, or performing basic arithmetic operations with whole numbers or money. Adults reaching proficiency level 1 (a score from 176 to 225) can carry out basic mathematical processes in common, concrete contexts where the mathematical context is explicit with little text and minimal distractors. Adults reaching proficiency level 4 (a score from 326 to 375) understand a broad range of mathematical
information that may be complex, abstract, or embedded in unfamiliar contexts. Adults reaching level 5 (a score higher than 376) are able to integrate multiple types of mathematical information where considerable translation and interpretation is required; draw inferences; develop or work with mathematical arguments or models; and justify, evaluate, and critically reflectupon solutions or choices.
Problem solving in technology-rich environments is defined by PIAAC as using digital technology, communication tools, and networks to acquire and evaluate information, communicate with others, and perform practical tasks. Adults performing at proficiency level 2 (a score from 291 to 340) are able to use both generic and more specific technology applications to perform a task that may involve multiple steps and operators. Adults performing at proficiency level 3 (a score higher than 340) are also able to use both generic and specific technology applications as well as integration and inferential reasoning to a large extent.

Indicator
INDICATORS PART II: ACADEMIC PERFORMANCE 31
8
Figure 8-1. Percentage distribution of adults ages 16 to 65 across PIAAC proficiency levels in literacy, numeracy, and problem solving in technology-rich environments, by country: 2012
1000 20 40 60 80
United States
Republic ofKorea
Japan
U.K. (England/N. Ireland)
Germany
France
Canada
Country
PercentLevel 2Level 1Below level 1 Level 4Level 3
Australia
Italy
Level 5
3
4
5
3
6
1
2
3
4 14
13
11
4
22
14
16
13
10 30
32
36
34
42
37
34
34
38
34
37
27
49
42
36
36
40 16
13
7
10
3
22
8
12
11 1
1
#
1
#
#
#
1
1
23
Literacy1
1000 20 40 60 80PercentLevel 2Level 1Below level 1 Level 4Level 3 Level 5
6
6
9
5
8
1
4
6
10
24
14
19
17
15 33
32
34
31
20
18
15
7
39
39
33
29
35
25
44
33 12
11
8
13
28
34
34
35
30
27
4
18
7
10
8 1
1
#
2
#
1
1
2
1
Numeracy2
Problem solving in technology-rich environments3
1000 20 40 60 80PercentLevel 2Level 1Below level 1 Level 3
United States
Republic ofKorea
Japan
U.K. (England/N. Ireland)
Germany
Canada
Country
Australia 12
18
18
12
14
18
38
38
40
42
37
20 41
42 8
9
8
13
5
7
6
38
35
33
36
36
4332
United States
Republic ofKorea
Japan
U.K. (England/N. Ireland)
Germany
France
Canada
Country
Australia
Italy
# Rounds to zero.1 Literacy is defined by PIAAC as “understanding, evaluating, using, and engaging with written texts to participate in society, to achieve one’s goals, and to develop one’s knowledge and potential.”2 Numeracy is defined by PIAAC as “the ability to access, use, interpret, and communicate mathematical information and ideas, in order to engage in and manage the mathematical demands of a range of situations in adult life.”3 Problem solving in technology-rich environments is defined by PIAAC as “using digital technology, communication tools, and networks to acquire and evaluate information, communicate with others, and perform practical tasks.”NOTE: PIAAC scores are reported on a scale from 0 to 500. See the “Definitions and Methodology” section of Indicator 8 for specific score cutpoints at each proficiency level for each subject. Proficiency levels define student performance along a continuum, with level 1 or below indicative of the lowest performing adults and levels 4 and 5 (in literacy and numeracy) indicative of the highest performing adults. France and Italy did not participate in the assessment of problem solving in technology-rich environments. Detail may not sum to totals due to rounding.SOURCE: Organization for Economic Cooperation and Development (OECD), Program for the International Assessment of Adult Competencies (PIAAC), 2012.

Indicator
32 INDICATORS PART II: ACADEMIC PERFORMANCE
9PERFORMANCE OF FOURTH-GRADE STUDENTS ON SUBSCALES IN READING, MATHEMATICS, AND SCIENCE
G-20 Countries Included: Australia, Canada, France, Germany, Indonesia, Italy, Japan, Republic of Korea, Russian Federation, Saudi Arabia, Turkey, United Kingdom (England and Northern Ireland), United States
In PIRLS 2011, which tested fourth-graders, the United States’ mean score on the reading for literary experience subscale was 563, not measurably different from the Russian Federation’s score and higher than scores in eight other G-20 countries.
In PIRLS 2011 and TIMSS 2011, as in previous cycles, the overall performance scales in reading, mathematics, and science were composed of subscales that allow a more detailed look at student performance within each content area. Indicator 9 examines he mean performance of fourth-grade students on these subscales in order to highlight the relative strengths and weaknesses in reading, mathematics, and science both within and across the participating G-20 countries.
As the indicator shows, the United States performed strongest on the reading and science subscales at the fourth grade, generally outperforming more countries than on the mathematics sub-scales. There also was generally more variation in the United States’ performance relative to other countries on the mathematics subscales compared to the reading and science subscales.
In PIRLS 2011, the reading subscales relate to the purposes for reading and include reading for literary experience and reading to acquire and use information. Mean scores for fourth-grade students on the literary experience subscale ranged 149 points, from 418 in Indonesia to 567 in the Russian Federation (figure 9-1).Mean scores on the acquire and use information subscale had a smaller range (131 points), from 439 in Indonesia to 570 in the Russian Federation. The U.S. mean score on the literary experience subscale was 563, not measurably different from that of the United Kingdom (Northern Ireland) and the Russian Federation, and higher than scores in eight other G-20 countries. On the acquire and use information subscale, the U.S. mean score was 553, lower than that of the Russian Federation, not measurably different from the United Kingdom’s (Northern Ireland and England) mean scores, and higher than the scores in seven other G-20 countries.
In TIMSS 2011, the mathematics subscales at grade 4 relate to specific content domains and include number, geometric shapes
and measures, and data display. The range of mean scores was similar on each of the three content domain subscales, with 196-, 203-, and 200-point differences between the lowest and highest scoring G-20 countries on number, geometric shapes and measures, and data display, respectively (figure 9-2). The U.S. mean score on the number subscale was 543, lower than the scores of the Republic of Korea, Japan, and the United Kingdom (Northern Ireland), not measurably different from those of the Russian Federation and the United Kingdom (England), and higher than those of five other countries. The performance of the United States was similar on the data display subscale, with a mean score (545) below those of the Republic of Korea, Japan, and the United Kingdom (Northern Ireland), not measurably different from those of the United Kingdom (England) and Germany, and higher than those of five other countries. On the geometric shapes and measures subscale, four countries—the Republic of Korea, Japan, and the United Kingdom (England and Northern Ireland)—had mean scores that were higher than the U.S. mean score of 535, three countries (the Russian Federation, Germany, and Australia) had scores that were not measurably different from the U.S. score, and three countries had scores that were lower.
The science subscales in TIMSS 2011 at grade 4 also relate to specific content domains and include life science, physical science, and Earth science. The range of mean scores on the science subscales was smaller than the range on the mathematics subscales, with 156-, 158-, and 171-point differences between the lowest and highest scoring G-20 countries on life science, physical science, and Earth science, respectively (figure 9-2). The U.S. mean score on the life science subscale was 547, lower than the scores of the Republic of Korea and the Russian Federation and higher than those of eight other countries. The United States’ mean score on the physical science subscale was 544, lower than the scores of the Republic of Korea and Japan, not measurably different from that of the Russian Federation, and higher than those of seven other countries. On the Earth science subscale, the Republic of Korea, Japan, and the Russian Federation had higher mean scores than the United States (539), but the United States had a higher mean score than seven other countries.
Definitions and Methodolog
In PIRLS 2011 and TIMSS 2011 at the fourth grade, countries were required to sample students in the grade that corresponded to the end of 4 years of formal schooling, providing that the mean age at the time of testing was at least 9.5 years. As defined by PIRLS and TIMSS, the first year of formal schooling begins with the first year of primary school (ISCED 97 level 1), which should mark the begin-ning of formal instruction in reading, writing, and mathematics. (Note that kindergarten is not counted.) For most countries, the target grade was fourth grade or its national equivalent.
PIRLS and TIMSS scores are reported on a scale from 0 to 1,000, with the scale average fixed at 500 and the standard deviation fixed at 100. Since both the PIRLS and TIMSS achievement scales were designed to reliably measure student achievement over time, the metric of the scales was established originally in 2001 for PIRLS and in 1995 for TIMSS, the first year in which each assessment was administered.
Indicator
INDICATORS PART II: ACADEMIC PERFORMANCE 33
9
The PIRLS assessment of reading literacy focuses on the two purposes that account for most of the reading done by young students both in and out of school: reading for literary experience and reading to acquire and use information. Each of these purposes for reading is often associated with certain types of texts. For example, reading for literary experience is often accomplished through reading fiction, while reading to acquire and use information is generally associated with informative articles and instructional texts. In literary reading, the reader engages with the text to become involved in imagined events, settings, actions, consequences, characters, atmosphere, feelings, and ideas, and to enjoy language itself. In reading for information, the reader engages not with imagined worlds, but with aspects of the real world. Readers can go beyond the acquisition of information and use it in reasoning and in action.
The TIMSS 2011 assessment at the fourth grade includes three domains that define the mathematic content covered: number,
geometric shapes and measures, and data display. The number content domain includes place value, ways of representing numbers, and the relationships between numbers. The geometric shapes and measures domain includes properties of geometric figures such as lengths of sides, sizes of angles, areas, and volumes. The data display content domain includes reading and interp-reting displays of data.
The TIMSS 2011 assessment at the fourth grade includes three domains that define the science content covered: life science, physical science, and Earth science. Together, these content domains cover most of the topics in the various countries’ curricula. Life science includes characteristics of the life processes of living things, the relationships between them, and their interaction with the environment. Physical science includes concepts related to matter and energy and covers topics in the areas of both chemistry and physics. Earth science is concerned with the study of Earth and its place in the solar system.

34 INDICATORS PART II: ACADEMIC PERFORMANCE
Indicator 9
Figure 9-1. Average scores of fourth-grade students in reading literacy, by purpose of reading and country: 2011
ReadingLiterary experience1
Country Score
Russian Federation 567U.K. (Northern Ireland) 564United States 563Canada 553U.K. (England) 553Germany 545Italy 539Australia 527France 521Saudi Arabia 422Indonesia 418
Acquire and use information2
Country Score
Russian Federation 570U.K. (Northern Ireland) 555United States 553U.K. (England) 549Canada 545Italy 545Germany 538Australia 528France 519Saudi Arabia 440Indonesia 439
Average is higher than the U.S. average Average is not measurably different from the U.S. average
Average is lower than the U.S. average
1 The literary experience purpose of reading is associated with reading and engaging with fictional texts.2 The acquire and use information purpose of reading is associated with reading and engaging with informational texts.NOTE: Shown are the scores for two PIRLS subscales, literary experience and acquire and use information. Each PIRLS assessment item is classified into one of these two purposes of reading. Japan, the Republic of Korea, and Turkey did not participate in PIRLS 2011.SOURCE: International Association for the Evaluation of Educational Achievement (IEA) Progress in International Reading Literacy Study (PIRLS), 2011.

Indicator
INDICATORS PART II: ACADEMIC PERFORMANCE 35
9
Figure 9-2. Average scores of fourth-grade students in mathematics and science, by content domain and country: 2011
Mathematics
Number1
Country ScoreRepublic of Korea 606Japan 584U.K. (Northern Ireland) 566Russian Federation 545United States 543U.K. (England) 539Germany 520Italy 510Australia 508Turkey 477Saudi Arabia 410
Geometric shapes and measures2
Country ScoreRepublic of Korea 607Japan 589U.K. (Northern Ireland) 560U.K. (England) 545Russian Federation 542Germany 536United States 535Australia 534Italy 513Turkey 447Saudi Arabia 404
Data display3
Country ScoreRepublic of Korea 603Japan 590U.K. (Northern Ireland) 555U.K. (England) 549Germany 546United States 545Russian Federation 533Australia 515Italy 495Turkey 478Saudi Arabia 403
Science
Life science4
Country ScoreRepublic of Korea 571Russian Federation 556United States 547Japan 540Italy 535U.K. (England) 530Germany 525U.K. (Northern Ireland) 519Australia 516Turkey 460Saudi Arabia 415
Physical science5
Country ScoreRepublic of Korea 597Japan 589Russian Federation 548United States 544U.K. (England) 535Germany 535U.K. (Northern Ireland) 520Australia 514Italy 509Turkey 466Saudi Arabia 439
Earth science6
Country ScoreRepublic of Korea 603Russian Federation 552Japan 551United States 539Italy 523U.K. (England) 522Germany 520Australia 520U.K. (Northern Ireland) 507Turkey 456Saudi Arabia 432
Average is higher than the U.S. average Average is not measurably different from the U.S. average
Average is lower than the U.S. average
1 The number content domain includes place value, ways of representing numbers, and the relationships between numbers.2 The geometric shapes and measures content domain includes properties of geometric figures, such as lengths of sides, sizes of angles, areas, and volumes.3 The data display content domain includes reading and interpreting displays of data.4 The life science content domain includes the characteristics of the life processes of living things, the relationships between them, and their interaction with the environment.5 The physical science content domain includes concepts related to matter and energy and covers topics in the areas of both chemistry and physics.6 The Earth science content domain is concerned with the study of Earth and its place in the solar system.NOTE: Shown are the scores for three TIMSS mathematics content domains (number, geometric shapes and measures, and data display) and three TIMSS science content domains (life science, physical science, and Earth science). Each TIMSS fourth-grade assessment item is classified into one of these six content domains. Canada, France, and Indonesia did not participate in TIMSS 2011 at the fourth grade.SOURCE: International Association for the Evaluation of Educational Achievement (IEA), Trends in International Mathematics and Science Study (TIMSS), 2011.

36 INDICATORS PART II: ACADEMIC PERFORMANCE
Indicator 10PERFORMANCE OF EIGHTH-GRADE STUDENTS ON SUBSCALES IN MATHEMATICS AND SCIENCE
G-20 Countries Included: Australia, Indonesia, Italy, Japan, Republic of Korea, Russian Federation, Saudi Arabia, Turkey, United Kingdom (England), United States
In terms of rankings relative to other G-20 countries, the United States performed stronger on the algebra subscale in eighth-grade mathematics than on the number, geometry, or data and chance subscales.
In TIMSS 2011, as in previous cycles, the overall performance scales in mathematics and science were composed of subscales that allow for a more detailed look at student performance in specific subcontent areas. Indicator 10 examines the mean performance of eighth-grade students on these subscales in order to highlight the relative strengths and weaknesses in mathematics and science both within and across the participating G-20 countries.
In TIMSS 2011, the mathematics subscales in grade 8, which relate to specific content domains, include: number, algebra, geometry, and data and chance. The smallest range in mean scores between the lowest and highest performing G-20 countries was in algebra, with a 224-point difference (figure 10-1). The range between countries on the three other subscales was similar but larger, with 243 , 247-, and 240-point differences in number, geometry, and data and chance, respectively. Compared with other participating G-20 countries, the United States performed strongest on the algebra subscale, with a mean score (512) that was lower than the mean scores of three G-20 countries, but higher than those of six others. Three countries also had higher mean scores than the United States in number and data and chance, although two countries in number, and one in data and chance, had mean scores not measurably different from the U.S. score. Geometry was the weakest area for the United States, with a mean score (485) that was lower than the scores of six countries and higher
than those of three others. The mean scores of students in the Republic of Korea and Japan were higher than the mean scores of U.S. students on all four subscales. Students from the Russian Federation also outperformed U.S. students in number, algebra, and geometry, but underperformed U.S. students in data and chance. U.S. students outperformed students in Turkey, Indonesia, and Saudi Arabia on all four subscales and in Italy on all subscales except geometry; on the geometry subscale, Italian students had a higher mean score than U.S. students (512 vs. 485, respectively).
The science subscales in TIMSS 2011 also relate to specific content domains: biology, chemistry, physics, and Earth science. The range of mean scores among the participating G-20 countries on the science subscales was smaller than the range on the mathematics subscales (with 151-, 182-, 180-, and 137-point differences in biology, chemistry, physics, and Earth science, respectively) (figure 10-1). The U.S. mean scores on the Earth science (533) and biology (530) subscales were lower than the mean scores of Japan and the Republic of Korea; not measurably different from the mean scores of the United Kingdom (England), the Russian Federation, and Australia; and higher than those of four other countries. On the chemistry subscale, Japan, the Russian Federation, and the Republic of Korea had higher mean scores than the United States; the U.S. mean score (520) was not measur-ably different from the score of the United Kingdom (England), but was higher than those of the remaining five countries. On the physics subscale, the Republic of Korea, Japan, the Russian Federation, and the United Kingdom (England) had higher mean scores than the United States; the U.S. mean score (513) was not measurably different from Australia’s, but was higher than those of the remaining four countries.
Definitions and Methodolog
In TIMSS 2011 at the eighth grade, countries were required to sample students in the grade that corresponded to the end of 8 years of formal schooling, providing that the mean age at the time of testing was at least 13.5 years. As defined by TIMSS, the first year of formal schooling begins with the first year of primary school (ISCED97 level 1), which should mark the beginning of formal instruction in reading, writing, and mathematics. (Note that kindergarten is not counted.) For most countries, the target grade was eighth grade or its national equivalent.
TIMSS scores are reported on a scale from 0 to 1,000, with the scale average fixed at 500 and the standard deviation fixed at 100. Since the TIMSS achievement scales were designed to reliably measure student achievement over time, the metric of the scales was established originally in 1995, the first year in which the assessment was administered.
The TIMSS 2011 assessment at the eighth grade includes four domains that define the mathematics content covered: number, algebra, geometry, and data and chance. The number content domain includes understanding numbers, ways of representing numbers, relationships among numbers, and number systems. The algebra content domain includes recognizing and extending patterns, using algebraic symbols to represent math-ematical situations, and developing fluency in producing equivalent expressions and solving linear equations. The geometry content domain includes analyzing the properties and characteristics of a variety of two- and three-dimensional geometric figures, including lengths of sides and sizes of angles, and providing explanations based on geometric relationships. The data and chance content domain includes knowing how to organize data that have been collected and how to display data in graphs and charts that will

Indicator
INDICATORS PART II: ACADEMIC PERFORMANCE 37
10
be useful in answering questions, as well as understanding issues related to misinterpretation of data.
The TIMSS 2011 assessment at the eighth grade includes four domains that define the science content covered: biology, chemistry, physics, and Earth science. Together, these content do-mains cover most of the topics in the various countries’ curricula. The biology content domain includes students’ understanding
of the structure, life processes, diversity, and interdependence of living organisms. The chemistry content domain includes students’ understanding of the classification and composition of matter, properties of matter, and chemical change. The physics content domain includes students’ understanding of concepts related to physical processes and energy. The Earth science content domain includes the study of Earth and its place in the solar system and the universe.

Indicator
38 INDICATORS PART II: ACADEMIC PERFORMANCE
10Figure 10-1. Average scores of eighth-grade students in mathematics and science, by content domain and country: 2011
MathematicsNumber1
Country Score
Republic of Korea 618
Japan 557
Russian Federation 534
United States 514
Australia 513
U.K. (England) 512
Italy 496
Turkey 435
Saudi Arabia 393
Indonesia 375
Algebra2
Country Score
Republic of Korea 617
Japan 570
Russian Federation 556
United States 512
Italy 491
U.K. (England) 489
Australia 489
Turkey 455
Saudi Arabia 399
Indonesia 392
Geometry3
Country Score
Republic of Korea 612
Japan 586
Russian Federation 533
Italy 512
Australia 499
U.K. (England) 498
United States 485
Turkey 454
Indonesia 377
Saudi Arabia 364
Data and chance4
Country Score
Republic of Korea 616
Japan 579
U.K. (England) 543
Australia 534
United States 527
Russian Federation 511
Italy 499
Turkey 467
Saudi Arabia 387
Indonesia 376
ScienceBiology5
Country Score
Republic of Korea 561
Japan 561
Russian Federation 537
U.K. (England) 533
United States 530
Australia 527
Italy 503
Turkey 484
Saudi Arabia 430
Indonesia 410
Chemistry6
Country Score
Japan 560
Russian Federation 554
Republic of Korea 551
U.K. (England) 529
United States 520
Australia 501
Italy 491
Turkey 477
Saudi Arabia 428
Indonesia 378
Physics7
Country Score
Republic of Korea 577
Japan 558
Russian Federation 547
U.K. (England) 533
United States 513
Australia 511
Turkey 494
Italy 490
Saudi Arabia 437
Indonesia 397
Earth science8
Country Score
Japan 548
Republic of Korea 548
U.K. (England) 536
Russian Federation 535
Australia 533
United States 533
Italy 513
Turkey 468
Saudi Arabia 441
Indonesia 412
Average is higher than the U.S. average Average is not measurably different from the U.S. average Average is lower than the U.S. average
1 The number content domain includes understanding numbers, way of representing numbers, relationships among numbers, and number systems.2 The algebra content domain includes recognizing and extending patterns, using algebraic symbols to represent mathematical situations, and developing fluency in producing equivalent expressions and solving linear equations.3 The geometry content domain includes analyzing the properties and characteristics of a variety of two- and three-dimensional geometric figures, including lengths of sides and sizes of angles, and providing explanations based on geometric relationships.4 The data and chance content domain includes knowing how to organize data that have been collected and how to display data in graphs and charts that will be useful in answering questions, as well as understanding issues related to misinterpretation of data.5 The biology content domain includes students’ understanding of the structure, life processes, diversity, and interdependence of living organisms.6 The chemistry content domain includes classification and composition of matter, properties of matter, and chemical change.7 The physics content domain includes students’ understanding of concepts related to physical processes and energy.8 The Earth science content domain includes the study of Earth and its place in the solar system and the universe.NOTE: Shown are the scores for four TIMSS mathematics content domains (number, algebra, geometry, and data and chance) and four TIMSS science content domains (biology, chemistry, physics, and Earth science). Each TIMSS eighth-grade assessment item is classified into one of these eight content domains.SOURCE: International Association for the Evaluation of Educational Achievement (IEA), Trends in International Mathematics and Science Study (TIMSS), 2011.

Indicator
11PERFORMANCE OF 15-YEAR-OLD STUDENTS ON SUBSCALES IN MATHEMATICS LITERACY
G-20 Countries Included: Argentina, Australia, Brazil, Canada, France, Germany, Indonesia, Italy, Japan, Mexico, Republic of Korea, Russian Federation, Turkey, United Kingdom, United States
The U.S. mean score on the change and relationships subscale was 488, lower than the scores of the Republic of Korea, Japan, Canada, Germany, and Australia; not measurably different from those of France, the United Kingdom, and the Russian Federation; and higher than those of six other G-20 countries.
In PISA 2012, the overall performance scale in mathematics literacy was composed of four subscales, allowing a more detailed look at student performance within mathematics content areas. (Mathematics, but not reading or science, had subscales because it was the focus in the 2012 assessment.) Indicator 11 examines the mean performance of 15-year-old students on these subscales in order to highlight the relative strengths and weaknesses in mathematics both within and across the participating G-20 countries.
The mathematics subscales in PISA relate to mathematics content domains and include change and relationships, space and shape, quantity, and uncertainty and data. The range of mean scores was similar for change and relationships and space and shape, with 194- and 192-point differences between the lowest and highest scoring G-20 countries, respectively (figure 11-1). Quantity had a 175-point difference between the lowest and
highest scoring G-20 countries, and uncertainty and data had the smallest range, at 154 points.
The U.S. mean score on the change and relationships subscale was 488, lower than the scores of the Republic of Korea, Japan, Canada, Germany, and Australia; not measurably different from those of France, the United Kingdom, and the Russian Federation; and higher than those of six other countries. The performance of the United States was similar on the uncertainty and data subscale, with a mean score (488) below those of the Republic of Korea, Japan, Canada, Germany, Australia, and the United Kingdom; not measurably different from those of France and Italy; and higher than those of six other countries. Of the four subscales, the performance of U.S. students was the strongest on these two.
In contrast, on the quantity subscale, eight countries (the Republic of Korea, Japan, Germany, Canada, Australia, France, the United Kingdom, and Italy) had mean scores that were higher than the U.S. mean score of 478; one country (the Russian Federation) had a score that was not measurably different from the U.S. score; and five countries had scores that were lower. Similarly, the U.S. mean score on the space and shape subscale was 463, lower than the scores of nine countries (the Republic of Korea, Japan, Canada, Germany, Australia, the Russian Federation, France, Italy, and the United Kingdom) and higher than those of the other five countries.
Definitions and Methodolog
In PISA 2012, countries were required to sample students who were between the ages of 15 years and 3 months and 16 years and 2 months at the time of the assessment and who had completed at least 6 years of formal schooling, regardless of the type of institution in which they were enrolled.
PISA scores are reported on a scale from 0 to 1,000, with the scale average fixed at 500 and the standard deviation fixed at 100. The PISA achievement scales were designed to reliably measure student achievement over time, and the metric of the scales was established for reading in 2000, mathematics in 2003, and science in 2006.
The PISA assessment of mathematics literacy includes four domains that define the mathematic content covered: change and relationships, space and shape, quantity, and uncertainty and data. The change and relationships content subscale includes settings such as growth of organisms, music, the cycle of seasons, weather patterns, employment levels, and economic conditions and includes the use of algebraic expressions, equations and inequalities, and tabular and graphical representations. The space
and shape content subscale encompasses phenomena encoun- tered in our visual world: patterns, properties of objects, positions and orientations, representations of objects, decoding of visual information, and navigation. It utilizes geometry, spatial visualiza-tion, measurement, and algebra. The quantity content subscale incorporates aspects of quantitative reasoning, such as number sense, multiple representations of numbers, computation, mental calculation, estimation, and assessment of the reasonableness of results. The uncertainty and data content subscale is based on the theory of probability and statistics and includes recognizing the place of variation in processes, having a sense of the quantification of that variation, acknowledging uncer- tainty and error in measurement, and knowing about chance.
In addition to the four domains, the PISA mathematics literacy assessment collects data on three mathematical processes: formulating, employing, and interpreting. Each mathematics item is classified into one of the four content domains as well as into one of the three mathematical processes.
INDICATORS PART II: ACADEMIC PERFORMANCE 39

Indicator
40 INDICATORS PART II: ACADEMIC PERFORMANCE
11Figure 11-1. Average scores of 15-year-old students in mathematics literacy, by content subscale and country: 2012
Change and relationship1
Country ScoreRepublic of Korea 559Japan 542Canada 525Germany 516Australia 509France 497United Kingdom 496Russian Federation 491United States 488Italy 477Turkey 448Mexico 405Argentina 379Brazil 372Indonesia 364
Space and shape2
Country ScoreRepublic of Korea 573Japan 558Canada 510Germany 507Australia 497Russian Federation 496France 489Italy 487United Kingdom 475United States 463Turkey 443Mexico 413Argentina 385Indonesia 383Brazil 381
Quantity3
Country ScoreRepublic of Korea 537Japan 518Germany 517Canada 515Australia 500France 496United Kingdom 494Italy 491Russian Federation 478United States 478Turkey 442Mexico 414Brazil 393Argentina 391Indonesia 362
Uncertainty and data4
Country ScoreRepublic of Korea 538Japan 528Canada 516Germany 509Australia 508United Kingdom 502France 492United States 488Italy 482Russian Federation 463Turkey 447Mexico 413Brazil 402Argentina 389Indonesia 384
Average is higher than the U.S. average Average is not measurably different from the U.S. average
Average is lower than the U.S. average
1 The change and relationship content subscale includes settings such as growth of organisms, music, the cycle of seasons, weather patterns, employment levels, and economic conditions and includes the use of algebraic expressions, equations and inequalities, and tabular and graphical representations.2 The space and shape content subscale encompasses phenomena encountered in our visual world: patterns, properties of objects, positions and orientations, representations of objects, decoding of visual information, and navigation. It utilizes geometry, spatial visualization, measurement, and algebra.3 The quantity content subscale incorporates aspects of quantitative reasoning, such as number sense, multiple representations of numbers, computation, mental calculation, estimation, and assessment of the reasonableness of results.4 The uncertainty and data content subscale is based on the theory of probability and statistics and includes recognizing the place of variation in processes, having a sense of the quantification of that variation, acknowledging uncertainty and error in measurement, and knowing about chance.NOTE: Shown are the scores for the four PISA mathematics content subscales. Each PISA assessment item is classified into one of four related content domains, as well as one of three mathematical processes (formulating, employing, and interpreting).SOURCE: Organization for Economic Cooperation and Development, Program for International Student Assessment (PISA), 2012.
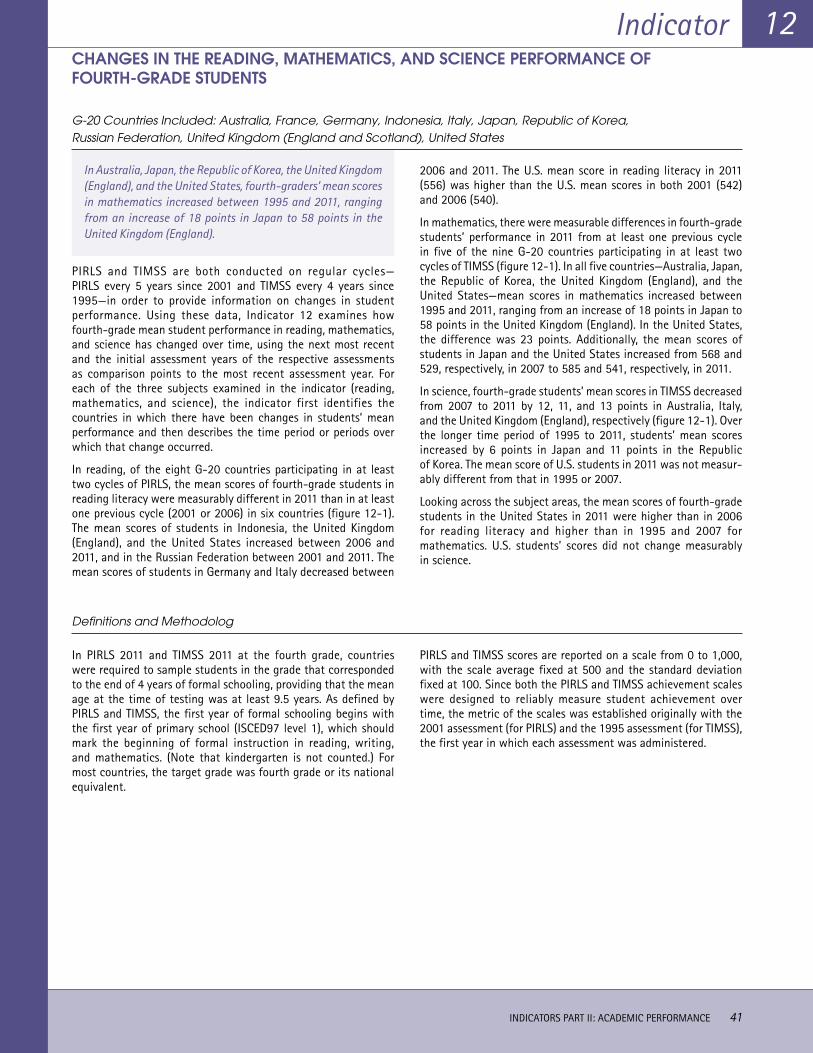
Indicator
INDICATORS PART II: ACADEMIC PERFORMANCE 41
12CHANGES IN THE READING, MATHEMATICS, AND SCIENCE PERFORMANCE OF FOURTH-GRADE STUDENTS
G-20 Countries Included: Australia, France, Germany, Indonesia, Italy, Japan, Republic of Korea, Russian Federation, United Kingdom (England and Scotland), United States
In Australia, Japan, the Republic of Korea, the United Kingdom (England), and the United States, fourth-graders’ mean scores in mathematics increased between 1995 and 2011, ranging from an increase of 18 points in Japan to 58 points in the United Kingdom (England).
PIRLS and TIMSS are both conducted on regular cycles— PIRLS every 5 years since 2001 and TIMSS every 4 years since 1995—in order to provide information on changes in student performance. Using these data, Indicator 12 examines how fourth-grade mean student performance in reading, mathematics, and science has changed over time, using the next most recent and the initial assessment years of the respective assessments as comparison points to the most recent assessment year. For each of the three subjects examined in the indicator (reading, mathematics, and science), the indicator first identifies the countries in which there have been changes in students’ mean performance and then describes the time period or periods over which that change occurred.
In reading, of the eight G-20 countries participating in at least two cycles of PIRLS, the mean scores of fourth-grade students in reading literacy were measurably different in 2011 than in at least one previous cycle (2001 or 2006) in six countries (figure 12-1). The mean scores of students in Indonesia, the United Kingdom (England), and the United States increased between 2006 and 2011, and in the Russian Federation between 2001 and 2011. The mean scores of students in Germany and Italy decreased between
2006 and 2011. The U.S. mean score in reading literacy in 2011 (556) was higher than the U.S. mean scores in both 2001 (542) and 2006 (540).
In mathematics, there were measurable differences in fourth-grade students’ performance in 2011 from at least one previous cycle in five of the nine G-20 countries participating in at least two cycles of TIMSS (figure 12-1). In all five countries—Australia, Japan, the Republic of Korea, the United Kingdom (England), and the United States—mean scores in mathematics increased between 1995 and 2011, ranging from an increase of 18 points in Japan to 58 points in the United Kingdom (England). In the United States, the difference was 23 points. Additionally, the mean scores of students in Japan and the United States increased from 568 and 529, respectively, in 2007 to 585 and 541, respectively, in 2011.
In science, fourth-grade students’ mean scores in TIMSS decreased from 2007 to 2011 by 12, 11, and 13 points in Australia, Italy, and the United Kingdom (England), respectively (figure 12-1). Over the longer time period of 1995 to 2011, students’ mean scores increased by 6 points in Japan and 11 points in the Republic of Korea. The mean score of U.S. students in 2011 was not measur-ably different from that in 1995 or 2007.
Looking across the subject areas, the mean scores of fourth-grade students in the United States in 2011 were higher than in 2006 for reading literacy and higher than in 1995 and 2007 for mathematics. U.S. students’ scores did not change measurably in science.
Definitions and Methodolog
In PIRLS 2011 and TIMSS 2011 at the fourth grade, countries were required to sample students in the grade that corresponded to the end of 4 years of formal schooling, providing that the mean age at the time of testing was at least 9.5 years. As defined by PIRLS and TIMSS, the first year of formal schooling begins with the first year of primary school (ISCED97 level 1), which should mark the beginning of formal instruction in reading, writing, and mathematics. (Note that kindergarten is not counted.) For most countries, the target grade was fourth grade or its national equivalent.
PIRLS and TIMSS scores are reported on a scale from 0 to 1,000, with the scale average fixed at 500 and the standard deviation fixed at 100. Since both the PIRLS and TIMSS achievement scales were designed to reliably measure student achievement over time, the metric of the scales was established originally with the 2001 assessment (for PIRLS) and the 1995 assessment (for TIMSS), the first year in which each assessment was administered.

42 INDICATORS PART II: ACADEMIC PERFORMANCE
Indicator 12Figure 12-1. Changes in fourth-grade average scores in reading, mathematics, and science, by country: Selected
years, 1995−2011
0
100
200
300
400
500
1,000
Average score
600
France
Country
Germany Indonesia1 Italy Russian Federation U.K. (England) U.K. (Scotland)1 United States
20062001
Reading
2011
525 522 520 539 548* 541
405*
541568565
528*541551*
428
556540*542*527528552539*553
20071995
Mathematics
2011
0
100
200
300
400
500
1,000
Average score
600
Australia
Country
Germany2 Italy2 Japan Republic of Korea2
RussianFederation2
U.K.(England)
UnitedStates
495* 516 516 525 528507
567*544
605581*585568*
508 529*518*494493
542541
484*
542
U.K.(Scotland)2
541
0
100
200
300
400
500
1,000
Average score
600
Australia
Country
Germany2 Italy2 Japan Republic of Korea2
RussianFederation2
U.K.(England)
UnitedStates
U.K.(Scotland)2
20071995
Science
2011
521 527* 516 528 528 535* 553* 546587576*559548*
524 539542500514529542*528
552 544
* p < .05. Score is statistically different from the 2011 score of the same country.1 Indonesia did not participate in PIRLS 2001, and United Kingdom (Scotland) did not participate in 2011.2 Germany, Italy, and the Russian Federation did not participate in TIMSS 1995; the Republic of Korea in 2007; and the United Kingdom (Scotland) in 2011.NOTE: Australia, Japan, and the Republic of Korea do not have data from at least two administrations of PIRLS; and France and Indonesia do not have data from at least two administrations of TIMSS at the fourth grade and so they do not appear in the associated panels in the figure.SOURCE: International Association for the Evaluation of Educational Achievement (IEA) Progress in International Reading Literacy Study (PIRLS), 2001, 2006, and 2011, and Trends in International Mathematics and Science Study (TIMSS), 1995, 2007, and 2011.

Indicator
INDICATORS PART II: ACADEMIC PERFORMANCE 43
13CHANGES IN THE MATHEMATICS AND SCIENCE PERFORMANCE OF EIGHTH-GRADE STUDENTS
G-20 Countries Included: Australia, Indonesia, Italy, Japan, Republic of Korea, Russian Federation, Saudi Arabia, Turkey, United Kingdom (England and Scotland), United States
Eighth-grade students’ mean scores in both mathematics and science increased between 1995 and 2011 in the United States; between 2007 and 2011 in Saudi Arabia and Turkey; and between both 1995 and 2007 and 2011 in the Republic of Korea and the Russian Federation.
In order to provide information on changes in student perfor- mance, TIMSS has been conducted every 4 years since 1995. Drawing on these data, Indicator 13 examines how eighth-grade mean student performance in mathematics and science in 2011 (the most recent assessment year) has changed since 2007 (the next most recent assessment year) and 1995 (the initial assess- ment year). For each subject, the indicator first identifies the countries in which there have been changes in students’ mean performance and then describes the time period or periods over which that change occurred.
Eighth-grade students’ mean scores in 2011 in both mathematics and science increased from 1995 in the United States; from 2007 in Saudi Arabia and Turkey; and from both 1995 and 2007 in the Republic of Korea and the Russian Federation.
In mathematics, there were measurable differences over time in 7 of the 11 G-20 countries participating in at least two cycles of eighth-grade TIMSS; most of the differences were in the direction of growth (figure 13-1). In the Republic of Korea and the Russian Federation, eighth-grade students’ mean scores were higher in 2011 than in both 1995 and 2007. In Italy, Saudi Arabia, and Turkey, students’ mean scores were higher in 2011 than in 2007, and in
the United States, students’ mean scores were higher in 2011 than in 1995. The U.S. mean score increased 17 points, from 492 to 509, between 1995 and 2011. In comparison, the increases in students’ mean scores were 15 and 32 points for the Russian Federation and the Republic of Korea, respectively, over this time period. The largest increase among the G-20 countries was in Saudi Arabia, where students’ mean score in mathematics increased 64 points, from 329 to 394, between 2007 and 2011. The mean score of students in Japan decreased 11 points between 1995 and 2011.
In science, there were measurable differences over time in 6 of the 11 G-20 countries participating in at least two cycles of eighth-grade TIMSS, with most of the differences again in the direction of growth (figure 13-1). Again, in the Republic of Korea and the Russian Federation, eighth-grade students’ mean scores were higher in 2011 than in both 1995 and 2007. In Saudi Arabia and Turkey, students’ mean scores were higher in 2011 than in 2007, and in the United States, students’ mean scores were higher in 2011 than in 1995. The U.S. mean score increased 12 points, from 513 to 525, between 1995 and 2011. In compar- ison, the increases in students’ mean scores were 14 and 20 points for the Republic of Korea and the Russian Federation, respectively, over this time period. The largest increase among the G-20 countries was in Saudi Arabia, where students’ mean score in science increased 33 points, from 403 to 436, between 2007 and 2011. The mean score of students in Indonesia decreased 21 points between 2007 and 2011.
Definitions and Methodolog
In TIMSS 2011 at the eighth grade, countries were required to sample students in the grade that corresponded to the end of 8 years of formal schooling (the end of primary school), providing that the mean age at the time of testing was at least 13.5 years. As defined by TIMSS, the first year of formal schooling begins with the first year of primary school (ISCED97 level 1), which should mark the beginning of formal instruction in reading, writing, and mathematics. (Note that kindergarten is not counted.) For most countries, the target grade was eighth grade or its national equivalent.
TIMSS scores are reported on a scale from 0 to 1,000, with the scale average fixed at 500 and the standard deviation fixed at 100. Since the TIMSS achievement scales were designed to reliably measure student achievement over time, the metric of the scales was established originally in 1995, the first year in which the assessment was administered.

44 INDICATORS PART II: ACADEMIC PERFORMANCE
Indicator 13
Figure 13-1. Changes in eighth-grade average scores in mathematics and science, by country: 1995, 2007, and 2011
0
100
200
300
400
500
1,000
Average score
600
20071995
Mathematics
2011
Country
Australia Indonesia1 Italy Japan Turkey1 U.K.(England)
Republic ofKorea
RussianFederation
U.K. (Scotland)1
UnitedStates
509 496 505
386397
613597*581*570570581*
491 480*498
524* 507487493
452432*
513498512*539
394
329*
492*508 509
0
100
200
300
400
500
1,000
Average score
600
20071995
Science
2011
Country
Australia Indonesia1 Italy Japan Turkey1 U.K.(England)
Republic ofKorea
RussianFederation
U.K. (Scotland)1
UnitedStates
Saudi Arabia1
514 515 519
406427*
560553*546*558554554
497 495 501523* 533
496501483
454*
542533530* 542
436403*
513* 520 525
Saudi Arabia1
* p < .05. Score is statistically significant from the 2011 score of the same country.1 Indonesia, Saudi Arabia, and Turkey did not participate in TIMSS 1995, and the United Kingdom (Scotland) did not participate in TIMSS 2011.SOURCE: International Association for the Evaluation of Educational Achievement (IEA), Trends in International Mathematics and Science Study (TIMSS), 1995, 2007, and 2011.

Indicator
14CHANGES IN 15-YEAR-OLDS’ PERFORMANCE IN READING, MATHEMATICS, AND SCIENCE LITERACY
G-20 Countries Included: Argentina, Australia, Brazil, Canada, France, Germany, Indonesia, Italy, Japan, Mexico, Republic of Korea, Russian Federation, Turkey, United Kingdom, United States
In science, there were fewer observed differences in 15-year-olds’ performance over time than in reading or mathematics, with 11 countries (including the United States) showing no measurable change from 2006 or 2009 to 2012.
In order to provide information on changes in student performance, PISA has been conducted every 3 years since 2000. Drawing on these data, Indicator 14 examines how the mean performance of 15-year-old students in reading, mathematics, and science literacy in 2012 (the most recent assessment year) has changed since 2009 (the next most recent assessment year) and the initial year in which the subject was a major domain (2000 for reading, 2003 for mathematics, and 2006 for science). For each subject, the indicator first identifies the countries in which there have been changes in students’ mean scores and then describes the time period or periods over which that change occurred.
In reading literacy, there were differences in mean scores over time in 11 of the 15 G-20 countries participating in at least two cycles of PISA; most of the differences were in the direction of growth (figure 14-1). In 6 countries (Brazil, Germany, Indonesia, Japan, the Republic of Korea, and the Russian Federation), students’ mean scores were higher in 2012 than in 2000. In 3 of these countries (Germany, Japan, and the Russian Federation), scores were also higher in 2012 than in 2009, as they were in France and Turkey. Students’ mean scores decreased in Argentina, Australia, and Canada from 2000 to 2012. There were no measurable changes in the reading literacy scores of 15-year-olds in Italy, Mexico, and the United States over either time period.
In mathematics literacy, there were differences in mean scores over time in 11 of the 15 G-20 countries participating in at least two cycles of PISA, with most of the differences again in the direction of growth. In 8 countries (Brazil, Germany, Indonesia, Italy, Mexico, the Republic of Korea, the Russian Federation, and Turkey), students’ mean scores were higher in 2012 than in 2003. The Russian Federation was the only participating country with a higher score in 2012 than in 2009. Students’ mean scores decreased in Australia and Canada over both time periods (from 2003 and 2009 to 2012), in France from 2003 to 2012, and in Mexico from 2009 to 2012. There were no measurable changes in the mathematics literacy scores of 15-year-olds in Japan or the United States over either time period, nor in Argentina and the United Kingdom between 2009 and 2012. (Neither of the latter countries have data for the 2003 to 2012 period.)
In science literacy, there were fewer differences in mean scores over time than in the other subjects. Only in Brazil, Italy, Japan, the Republic of Korea, and Turkey did 15-year-old students’ mean scores increase, and the increase occurred over only one time period (from 2006 to 2012). Canadian students’ mean scores, in contrast, decreased from 2006 to 2012. Again, there were no measurable changes in the science literacy scores of U.S. students and those in 10 other countries.
Looking across subject areas, Brazil, the Republic of Korea, and Turkey showed increases in students’ mean scores over time in all three subject areas, and five countries (Germany, Indonesia, Italy, Japan, and the Russian Federation) showed increases in two subjects. In Canada, students’ mean scores decreased in all three subjects over time and Australia showed decreases in two subjects.
Definitions and Methodolog
In PISA 2012, countries were required to sample students who were between the ages of 15 years and 3 months and 16 years and 2 months at the time of the assessment and who had completed at least 6 years of formal schooling, regardless of the type of institution in which they were enrolled.
PISA scores are reported on a scale from 0 to 1,000, with the scale average fixed at 500 and the standard deviation fixed at 100. The PISA achievement scales were designed to reliably measure student achievement over time, and the metric of the scales was established for reading in 2000, mathematics in 2003, and science in 2006.
INDICATORS PART II: ACADEMIC PERFORMANCE 45

46 INDICATORS PART II: ACADEMIC PERFORMANCE
Indicator 14
Figure 14-1. Changes in 15-year-olds’ average scores in reading, mathematics, and science literacy by country: Selected years, 2000−2012
0
100
200
300
400
500
1,000
Average score
Argentina
Country
20092000
Reading literacy
418*
600
2012
Australia Brazil Canada France Germany Indonesia Italy Japan Mexico Republic ofKorea
RussianFederation
Turkey United Kingdom
UnitedStates
398396
528*515512
396*412 410
534*524 523505496*505
484*497*508
371*402 396
487 486 490522*520*
538 525*
422
539536
425 424
462* 464*475459*475494 499 504 500498
20092003
Mathematics literacy
2012
0
100
200
300
400
500
1,000
Average score
600
Argentina
Country
Australia Brazil Canada France Germany Indonesia Italy Japan Mexico Republic ofKorea
RussianFederation
Turkey United Kingdom
UnitedStates
388 388
524*514*504
356*386 391
532*527*518 511*497495 503*513 514
360* 371375
466*483 485
534529 536 542*
385*
546554
419*413
468*445 448
468*482 492494 483 487 481
423*
20092006
Science literacy
2012
0
100
200
300
400
500
1,000
Average score
600
Argentina
Country
Australia Brazil Canada France Germany Indonesia Italy Japan Mexico Republic ofKorea
RussianFederation
Turkey United Kingdom
UnitedStates
391 406
527 527521
390*405405
534*529 525495498499
516520 524
393383 382
475*489494
531* 539547522*
410
538538
416415
479454463478486
514514489 502497
424*401
515
* p < .05. Score is statistically significant from the 2012 score of the same country.— Not available. NOTE: Data are shown for the first year a subject area was a major domain as well as the two most recent cycles.SOURCE: Organization for Economic Cooperation and Development, Program for International Student Assessment (PISA), 2000, 2003, 2006, 2009, and 2012.

INDICATORS PART IIIINDICATORS PART IIIContexts for Learning
The indicators in this section address a range of policy-relevant issues pertaining to the contexts for learning across the G-20 countries. This section presents data on differences between males’ and females’ attitudes toward learning across the grades, as well on teachers’ reports of their instructional strategies, opportunities for collaboration and professional development, and job satisfaction and morale.
• Indicators 15–17 describe students’ attitudes toward learning, including fourth-graders’ attitudes toward reading (indicator 15), fourth- and eighth-graders’ and 15-year-olds’ interest in mathematics (indicator 16), and fourth- and eighth-graders’ interest in science (indicator 17). These indicators focus on the differences in attitudes between girls and boys.
• Indicators 18–21 are based on teachers’ reports and focus on teachers’ behaviors and opportunities. Indicator 18 presents data on the strategies that fourth-grade teachers use to assist students having difficulty reading. Indicator 19 examines the extent to which fourth- and eighth-grade teachers collaborate in mathematics instruction. Indicators 20 and 21 present data on teachers’ self-reports of participation in professional development in mathematics and science, respectively.
• Indicator 22 reports on teachers’ perceptions related to work, namely, on fourth-grade teachers’ career satisfaction and changes in satisfaction over time.
The indicators in this section draw on data from the student and teacher background questionnaires from PIRLS, TIMSS, and PISA.

Indicator
15GENDER DIFFERENCES IN STUDENTS’ ATTITUDES TOWARD READING
G-20 Countries Included: Australia, Canada, France, Germany, Indonesia, Italy, Russian Federation, Saudi Arabia, United Kingdom (England and Northern Ireland), United States
In all G-20 countries, higher percentages of fourth-grade females than males liked reading, with differences ranging from 8 percentage points in France to 25 percentage points in Saudi Arabia.
This indicator examines the differences between fourth-grade male and female students’ attitudes toward reading across the participating G-20 countries. It is based on three indices formed using data from PIRLS 2011: the Like to Read index, the Motivated to Read index, and the Confident in Reading index. Each index places students into one of three categories based on whether they agreed a lot, agreed a little, disagreed a little, or disagreed a lot with the statements described in “Definitions and Methodology” below. For instance, the Like to Read index categorizes students into those who like reading, somewhat like reading, and do not liking reading. This indicator presents data only for students in the highest category (e.g., like reading) in each index.
In all G-20 countries, higher percentages of fourth-grade females than males liked reading, with differences ranging from 8 percentage points in France to 25 percentage points in Saudi Arabia (figure 15-1). In the United States, the difference between females and males was 13 percentage points. Thirty-three percent of fourth-grade females in the United States liked reading, which was lower than in Canada, Germany, Indonesia, and Saudi Arabia. Twenty percent of U.S. fourth-grade males liked reading, which was lower than in Australia, Canada, France, Germany, and Indonesia, but higher than in Italy and Saudi Arabia.
In all G-20 countries except Indonesia, there were differences in the percentages of females and males who were motivated to read. In the 10 remaining countries, a higher percentage of
females than males were motivated to read, although the differences (ranging from 4 percentage points in France to 16 percentage points in Saudi Arabia) were generally smaller than for those who liked reading (figure 15-2). In the United States, the difference between females and males was 7 percentage points. Seventy-four percent of fourth-grade females in the United States were motivated to read, which was lower than in Indonesia, the Russian Federation, and Saudi Arabia, but higher than in France, Germany, Italy, and the United Kingdom (England and Northern Ireland). Among males, 67 percent of U.S. fourth-graders were motivated to read, which, as for females, was lower than in Indonesia, the Russian Federation, and Saudi Arabia. However, the U.S. percentage for males was higher than the percentages in Italy and the United Kingdom (England and Northern Ireland).
In 8 of the 11 participating G-20 countries, higher percentages of fourth-grade females than males expressed confidence in reading, with differences ranging from 5 percentage points in Canada to 20 percentage points in Saudi Arabia (figure 15-3). The difference between the percentages of U.S. females and males who expressed confidence in reading was 6 percentage points. The percentages of both females and males in the United States who had confidence in reading were among the highest in the participating G-20 countries. Forty-three percent of females in the United States had confidence in reading, lower only than in Germany and Saudi Arabia and higher than in Australia, France, Indonesia, Italy, the Russian Federation, and the United Kingdom (England). Thirty-seven percent of males in the United States had confidence in reading, lower only than in Germany and higher than in France, Indonesia, Italy, the Russian Federation, Saudi Arabia, and the United Kingdom (Northern Ireland).
Definitions and Methodolog
This indicator is based on three indices formed using data from the PIRLS 2011 student questionnaire. The questionnaire obtained information about students’ home and school lives, including basic demographic information as well as information about students’ home environments, school climate for learning, and self-perception and attitudes toward reading.
Students were assessed on whether they liked reading based on the extent of their agreement with the following statements—I read only if I have to; I like talking about what I read with other people; I would be happy if someone gave me a book as a present; I think reading is boring; I would like to have more time for reading; and I enjoy reading—as well as on how often they reported reading for fun and reading things they chose themselves outside of school. To determine whether students were motivated to read, students were asked to rate their agreement with the following statements: I like to read things that make me think; it is important to be a good reader; my parents like it when I read; I learn a lot from reading; I need to read well for my future; and I like it when a book helps
me imagine other worlds. To determine students’ confidence in reading, students were asked to rate their agreement with the following statements: I usually do well in reading; reading is easy for me; reading is harder for me than for many of my classmates; if a book is interesting, I don’t care how hard it is to read; I have trouble reading stories with difficult words; my teacher tells me I am a good reader; and reading is harder for me than any other subject.
In PIRLS 2011 in the fourth grade, countries were required to sample students in the grade that corresponded to the end of 4 years of formal schooling, providing that the mean age at the time of testing was at least 9.5 years. As defined by PIRLS, the first year of formal schooling begins with the first year of primary school (ISCED97 level 1), which should mark the beginning of formal instruction in reading, writing, and mathematics. (Note that kindergarten is not counted.) For most countries, the target grade was fourth grade or its national equivalent.
48 INDICATORS PART III: CONTEXTS FOR LEARNING

Indicator
INDICATORS PART III: CONTEXTS FOR LEARNING 49
15
Figure 15-1. Percentage of fourth-grade students who liked reading, based on the Students Like to Read Index, by sex and country: 2011
0
20
40
60
80
100
Percent
Australia Canada Germany Indonesia Italy RussianFederation
U.K. (England)
UnitedStates
Country
FemaleMale
France SaudiArabia
U.K. (N. Ireland)
3643*
3642*
38*
30 3238*
3437
33
20211913*
2015*
27*26*28*27*23*
* p < .05. Percentage is significantly different from the percentage of students of the same sex in the United States.NOTE: The difference between female and male students is statistically significant in all countries. The Students Like to Read Index is based on the extent of fourth-grade students’ agreement with the following statements—(1) I read only if I have to; (2) I like talking about what I read with other people; (3) I would be happy if someone gave me a book as a present; (4) I think reading is boring; (5) I would like to have more time for reading; and (6) I enjoy reading—as well as on how often they reported (1) reading for fun and (2) reading things they chose themselves outside of school. This indicator presents data only for students in the highest category: like reading. The other categories (not shown) are somewhat like reading and do not like reading.SOURCE: International Association for the Evaluation of Educational Achievement (IEA), Progress in International Reading Literacy Study (PIRLS), 2011.
Figure 15-2. Percentage of fourth-grade students who were motivated to read, based on the Students Motivated to Read Index, by sex and country: 2011
0
20
40
60
80
100
Percent
Australia Canada Germany Indonesia Italy RussianFederation
U.K. (England)
UnitedStates
Country
FemaleMale
France SaudiArabia
U.K. (N. Ireland)
74
68 68
75
66
70*
65
71*90*
92*
67*
57*
86*
80*
90*
74*68*
62*
70*
60*
74
67
* p < .05. Percentage is significantly different from the percentage of students of the same sex in the United States.NOTE: The difference between female and male students is statistically significant in all countries except Indonesia. The Students Motivated to Read Index is based on fourth-grade students’ reports of the extent of their agreement with the following statements about reading: (1) I like to read things that make me think; (2) It is important to be a good reader; (3) My parents like it when I read; (4) I learn a lot from reading; (5) I need to read well for my future; and (6) I like it when a book helps me imagine other worlds. This indicator presents data only for students in the highest category: motivated. The other categories (not shown) are somewhat motivated and not motivated.SOURCE: International Association for the Evaluation of Educational Achievement (IEA), Progress in International Reading Literacy Study (PIRLS), 2011.

50 INDICATORS PART III: CONTEXTS FOR LEARNING
Indicator 15
Figure 15-3. Percentage of fourth-grade students who expressed confidence in reading, based on the Students Confident in Reading Index, by sex and country: 2011
0
20
40
60
80
100
Percent
Australia Canada Germany Indonesia Italy RussianFederation
U.K. (England)
UnitedStates
Country
FemaleMale
France SaudiArabia
U.K. (N. Ireland)
36
39*43
38 27*
26*
42*
49*
37*
30*
31*
25*
33*
22*
48*
28*
38*
36
40
30*
43
37
* p < .05. Percentage is significantly different from the percentage of students of the same sex in the United States.NOTE: The difference between female and male students is statistically significant in all countries except Australia, France, and the United Kingdom (England). The Students Confident in Reading Index is based on fourth-grade students’ reports of the extent of their agreement with the following statements about reading: (1) I usually do well in reading; (2) Reading is easy for me; (3) Reading is harder for me than for many of my classmates; (4) If a book is interesting, I don’t care how hard it is to read; (5) I have trouble reading stories with difficult words; (6) My teacher tells me I am a good reader; and (7) Reading is harder for me than any other subject. This indicator presents data only for students in the highest category: confident. The other categories (not shown) are somewhat confident and not confident.SOURCE: International Association for the Evaluation of Educational Achievement (IEA), Progress in International Reading Literacy Study (PIRLS), 2011.

Indicator
INDICATORS PART III: CONTEXTS FOR LEARNING 51
16GENDER DIFFERENCES IN STUDENTS’ ATTITUDES TOWARD MATHEMATICS
G-20 Countries Included: Argentina, Australia, Brazil, Canada, France, Germany, Indonesia, Italy, Japan, Mexico, Republic of Korea, Russian Federation, Saudi Arabia, Turkey, United Kingdom,7 United States
In six G-20 countries (including the United States), higher percentages of eighth-grade males than females liked math-ematics, with differences ranging from 2 percentage points in the United States to 8 percentage points in Japan.
This indicator examines the differences between male and female students’ attitudes toward mathematics across the G-20 countries that participated in TIMSS 2011 and PISA 2012. For fourth- and eighth-graders, it is based on an index formed using data from TIMSS 2011: the Students Like Learning Mathematics index. This index placed students into one of three categories (like learning mathematics, somewhat like learning mathematics, and do not liking learning mathematics) based on whether they agreed a lot, agreed a little, disagreed a little, or disagreed a lot with the statements listed in “Definitions and Methodology” below. The data in this indicator are for the highest category (i.e., like learning mathematics) in the index. For 15-year-olds, the data are based on a question from PISA 2012 that asked students about their intrinsic motivation to learn. The question asked students whether they strongly agreed, agreed, disagreed, or strongly disagreed with the following statement: I am interested in the things I learn in mathematics. The indicator reports the percentage of students who agreed or strongly agreed with this statement.
Looking across the TIMSS and PISA data, there are four countries (among those that participated in both assessments) in which higher percentages of males than females liked mathematics or were interested in what they learned in mathematics: Australia, Italy, Japan, and the Republic of Korea. In contrast, in the United States, there were small or no differences between the percent-ages of male and female fourth- and eighth-graders who liked mathematics, but a 7-point difference between the percentages of male and female 15-year-olds who were interested in what they learned in mathematics (with males being more interested).
In 7 of 11 participating G-20 countries, there were differences in the percentage of fourth-grade males and females who liked mathematics. In five countries (Australia, Germany, Italy, Japan, and the Republic of Korea), higher percentages of fourth-grade males than females liked mathematics, with differences ranging from 5 percentage points in Italy to 13 percentage points in
Germany (figure 16-1). In two countries, Saudi Arabia and Turkey, higher percentages of females than males liked mathematics (by 20 and 6 percentage points, respectively). Forty-five percent of fourth-grade males in the United States liked mathematics, which was lower than in Italy, the Russian Federation, and Turkey and higher than in Japan, the Republic of Korea, and the United Kingdom (Northern Ireland). Forty-four percent of U.S. fourth-grade females liked mathematics, which was lower than in Italy, the Russian Federation, Saudi Arabia, and Turkey and higher than in Germany, Japan, the Republic of Korea, and the United Kingdom (Northern Ireland).
In 7 of 10 G-20 countries, there were differences in the percent-ages of eighth-grade males and females who liked mathematics. In all of these countries except Turkey, higher percentages of males than females liked mathematics, with differences ranging from 2 percentage points in the United States to 8 percentage points in Japan (figure 16-2). (The other countries included Australia, Italy, the Republic of Korea, Turkey, and the United Kingdom [England].)
In 12 of 15 participating G-20 countries, higher percentages of 15-year-old males than females were interested in what they learned in mathematics, with differences ranging from 2 percentage points in Mexico to 17 percentage points in Germany (figure 16-3). The difference between the percentages of U.S. males and females who were interested in what they learned in mathematics was 7 percentage points. Fifty-three percent of males in the United States were interested in what they learned in mathematics, which was lower than in 12 countries and higher only than in Japan. Forty-seven percent of females in the United States were interested in what they learned in mathematics, which was lower than in nine countries, higher than in Japan, and not different from the percentage in the Republic of Korea. Twenty percent of eighth-grade males in the United States liked mathematics, which was lower than in the Russian Federation, Saudi Arabia, and Turkey and higher than in Japan, the Republic of Korea, and the United Kingdom (England). Among females, 18 percent of U.S. eighth-graders liked mathematics, which, as for males, was lower than in the Russian Federation, Saudi Arabia, and Turkey and higher than in Japan, the Republic of Korea, and the United Kingdom (England), as well as higher than in Australia and Italy.
Definitions and Methodolog
This indicator is based on data from the TIMSS 2011 and PISA 2012 student questionnaires. Both questionnaires obtained information about students’ home and school lives, including basic demographic information, as well as information about students’ home environ-ment, school climate for learning, and self-perception and attitudes toward mathematics.
In TIMSS, the Students Like Learning Mathematics index meas- ured how much students liked learning mathematics. The index placed students into one of three categories (like learning mathematics, somewhat like learning mathematics, and do not like learning mathematics) based on whether they agreed a lot, agreed a little, disagreed a little, or disagreed a lot with the
7 As noted in the introduction, the United Kingdom is treated as one country in PISA and separate entities (England and Northern Ireland, here) in TIMSS.

Indicator
52 INDICATORS PART III: CONTEXTS FOR LEARNING
16
following five statements: I enjoy learning mathematics; I wish I did not have to study mathematics; mathematics is boring; I learn many interesting things in mathematics; and I like mathematics.
In TIMSS 2011 at the fourth grade, countries were required to sample students in the grade that corresponded to the end of 4 years of formal schooling, providing that the mean age at the time of testing was at least 9.5 years. In TIMSS 2011 at the eighth grade, countries were required to sample students in the grade that corresponded to the end of 8 years of formal schooling, providing that the mean age at the time of testing was at least 13.5 years. As defined by TIMSS, the first year of formal schooling begins with the first year of primary school (ISCED97 level 1), which should mark the beginning of formal instruction in reading, writing, and mathematics. (Note that kindergarten is not counted.) For most countries, the target grades were fourth and eighth grades or their national equivalents.
In PISA, four questions were used to measure 15-year-olds’ intrinsic motivation to learn mathematics. The questions asked students whether they strongly agreed, agreed, disagreed, or strongly disagreed with the following statements: (a) I enjoy reading about mathematics; (b) I look forward to my mathematics lessons; (c) I do mathematics because I enjoy it; and (d) I am interested in the things I learn in mathematics. This analysis uses the percentage of students who agreed or strongly agreed with (d) I am interested in the things I learn in mathematics as a measure of students’ attitudes toward mathematics.
In PISA 2012, countries were required to sample students who were between the ages of 15 years and 3 months and 16 years and 2 months at the time of the assessment and who had completed at least 6 years of formal schooling, regardless of the type of institution in which they were enrolled.

Indicator
INDICATORS PART III: CONTEXTS FOR LEARNING 53
16
Figure 16-1. Percentage of fourth-grade students who liked learning mathematics, based on the Students Like Learning Mathematics index, by sex and country: 2011
0
20
40
60
80
100
Percent
Australia Germany Japan Republicof Korea
TurkeyRussianFederation
U.K. (England)
UnitedStates
Country
FemaleMale
Italy SaudiArabia
U.K. (N. Ireland)
43
48 48
35*
53*
48* 34*
24*
28*
19*
58*
57*
67*
47
73*
67*
45
4338*
35*
45
44
* p < .05. Percentage is significantly different from the percentage of students of the same sex in the United States.NOTE: The difference between female and male students is statistically significant in all countries except the Russian Federation, the United Kingdom (England and Northern Ireland), and the United States. The Students Like Learning Mathematics index is based on fourth-grade students’ reports of the extent of their agreement with the following statements: (1) I enjoy learning mathematics; (2) I wish I did not have to study mathematics; (3) Mathematics is boring; (4) I learn many interesting things in mathematics; and (5) I like mathematics. The index places students into one of three categories (like learning mathematics, somewhat like learning mathematics, and do not liking learning mathematics), but this indicator presents data only for students in the highest category of the index: like learning mathematics. Argentina, Brazil, Canada, France, Indonesia, and Mexico did not participate in TIMSS 2011 at the fourth grade.SOURCE: International Association for the Evaluation of Educational Achievement (IEA), Trends in International Mathematics and Science Study (TIMSS), 2011.
Figure 16-2. Percentage of eighth-grade students who liked learning mathematics, based on the Students Like Learning Mathematics index, by sex and country: 2011
0
20
40
60
80
100
Percent
Australia Indonesia Japan Republicof Korea
RussianFederation
Turkey UnitedStates
Country
FemaleMale
Italy SaudiArabia
U.K. (England)
14*
1822
19
21
14*
13*
5*
9*
6*
30*
29*
29*
28*
33*
30* 17*
11*
20
18
* p < .05. Percentage is significantly different from the percentage of students of the same sex in the United States.NOTE: The difference between female and male students is statistically significant in all countries except Indonesia, the Russian Federation, and Saudi Arabia. The Students Like Learning Mathematics index is based on eighth-grade students’ reports of the extent of their agreement with the following statements: (1) I enjoy learning mathematics; (2) I wish I did not have to study mathematics; (3) Mathematics is boring; (4) I learn many interesting things in mathematics; and (5) I like mathematics. The index places students into one of three categories (like learning mathematics, somewhat like learning mathematics, and do not liking learning mathematics), but this indicator presents data only for students in the highest category of the index: like learning mathematics. Argentina, Brazil, Canada, France, Germany, Mexico, and United Kingdom (Northern Ireland) did not participate in TIMSS 2011 at the eighth grade.SOURCE: International Association for the Evaluation of Educational Achievement (IEA), Trends in International Mathematics and Science Study (TIMSS), 2011.
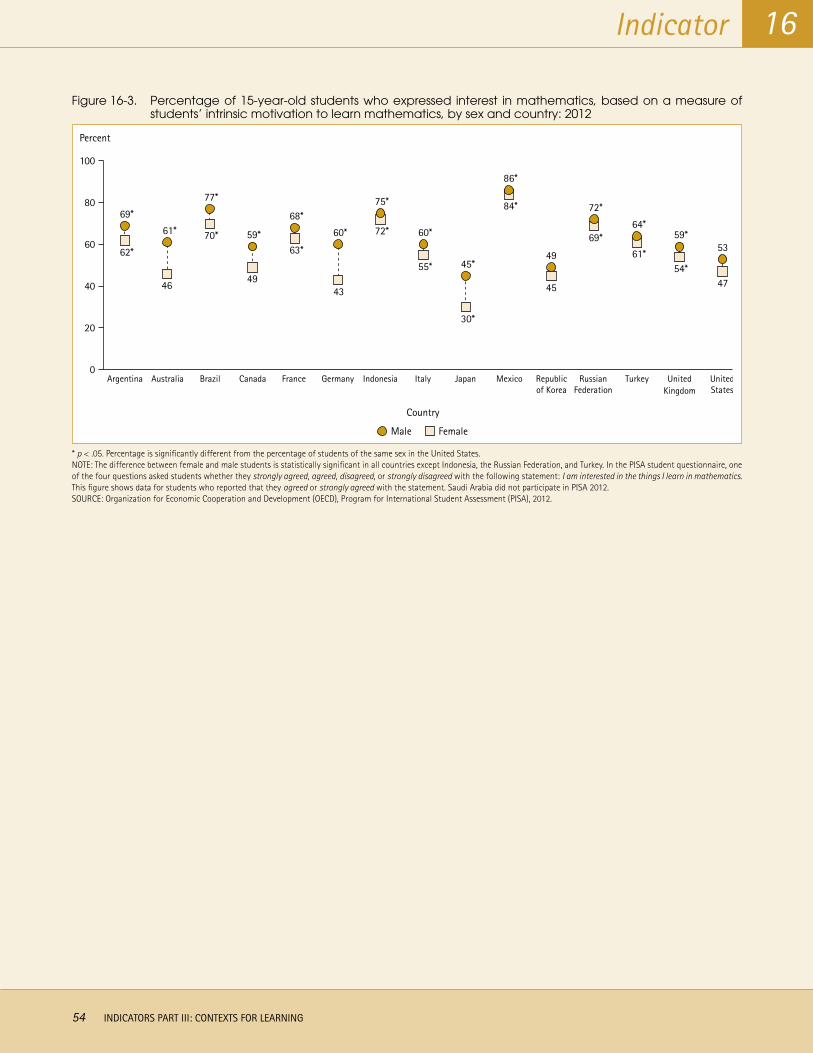
54 INDICATORS PART III: CONTEXTS FOR LEARNING
Indicator 16
Figure 16-3. Percentage of 15-year-old students who expressed interest in mathematics, based on a measure of students’ intrinsic motivation to learn mathematics, by sex and country: 2012
0
20
40
60
80
100
Percent
Argentina Canada Germany Indonesia Italy RussianFederation
UnitedStates
Country
FemaleMale
France Republicof Korea
UnitedKingdom
Australia Brazil TurkeyJapan Mexico
62*
69*
61*
46
77*
70* 59*
49
68*
63*
60*
43
75*
72* 60*
55* 45*
30*
86*
84*
49
45
72*
69*64*
61*
59*
54*
53
47
* p < .05. Percentage is significantly different from the percentage of students of the same sex in the United States.NOTE: The difference between female and male students is statistically significant in all countries except Indonesia, the Russian Federation, and Turkey. In the PISA student questionnaire, one of the four questions asked students whether they strongly agreed, agreed, disagreed, or strongly disagreed with the following statement: I am interested in the things I learn in mathematics.This figure shows data for students who reported that they agreed or strongly agreed with the statement. Saudi Arabia did not participate in PISA 2012.SOURCE: Organization for Economic Cooperation and Development (OECD), Program for International Student Assessment (PISA), 2012.

Indicator
INDICATORS PART III: CONTEXTS FOR LEARNING 55
17GENDER DIFFERENCES IN STUDENTS’ ATTITUDES TOWARD SCIENCE
G-20 Countries Included: Australia, Germany, Italy, Japan, Republic of Korea, Russian Federation, Saudi Arabia, Turkey, United Kingdom (England and Northern Ireland), United States
In fourth grade, 5 of the 11 participating G-20 countries (including the United States) showed no gender differences in the percentage of students who liked learning science. In eighth grade, higher percentages of males than females liked learning science in all participating G-20 countries except Turkey and Saudi Arabia.
This indicator examines differences between the percentages of males and females across the participating G-20 countries who reported they liked learning science. It is based on an index, Like Learning Science, formed using data from the TIMSS 2011 student questionnaire. The index placed students into one of three categories (like learning science, somewhat like learning science, and do not like learning science) based on whether they agreed a lot, agreed a little, disagreed a little, or disagreed a lot with the statements presented in “Definitions and Methodology” below. This indicator presents data only for students in the highest category: like learning science.
At the fourth-grade level, there were differences between the percentage of males and females who liked learning science in 6 of the 11 participating G-20 countries (figure 17-1). In Japan, the Republic of Korea, and the United Kingdom (England), higher percentages of males than females liked learning science, with differences ranging from 6 percentage points in the Republic of Korea to 12 percentage points in Japan. In the Russian Federation, Saudi Arabia, and Turkey, higher percentages of females than males liked learning science, with differences ranging from 7 percentage points in the Russian Federation to 22 percentage points in Saudi Arabia. In the United States, there was no measurable difference at the fourth-grade level between the percentages of males and females who liked learning science.
Fifty-seven percent of fourth-grade males in the United States liked learning science, which was lower than the percentage in Turkey and higher than the percentages in Italy, the Republic of Korea, Saudi Arabia, and the United Kingdom (England and Northern Ireland). Among females, there were more differences between countries in the degree to which fourth-grade students’ liked learning science. The percentage of U.S. fourth-grade females who liked learning science (55 percent) was higher than the percentages in Japan, the Republic of Korea, and the United Kingdom (England and Northern Ireland) and lower than the percentages in the Russian Federation, Saudi Arabia, and Turkey.
At the eighth-grade level, higher percentages of males than females liked learning science in all eight countries with data except Turkey (in which more females liked learning science) and Saudi Arabia (in where there were no gender differences) (figure 17-2). The largest difference between males and females was 12 percentage points, in Japan. In the United States, 33 percent of males liked learning science, compared to 25 percent of females.
Compared to other countries, the percentage of eighth-grade males in the United States who liked learning science was lower than the percentages in Saudi Arabia, Turkey, and the United Kingdom (England), and higher than the percentages in Italy, Japan, and the Republic of Korea. A lower percentage of females in the United States than in Saudi Arabia and Turkey liked learning science, and a higher percentage of females in the United States than in Australia, Italy, Japan and the Republic of Korea did so.
Definitions and Methodolog
This indicator is based on an index formed using data from the TIMSS 2011 student questionnaire. The questionnaire obtained information about students’ home and school lives, including basic demographic information, as well as information about students’ home environment, school climate for learning, and self-perception and attitudes toward mathematics and science.
The Students Like Learning Science index measures how much students like learning science. The index placed students into one of three categories (like learning science, somewhat like learning science, and do not like learning science) based on whether they agreed a lot, agreed a little, disagreed a little, or disagreed a lot with the following five statements: I enjoy learning science; I wish I did not have to study science; science is boring; I learn many interesting things in science; and I like science.
In TIMSS 2011 at the fourth grade, countries were required to sample students in the grade that corresponded to the end of 4 years of formal schooling, providing that the mean age at the time of testing was at least 9.5 years. In TIMSS 2011 at the eighth grade, countries were required to sample students in the grade that corresponded to the end of 8 years of formal schooling, providing that the mean age at the time of testing was at least 13.5 years. As defined by TIMSS, the first year of formal schooling begins with the first year of primary school (ISCED97 level 1), which should mark the beginning of formal instruction in reading, writing, and mathematics. (Note that kindergarten is not counted.) For most countries, the target grades were fourth and eighth grades or their national equivalents.

56 INDICATORS PART III: CONTEXTS FOR LEARNING
Indicator 17
Figure 17-1. Percentage of fourth-grade students who liked learning science, based on the Students Like Learning Science Index, by sex and country: 2011
0
20
40
60
80
100
Percent
Australia Germany Japan Republicof Korea
RussianFederation
SaudiArabia
U.K. (England)
UnitedStates
Country
FemaleMale
Italy Turkey U.K. (N. Ireland)
55
56 58
5853
50*
58
46*42*
36*
66*
59
71*
49*
78*
68*
47*
40*
51*
50*
57
55
* p< .05. Percentage is significantly different from the percentage of students of the same sex in the United States.NOTE: The difference between female and male students is statistically significant in all countries except Australia, Germany, Italy, the United Kingdom (Northern Ireland), and the United States. The Students Like Learning Science Index is based on fourth-grade students’ reports of the extent of their agreement with the following statements: (1) I enjoy learning science; (2) I wish I did not have to study science; (3) Science is boring; (4) I learn many interesting things in science; and (5) I like science. This indicator presents data only for students in the highest category: like learning science. The other categories (not shown) are somewhat like learning science and do not like learning science. Indonesia did not participate in TIMSS 2011 at the fourth grade.SOURCE: International Association for the Evaluation of Educational Achievement (IEA), Trends in International Mathematics and Science Study (TIMSS), 2011.
Figure 17-2. Percentage of eighth-grade students who liked learning science, based on the Students Like Learning Science Index, by sex and country: 2011
0
20
40
60
80
100
Percent
Australia Italy Japan Republicof Korea
U.K. (England)
UnitedStates
Country
FemaleMale
SaudiArabia
Turkey
21*
29
22*
29*
21*
9*
14*
8*
46*
44* 44*
53*
37*
27
33
25
* p < .05. Percentage is significantly different from the percentage of students of the same sex in the United States.NOTE: The difference between female and male students is statistically significant in all countries except Saudi Arabia. The Students Like Learning Science Index is based on eighth-grade students’ reports of the extent of their agreement with the following statements: (1) I enjoy learning science; (2) I wish I did not have to study science; (3) Science is boring; (4) I learn many interesting things in science; and (5) I like science. This indicator presents data only for students in the highest category: like learning science. The other categories (not shown) are somewhat like learning science and do not like learning science. Germany and the United Kingdom (Northern Ireland) did not participate in TIMSS 2011 at eighth grade. Data for Indonesia or the Russian Federation are not available because while these countries did administer TIMSS 2011 at the eighth grade, these survey questions were not asked. In these countries, science is taught as individual subjects (e.g., biology, chemistry). SOURCE: International Association for the Evaluation of Educational Achievement (IEA), Trends in International Mathematics and Science Study (TIMSS), 2011.

Indicator
18FOURTH-GRADE TEACHERS’ STRATEGIES FOR ASSISTING STUDENTS HAVING DIFFICULTY READING
G-20 Countries Included: Australia, Canada, France, Germany, Indonesia, Italy, Russian Federation, Saudi Arabia, United Kingdom (England and Northern Ireland), United States
The United States had the largest percentage of fourth-graders whose teachers indicated that specialists were always avail-able to assist students with their reading (45 percent), as well the smallest percentage of fourth-graders whose teachers indicated that specialists were never available (12 percent).
Using data from PIRLS 2011, this indicator presents teachers’ reports about the strategies that they used to help fourth-graders having difficulty reading. Teachers were given a list of strategies and asked whether each one was used if a student begins to fall behind in reading. This indicator focuses on three strategies in particular: asking parents to help their child with reading, working with students individually, and waiting and seeing if performance improved with maturation. The indicator also addresses the avail-ability of a specialized professional to work with students who have difficulty reading
The percentage of fourth-graders whose teachers reported asking parents to help their child with reading ranged from 88 percent in France to 100 percent in Germany and the Russian Federation (figure 18-1). Ninety-five percent of U.S. fourth-graders had teachers who reported using this strategy. The percentage of fourth-graders whose teachers reported working with students individually ranged from 77 percent in Germany and Indonesia to 97 percent in the Russian Federation. In Australia, Canada, France, the Russian Federation, Saudi Arabia, the United Kingdom (Northern Ireland), and the United States, teachers worked with
students individually about as frequently as they asked parents to help their child with reading.
In contrast, the percentage of fourth-graders whose teachers reported waiting and seeing if performance improved with maturation ranged widely, from 22 percent in the United Kingdom (Northern Ireland) to 79 percent in Saudi Arabia. Moreover, in 7 of the 11 G-20 countries (including the United States), fewer than half of fourth-graders had teachers who reported using this strategy, and in all countries it was the least frequently used of the three strategies reported in this indicator.
PIRLS also asked teachers of fourth-graders about their access to specialized reading professionals. The United States had the largest percentage of fourth-graders whose teachers indicated that reading professionals were always available (45 percent), as well as the smallest percentage of fourth-graders whose teachers indicated that reading professionals were never available (12 percent) (figure 18-2). In general, the G-20 countries could be categorized into two groups based on this characteristic. In six of the countries (Australia, Canada, the Russian Federation, the United Kingdom [England and Northern Ireland], and the United States), about three-quarters or more of the students had teachers who reported having access to a reading professional at least sometimes. In the other five countries (France, Germany, Indonesia, Italy, and Saudi Arabia), nearly two-thirds or more of the students had teachers who reported they never have access to a reading professional to assist with students’ reading.
Definitions and Methodolog
Data for this indicator are from the PIRLS 2011 fourth-grade teacher questionnaire, which was administered to the teachers of the students sampled for PIRLS. The questionnaire included questions on teachers’ background and on their teaching practices in the sampled students’ classes. One or two classes were randomly sampled in each school, and teachers were asked to complete a questionnaire for each class they taught that contained sampled students. Thus, if a teacher taught two classes with sampled students, he or she was expected to complete a questionnaire for each of these classes. It should be noted that the PIRLS 2011 fourth-grade teachers do not constitute representative samples of teachers. Rather, they are the teachers for nationally representative samples of fourth-grade students. Thus, the teacher data presented in this indicator were analyzed at the student level.
Teachers’ reports about the use of various strategies to help fourth-graders having difficulty reading are based on the percent-ages of students whose teachers responded “yes” to a list of strategies that follow the question, “What do you usually do if a student begins to fall behind in reading?”
Teachers’ reports about the availability of specialized reading professionals to assist fourth-graders having difficulty reading are based on their responses to the question, “Are the following resources available to you to deal with students who have difficult with reading?” As shown in figure 18-2, the results are based on the percentages of students whose teachers responded “always,” “sometimes,” or “never” to the availability of a specialized reading professional either in the classroom or in a remedial reading classroom.
In PIRLS 2011, countries were required to sample students in the grade that corresponded to the end of 4 years of formal schooling, providing that the mean age at the time of testing was at least 9.5 years. As defined by PIRLS, the first year of formal schooling begins with the first year of primary school (ISCED97 level 1), which should mark the beginning of formal instruction in reading, writing, and mathematics. (Note that kindergarten is not counted.) For most countries, the target grade was fourth grade or its national equivalent.
INDICATORS PART III: CONTEXTS FOR LEARNING 57

58 INDICATORS PART III: CONTEXTS FOR LEARNING
Indicator 18
Figure 18-1. Percentage of fourth-grade students whose teachers reported employing specific strategies to assist students having difficulty reading, by country: 2011
0
20
40
60
80
100
Percent
Country
Wait to see if performance improves with maturationAsk parents to help students with reading Read with students individually
Australia1 France RussianFederation
United States1
GermanyCanada Indonesia Italy Saudi Arabia
U.K. (N. Ireland)1
9194
25
94 93
39
88 87
3831
100
77
96
77
61
9891
55 57
10097 95 94
79
98
90
23 22
96 95 95 94
37
U.K.(England)
1 The item response rate is below 85 percent. Missing data have not been explicitly accounted for.NOTE: Teacher responses are based on categorical responses to the following question: What do you usually do if a student begins to fall behind in reading?SOURCE: International Association for the Evaluation of Educational Achievement (IEA), Progress in International Reading Literacy Study (PIRLS), 2011.
Figure 18-2. Percentage distribution of fourth-grade students, by teacher reports of the availability of specialized reading professionals and country: 2011
0
20
40
60
80
100
Percent
Country
AlwaysNever Sometimes
Australia1 Canada Italy U.K. (N. Ireland)1
United States1
France Germany Indonesia U.K.(England)
RussianFederation
SaudiArabia
85
22
73 77
27 23
7564
16 1222
2231
6257
18
14
46
14
55 67
42
45
32
918
1082222
4 3 1
1 The item response rate is below 85 percent. Missing data have not been explicitly accounted for.NOTE: Data based on the following question: Are the following resources available to you to work with students who have difficulty with reading? Detail may not sum to totals because of rounding.SOURCE: International Association for the Evaluation of Educational Achievement (IEA), Progress in International Reading Literacy Study (PIRLS), 2011.

Indicator
INDICATORS PART III: CONTEXTS FOR LEARNING 59
19TEACHER COLLABORATION IN MATHEMATICS INSTRUCTION
G-20 Countries Included: Australia, Germany, Indonesia, Italy, Japan, Republic of Korea, Russian Federation, Saudi Arabia, Turkey, United Kingdom (England and Northern Ireland), United States
At the fourth-grade level, the United States was the only reporting G-20 country in which a larger percentage of students had teachers who were very collaborative (49 percent) than who had teachers were only collaborative (40 percent) or sometimes collaborative (11 percent).
This indicator describes the extent to which fourth- and eighth-grademathematics teachers collaborate on mathematics instruction. It is based on an index, Collaborate to Improve Teaching, formed using data from the TIMSS 2011 teacher questionnaire. The index places students into one of three categories (those having sometimes collaborative teachers, collaborative teachers, or very collaborative teachers) based on how often their teachers engaged in the various interactions described in “Definition and Methodology” below. The data in this indicator are from all three categories of this index.
At the fourth-grade level, the United States was the only partici-pating G-20 country in which a measurably larger percentage of students had teachers who were very collaborative (49 percent) than who had teachers who were only collaborative (40 percent) or sometimes collaborative (11 percent) (figure 19-1). In four countries (Australia, the Republic of Korea, Turkey, and the United Kingdom [England]), similar percentages of students had teachers who were very collaborative as had teachers who were collaborative. In the six remaining countries, higher percentages of students had
teachers who were collaborative than had teachers in other categories, with the percentages ranging from 55 percent in the United Kingdom (Northern Ireland) to 74 percent in Saudi Arabia. Less than one-quarter of students in any of the participating G-20 countries had mathematics teachers who were only some-times collaborative, with the percentages ranging from 4 percent in the Republic of Korea to 23 percent in the United Kingdom (Northern Ireland). In the United States, 11 percent of students had teachers who were sometimes collaborative.
At the eighth-grade level, there were no countries in which higher percentages of students had teachers who were very collaborative than had other categories of teachers; instead, in all countries except the United States and Indonesia, higher percentages of students had teachers who were collaborative. In the United States and Indonesia, there were no measurable differences between the percentages of students who had teachers in the very collaborative and collaborative categories (39 and 40 percent, respectively, in the United States; 45 and 50 percent, respectively, in Indonesia) (figure 19-2). In all other countries, the percentage-point differences between the two categories were larger (reaching 62 percentage points in the Russian Federation). The percentages of eighth-grade students who had teachers who were only sometimes collaborative ranged from 4 percent in the Russian Federation to 31 percent in Italy, showing more variability than at the fourth grade. In the United States, 22 percent of students had teachers who were only sometimes collaborative.
Definitions and Methodolog
This indicator is based on an index formed using data from the TIMSS 2011 fourth- and eighth-grade teacher questionnaires, which were administered to the teachers of the students sampled for TIMSS. The teacher questionnaires were designed to obtain information about the classroom contexts for the teaching and learning of mathematics and science and about the implemented curriculum in these subjects. For each participating school, one teacher questionnaire that addressed both mathematics and science was administered to the classroom teacher of the sampled fourth-grade class, and separate versions of the questionnaire were administered to the mathematics teacher and the science teacher of the sampled eighth-grade class. It should be noted that the TIMSS 2011 teachers do not constitute representative samples of teachers. Rather, they are the teachers for nationally representative samples of fourth-grade and eighth-grade students. Thus, the teacher data presented in this indicator were analyzed at the student level.
To develop the Collaborate to Improve Teaching index, teachers were asked to indicate how often they interacted with other teachers to (a) discuss how to teach a particular topic; (b) collaborate in planning and preparing instructional materials; (c) share what I have learned about my teaching experiences; (d) visit another classroom to learn more about teaching; and
(e) work together to try out new ideas. The index places teachers into one of three categories (very collaborative, collaborative, or sometimes collaborative) based on whether they answered that they daily or almost daily, 1–3 times per week, 2 or 3 times per month, or never or almost never engaged in the five interactions described above. (Note that the TIMSS international report uses slightly different language to describe these categories; this indicator draws on the language used in the international codebook and the IDE.)
In TIMSS 2011 at the fourth grade, countries were required to sample students in the grade that corresponded to the end of 4 years of formal schooling, providing that the mean age at the time of testing was at least 9.5 years. In TIMSS 2011 at the eighth grade, countries were required to sample students in the grade that corresponded to the end of 8 years of formal schooling, providing that the mean age at the time of testing was at least 13.5 years. As defined by TIMSS, the first year of formal schooling begins with the first year of primary school (ISCED97 level 1), which should mark the beginning of formal instruction in read-ing, writing, and mathematics. (Note that kindergarten is not counted.) For most countries, the target grades were fourth and eighth grades or their national equivalents.

60 INDICATORS PART III: CONTEXTS FOR LEARNING
Indicator 19
Figure 19-1. Percentage distribution of fourth-grade students, by extent of mathematics teachers’ collaboration on instruction and country: 2011
0
20
40
60
80
100
Percent
Country
Very collaborativeSometimes collaborative Collaborative
Australia Germany RussianFederation
U.K. (N. Ireland)
UnitedStates
Italy Japan Republicof Korea
U.K.(England)
SaudiArabia
Turkey
67
11
46
9 923
61518
1112
59
5959
44
31
74
46 44
55
40
49
16
44 47
22
51
23
44
1
2635
4
NOTE: The data in this figure are from the Collaborate to Improve Teaching Index, which is based on items that asked teachers how often they interacted with other teachers in the following: (1) discuss how to teach a particular topic; (2) collaborate in planning and preparing instructional materials; (3) share what I have learned about my teaching experiences; (4) visit another classroom to learn more about teaching; and (5) work together to try out new ideas. Indonesia did not participate in TIMSS 2011 at the fourth grade. Detail may not sum to totals because of rounding.SOURCE: International Association for the Evaluation of Educational Achievement (IEA), Trends in International Mathematics and Science Study (TIMSS), 2011.
Figure 19-2. Percentage distribution of eighth-grade students, by extent of mathematics teachers’ collaboration on instruction and country: 2011
0
20
40
60
80
100
Percent
Australia Indonesia Republicof Korea
UnitedStates
Italy Japan U.K.(England)
RussianFederation
SaudiArabia
Turkey
Country
Very collaborativeSometimes collaborative Collaborative
23 1724
31
512
6156
50
55
62
79 58 5556
39
1725 28 24
4532
17 20 22
40
151513
4
NOTE: The data in this figure are from the Collaborate to Improve Teaching Index, which is based on items that asked teachers how often they interacted with other teachers in the following: (1) discuss how to teach a particular topic; (2) collaborate in planning and preparing instructional materials; (3) share what I have learned about my teaching experiences; (4) visit another classroom to learn more about teaching; and (5) work together to try out new ideas. Germany and the United Kingdom (Northern Ireland) did not participate in TIMSS 2011 at the eighth grade. Detail may not sum to totals because of rounding.SOURCE: International Association for the Evaluation of Educational Achievement (IEA), Trends in International Mathematics and Science Study (TIMSS), 2011.

Indicator
INDICATORS PART III: CONTEXTS FOR LEARNING 61
20TEACHER PROFESSIONAL DEVELOPMENT IN MATHEMATICS
G-20 Countries Included: Australia, Germany, Indonesia, Italy, Japan, Republic of Korea, Russian Federation, Saudi Arabia, Turkey, United Kingdom (England and Northern Ireland), United States
The United States was the only participating G-20 country where at least half of the eighth-grade students had teachers who reported participating in professional development in mathematics in each of four areas: content, pedagogy, assess-ment, and integrating information technology into instruction.
TIMSS 2011 asked teachers of fourth- and eighth-graders to report on their participation in several areas of professional development in mathematics in the 2 years before the assessment. This indicator examines the results in four areas of professional development: content, pedagogy, assessment, and integrating information technology (IT) into instruction.
In 2011, the percentage of fourth-graders whose teachers reported participating in professional development in mathematics content in the previous 2 years ranged from 10 percent in Turkey to 68 percent in the United States (figure 20-1). In the United States, participation in this area of professional development was higher than in any other area. The percentage of students whose teachers reported participating in professional development in mathematics pedagogy ranged from 11 percent in Turkey to 73 percent in Saudi Arabia. Fifty-five percent of fourth-graders in the United States had teachers who reported participating in this area of profes-sional development, which was lower than in the United Kingdom (England) (71 percent) and Australia (65 percent), not significantlydifferent than in the United Kingdom (Northern Ireland), the Russian Federation, and Japan (64, 59, and 59 percent, respectively), and higher than in the remaining countries.
Fifty-three percent of fourth-graders in the United States had teachers who reported participating in professional development in mathematics in the area of assessment, as did 49 percent in the area of integrating IT into instruction. As in the United States, in five other countries (Australia, Germany, Italy, Japan, and Saudi Arabia), these were the two areas in which fourth-graders’ teachers were the least likely to receive professional development. The most notable exception was the Russian Federation, where 64 and 65 percent of students’ teachers reported receiving professional development in assessment and integrating IT into instruction, compared to 58 and 59 percent in content and pedagogy, respectively. The Russian Federation, however, was one of two G-20 countries in which more than half of fourth-grade students’ teachers reported participating in professional development in each of the four areas. (The United Kingdom [Northern Ireland]
was the other.) In Turkey, the percentages of students whose teachers reported participating in professional development in any area were uniformly low (ranging from 9 to 12 percent). In contrast to other G-20 countries particularly Germany, Japan, the Republic of Korea, and the United Kingdom (England)—teacher participation in professional development varied to a greater degree among the different areas.
At the eighth-grade level, higher percentages of students in most countries had teachers who reported participating in professional development in mathematics in each of the areas than they did at the fourth grade. The exceptions were Saudi Arabia, in all areas; Italy and Australia, in content; and the Russian Federation, in assessment.
The percentage of eighth-grade students whose teachers reported participating in professional development in mathematics content ranged from 23 percent in Italy to 73 percent in the United States. The United States also had the highest percentage of students whose teachers reported participating in professional development in mathematics pedagogy (73 percent), along with the United Kingdom (England) (73 percent), Japan (70 percent), the Russian Federation (69 percent), and Australia (65 percent). Turkey had the lowest percentage of students whose teachers reporting participating in professional development in this area, with 41 percent. The percentage of eighth-grade students whose teachers reported participating in professional development in mathematics assessment ranged from 26 percent in Turkey, Japan, and Italy to 71 percent in Indonesia, with 61 percent in the United States. In the area of integrating IT into instruction, the percentages ranged from 23 percent in Japan to 72 percent in the Russian Federation, with 68 percent in the United States.
The United States was the only participating G-20 country where at least half of the eighth-grade students had teachers who reported participating in professional development in mathematics in each of the four areas. In Australia, Indonesia, the Russian Federation, and the United Kingdom (England), at least half of the eighth-grade students had teachers who reported participating in professional development in three of the areas. In Indonesia and the United Kingdom (England), integrating IT into instruction was the area in which relatively fewer students’ teachers participated in professional development, whereas in the Russian Federation and Australia the area with the lowest rate of profes-sional development was assessment.
Definitions and Methodolog
Data for this indicator are from the TIMSS 2011 teacher question-naire, which was designed to obtain information about the classroom contexts for the teaching and learning of mathematics and science and about the implemented curriculum in these subjects. For each participating school, one teacher questionnaire that addressed both mathematics and science was administered to the classroom teacher of the sampled fourth-grade class, and
separate versions of the questionnaire were administered to the mathematics teacher and the science teacher of the sampled eighth-grade class. It should be noted that the TIMSS 2011 teachers do not constitute representative samples of teachers. Rather, they are the teachers for nationally representative samples of fourth-grade and eighth-grade students. Thus, the teacher data presented in this indicator were analyzed at the student level.

Indicator
62 INDICATORS PART III: CONTEXTS FOR LEARNING
20
In TIMSS 2011 at the fourth grade, countries were required to sample students in the grade that corresponded to the end of 4 years of formal schooling, providing that the mean age at the time of testing was at least 9.5 years. In TIMSS 2011 at the eighth grade, countries were required to sample students in the grade that corresponded to the end of 8 years of formal schooling, providing that the mean age at the time of testing was at least
13.5 years. As defined by TIMSS, the first year of formal schooling begins with the first year of primary school (ISCED97 level 1), which should mark the beginning of formal instruction in reading, writing, and mathematics. (Note that kindergarten is not counted.) For most countries, the target grades were fourth and eighth grades or their national equivalents.

Indicator
INDICATORS PART III: CONTEXTS FOR LEARNING 63
20
Figure 20-1. Percentage of fourth- and eighth-grade students whose teachers reported that they participated in various professional development activities in mathematics in the 2 years prior to the assessment, by area of professional development and country: 2011
0
20
40
60
80
100
Percent
Germany Italy Japan RussianFederation
U.K.(England)
United States1
Australia1 Republic ofKorea
SaudiArabia
Turkey
Fourth grade
66
55
4451
65
49
27
5
28
38
21 22 23 23
5359
40
3132
58 59
10
41
64 6559
73
43
1291110
30
71
5853 55
6461
55
68
55 5349
U.K. (N. Ireland)1
Country
AssessmentPedagogyContent Integrate IT
0
20
40
60
80
100
Percent
Eighth grade
Indonesia Italy Japan RussianFederation
U.K.(England)
United States1
Australia1 Republic ofKorea
SaudiArabia
Turkey
68 6972
61
5156
63
46 46
272623
7065
45
26
45
23
37
50
71716965
39
52
2834
30
41
26 29
60
5148
73 73 73
6168
1 The item response rate is below 85 percent. Missing data have not been explicitly accounted for.NOTE: Indonesia did not participate in TIMSS 2011 at the fourth grade; Germany and the United Kingdom (Northern Ireland) did not participate in TIMSS 2011 at the eighth grade.SOURCE: International Association for the Evaluation of Educational Achievement (IEA), Trends in International Mathematics and Science Study (TIMSS), 2011.

Indicator
64 INDICATORS PART III: CONTEXTS FOR LEARNING
21TEACHER PROFESSIONAL DEVELOPMENT IN SCIENCE
G-20 Countries Included: Australia, Germany, Indonesia, Italy, Japan, Republic of Korea, Russian Federation, Saudi Arabia, Turkey, United Kingdom (England and Northern Ireland), United States
The United States and the Russian Federation were the only participating G-20 countries where at least half of the eighth-grade students had teachers who reported participating in professional development in science in each of four areas: content, pedagogy, assessment, and integrating information technology into instruction.
TIMSS 2011 asked teachers of fourth- and eighth-graders to report on their participation in several areas of professional development in science in the 2 years before the assessment. This indicator discusses the results for teachers of fourth- and eighth-graders in four areas of professional development in science: content, pedagogy, assessment, and integrating information technology (IT) into instruction.
In 2011, with few exceptions, less than half of the fourth-grade students in the participating G-20 countries had teachers who reported that they participated in professional development in any of the four areas in the 2 years prior to the assessment. The percentage of fourth-graders whose teachers reported participating in professional development in science content ranged from 9 percent in Turkey to 49 percent in the Republic of Korea (figure 21-1). In the United States, a higher percentage of fourth-graders’ teachers reported participating in professional development in science content (39 percent) than in any other area. The percentage of fourth-grade students whose teachers reported participating in professional development in science pedagogy ranged from 9 percent in Turkey to 54 percent in Saudi Arabia. Twenty-eight percent of fourth-graders in the United States had teachers who reported participating in this area of professional development, which was higher than in Turkey, not significantlydifferent than in Australia (32 percent), Germany (28 percent), Italy (21 percent), and the United Kingdom (Northern Ireland) (28 percent), and lower than in the remaining G-20 countries.
Twenty-seven percent of fourth-graders in the United States had teachers who reported participating in professional development in science in assessment and in integrating IT into instruction. As in the United States, in seven other countries (Australia, Germany, Italy, Japan, the Republic of Korea, Saudi Arabia, and the United Kingdom [Northern Ireland]), these were the two areas in which fourth-graders’ teachers were the least likely to receive professional development. The most notable exception was
the Russian Federation, where 54 and 56 percent of students’ teachers reported receiving professional development in assess-ment and integrating IT into instruction, compared to 46 and 49 percent in content and pedagogy, respectively. In Turkey, the percentages of students whose teachers reported participating in professional development in any area were uniformly low (ranging from 8 to 9 percent), and, compared to the other countries, in Germany, Japan, the Republic of Korea, and the United Kingdom (England and Northern Ireland), teacher participation varied to a greater degree among the different areas.
At the eighth-grade level, higher percentages of students in most countries had teachers who reported participating in professional development in science in each of the areas than they did at fourth grade. The exception was Saudi Arabia, in assessment.
The percentage of eighth-grade students whose teachers reported participating in professional development in science content ranged from 22 percent in Italy to 78 percent in Japan. The Russian Federation and the United Kingdom (England) had the highest percentages of eighth-grade students whose teachers reported participating in professional development in pedagogy (75 percent), along with Japan (73 percent), the Republic of Korea (68 percent), the United States (67 percent), and Saudi Arabia (65 percent). Italy had the lowest percentage of eighth-grade students whose teachers reporting participating in professional development in this area, with 35 percent. The percentage of eighth-grade students whose teachers reported participating in professional development in assessment ranged from 16 percent in Italy to 73 percent in Indonesia, with 57 percent in the United States. In the area of integrating IT into instruction, the percent-ages ranged from 28 percent in Italy to 75 percent in the Russian Federation, with 70 percent in the United States.
The United States and the Russian Federation were the only G-20 countries where at least half of the eighth-grade students had teachers who reported participating in professional development in science in each of the four areas. In Indonesia and the United Kingdom (England), at least half of the eighth-grade students had teachers who reported participating in professional development in three of the areas. In these two countries, integrating IT into instruction was the area in which relatively fewer students’ teachers participated in professional development.
Definitions and Methodolog
Data for this indicator are from the TIMSS 2011 teacher question-naire, which was designed to obtain information about the classroom contexts for the teaching and learning of mathematics and science and about the implemented curriculum in these subjects. For each participating school, one teacher questionnaire that addressed both mathematics and science was administered to the classroom teacher of the sampled fourth-grade class, and
separate versions of the questionnaire were administered to the mathematics teacher and the science teacher of the sampled eighth-grade class. It should be noted that the TIMSS 2011 teachers do not constitute representative samples of teachers. Rather, they are the teachers for nationally representative samples of fourth-grade and eighth-grade students. Thus, the teacher data presented in this indicator were analyzed at the student level.

Indicator
INDICATORS PART III: CONTEXTS FOR LEARNING 65
21
In TIMSS 2011 at the fourth grade, countries were required to sample students in the grade that corresponded to the end of 4 years of formal schooling, providing that the mean age at the time of testing was at least 9.5 years. In TIMSS 2011 at the eighth grade, countries were required to sample students in the grade that corresponded to the end of 8 years of formal schooling, providing that the mean age at the time of testing was at least
13.5 years. As defined by TIMSS, the first year of formal schooling begins with the first year of primary school (ISCED97 level 1), which should mark the beginning of formal instruction in reading, writing, and mathematics. (Note that kindergarten is not counted.) For most countries, the target grades were fourth and eighth grades or their national equivalents.

66 INDICATORS PART III: CONTEXTS FOR LEARNING
Indicator 21
Figure 21-1. Percentage of fourth- and eighth-grade students whose teachers reported that they participated in various professional development activities in science in the 2 years prior to the assessment, by area of professional development and country: 2011
0
20
40
60
80
100
Percent
Fourth grade
Germany Italy Japan RussianFederation
U.K.(England)
United States1
Australia1 Republic ofKorea
SaudiArabia
Turkey
32
U.K. (N. Ireland)1
3226 26
37
2417
7 8 10
21 2114
19
3741
49 48
2823
4649
54 56
4854
46
37
9 9 8 9
2923
43 42
26 2822
5
39
28 27 27
Country
AssessmentPedagogyContent Integrate IT
0
20
40
60
80
100
Percent
Eighth grade
Indonesia Italy Japan RussianFederation
U.K. (England)1
United States1
Australia1 Republic ofKorea
SaudiArabia
Turkey
5348
64
40
5145
75 73
35
2216
2832 34
7873
65 68
44
31
67
75
53
75
56
65
3541
3640
26
35 36
57
75
56
75
67
57
70
1 The item response rate is below 85 percent. Missing data have not been explicitly accounted for. For the United Kingdom (England), this note applies only to responses about professional development in content and pedagogy. NOTE: Indonesia did not participate in TIMSS 2011 at the fourth grade; Germany and the United Kingdom (Northern Ireland) did not participate in TIMSS 2011 at the eighth grade.SOURCE: International Association for the Evaluation of Educational Achievement (IEA), Trends in International Mathematics and Science Study (TIMSS), 2011.

Indicator
INDICATORS PART III: CONTEXTS FOR LEARNING 67
22FOURTH-GRADE READING TEACHERS’ CAREER SATISFACTION
G-20 Countries Included: Australia, Canada, France, Germany, Indonesia, Italy, Russian Federation, Saudi Arabia, United Kingdom (England and Northern Ireland), United States
In all of the participating G-20 countries (except the United States, Italy, and France), at least half of fourth-graders had teachers with high career satisfaction, with a high of 89 percent in Indonesia.
This indicator describes how satisfied fourth-grade teachers are in their current position as a reading teacher. It is based on an index, Teacher Career Satisfaction, formed using data from the PIRLS 2006 and 2011 teacher questionnaires. The index places teachers into one of three categories (high, medium, or low) based on whether they agreed a lot, agreed a little, disagreed a little, or disagreed a lot with the statements described in “Definitions and Methodology” below. The data in this indicator are from all three categories of this index. The indicator also presents changes in career satisfaction between 2006 and 2011.
Across all participating G-20 countries except one, less than 10 percent of fourth-graders had teachers with low career satis-faction in 2011, with percentages ranging from 2 percent in Saudi Arabia to 6 percent in Australia, the United Kingdom (England), and the United States; France was the exception, where 17 percent of students had teachers with low career satisfaction (figure 22-1). Higher levels of career satisfaction were more common. In all of the participating G-20 countries (except the United States, Italy, and France), at least half of fourth-graders had teachers with high career satisfaction, with a high of 89 percent in Indonesia. Australia, Canada, Germany, the Russian Federation, Saudi Arabia, and the United Kingdom (England and Northern Ireland) were the other countries where the majority of fourth-graders had teachers with high career satisfaction. In the United States, 47 percent of fourth-graders had teachers with high career satisfaction and an equal percentage had teachers with medium career satisfaction. Italy and France were the only countries in which a greater percentage of students had teachers with medium satisfaction than with high career satisfaction (56 vs. 39 percent, respectively in Italy and 59 vs. 25 percent, respectively in France).
Between 2006 and 2011, there was no significant change in the percentage of fourth-graders who had teachers with low career satisfaction across six of the seven G-20 countries that participated in PIRLS in both years (figure 22-2). France was the exception; here, the percentage of students who had teachers with low career satisfaction increased 15 percentage points from 2006 to 2011. The percentage of fourth-graders who had teachers with medium career satisfaction increased in France, Germany, Italy, the United Kingdom (England), and the United States (by 15, 14, 12, 15, and 23 percentage points, respectively), decreased in Indonesia (by 22 percentage points), and did not measurably change in the Russian Federation. Meanwhile, the percentage of fourth-graders with teachers with high career satisfaction increased only in Indonesia (by 22 percentage points), decreased in France, Germany, Italy, the United Kingdom (England), and the United States (by 29, 16, 13, 15, and 26 percentage points, respectively), and again did not measurably change in the Russian Federation.
The pattern shows that while no measurable change occurred (except in France) among teachers with low career satisfaction (nor among teachers in the Russian Federation in any category), there was a switch in the percentage of students with teachers with medium and high career satisfaction between 2006 and 2011 in most countries. Indonesia was the only country to show a trend toward greater satisfaction, with higher percentages students who had teachers with high career satisfaction in 2011 than in 2006 and smaller percentages who had teachers with medium career satisfaction. Among the five countries that showed a trend toward lower satisfaction, the United States and France had the largest changes. In the United States there was a 26-percentage-point decrease in fourth-graders who had teachers with high career satisfaction (from 73 to 47 percent) and a 23-percentage-point increase in fourth-graders who had teachers with medium career satisfaction (from 24 to 47 percent). In France, there as a 29-percentage-point decrease in fourth-graders who had teachers with high career satisfaction (from 54 to 25 percent) and a 15-percentage-point increase in fourth-graders who had teachers with medium career satisfaction (from 44 to 59 percent).
Definitions and Methodolog
This indicator is based on an index formed using data from the PIRLS 2006 and 2011 fourth-grade teacher questionnaires, which were administered to the teachers of the students sampled for PIRLS. The questionnaire included questions on teachers’ background and on their teaching practices in the sampled students’ classes. One or two classes were randomly sampled in each school, and teachers were asked to complete a questionnaire for each class they taught that contained sampled students. Thus, if a teacher taught two classes with sampled students, he or she was expected to complete a questionnaire for each of these classes. It should be noted that the fourth-grade teachers do not constitute representative samples of
teachers. Rather, they are the teachers for nationally representative samples of fourth-grade students. Thus, the teacher data presented in this indicator were analyzed at the student level.
In PIRLS 2006 and 2011, countries were required to sample students in the grade that corresponded to the end of 4 years of formal schooling, providing that the mean age at the time of testing was at least 9.5 years. As defined by PIRLS, the first year of formal schooling begins with the first year of primary school (ISCED97 level 1), which should mark the beginning of formal instruction in reading, writing, and mathematics. (Note

Indicator
68 INDICATORS PART III: CONTEXTS FOR LEARNING
22
that kindergarten is not counted.) For most countries, the target grade was fourth grade or its national equivalent.
The Teacher Career Satisfaction index measures how satisfie teachers are in their current position as a reading teacher. The index places teachers into one of three categories (high, medium, or low) based on whether they agreed a lot, agreed a little, disagreed a little, or disagreed a lot with the following statements regarding
their career satisfaction: (a) I am content with my profession as a teacher; (b) I am satisfied with being a teacher at this school; (c) I had more enthusiasm when I began teaching than I have now; (d) I do important work as a teacher; (e) I plan to continue as a teacher for as long as I can; and (f) I am frustrated as a teacher. The data in this indicator are from all three categories of this index.

Indicator
INDICATORS PART III: CONTEXTS FOR LEARNING 69
22
Figure 22-1. Percentage distribution of fourth-grade students, by reading teacher’s reported level of career satisfaction and country: 2011
0
20
40
60
80
100
Percent
Country
HighLow Medium
Australia1 Canada Italy U.K. (N. Ireland)1
UnitedStates
France Germany Indonesia U.K.(England)
RussianFederation
SaudiArabia
511
47
6 5
45
175 66
59
434156
3642 41
47
4760
51 52 54
89
5253
24‡
39
5
50
25
‡ Reporting standards not met.1 The item response rate is below 85 percent. Missing data have not been explicitly accounted for.NOTE: The data in this figure are from the Teacher Career Satisfaction Index, which is based on teachers’ level of agreement with the following statements: (1) I am content with my profession as a teacher; (2) I am satisfied with being a teacher at this school; (3) I had more enthusiasm when I began teaching than I have now; (4) I do important work as a teacher; (5) I plan to continue as a teacher for as long as I can; and (6) I am frustrated as a teacher. Detail may not sum to totals because of rounding.SOURCE: International Association for the Evaluation of Educational Achievement (IEA), Progress in International Reading Literacy Study (PIRLS), 2011.
Figure 22-2. Change in percentage of fourth-grade students, by reading teachers’ reported level of career satisfaction and country: 2006 and 2011
-50
-30
-10
10
30
50
Percentage point difference
-40
-20
0
20
40
Country
HighLow Medium
Germany RussianFederation
U.K.(England)
UnitedStates
IndonesiaFrance Italy
15* 15*
-29*
3
14*
-16*
‡
-22*
22*
2
12*
-13*
3 4
-7
15*
-15*
3
-26*
23*
Higher in 2011
Higher in 2006
#
# Rounds to zero.‡ Reporting standards not met.* p <. 05. Percentage is significantly different between 2006 and 2011.NOTE: The data in this figure are from the Teacher Career Satisfaction Index, which is based on teachers’ level of agreement with the following statements: (1) I am content with my profession as a teacher; (2) I am satisfied with being a teacher at this school; (3) I had more enthusiasm when I began teaching than I have now; (4) I do important work as a teacher; (5) I plan to continue as a teacher for as long as I can; and (6) I am frustrated as a teacher. Australia, Canada, Saudia Arabia, and United Kingdom (Northern Ireland) did not paricipate in PIRLS 2006.SOURCE: International Association for the Evaluation of Educational Achievement (IEA), Progress in International Reading Literacy Study (PIRLS), 2006 and 2011.

INDICATORS PART IVINDICATORS PART IVExpenditure for Education
This section includes two indicators on education expenditures in the G-20 countries.
• Indicator 23 compares the average annual starting salaries of full-time public school teachers at both the primary and upper secondary levels. It also examines the ratio of these average starting salaries to the gross domestic product (GDP) per capita for each of the reporting countries.
• Indicator 24 reports public and private education expenditures per student, both the total spent as well as that spent on core services, which pertain to instructional services, including faculty/staff salaries, professional development, and books and other school materials. It also presents annual public and private education expenditures as a percentage of GDP, allowing a comparison of countries’ education expenditures relative to their overall economic output.
The indicators in this section draw on data from Education at a Glance 2013: OECD Indicators (OECD 2013a).

Indicator
INDICATORS PART IV: EXPENDITURE FOR EDUCATION 71
23PUBLIC SCHOOL TEACHERS’ STARTING SALARIES
G-20 Countries Included: Argentina, Australia, Canada, France, Germany, Indonesia, Italy, Japan, Mexico, Republic of Korea, Turkey, United Kingdom (England and Scotland), United States
Of the G-20 countries reporting data in 2011, Germany reported the highest average starting salary of public school teachers at both the primary and upper secondary levels, followed by the United States.
This indicator compares the average annual starting salaries of full-time public school teachers who have completed the minimum training necessary to be fully qualified at the beginning of their teaching careers. Average starting salaries are compared across countries for teachers at both the primary and upper secondary levels. The indicator also presents the ratio of these average starting salaries to the gross domestic product (GDP) per capita for each of the reporting countries. This ratio provides an indication of how starting teachers’ salaries compare with average levels of income, with higher ratios suggesting that starting salaries are high relative to average income and lower ratios indicating they are low relative to average income.
Of the G-20 countries reporting data in 2011, Germany reported the highest average starting salary of public school teachers at both the primary and upper secondary levels, followed by the
United States (figure 23-1). In Germany, the average starting salary of public school teachers in 2011 was $47,500 at the primary level and $57,400 at the upper secondary level. In the United States, average starting salaries for public school teachers were $37,600 and $38,000 at the primary and upper secondary levels, respectively. Indonesia reported the lowest average starting salary at both levels ($1,600 at the primary level and $2,000 at the upper secondary level).
In most of the reporting G-20 countries in 2011, public school teachers at the beginning of their careers earned less than the average GDP per capita in their respective countries (with the exception of Germany and Turkey) (table 23-1). For example, in the United States, the average starting salary of public primary and upper secondary school teachers was about 78 and 79 percent, respectively, of the U.S. GDP per capita of $48,112. In Turkey, however, public primary and upper secondary school teachers earned 137 and 141 percent, respectively, of the Turkish GDP per capita.
Definitions and Methodolog
Teacher salary data refer to the 2010–11 school year. Data for GDP per capita are for calendar year 2011. Dollar figures for teacher salaries and GDP per capita were converted to U.S. equivalent dollars using purchasing power parities (PPPs), which equalize the purchasing power of different currencies. Using PPPs to convert all teacher salary data to U.S. equivalent dollars allows for cost-of-living differences across countries to be taken into account.
Salaries refer to scheduled salaries according to official pay scales and are defined as before-tax, or gross, salaries (the total sum paid by the employer for the labor supplied), excluding the employer’s contribution to social security and pension (according to existing salary scales). In addition, differences by country in taxation and social benefit systems as well as the use of financialincentives (including regional allowances for teaching in remote regions, family allowances, reduced rates on public transport, tax allowances on purchases of cultural goods, and other entitlements that contribute to a teacher’s basic income) make it important to exercise caution in interpreting comparisons of teachers’ salaries.
Countries with centralized systems of education typically have national salary schedules. In countries like the United States, with decentralized systems, local or regional governments establish their own salary schedules. The national averages shown here do not represent the within-country variation that exists in teacher salaries.
The minimum training necessary to be fully qualified varies by country. In the United States, teacher training is decentralized and varies by state; the average teacher salary is the median of the self-reported salaries of teachers with two or fewer years of experience in a sample representative of public school teachers in the United States.
As shown in the accompanying figure and table, education levels are defined according to the 1997 International Standard Classification of Education (ISCED97). For more information on the ISCED97 levels, see appendix A.

72
Indicator
72 INDICATORS PART IV: EXPENDITURE FOR EDUCATION
23
Figure 23-1. Public school teachers’ average starting salaries (in thousands of U.S. dollars), by education level and country: 2011
Average salary (in thousands)
Country
Primary education Upper secondary education
Argentina1 Canada U.K.(England)
UnitedStates
GermanyAustralia Indonesia1 Italy U.K.(Scotland)
France0
10
20
30
50
$60
16.6
40
13.5
34.6 34.7 35.5 35.5
25.628.9
47.5
57.4
1.6 2.0
27.329.4
26.0 26.0
15.1
27.6 27.5
23.5 24.1
30.3 30.3 30.1 30.1
37.6 38.0
MexicoJapan Republicof Korea
Turkey
— Not available.1 Data are for 2010 rather than 2011.NOTE: “Average starting salaries” are the average scheduled annual salaries of full-time teachers with the minimum training necessary to be fully qualified at the beginning of their teaching careers. Education levels are defined according to the 1997 International Standard Classification of Education (ISCED97). Primary education refers to ISCED97 level 1. Upper secondary education refers to ISCED97 level 3. For more information on the ISCED97 levels, see appendix A in this report. Average salaries are gross salaries (i.e., before deductions for income taxes) for school year 2010–11 and are converted to U.S. dollars using 2011 national purchasing power parity (PPP) exchange rate data.SOURCE: Organization for Economic Cooperation and Development (OECD). (2013a). Education at a Glance 2013: OECD Indicators, tables D3.1. Paris: Author.
Table 23-1. Public school teachers’ average starting salaries in U.S. dollars expressed as a ratio of gross domestic product (GDP) per capita in U.S. dollars, by education level and country: 2011
Country
Average starting salary expressed as a ratio of GDP per capita
GDP per capitaPrimary Upper secondary
Argentina1 0.87 0.71 $19,098 Australia 0.82 0.83 41,974Canada 0.88 0.88 40,420France 0.73 0.82 35,247Germany 1.20 1.45 39,456Indonesia1 0.35 0.44 4,636Italy 0.84 0.90 32,672Japan 0.77 0.77 33,668
Mexico 0.91 — 16,588Republic of Korea 0.92 0.92 29,834Turkey 1.37 1.41 17,110U.K. (England)2 0.85 0.85 35,598U.K. (Scotland)2 0.84 0.84 35,598United States 0.78 0.79 48,112
— Not available.1 Data for average starting salary are for 2010 rather than 2011. For Argentina, data for GDP per capita are also from 2010.2 Data on GDP per capita refer to the United Kingdom.NOTE: “Average starting salaries” are the average scheduled annual salaries of full-time teachers with the minimum training necessary to be fully qualified at the beginning of their teaching careers. Education levels are defined according to the 1997 International Standard Classification of Education (ISCED97). Primary education refers to ISCED97 level 1. Upper secondary education refers to ISCED97 level 3. For more information on the ISCED97 levels, see appendix A in this report. Average salaries are gross salaries (i.e., before deductions for income taxes) for school year 2010–11 and are converted to U.S. dollars using 2011 national purchasing power parity (PPP) exchange rate data. Also using PPP rates, GDP per capita (2011) is calculated in international dollars, which would buy in the cited education system an amount of goods and services comparable to what a U.S. dollar would buy in the United States. SOURCE: Organization for Economic Cooperation and Development (OECD). (2013a). Education at a Glance 2013: OECD Indicators, tables D3.1. Paris: Author; and The World Bank. World Databank 2013. Retrieved June 17, 2013, from http://data.worldbank.org/indicator/NY.GDP.PCAP.PP.CD.

Indicator
INDICATORS PART IV: EXPENDITURE FOR EDUCATION 73
24CHANGE IN ANNUAL EXPENDITURES FOR EDUCATION
G-20 Countries Included: Argentina, Australia, Brazil, Canada, France, Germany, Italy, Japan, Mexico, Republic of Korea, Russian Federation, Turkey, United Kingdom, United States
In 2010, total expenditures per student and the portion of these expenditures devoted to core education services were higher in the United States than in any other reporting G-20 country at both the combined primary and secondary education levels and the higher education level.
This indicator begins by examining public and private education expenditures per student across the G-20 countries in 2010, including total education expenditures as well as the portion of total expenditures devoted to core services. Expenditures are examined at the combined primary and secondary education levels as well as at the higher education level.8 At the primary and secondary education levels, total education expenditures are the combined expenditures for core and ancillary services; at the higher education level, total expenditures also include research and development activities. Core services expenditures pertain to spending on instructional services, including faculty/staff salaries, professional development, and books and other school materials. Ancillary services expenditures, which pertain to spending on education services other than instruction (such as meals at school, transporta-tion to and from school, and campus housing), are included in the total expenditures in this indicator, but are not examined separately. Using data from 2000 and 2010, the indicator also presents annual public and private education expenditures as a percentage of gross domestic product (GDP), allowing a comparison of countries’ education expenditures relative to their overall economic output.
In 2010, total education expenditures per student and the portion of these expenditures devoted to core education services were higher in the United States than in any other reporting G-20 country at both the combined primary and secondary education levels and the higher education level (figure 24-1)
Annual expenditures per student on core education services in the United States were about $10,900 at the combined primary and secondary education levels and about $19,700 at the higher education level. In the other G-20 countries reporting data, annual expenditures per student on core education services ranged from about $1,900 in Turkey to $9,600 in Australia at the combined
primary and secondary levels and from about $5,900 in Italy to $15,100 in Canada at the higher education level.
In 2000, overall (i.e., at the primary, secondary, and higher education levels combined), the United States spent a higher percentage of GDP on education (5.9 percent) than any other G-20 country reporting data (figure 24-2). In 2010, the United States and the Republic of Korea spent a higher percentage of GDP on education (6.8 percent) than any other G-20 country, followed by Canada (6.6 percent). The Russian Federation spent the lowest percentage in 2000 (2.2 percent) and in 2010 (3.7 percent).
In both 2000 and 2010, all reporting G-20 countries spent a larger percentage of GDP at the combined primary and secondary education levels than at the higher education level. In 2000, spending on primary and secondary education as a percentage of GDP ranged from 1.7 percent in the Russian Federation to 4.3 percent in France. In contrast, spending on higher education as a percentage of GDP ranged from 0.5 percent in the Russian Federation to 2.3 percent in Canada. In 2010, the Russian Federation again had the lowest spending on primary and secondary education as a percentage of GDP, at 2.1 percent; the highest spending was in the United Kingdom, at 4.8 percent. Spending on higher education ranged from 0.9 percent in Brazil to 2.8 percent in the United States. Besides the United States, only Canada and the Republic of Korea spent more than 2 percent of GDP on higher education in both years.9
Between 2000 and 2010, spending at all levels of education tended to hold steady or increase in the reporting G-20 countries. At the primary and secondary levels, only France saw a reduc-tion in the ratio of spending on education to GDP (from 4.3 to 4.1 percent), although in both years it was among the higher spending countries. At the higher education level, there were increases in spending as a percentage of GDP of no more than two-tenths of a percentage point in Brazil, Japan, Italy, France, and Australia. However, in the United States, the percentage of GDP spent on higher education increased by six-tenths of a percentage point between 2000 and 2010, and in the Russian Federation, it increased by 1.1 percentage points.
Definitions and Methodolog
Expenditures per student (see figure 24-1) are collected by type of institution, while expenditures as a percentage of gross domestic product (GDP) (see figure 24-2) are collected by source of funds. Since the two sources are not the same, the totals can differ in some countries. Per student expenditures are based on public and private full-time-equivalent (FTE) enrollment figu es for 2000 and 2010 and current expenditures and capital outlays from both public and private sources, where data are available. Data for GDP per capita are for calendar years 2000 and 2010. Dollar figures
for education expenditures and GDP per capita were converted to U.S. equivalent dollars using purchasing power parity (PPP), which equalizes the purchasing power of different currencies. Using PPP to convert all education expenditure data to U.S. equivalent dollars allows for cost-of-living differences across countries to be taken into account. Within-country consumer price indices are used to adjust the PPP indices to account for inflation because the fiscal year has a different starting date in different countries
8 In this indicator, the category of “primary and secondary education” also includes postsecondary nontertiary programs. See appendix A for more information on education levels.9 The reference year for Canada is 2009 rather than 2010.

Indicator
74 INDICATORS PART IV: EXPENDITURE FOR EDUCATION
24
The national averages shown here do not represent the within-country variation that may exist in the annual education expenditures per student.
At the primary and secondary education levels, expenditures on core education services are the remaining expenditures net of expenditures on ancillary services. At the higher education level, expenditures on core education services are the remaining expenditures net of expenditures on ancillary services and research and development activities.
Ancillary services are services provided by education institutions that are peripheral to the main educational mission. At the primary, secondary, and postsecondary nontertiary levels, ancillary services include meals, school health services, and transportation to and from school. At the higher education level, these services include residence halls (dormitories), dining halls, and health care. Ancillary services also include services for the general public, such as museums, radio and television broadcasting, sports, and recreational and cultural programs.
Research and development includes research performed at universities or other higher education institutions, regardless of whether the research is financed from general institution funds or through separate grants or contracts from public or private sponsors. This category does not include research and development activities outside education institutions, such as research and development spending in industry.
As shown in the figures, education levels are defined according to the 1997 International Standard Classification of Education (ISCED97). For more information on the ISCED97 levels, see appendix A.
Percentage-point differences presented in the text were computed from unrounded numbers; therefore, they may differ from computations made using the rounded whole numbers that appear in figure 24-2

Indicator
24
INDICATORS PART IV: EXPENDITURE FOR EDUCATION 75
Figure 24-1. Annual public and private expenditures per student on core services and total services (in thousands of U.S. dollars), by education level and country: 2010
12.4 13.1
2.7 3.44.7
2.5 1.9 2.0
6.67.9
4.1
7.0 6.58.2
7.4
10.09.2
16.0
8.2
5.9
8.59.6
7.89.5 9.1
15.115.9
15.1
22.5
15.1
19.7
25.6
8.59.3 10.0 9.3 9.8 9.6
8.89.8
10.911.8
10
5
15
20
25
$30
0
Expenditures per student (in thousands)
Country (with GDP per capita in parentheses)
Higher educationPrimary and secondary education
Coreservices
Totalservices
Coreservices
Totalservices
Coreservices
Totalservices
Coreservices
Totalservices
Coreservices
Totalservices
Coreservices
Totalservices
Coreservices
Totalservices
Coreservices
Totalservices
Coreservices
Totalservices
Coreservices
Totalservices
Coreservices
Totalservices
Coreservices
Totalservices
Coreservices
Totalservices
UnitedStates
($46,500)
Australia($40,800)
Canada2, 4
($40,100)United
Kingdom($35,300)
France($34,400)
Russian Federation1, 2
($19,800)
Turkey($15,800)
Mexico1
($15,200) Argentina1, 2
($14,700) Brazil1, 2
($12,500)Republicof Korea
($28,800)
Japan1
($35,200) Italy2, 3
($32,100)
— Not available.1 Core services data are included in total services data at the primary and secondary education levels for Brazil and Mexico and at the primary and secondary and higher education levels for Argentina, the Russian Federation, and Japan.2 Public institutions only (for Canada, in tertiary education only; for Italy, except in tertiary education).3 Excludes postsecondary nontertiary data.4 Reference year is 2009 rather than 2010.NOTE: Countries are arranged according to increasing levels of gross domestic product (GDP) per capita, as shown in U.S. dollars in parentheses. Data are converted to U.S. dollars using 2010 national purchasing power parity (PPP) exchange rate data. Education levels are defined according to the 1997 International Standard Classification of Education (ISCED97). Except where otherwise noted, primary and secondary education refers to ISCED97 levels 1 (primary education), 2 (lower secondary education), 3 (upper secondary education), and 4 (postsecondary nontertiary programs), and higher education refers to the ISCED97 levels 5A (academic higher education below the doctoral level), 5B (vocational higher education), and 6 (doctoral level of academic higher education). For more information on the ISCED97 levels, see appendix A in this report. Shown are total expenditures collected by type of institution. Total expenditures include core expenditures for instructional activities, plus ancillary services such as food services, residence halls, and student transportation. Includes both public and private institutions, except where otherwise noted. Data for Germany are not available.SOURCE: Organization for Economic Cooperation and Development (OECD). (2013a). Education at a Glance 2013: OECD Indicators, tables B1.2 and X2.1. Paris: Author.

Indicator
24Figure 24-2. Annual public and private education expenditures as a percentage of gross domestic product (GDP), by education level and country:
2000 and 2010
2.4
0.7
3.5
1.0
1.8
0.8
1.7
0.5 3.5
2.2
3.0
1.4
3.1
0.9
4.3
1.3
3.7
2.2
3.6
1.4
3.3
2.3
3.3
1.1
3.6
1.0
4.0
1.4
4.7
1.5
4.3
0.9
2.5
4.2
2.6
3.0
1.5
3.2
1.0
4.1
1.5
4.8
1.4
3.9
2.7
4.3
1.6
4.0
2.8
3.1
5.2
6.2
4.4
5.4
2.5 2.52.2
3.7
2.1
1.6
5.7
6.8
4.4 4.5
4.0 4.2
5.7 5.6
4.5
6.2
4.4
5.7
6.6
5.1
6.0 5.9
6.8
2000 2010 2000 2010 2000 2010 2000 2010 2000 2010 2000 2010 2000 2010 2000 2010 2000 2010 2000 2010 2000 2010 2000 2009 2000 20102000 2010
Brazil1
($12,500)
Country (with GDP per capita in parentheses)
Higher educationPrimary and secondary education
Argentina($14,700)
UnitedStates
($46,500)
Australia($40,800)
Canada2
($40,100)United
Kingdom($35,300)
France($34,400)
Italy($32,100)
Japan($35,200)
RussianFederation1
($19,800)
Turkey1
($15,800)Mexico
($15,200)Republicof Korea
($28,800)
Germany($37,000)
2
1
4
5
7
8
0
Percent of GDP
6
3
76 INDICATORS PART IV: EXPENDITURE FOR EDUCATION
— Not available.1 Public expenditure only. 2 Reference year is 2009 rather than 2010. NOTE: Countries are arranged according to increasing levels of gross domestic product (GDP) per capita, as shown in U.S. dollars in parentheses. Education levels are defined according to the 1997 International Standard Classification of Education (ISCED97). Primary and secondary education refers to ISCED97 levels 1 (primary education), 2 (lower secondary education), 3 (upper secondary education), and 4 (postsecondary nontertiary programs), and higher education refers to the ISCED97 levels 5A (academic higher education below the doctoral level), 5B (vocational higher education), and 6 (doctoral level of academic higher education). For more information on the ISCED97 levels, see appendix A in this report. Shown are total expenditures collected by source of funds. Includes both public and private sources, except where otherwise noted. Detail may not sum to totals because of rounding.SOURCE: Organization for Economic Cooperation and Development (OECD). (2013a). Education at a Glance 2013: OECD Indicators, tables B2.1 and X2.1. Paris: Author.

INDICATORS PART VINDICATORS PART VEducation Returns: Educational
Attainment and IncomeThe indicators in this section address the educational attain- ment of the adult population, as well as the relationship of education to employment and income, in G-20 countries. They also explore differences between men and women in educational attainment and its relationship to employment and income.
• Indicator 25 examines the first-time graduation rates at two key education levels: upper secondary education and academic higher education below the doctoral level.
• Indicator 26 presents data on the level of education attained by two adult groups in the population: 25- to 64-year-olds (i.e., the working age population generally) and 25- to 34-year-olds (i.e., young adults).
• Indicator 27 describes the percentages of first university degrees awarded in four combined fields of study: social
sciences, business, and law; science, mathematics, and engineering; the arts and humanities; and education. This indicator identifies in which fields the population is being educated and the relative prevalence of degrees awarded in those fields
• Indicator 28 presents the employment rates of 25- to 64-year-olds by different levels of education and by sex.
• Indicator 29 presents data on the percentages of 25- to 64-year-olds who earn different amounts of income based on their education level and relative to their country’s median income.
The indicators in this section draw on data from Education at a Glance 2013: OECD Indicators (OECD 2013a).

78 INDICATORS PART V: EDUCATION RETURNS: EDUCATIONAL ATTAINMENT AND INCOME
Indicator
25GRADUATION RATES BY SEX
G-20 Countries Included: Australia, Canada, China, Germany, Italy, Japan, Mexico, Republic of Korea, Saudi Arabia, Turkey, United Kingdom, United States
Graduation rates from upper secondary education in 2011 were above 90 percent in four of the G-20 countries reporting data: Japan (96 percent), the Republic of Korea and the United Kingdom (93 percent each), and Germany (92 percent).
Graduation rates generally describe the percentage of the pop-ulation that graduated from a given level of education for the first time in a given year. This indicator presents the 2011 firsttime graduation rates of students in G-20 countries from two levels of education—upper secondary education and academic higher education below the doctoral level—and highlights differences in these rates between males and females.
Graduation rates from upper secondary education were above 90 percent in four of the G-20 countries reporting data: Japan (96 percent), the Republic of Korea and the United Kingdom (93 percent), and Germany (92 percent) (figure 25-1). Graduation rates in the remaining reporting G-20 countries ranged from a low of 49 percent in Mexico to 85 percent in Canada, with the U.S. graduation rate at 77 percent. For those G-20 countries with relatively high graduation rates from upper secondary education (i.e., over 90 percent), differences between males and females tended to be relatively small; they ranged from 1 percentage point in Germany, Japan, and the Republic of Korea to 4 percentagepoints in the United Kingdom. In all of these cases except Germany, females had higher rates than males. Male-female
differences also were small, or nonexistent, in two countries with relatively low graduation rates: China (where females had a 2-percentage-point higher rate than males) and Turkey (with no difference). The largest differences in upper secondary graduation rates between males and females were in the United States and Mexico (where females had a 7-percentage-point higher rate than males), followed by Canada and Italy (where females had a 6-percentage-point higher rate than males).
Graduation rates from academic higher education below the doctoral level ranged from a low of 18 percent in Saudi Arabia to a high of 55 percent in the United Kingdom (figure 25-2). Besides the United Kingdom, only Australia had a graduation rate of at least 50 percent from academic higher education below the doctoral level; the graduation rate in the United States was 39 percent. As with upper secondary graduation rates, females’ graduation rates from academic higher education below the doctoral level were higher than males’ in most G-20 countries. The largest differences were in Australia and Canada (where females’ rates were 18 and 17 percentage points higher, respectively, than males’). Differences greater than 10 percentage points were also observed in Italy, Saudi Arabia, the United Kingdom, and the United States. The remaining countries (Germany, Japan, Mexico, and Turkey) had differences of less than 10 percentage points; in two of these countries (Japan and Turkey), males had higher graduation rates from academic higher education than females.
Definitions and Methodolog
Graduation rates are calculated either as net rates or gross rates. The net graduation rate is calculated by dividing the number of graduates by the population for each single year of age. The gross graduation rate is calculated by dividing the total number of graduates by the population at the typical age of graduation. At the upper secondary level, graduation rates in China, Germany, Italy, Japan, the Republic of Korea, and the United Kingdom are calculated as gross rates (with the graduation rates in Canada, Mexico, Turkey, and the United States calculated as net rates). At the level of academic higher education below the doctoral level, graduation rates in Japan, Turkey, and the United States are calculated as gross rates (with the graduation rates in Australia, Canada, Germany, Italy, Mexico, and the United Kingdom calculated as net rates). Typical graduation ages in these countries—at both the upper secondary education level and the academic higher education below the doctoral level—vary depending on the specifi program type and duration. Please see the education system charts in appendix A for further information on age of graduation.
Mismatches between the coverage of the population data and the graduation data mean that the graduation rates for those countries that are net exporters of students may be underestimated and those that are net importers may be overestimated.
As shown in the figures, education levels are defined according to the 1997 International Standard Classification of Education (ISCED97). The graduation rate in upper secondary education includes first-time graduates at ISCED97 level 3. The graduation rate in academic higher education below the doctoral level includes first-time graduates at ISCED97 level 5A. For more information on the ISCED97 levels, see appendix A. The male-female percentage-point differences in graduation rates presented in the text were computed from unrounded numbers; therefore, they may differ from computations made using the rounded whole numbers that appear in figures 25-1 and 25-2.

Indicator
INDICATORS PART V: EDUCATION RETURNS: EDUCATIONAL ATTAINMENT AND INCOME 79
25
Figure 25-1. Graduation rates in upper secondary education, by sex and country: 2011
0
20
40
60
80
100
Percent
Canada1
Country
China Italy Mexico UnitedKingdom
UnitedStates
FemaleMaleTotal
Japan Republicof Korea
Turkey
8582
88
73 72 74
92 93 92
79 7682
96 95 96
4945
52
93 92 93
56 56 56
93 9195
7774
81
Germany
1 Reference year is 2010 rather than 2011. NOTE: Education levels are defined according to the 1997 International Standard Classification of Education (ISCED97). The graduation rate in upper secondary education includes first-time graduates at ISCED97 level 3. For more information on the ISCED97 levels, see appendix A in this report. Mismatches between the coverage of the population data and the graduation data mean that the graduation rates for those countries that are net exporters of students may be underestimated and those that are net importers may be overestimated. Data for Australia and Saudi Arabia are not available.SOURCE: Organization for Economic Cooperation and Development (OECD). (2013a). Education at a Glance 2013: OECD Indicators, table A2.1a. Paris: Author.
Figure 25-2. Graduation rates in academic higher education below the doctoral level, by sex and country: 2011
0
20
40
60
80
100
Percent
Australia1
Country
Germany Italy Mexico UnitedKingdom
UnitedStates
FemaleMaleTotal
Canada1 Japan SaudiArabia
Turkey
50
41
59
35
27
44
31 30 3239
2532
4448
39
21 2023
182325
12
2421
5548
62
3932
45
1 Reference year is 2010 rather than 2011. NOTE: Education levels are defined according to the 1997 International Standard Classification of Education (ISCED97). The graduation rate in academic higher education below the doctoral level includes first-time graduates at ISCED97 level 5A. For more information on the ISCED97 levels, see appendix A in this report. Mismatches between the coverage of the population data and the graduation data mean that the graduation rates for those countries that are net exporters of students may be underestimated and those that are net importers may be overestimated. SOURCE: Organization for Economic Cooperation and Development (OECD). (2013a). Education at a Glance 2013: OECD Indicators, table A3.1a. Paris: Author.

80 INDICATORS PART V: EDUCATION RETURNS: EDUCATIONAL ATTAINMENT AND INCOME
Indicator
26EDUCATIONAL ATTAINMENT IN THE ADULT POPULATION
G-20 Countries Included: Argentina, Australia, Brazil, Canada, China, France, Germany, Indonesia, Italy, Japan, Mexico, Republic of Korea, Russian Federation, Saudi Arabia, South Africa, Turkey, United Kingdom, United States
Upper secondary education was the highest level of education attained by the largest percentage of 25- to 64-year-olds in France, Germany, the Republic of Korea, South Africa, the United Kingdom, and the United States.
This indicator describes the highest levels of education attained in 2011 by two groups in the populations of the G-20 countries: 25- to 64-year-olds (i.e., the working age population gener-ally) and 25- to 34-year-olds (i.e., young adults). First, the indicator presents the percentages of the working age populationwho completed each of three levels of education as their highest level: lower secondary education or below, upper secondary education,10 or higher education. Then, focusing solely on higher education, the indicator compares the percentages of the young adult population and the working age population, as well asthe percentages of young adult males and females, at this level of education.
In seven of the reporting G-20 countries (Argentina, Brazil, China, Indonesia, Mexico, Saudi Arabia, and Turkey), over 50 percentof 25- to 64-year-olds had completed lower secondary educa-tion or below as their highest level of educational attainment (figure 26-1). In Italy, too, the largest percentage of 25- to64-year-olds (44 percent) had completed lower secondary educa-tion or below.
Among the G-20 countries, upper secondary education was the highest level of education attained by the largest percentage of 25- to 64-year-olds in France, Germany, the Republic of Korea, South Africa, the United Kingdom, and the United States.11 In these countries, the percentages of 25- to 64-year-olds completing upper
secondary education ranged from 41 percent in the Republic of Korea to 59 percent in Germany.
The countries in which higher education represented the highest level of education attained by the largest percentage of 25- to 64-year-olds were Australia (38 percent), Canada (51 percent), and the Russian Federation (53 percent). In the United States, 42 percent of 25- to 64-year-olds completed higher education, a percentage similar to the United Kingdom (39 percent), the Republic of Korea (40 percent), and Japan (46 percent).
Compared to 25- to 64-year-olds, larger percentages of young adults (25- to 34-year-olds) had completed higher education in most of the G-20 countries (figure 26-2). The largest differences were in the Republic of Korea, France, and Japan (by 24, 13, and13 percentage points, respectively). Only in Germany were the rates of completion of higher education by young adults and 25- to 64-year-olds the same (28 percent), although the differences were small in Brazil (1 percentage point), the United States (1 percentage point), and the Russian Federation (3 percentage points).
In most G-20 countries, more female than male young adults had completed higher education, with the differences ranging from3 percentage points in the United Kingdom to 16 percentage points in Canada. In the United States, 48 percent of young adult females had completed higher education, compared to 38 percent of young adult males. These findings are consistent with historical data showing that more bachelor’s degrees have been awarded to women than to men since about the early 1980s (Snyder and Dillow 2013, table 310). The smallest differences in higher education comple-tion by sex were in Mexico (by 1 percentage point) and Turkey(by 2 percentage points) and were in favor of males.
Definitions and Methodolog
As shown in the figures, education levels are defined according to the 1997 International Standard Classification of Education (ISCED97). For more information on the ISCED97 levels, see appendix A.
The male-female percentage-point differences in higher education completion presented in the text were computed from unrounded numbers; therefore, they may differ from computations made using the rounded whole numbers that appear in figure 26-2.
10 In this indicator, the category of “upper secondary education” includes postsecondary nontertiary programs. See figure 26-1 and appendix A for more information on education levels.11 In Japan, data for preprimary, primary, and lower secondary education are included in the data for upper secondary education and thus it is not included in statements related to upper secondary education.

Indicator 26
INDICATORS PART V: EDUCATION RETURNS: EDUCATIONAL ATTAINMENT AND INCOME 81
Figure 26-1. Percentage distribution of the population ages 25 to 64, by highest level of education completed and country: 2011
58
28
14
26
36
38
57
32
12
11
37
51
64
19
17
19
41
40
6
66
19
15
41
52
6
11
47
42
54
46
44
41
14
72
20
8
14
59
28
28
42
30
78
19
10
68
18
51
14
39
53
41
4
#
Country
Higher education8Lower secondary education or below6 Upper secondary education7
0
20
40
60
80
100
Percent
UnitedStates
UnitedKingdom
TurkeySouthAfrica
Saudi Arabia5
RussianFederation
Republicof Korea
MexicoJapan4ItalyIndonesia3GermanyFranceChina2CanadaBrazilAustraliaArgentina1
1 Reference year is 2003 rather than 2011.2 Reference year is 2010 rather than 2011.3 Reference year is 2009 rather than 2011.4 In Japan, the data for ISCED97 levels 0 (preprimary education), 1 (primary education), and 2 (lower secondary education) are included in the data for upper secondary education. 5 Reference year is 2004 rather than 2011.6 Includes ISCED97 levels 0 (preprimary education), 1 (primary education), and 2 (lower secondary education). 7 Includes ISCED97 levels 3 (upper secondary education) and 4 (postsecondary nontertiary programs). 8 Includes ISCED97 levels 5A (academic higher education below the doctoral level), 5B (vocational higher education), and 6 (doctoral level of academic higher education). NOTE: Education levels are defined according to the 1997 International Standard Classification of Education (ISCED97). For more information on the ISCED97 levels, see appendix A in this report. Detail may not sum to totals because of rounding.SOURCE: Organization for Economic Cooperation and Development (OECD). (2013a). Education at a Glance 2013: OECD Indicators, table A1.1a. Paris: Author.

82 INDICATORS PART V: EDUCATION RETURNS: EDUCATIONAL ATTAINMENT AND INCOME
Indicator 26
Figure 26-2. Percentage of the population ages 25 to 34 who completed higher education, by sex and country: 2011
0
20
40
60
80
100
Percent
Australia
Country
Germany Italy Mexico UnitedKingdom
UnitedStates
FemaleMaleTotal
Canada Japan RussianFederation
Republicof Korea
45
Brazil France Turkey
38
51
13 1115
57
49
65
4339
47
28 2630
2116
26
5955
63 6461
67
2323 22
5650
63
19 2018
47 4548
4338
48
NOTE: Education levels are defined according to the 1997 International Standard Classification of Education (ISCED97). Higher education refers to ISCED97 levels 5A (academic higher education below the doctoral level), 5B (vocational higher education), and 6 (doctoral level of academic higher education). For more information on the ISCED97 levels, see appendix A in this report. Data are not available for Argentina, China, Indonesia, Saudi Arabia, and South Africa.SOURCE: Organization for Economic Cooperation and Development (OECD). (2013a). Education at a Glance 2013: OECD Indicators, table A1.3a and web table A1.3b. Paris: Author.

Indicator
INDICATORS PART V: EDUCATION RETURNS: EDUCATIONAL ATTAINMENT AND INCOME 83
27FIRST UNIVERSITY DEGREES BY FIELD OF STUDY
G-20 Countries Included: Argentina, Australia, Brazil, Canada, Germany, Indonesia, Italy, Japan, Mexico, Republic of Korea, Russian Federation, Saudi Arabia, South Africa, Turkey, United Kingdom, United States
In 2011, Japan, Saudi Arabia, and the United States were the only reporting G-20 countries in which the percentage of first university degrees awarded in science, mathematics, and en-gineering did not exceed the percentage awarded in the arts and humanities.
First university degree programs prepare students for advanced research and highly skilled professions. They vary in duration in different countries in different fields of study. In the United States, first university degree programs include bachelor’s degree programs, but not associate’s degree programs. This indicator compares the percentage of first university degrees awarded in four combined fields of study in 2011: social sciences, business, and law; science, mathematics, and engineering; the arts and humanities; and education.
In 2011, a greater percentage of first university degrees were awarded in the field of social sciences, business, and law than in any other field in 13 of 16 G-20 countries reporting data, including the United States (figure 27-1). In these 13 countries, about one-third to one-half of first university degrees were awarded in this field. Germany, the Republic of Korea, and Saudi Arabia were the exceptions.
In science, mathematics, and engineering, the percentage of firstuniversity degrees awarded in the United States was among the lowest in any of the reporting G-20 countries. Sixteen percent of first university degrees in the United States were awarded in this field, as were 10 percent in Brazil and 15 percent in Argentina. Germany and the Republic of Korea, which are two of the exceptions noted above, awarded the highest percentages of first
university degrees in science, mathematics, and engineering (30 and 34 percent, respectively).
Japan, Saudi Arabia, and the United States were the only reporting G-20 countries in which the percentage of first university degrees awarded in science, mathematics, and engineering did not exceed the percentage awarded in the arts and humanities. Rather, in Saudi Arabia and the United States, the percentage of degrees awarded in the arts and humanities (38 and 18 percent, respectively) was higher than the percentage of degrees awarded in science, mathematics, and engineering (23 and 16 percent, respectively), and in Japan the percentage was the same in both fields (19 percent). Indonesia awarded the lowest percentage of first university degrees in the arts and humanities (1 percent). Elsewhere, the percentages ranged from 2 percent in Brazil to 38 percent in Saudi Arabia. The arts and humanities was the field of study in which the smallest percentage of first university degrees were awarded in Brazil, Indonesia, Mexico, the Russian Federation, South Africa, and Turkey.
In most G-20 countries, however, education was the field of study in which the smallest percentage of first university degrees were awarded. This was true in Argentina, Australia, Canada, Germany, Italy, Japan, the Republic of Korea, the United Kingdom, and the United States. In these countries, the percentage of firstuniversity degrees awarded in education ranged from 5 percent in the United Kingdom to 11 percent in Australia and Canada. Brazil awarded the highest percentage of first university degrees in education (28 percent).
In absolute numbers, the United States and the Russian Federation awarded the most first university degrees overall, with over 2.1 and 1.8 million degrees, respectively, conferred in 2011 (table 27-1).
Definitions and Methodolog
The percentage of first university degrees awarded in a field of study is the share of the degrees awarded in that field relative to all first university degrees awarded in all fields for a given year. First university degrees correspond with ISCED97 level 5A.
The fields of study examined in this indicator follow the 1997 revision of the International Standard Classification of Education Major Field of Study (ISCED97 MFS) (United Nations Educational, Scientific and Cultural Organization 1997). The social sciences, business, and law combined field of study includes social and behavioral sciences (ISCED97 31), journalism and information (ISCED97 32), business and administration (ISCED97 34), and law (ISCED97 38). The science, mathematics, and engineering combined field of study includes life sciences (ISCED97 42), physical sciences (ISCED97 44), mathematics and statistics (ISCED97 46),
computing (ISCED97 48), engineering and engineering trades (ISCED97 52), manufacturing and processing (ISCED97 54), and architecture and building (ISCED97 58). The arts and humanities combined field of study includes arts (ISCED97 21) and humanities (ISCED97 22). The education combined field of study includes teacher training (ISCED97 141) and education science (ISCED97 142). “Other” fields of study include agriculture, forestry, and fishery (ISCED97 62); veterinary (ISCED97 64); health (ISCED97 72); social services (ISCED97 76); personal services (ISCED97 81); transport services (ISCED97 84); environmental protection (ISCED97 85); security services (ISCED97 86); and fields of study not known or unspecified. For more information on the ISCED97 levels, see appendix A in this report.

Indicator 27Figure 27-1. Percentage distribution of first university degrees awarded, by field of study and country: 2011
47
41
39
37
28
40
34
37
46
25
55
20
55
49
32
41 16
24
18
23
23
34
18 18
21
8
5
18
9
11
38
19
4 10
5
6
16
8
13
9
7
12
7
6
20
9
11
28
11
615
17
10
20
30
26
22
19
27
14
11
19
22
14
11
20
20
22
246
13
13
22
1
16
19
4
2
6
21
Percent
Arts and humanities3Science, mathematics, and engineering2Social sciences, business, and law1 Other5Education4
1000 20 40 60 80
United States
United Kingdom
RussianFederation
Germany
Canada
Argentina
Country
Australia
Indonesia
Mexico
Republic of Korea
Saudi Arabia
South Africa
Turkey
Japan
Italy
Brazil
84 INDICATORS PART V: EDUCATION RETURNS: EDUCATIONAL ATTAINMENT AND INCOME
1 Includes social and behavioral sciences (ISCED97 31), journalism and information (ISCED97 32), business and administration (ISCED97 34), and law (ISCED97 38).2 Includes life sciences (ISCED97 42), physical sciences (ISCED97 44), mathematics and statistics (ISCED97 46), computing (ISCED97 48), engineering and engineering trades (ISCED97 52), manufacturing and processing (ISCED97 54), and architecture and building (ISCED97 58).3 Includes arts (ISCED97 21) and humanities (ISCED97 22).4 Includes teacher training (ISCED97 141) and education science (ISCED97 142).5 Includes agriculture, forestry, and fishery (ISCED97 62); veterinary (ISCED97 64); health (ISCED97 72); social services (ISCED97 76); personal services (ISCED97 81); transport services (ISCED97 84); environmental protection (ISCED97 85); security services (ISCED97 86); and fields of study not known or unspecified.NOTE: The fields of education shown follow the 1997 revision of the International Standard Classification of Education Major Field of Study (ISCED97 MFS) (UNESCO 1997). Programs that prepare students for advanced research and highly qualified professions are classified as first university degree programs, which correspond to ISCED97 level 5A. For more information on the ISCED97 levels, see appendix A in this report. Detail may not sum to totals because of rounding.SOURCE: Organization for Economic Cooperation and Development. (2013b). Education Database. Retrieved August 13, 2013, from http://stats.oecd.org.

Indicator
INDICATORS PART V: EDUCATION RETURNS: EDUCATIONAL ATTAINMENT AND INCOME 85
27
Table 27-1. Number of first university degree recipients, by field of study and country: 2011
Country Total
Field of study
Social sciences, business, and law1
Science, mathematics,
and engineering2Arts and
humanities3 Education4 Other5
Argentina 80,296 38,120 12,445 5,053 5,011 19,667 Australia 203,906 80,439 33,743 25,109 21,413 43,202 Brazil 846,078 327,904 88,212 18,548 238,597 172,817 Canada 173,021 63,807 34,102 22,540 18,477 34,095 Germany 383,166 108,825 113,805 84,941 33,379 42,216 Indonesia 531,943 211,966 136,932 2,925 106,314 73,806 Italy 216,509 73,319 48,486 33,721 14,070 46,913 Japan 568,368 208,381 108,346 105,709 37,377 108,555 Mexico 402,476 184,000 108,458 17,785 49,631 42,602 Republic of Korea 321,798 79,899 110,555 62,717 22,332 46,295 Russian Federation 1,441,533 790,638 331,439 55,460 126,925 137,071 Saudi Arabia 84,418 16,747 19,645 32,282 10,698 5,046 South Africa 61,194 33,726 12,751 3,135 4,675 6,907 Turkey 284,459 140,711 49,866 22,285 45,277 26,320 United Kingdom 367,875 116,151 89,153 78,224 16,681 67,665 United States 1,715,913 709,496 277,961 314,270 103,992 310,194
1 Includes social and behavioral sciences (ISCED97 31), journalism and information (ISCED97 32), business and administration (ISCED97 34), and law (ISCED97 38). 2 Includes life sciences (ISCED97 42), physical sciences (ISCED97 44), mathematics and statistics (ISCED97 46), computing (ISCED97 48), engineering and engineering trades (ISCED97 52), manufacturing and processing (ISCED97 54), and architecture and building (ISCED97 58). 3 Includes arts (ISCED97 21) and humanities (ISCED97 22). 4 Includes teacher training (ISCED97 141) and education science (ISCED97 142). 5 Includes agriculture, forestry, and fishery (ISCED97 62); veterinary (ISCED97 64); health (ISCED97 72); social services (ISCED97 76); personal services (ISCED97 81); transport services (ISCED97 84); environmental protection (ISCED97 85); security services (ISCED97 86); and fields of study not known or unspecified.NOTE: The fields of education shown follow the 1997 revision of the International Standard Classification of Education Major Field of Study (ISCED97 MFS) (UNESCO 1997). Programs that prepare students for advanced research and highly qualified professions are classified as first university degree programs, which correspond to ISCED97 level 5A. For more information on the ISCED97 levels, see appendix A in this report. Detail may not sum to totals because of rounding. SOURCE: Organization for Economic Cooperation and Development. (2013b). Education Database. Retrieved August 13, 2013, from http://stats.oecd.org.

Indicator
86 INDICATORS PART V: EDUCATION RETURNS: EDUCATIONAL ATTAINMENT AND INCOME
28EMPLOYMENT RATES
G-20 Countries Included: Australia, Brazil, Canada, France, Germany, Italy, Japan, Mexico, Republic of Korea, Russian Federation, Turkey, United Kingdom, United States
In the United States and all other G-20 countries reporting data in 2011, higher employment rates were associated with higher levels of educational attainment.
This indicator examines the employment rate of 25- to 64-year-olds (i.e., adults of typical working age). High employment rates in the working age population can be one aspect of a strong economy, but may also reflect social and economic policies. This indicator examines employment rates among the working age populationby different levels of education for men and women.
In the United States and all other G-20 countries reporting datain 2011, higher employment rates were associated with higherlevels of educational attainment (figure 28-1). For example, employment rates for 25- to 64-year-olds with academic higher education were 76 percent or higher in all reporting G-20 countries, compared with employment rates of 67 percent or below for 25- to 64-year-olds with lower secondary education or below as their highest level of education. Germany had the highest employment rate (88 percent) for working age adults with academic higher education; in the United States, the employment rate for this group was 81 percent.
In every reporting G-20 country, employment rates rose with each successively higher education level, but the specific advantage of higher levels of education varied by country. The advantage of upper secondary education over lower secondary education or below ranged from 3 percentage points in Brazil to over20 percentage points in Germany, Italy, the Russian Federation, and the United Kingdom. In these latter four countries as well as four others (Australia, Canada, France, and the United States), this advantage was greater than that of academic higher education over upper secondary education. In the United States, the difference in the employment rate between 25- to 64-year-olds with upper secondary education and those with lower secondary education or below was 16 percentage points.
The advantage of academic higher education over upper secondary education ranged from 5 percentage points in Australia and the United Kingdom to 15 percentage points in Brazil. In Brazil, the Republic of Korea, and Turkey, this advantage was greater than that of upper secondary education over lower secondary education or below. In the United States, the difference in the employment rate between 25- to 64-year-olds with academic higher education and those with upper secondary education was 14 percentage points.
Examining differences in employment rates among 25- to 64-year-olds by sex shows that, in all reporting G-20 countries, men at all education levels had higher employment rates than women with comparable education (figure 28-2). For example, men who had completed academic higher education had employment rates of 84 percent (in Turkey) to 92 percent (in Brazil and Japan), whereas women with the same level of education had employment rates of 62 percent (in the Republic of Korea) to 84 percent (in Germany).
For men who had completed upper secondary education, employ-ment rates ranged from 72 percent (in the United States) to89 percent (in Australia and Brazil); for women, they ranged from 30 percent (in Turkey) to 73 percent (in Germany and the United Kingdom). For men who had completed lower secondary education or below, employment rates ranged from 57 percent (in the Russian Federation) to 87 percent (in Mexico); for women, they ranged from 26 percent (in Turkey) to 57 percent (in the Republic of Korea).
In five countries (Brazil, Japan, Mexico, the Republic of Korea, and Turkey), a higher percentage of men who had completed any education level were employed than were women who had completed academic higher education.12
Moreover, for men, the association between having only lower secondary education or below and employment rates was weaker than it was for women in all countries except Japan and the Republic of Korea. Differences between 25- to 64-year-olds with academic higher education and those with lower secondary education or below were 30 percentage points or more among women in 9 countries (including the United States), whereas they were no more than 25 percentage points in any country among men (except the Russian Federation, where the difference was34 percentage points).
Employment rates for men in all but two G-20 countries (the Republic of Korea and the United States) also were less likely than those for women to be affected by the lack of academic higher education than by the lack of upper secondary education. This was especially true in Turkey, where the gap between 25- to 64-year-olds at these two levels of education was 2 percentage points among men and 34 percentage points among women. In the United States, the advantage of academic higher education over upper secondary education was 14 percentage points for both men and women.
12 In Japan, data for preprimary, primary, and lower secondary education (for both men and women) are included in the data for upper secondary education.

Indicator 28
INDICATORS PART V: EDUCATION RETURNS: EDUCATIONAL ATTAINMENT AND INCOME 87
28
Definitions and Methodolog
The employment rate of adults at a particular level of educational attainment is calculated as the number of individuals with that level of educational attainment who are employed divided by the total number of individuals with the same level of educational attainment. This indicator examines the employment rate of adults ages 25 to 64.
As shown in the accompanying figures, education levels are define according to the 1997 International Standard Classification of Education (ISCED97). For more information on the ISCED97 levels, see appendix A. Individuals whose highest level of education is
academic higher education have completed at least a first university degree program, which prepares students for advanced research and highly skilled professions. First university degree programs vary in duration in different countries in different programs of study. In the United States, first university degree programs include bachelor’s degree programs, but not associate’s degree programs.
Percentage-point differences presented in the text were com-puted from unrounded numbers; therefore, they may differ from computations made using the rounded whole numbers that appear in the figures

88 INDICATORS PART V: EDUCATION RETURNS: EDUCATIONAL ATTAINMENT AND INCOME
Indicator 28
Figure 28-1. Employment rates of adults ages 25 to 64, by highest level of education and country: 2011
0
20
40
60
80
100
Percent
Australia
Country
Germany Italy Mexico UnitedKingdom
UnitedStates
Academic higher education4Upper secondary education3Lower secondary education or below2
Canada Japan1 RussianFederation
Republicof Korea
Brazil France Turkey
66 6770
8186 85
55 56
74 74
82 83
57
78
88
51
7279
73
84
62
71
79
6571
78
49
73
86
51
62
76
56
7884
51
67
81
1 In Japan, the data for ISCED97 levels 0 (preprimary education), 1 (primary education), and 2 (lower secondary education) are included in the data for upper secondary education. 2 Includes ISCED97 levels 0 (preprimary education), 1 (primary education), and 2 (lower secondary education). 3 Includes ISCED97 levels 3 (upper secondary education) and 4 (postsecondary nontertiary programs). 4 Includes ISCED97 levels 5A (academic higher education below the doctoral level) and 6 (doctoral level of academic higher education). NOTE: Education levels are defined according to the 1997 International Standard Classification of Education (ISCED97). For more information on the ISCED97 levels, see appendix A in this report. SOURCE: Organization for Economic Cooperation and Development (OECD). (2013a). Education at a Glance 2013: OECD Indicators, table A5.1a and web table A5.3b. Paris: Author.

Indicator 28Figure 28-2. Employment rates of adults ages 25 to 64, by sex, highest level of education, and country: 2011
81
70
56
9189
7781
5450
80
68
44
80
69
49
84
73
49
70
55
42
75
63
33
64
3026
83
65
40
7973
48
76
62
40
86
72
61
8883
66
90
79
57
848275
908478
92
85
908787
575862
68
61
8581
68
91
82
67
86
78
63
8579
64
928984
Country
F M F M F M F M F M F M F M F M F M F M F M F M F M
Japan1
Academic higher education2
Upper secondary education3
Lower secondary education or below4
Academic higher education2
Upper secondary education3
Lower secondary education or below4
Female (F) employment rate Male (M) employment rate
France Germany Italy Mexico TurkeyCanadaBrazilAustralia Republicof Korea
RussianFederation
UnitedKingdom
UnitedStates
20
40
60
80
100
0
Percent
INDICATORS PART V: EDUCATION RETURNS: EDUCATIONAL ATTAINMENT AND INCOME 89
1 In Japan, the data for ISCED97 levels 0 (preprimary education), 1 (primary education), and 2 (lower secondary education) are included in the data for upper secondary education. 2 Includes ISCED97 levels 5A (academic higher education below the doctoral level) and 6 (doctoral level of academic higher education).3 Includes ISCED97 levels 3 (upper secondary education) and 4 (postsecondary nontertiary programs). 4 Includes ISCED97 levels 0 (preprimary education), 1 (primary education), and 2 (lower secondary education). NOTE: Education levels are defined according to the 1997 International Standard Classification of Education (ISCED97). For more information on the ISCED97 levels, see appendix A in this report. ‘F’ represents “female” and ‘M’ represents “male.”SOURCE: Organization for Economic Cooperation and Development (OECD). (2013a). Education at a Glance 2013: OECD Indicators, A5.1b and web tables A5.3c and A5.3d. Paris: Author.

90 INDICATORS PART V: EDUCATION RETURNS: EDUCATIONAL ATTAINMENT AND INCOME
Indicator
29DISTRIBUTION OF POPULATION BY EDUCATION AND INCOME
G-20 Countries Included: Australia, Brazil, Canada, France, Germany, Italy, Republic of Korea, United Kingdom, United States
At each successively higher level of education, there were higher percentages of adults ages 25 to 64 across the reportingG-20 countries who earned more than the median income, as well as who earned more than twice the median income, than their counterparts with less education.
This indicator examines the relationship between education and income among adults ages 25 to 64 in the G-20 countries. It compares the percentages of adults with different levels of education at different points on the income distribution, including those who earn more than the median income in their countries, as well as those at the extremes of distribution ( i.e., below half of the median income and more than twice the median income).13
The education levels examined are lower secondary educationor below, upper secondary education, and academic higher education. Income comparisons are made relative to each country’s respective median income and are generally for 2011.
In all reporting G-20 countries, higher levels of education were associated with higher income (as well as lower rates of low income). At each successively higher level of education, there were larger percentages of adults ages 25 to 64 who earned more than the median income and more than twice the median income than their counterparts with less education (as well as smaller percentages of adults who earned at or below half of the median income) (figure 29-1 and table 29-1)
Among U.S. 25- to 64-year-olds whose highest level of educational attainment was lower secondary education or below, 15 percent earned more than the median income in 2011 (figure 29-1). The U.S. percentage was lower than that in any other G-20 country reporting data, where the percentages ranged from 16 percent in the Republic of Korea and the United Kingdom to 46 percent in Brazil. Three percent of U.S. 25- to 64-year-olds with this level of education earned more than two times the country’s median income (table 29-1). The corresponding percentages in the other G-20 countries ranged from 1 percent in, again, the
Republic of Korea and the United Kingdom to 13 percent in Brazil. In contrast, 47 percent of such U.S. adults earned at or belowhalf of the country’s median income, which was a higher ratethan that in any other G-20 country reporting data, where thepercentages ranged from 23 percent in Brazil to 37 percent inthe United Kingdom.
Among U.S. 25- to 64-year-olds whose highest level of educational attainment was upper secondary education, 38 percent earned more than the median income in 2011 (figure 29-1). The U.S. percentage was lower than that in any other G-20 country reporting data except the Republic of Korea, which also had38 percent. The corresponding percentages in the other G-20 countries ranged from 40 percent in the United Kingdom to54 percent in Italy. (Italy was the only reporting G-20 country in which more than half of the adults with an upper secondary education earned more than the country’s median income.)Eight percent of U.S. 25- to 64-year-olds with an upper secondary education earned more than two times the country’s median income (table 29-1). The corresponding percentages in the other G-20 countries ranged from 5 percent in Germany, France, andthe United Kingdom to 32 percent in Brazil. In contrast,26 percent of such U.S. adults earned at or below half of the country’s median income; in the other G-20 countries, the percent-ages ranged from 6 percent in Brazil to 27 percent in Canada.
Among U.S. 25-to 64-year-olds who had completed academic higher education, 68 percent earned more than the medianincome in 2011 (figure 29-1). The corresponding percentages in the other G-20 countries ranged from 65 percent in Canada to94 percent in Brazil. Thirty percent of U.S. 25- to 64-year-oldswith this level of education earned more than two times thecountry’s median income (table 29-1). The correspondingpercentages in the other G-20 countries ranged from 24 percentin France to 74 percent in Brazil. In contrast, 13 percent of suchU.S. adults earned at or below half of the country’s median income; in the other G-20 countries, the percentages ranged from 2 percent in Brazil to 18 percent in Canada.
Definitions and Methodolog
Income refers to pretax income.
As shown in the accompanying table and figure, education levels are defined according to the 1997 International Standard Classification of Education (ISCED97). For more information on the ISCED97 levels, see appendix A. Individuals whose highest level of education is academic higher education have completed
at least a first university degree program, which prepares students for advanced research and highly skilled professions. First university degree programs vary in duration in different countries in different programs of study. In the United States, first university degree programs include bachelor’s degree programs, but not associate’s degree programs.
13 For example, in 2011, the median annual income for people age 15 and older in the United States was about $27,500 (U.S. Census Bureau, 2014). The subgroup of people in the United States earning more than two times the U.S. median income would have had an average annual income of over $55,000; the subgroup earning at or below half of the U.S. median income would have had an average annual income of $13,750 or less.

Indicator
INDICATORS PART V: EDUCATION RETURNS: EDUCATIONAL ATTAINMENT AND INCOME 91
29
Figure 29-1. Percentage of population ages 25 to 64 who earned more than the median income, by highest level of education and country: 2011
0
20
40
60
80
100
Percent
Australia1
Country
Germany Italy1 UnitedKingdom
UnitedStates
Academic higher education5Upper secondary education4Lower secondary education or below3
Canada2 Republicof Korea
Brazil France1
28
43
68
46
73
94
31
43
65
30
46
71
33
43
70
36
54
69
16
38
74
16
40
73
15
38
68
1 Reference year is 2009 rather than 2011.2 Reference year is 2010 rather than 2011.3 Includes ISCED97 levels 0 (preprimary education), 1 (primary education), and 2 (lower secondary education). 4 Includes ISCED97 levels 3 (upper secondary education) and 4 (postsecondary nontertiary programs). 5 Includes ISCED97 levels 5A (academic higher education below the doctoral level) and 6 (doctoral level of academic higher education). NOTE: The Republic of Korea reports earnings net of income tax. Education levels are defined according to the 1997 International Standard Classification of Education (ISCED97). For more information on the ISCED97 levels, see appendix A in this report.SOURCE: Organization for Economic Cooperation and Development (OECD). (2013a). Education at a Glance 2013: OECD Indicators, web table A6.4a. Paris: Author.
Table 29-1. Percentage of the population ages 25 to 64, by highest level of education, income, and country: 2011
Country
Lower secondary education or below1
Upper secondary education2
Academic higher education3
At or below half of the
median income
More than two times
the median income
At or below half of the
median income
More than two times
the median income
At or below half of the
median income
More than two times
the median income
Australia4 24 3 15 6 10 18Brazil 23 13 6 32 2 74Canada5 36 6 27 10 18 29
France4 33 4 19 5 10 24Germany 32 3 25 5 13 28Italy4 26 4 16 9 13 25
Republic of Korea 32 1 15 6 4 26United Kingdom 37 1 21 5 9 26United States 47 3 26 8 13 30
1 Includes ISCED97 levels 0 (preprimary education), 1 (primary education), and 2 (lower secondary education). 2 Includes ISCED97 levels 3 (upper secondary education) and 4 (postsecondary nontertiary programs). 3 Includes ISCED97 levels 5A (academic higher education below the doctoral level) and 6 (doctoral level of academic higher education). 4 Reference year is 2009 rather than 2011.5 Reference year is 2010 rather than 2011.NOTE: The Republic of Korea reports earnings net of income tax. See the source listed below for the additional income categories that make up the full percentage distribution: more than half the median but at or below the median, more than the median but at or below 1.5 times the median, and more than 1.5 times the median but at or below 2.0 times the median. Education levels are defined according to the 1997 International Standard Classification of Education (ISCED97). For more information on the ISCED97 levels, see appendix A in this report.SOURCE: Organization for Economic Cooperation and Development (OECD). (2013a). Education at a Glance: 2013 OECD Indicators, web table A6.4a. Paris: Author.

92 REFERENCES
REFERENCESMartin, M.O., and Mullis, I.V.S. (2013). Methods and Procedures
in TIMSS and PIRLS 2011. Chestnut Hill, MA: TIMSS and PIRLS International Study Center, Lynch School of Education, Boston College.
Organization for Economic Cooperation and Development (OECD). (2003). Education at a Glance 2003: OECD Indicators. Paris: Author.
Organization for Economic Cooperation and Development (OECD). (2012). Education at a Glance 2012: OECD Indicators. Paris: Author.
Organization for Economic Cooperation and Development (OECD). (2013a). Education at a Glance 2013: OECD Indicators. Paris: Author.
Organization for Economic Cooperation and Development (OECD). (2013b). Education Database. Retrieved August 13, 2013, from http://stats.oecd.org.
Organization for Economic Cooperation and Development (OECD). (2014). PISA 2012 Technical Report. Paris: OECD.
Organization for Economic Cooperation and Development (OECD). (in press). Technical Report of the Survey of Adult Skills (PIAAC). Paris: OECD.
Snyder, T.D., and Dillow, S.A. (2013). Digest of Education Statistics 2012 (NCES 2014-015). National Center for Education Statistics, Institute of Education Sciences, U.S. Department of Education. Washington, DC.
The World Bank. (2013). World Databank 2013. Retrieved June 17, 2013 from http://data.worldbank.org/indicator/NY.GDP.PCAP.PP.CD.
United Nations Educational, Scientific and Cultural Organization. (1997). International Standard Classification of Education, ISCED97 1997. Montreal, Canada: Author.
U.S. Census Bureau. (2014). Historical Income Tables: People. Retrieved September 29, 2014, from https://www.census.gov/hhes/www/income/data/historical/people/.
U.S. Department of Commerce, U.S. Census Bureau. (2012). International Data Base (IDB). Available from http://www.census.gov/population/international/data/idb/information-Gateway.php.
U.S. Department of Education, National Center for Education Statistics. (2013). International Data Explorer [database]. Available from http://nces.ed.gov/surveys/international/ide/.

APPENDIX AAPPENDIX AThe Education Systems of
the G-20 Countries

94 APPENDIX A: THE EDUCATION SYSTEMS OF THE G-20 COUNTRIES
THE EDUCATION SYSTEMS OF THE G-20 COUNTRIES
Reader’s Guide: Education System ChartsDifferences in the structure of countries’ education systems often make international comparisons difficult. To improve the comparability of education indicators, the United Nations Educational, Scientific and Cultural Organization created an internationally comparable method for describing levels of education across countries called the International Standard Classifi ation of Education (ISCED). This classification system was revised in 1997 and is referred to as the ISCED97. Using the ISCED97 classifi ations as a starting point, NCES worked with education professionals in the G-20 countries to create an overview of each country’s education system.
There are differences within the education systems of some G-20 countries because responsibilities and oversight for education take place at the regional or local level. However, the charts and accompanying text in this appendix are intended to give the reader a general overview of the education system in each G-20 country, from the preprimary to the doctoral level.
The reader is encouraged to seek out additional resources to gain a fuller understanding of each country’s education system. A list of websites with additional information is provided at the end of this Reader’s Guide, and additional sources are cited after each country’s education system is presented.
How to read the charts
Each of the charts on the following pages is a broad representation of the education system of a G-20 country. The charts are not intended to show all possible pathways that a student can take or the many configurations of grades that may be found within the same school. Rather, each chart is intended to provide a general description that is useful for comparison across the G-20 countries.
The colors on each chart correspond to ISCED97 levels (see next section). The ISCED97 term for each level of education is written within each block. The terms in italics in each block are a country’s designation for that particular level (e.g., high school for upper secondary school). The left side of each chart is labeled with the typical ages corresponding to each level of education. The age labels represent the typical age at which a student begins the corresponding year of schooling; often, students are 1 year older at the end of the school year. Ages in bold text are the ages at
which enrollment is universal, defined here as an enrollment rate of more than 90 percent.1 The rectangular box encasing some ages represents the range of ages at which enrollment is compul-sory, or required by law. (Also see Indicator 2 for information on the age range at which more than 90 percent of the population is enrolled in formal education and the ending age of compulsory education.2) The expected duration of a first university degree program, a bachelor’s degree program in the United States, is listed in the note below each chart. On the right side of each chart are the years of schooling (“grade,” in the United States) corre-sponding to each level of education. The first year of schooling corresponds to the first year of compulsory education. The ages and years listed assume normal progress through the education system.
ISCED97 levels
The ISCED97 is a classification framework that allows the alignment of the content of education systems across countries using multiple classification criteria. The ISCED97 levels address the intent (e.g., to study basic subjects or prepare students for university) of each year of a particular education system, but do not indicate the depth or rigor of study in that year. Thus, the ISCED97 is useful when comparing the age range of students in upper secondary schools across nations; however, it does not indicate whether the curriculum and standards are equivalent within the same year of schooling across nations. The ISCED97 allows researchers to compile statistics on education internationally. The ISCED97 levels are as follows:• ISCED97 level 0 is classified as preprimary education. This is
defined as the initial stage of organized instruction, designedprimarily to introduce very young children to a school-typeenvironment. ISCED97 level 0 programs can either be center- or school-based. Preschool and kindergarten programs in theUnited States fall into the level 0 category, although kinder-garten is typically considered an elementary grade in theUnited States.
• ISCED97 level 1 consists of primary education, which usuallylasts 4 to 6 years. ISCED97 level 1 typically begins betweenages 5 and 7, and is the stage where students begin to studybasic subjects, such as reading, writing, and mathematics. Inthe United States, elementary school (grades 1 through 6) isclassified as level 1
1 When available for a country, universal enrollment data came from the Organization for Economic Cooperation and Development’s (OECD) Education at a Glance (EAG) 2013: OECD Indicators, even when there was additional information available from the country expert, in order to ensure consistent application of the shared 90 percent threshold across countries. In one case (China), the universal enrollment data were not available from EAG and were provided by the country expert. In three other cases (Saudi Arabia, South Africa, and Indonesia), data on universal enrollment were not available.2 In some cases, the data in EAG/Indicator 2 differed from what was provided by country experts. In cases, where the appendices provide different data from Indicator 2, these are indicated in footnotes along with the rationale.

APPENDIX A: THE EDUCATION SYSTEMS OF THE G-20 COUNTRIES 95
• At ISCED97 level 2, or lower secondary education, students continue to learn the basic subjects taught in level 1, but this level is typically more subject-specific than level 1 and may be taught by specialized teachers. ISCED97 level 2 usually lasts between 2 and 6 years, and begins around the age of 11. Middle school and junior high (grades 7 through 9) in the United States are classified as level 2
• At ISCED97 level 3, or upper secondary education, student coursework is generally subject specific and often taught by specialized teachers. Students often enter upper secondary education at the age of 15 or 16 and attend anywhere from 2 to 5 years. ISCED97 level 3 can prepare students for university, other postsecondary education, or the labor force. Senior high school (grades 10 through 12) is considered level 3 in the United States.
• ISCED97 level 4 programs consist of postsecondary nontertiary programs. Postsecondary nontertiary programs are primarily vocational and are taken after the completion of secondary school, though the content is not more advanced than the content of secondary school courses. Although not included in the charts, postsecondary nontertiary programs are described in the text. ISCED97 level 4 programs in the United States are often in the form of 1-year certificate programs
• Tertiary programs3
3 In the international classification, more advanced postsecondary education (such as attending a 4-year college or university) is referred to as “tertiary education.” In the current report, the term “higher education” is used because this term is more familiar to American readers.
are divided into ISCED97 levels 5A, 5B, and 6. ISCED97 level 5A refers to academic higher education below the doctoral level. Level 5A programs are intended to provide sufficient qualifications to gain entry into advanced research programs and professions with high skill requirements. The international classification includes programs of medium length that last less than 5 years and long programs that last 5 to 7 years. In the United States, bachelor’s, master’s, and firstprofessional degree programs are classified as ISCED97 level 5A. ISCED97 level 5B refers to vocational higher education. Level 5B programs provide a higher level of career and technical education and are designed to prepare students for the labor market. In the international classification, these programs last 2 to 4 years. In the United States, associate’s degree programs are classified at this level. ISCED97 level 6 refers to the doctoral level of academic higher education. Level 6 programs usually require the completion of a research thesis or dissertation.
Text format
The text accompanying each chart is meant to give the reader more detail on each country’s education system. The bulleted format is designed to make quick comparisons more convenient, and the text is divided into sections corresponding to the ISCED97 levels. The “NOTE” heading in each section presents information that is important, but that may not be included either in the chart or the bulleted text, including within-country variations or features of the education system that are unique to a particular country.
Websites with additional information
Argentina: http://www.ibe.unesco.org/National_Reports/ICE_2008/argentina_NR08_es.pdf
Australia: http://www.ibe.unesco.org/fileadmin/user_upload/Publications/WDE/2010/pdf-versions/Australia.pdf
Brazil: http://www.ibe.unesco.org/fileadmin/user_upload/Publications/WDE/2010/pdf-versions/Brazil.pdf
Canada: http://www.statcan.gc.ca/pub/81-582-x/81-582-x2007001-eng.pdf
China: http://www.ibe.unesco.org/fileadmin/user_upload/Publications/WDE/2010/pdf-versions/China.pdf
France: http://eacea.ec.europa.eu/education/eurydice/documents/facts_and_figures/education_structures_EN.pd
Germany: http://eacea.ec.europa.eu/education/eurydice/documents/facts_and_figures/education_structures_EN.pd
India: http://www.ibe.unesco.org/fileadmin/user_upload/Publications/WDE/2010/pdf-versions/India.pdf
Indonesia: https://www.epnuffic.nl/en/publications/educationsystem-indonesia.pdf
Italy: http://eacea.ec.europa.eu/education/eurydice/documents/facts_and_figures/education_structures_EN.pd
Japan: http://www.mext.go.jp/list_001/list_016/__icsFiles/afielfile/2 10/09/08/mext_2010_e.pdf
Mexico: http://fs.planeacion.sep.gob.mx/estadistica_e_indicadores/principales_cifras/principales_cifras_2013_2014.pdf
Republic of Korea: http://www.ibe.unesco.org/fileadmin/userupload/Publications/WDE/2010/pdf-versions/Republic_of_Korea.pdf
Russian Federation: http://www.euroeducation.net/prof/russco.htm
Saudi Arabia: http://www.ibe.unesco.org/fileadmin/user_upload/Publications/WDE/2010/pdf-versions/Saudi_Arabia.pdf
South Africa: http://www.ibe.unesco.org/fileadmin/user_uploadPublications/WDE/2010/pdf-versions/South_Africa.pdf
Turkey: http://eacea.ec.europa.eu/education/eurydice/documents/facts_and_figures/education_structures_EN.pd
United Kingdom:
England, Northern Ireland, and Wales: http://eacea.ec.europa.eu/education/eurydice/documents/facts_and_figures/education_structures_EN.pdf
Scotland: http://eacea.ec.europa.eu/education/eurydice/documents/facts_and_figures/education_structures_EN.pd
United States: http://www2.ed.gov/about/offices/list/ous/international/usnei/us/edlite-structure-us.html

96 APPENDIX A: THE EDUCATION SYSTEMS OF THE G-20 COUNTRIES
The Education System in Argentina
Figure A-1. Levels of education in Argentina, by age and year of schooling: 2013
PreprimaryJardin maternal, jardin de infantes
Postsecondary and tertiaryUniversidad, instituto universitario, instituto superior
PrimaryEscuela primaria
Lower secondaryEscuela secundaria—ciclo basico
ISCED97 levels 4–6
ISCED97 level 0
ISCED97 level 1
ISCED97 level 2
ISCED97 level 3
Upper secondaryEscuela secundaria—ciclo orientado
Year of schoolingAge Levels of education
4
21
3
56789
101112131415161718
123456789
101112
56789
10111213141516
NOTE: Education levels are defined according to the 1997 International Standard Classification of Education (ISCED97). Ages represent the typical age at the mid-term (June 30th). Numbers in bold print indicate ages of universal enrollment (i.e., an enrollment rate of over 90 percent). Numbers highlighted represent the age at which compulsory enrollment begins through the age at which compulsory enrollment ends. No meaning should be inferred from width of subdivisions. Duration of first university degree program is generally 4 to 5 years in Argentina. A striped box indicates that at the corresponding age or grade level, a student may be in a school classified in either of the boundary ISCED levels.SOURCE: Ministerio de Educacion. (2008). Education Evolution: National Report of Argentina 2004–2008. Paris: UNESCO. Retrieved on April 12, 2013, from http://www.ibe.unesco.org/National_Reports/ICE_2008/argentina_NR08_es.pdf; Theiler, J. C. (2005). Internalization of Higher Education in Argentina. In H. de Wit, I.C. Jaramillo, J. Gacel-Avila, & J. Knight (Eds), Higher Education in Latin America: The International Dimension, pp. 71-110. Washington, D.C.: The World Bank. Retrieved on April 12, 2013, from http://siteresources.worldbank.org/EXTLACREGTOPEDUCATION/Resources/Higher_Ed_in_LAC_Intnal_Dimension.pdf; United Nations Education, Scientific and Cultural Organization. (2010/11). Datos Mundiales de Educacion: VII Ed. (World Data on Education). Paris: Author. Retrieved on April 12, 2013, from http://www.ibe.unesco.org/fileadmin/user_upload/Publications/WDE/2010/pdf-versions/Argentina.pdf.
Preprimary:• Common name: Jardin maternal (day care nursery), jardin de
infantes (kindergarten)• Ages of attendance: As early as 45 days old through age 5 • Number of years: 1 to more than 5• Start of universal enrollment: Age 5• Compulsory: Yes, begins at age 5
NOTE: Preprimary education encompasses day care institutions for children from 45 days old to 2 years old and kindergarten for children from 3 to 5 years old.
Primary: • Common name: Escuela primaria• Ages of attendance: 6 through 11 or 12• Number of years: 6 or 7• Universal enrollment: Yes• Compulsory: Yes
Lower secondary:• Common name: Escuela secundaria—ciclo basico• Ages of attendance: 12 or 13 through 14• Number of years: 2 or 3• Universal enrollment: Yes• Compulsory: Yes• Entrance/exit criteria: Students do not receive a diploma as the
upper secondary level is compulsory.
Upper secondary:• Common name: Escuela secundaria—ciclo orientado• Ages of attendance: 15 through 17 • Number of years: 3• Universal enrollment: Through age 15• Compulsory: Through age 16• Entrance/exit criteria: Students who pass the last year of the
lower secondary level are enrolled in the first year of the upper secondary level. They receive their diploma when they pass all the courses of the level.

APPENDIX A: THE EDUCATION SYSTEMS OF THE G-20 COUNTRIES 97
NOTE: Primary education and secondary education total 12 years of schooling. Jurisdictions may choose a structure that comprises 7 years of primary and 5 years of secondary education or 6 years of primary and 6 years of secondary education.
Postsecondary and tertiary:• Common name: Universidad, instituto universitario, instituto
superior• Ages of attendance: Varies • Number of years: Varies according to degree program• Universal enrollment: No• Entrance criteria: Argentina does not have a common national
evaluation system for all incoming students. Access is regulated by the universities and institutes themselves. While the regula-tions vary, most public universities have unrestricted admission, except for preadmission, support, and remedial courses.
NOTE: The organizational structure of the higher education system consists of two subsystems: university institutions and nonuniversity institutions. Within the first subsystem, universities (universidades) pursue activities in a variety of disciplines and offer predegree programs, undergraduate programs, and graduate programs, while university institutes (institutos universitario) are confined to a single discipline. Within the second subsystem, nonuniversity institutions include teacher training institutions (insitutos superiors de formacion docente), technical training (institutos de formacion tecnica), art education schools, and various “short courses” (courses lasting 1 to 4 years). Historically, there has been almost no coordination between the two subsystems.
Common degree programs:• Licenciado: 4- to 5-year bachelor’s degree. • Especialización: A degree that requires at least a year to attain.
It implies further training in a discipline or in an interdisciplinary field after the bachelor s degree.
• Maestría: In addition to the requisites for specialization, a master’s degree includes carrying out a project or defending a thesis under the guidance of a supervisor.
• Doctorado: Doctoral degree, which aims at producing true and original contributions in a specific field of knowledge within a frame of academic excellence. These contributions are presented in a doctoral thesis and culminate in an evaluation by a jury.
Sources:
Argentine Republic, Ministry of Education. (2008). Education Evolution: National Report of Argentina 2004–2008. Paris: United Nations Educational, Scientific and Cultural Organization, International Bureau of Education. Retrieved April 12, 2013, from http://www.ibe.unesco.org/National_Reports/ICE_2008/argentina_NR08_es.pdf.
Theiler, J.C. (2005). Internationalization of Higher Education in Argentina. In H. de Wit, I.C. Jaramillo, J. Gacel-Avila, and J. Knight (Eds.), Higher Education in Latin America: The International Dimension (pp. 71–110). Washington, DC: The World Bank. Retrieved April 12, 2013, from http://siteresources.worldbank.org/EXTLACREGTOPEDUCATION/Resources/Higher_Ed_in_LAC_Intnal_Dimension.pdf.
United Nations Educational, Scientific and Cultural Organization, International Bureau of Education. (2010). World Data on Education, 2010/11 (7th edition). Profile on Argentina. Paris: Author. Retrieved April 12, 2013, from http://www. ibe.unesco.org/fileadmin/user_upload/Publications/WDE/2010/pdf-versions/Argentina.pdf.

98 APPENDIX A: THE EDUCATION SYSTEMS OF THE G-20 COUNTRIES
The Education System in Australia
Figure A-2. Levels of education in Australia, by age and year of schooling: 2013
Postsecondary and tertiaryHigher education, university
PrimaryPrimary school
Lower secondarySecondary school
ISCED97 levels 4–6
ISCED97 level 0
ISCED97 level 1
ISCED97 level 2
ISCED97 level 3
Upper secondarySenior secondary school
Year of schoolingAge Levels of education
PreprimaryPre-school, kindergarten
4
3
5
6789
1011
121314151617
18
1
2
3
4
5
6
7
8
9
10
11
12
6789
1011
1213141516
NOTE: Education levels are defined according to the 1997 International Standard Classification of Education (ISCED97). Ages represent the typical age at the beginning of the school year. Numbers in bold print indicate ages of universal enrollment (i.e., an enrollment rate of over 90 percent). Numbers highlighted represent the age at which compulsory enrollment begins through the age at which compulsory enrollment ends. No meaning should be inferred from width of subdivisions. Duration of first university degree program is generally 3 or 4 years in Australia. A striped box indicates that at the corresponding age or grade level, a student may be in a school classified in either of the boundary ISCED levels.SOURCE: Former Australian Government Department of Education, Employment, and Workplace Relations, Retrieved March 27, 2013, from http://deewr.gov.au/school-education; Australian Government, Australian Education International, Country Education Profiles, Retrieved March 27, 2013 from http://www.ibe.unesco.org/fileadmin/user_upload/Publications/WDE/2010/pdf-versions/Australia.pdf; Organization for Economic Cooperation and Development. (2013). Education at a Glance: OECD Indicators. Paris: Author.
NOTE: There are regional differences within the education system of Australia because responsibilities and oversight for education take place at the state or territory level. However, the purpose of this document is to present a brief, general summary of education in Australia. The sources cited at the end of this section provide more specific details
Preprimary:• Common name: Preschool, kindergarten• Ages of attendance: As early as age 3 through age 5 • Number of years: 1 to 3 • Start of universal enrollment: Age 5 • Compulsory: No
NOTE: Programs are part time and consist of several half-day sessions (or the equivalent in full days) and combine structured learning and creative individual activities.
Primary: • Common name: Primary school • Ages of attendance: As early as age 5 through age 10 or 11• Number of years: 7 to 8 • Start of universal enrollment: Age 5
• Universal enrollment: Yes • Compulsory: Yes, begins at age 6
NOTE: Primary school begins with a preparatory year—known as kindergarten, reception, preprimary, or transition—and continues until year 6 or 7. The preparatory year is not compulsory, but almost all children attend.
Lower secondary:• Common name: Secondary school• Ages of attendance: 11 or 12 through 14• Number of years: 3 to 4• Universal enrollment: Yes• Compulsory: Yes • Entrance/exit criteria: There are no standard examination
requirements for progression into secondary school, and no formal qualifications are awarded.
NOTE: Secondary school includes either years 7 to 10 or years 8 to 10. In the Australian Capital Territory (ACT), only students awarded an ACT Year 10 School Certificate (based on academic performance, attendance, and conduct) are eligible to continue to senior secondary school.

APPENDIX A: THE EDUCATION SYSTEMS OF THE G-20 COUNTRIES 99
Upper secondary: • Common name: Senior secondary school • Ages of attendance: 15 to 17• Number of years: 2 • Universal enrollment: Through age 16 • Compulsory: Through age 16• Entrance/exit criteria: Senior secondary school includes
years 11 and 12. The final school-leaving qualification is known generally as the Senior Secondary Certificate of Education (Year 12 award), which is an Australian Qualifications Frame-work (AQF) qualification. However, different names are used for the certificate in each state and territory. There are also senior secondary awards outside the state and territory school systems, such as the International Baccalaureate.
NOTE: Upper secondary programs in Australia are specialized to ensure that graduates of senior secondary school can enter directly into tertiary education without the need for general education subjects. Vocational education and training (VET) is offered to both secondary and senior secondary students.
Postsecondary and tertiary:• Common name: Higher education, university• Ages of attendance: Varies• Number of years: Varies according to degree program• Universal enrollment: No • Entrance criteria: The Senior Secondary Certificate of Education
gives access to tertiary education in the higher education and VET sectors. Undergraduate admission (for the diploma, advanced diploma, associate’s degree, and bachelor’s degree) is usually based on the Australian Tertiary Admission Rank (ATAR), which is calculated by a state or territory Tertiary Admission Center (TAC) based on the Senior Secondary Certificate of Education. An ATAR indicates a student’s ranking relative to other students and is used in all states and territories except Queensland. Other undergraduate admission pathways include a VET qualification; an interview, portfolio or work, or prerequisite courses; mature-age entry for students over age 25 based on related work experience; or a demonstrated aptitude for study. Entry into a bachelor honors degree program is usually based on academic achievement in a related bachelor’s degree program. Entry into a graduate certificate, graduate diploma, or master’s degree program is usually based on a bachelor’s degree. Entry into a doctoral program is based on a research-based master’s degree or a bachelor honors degree.
NOTE: Tertiary education includes higher education and vocational education and training. Higher education in Australia refers to university and nonuniversity institutions that award AQF level 5 to 10 qualifications. Programs can be either full or part time, and distance and online education are common. Australia does not have a national credit system; instead, the AQF defines qualifications and indicates the typical volume of learning required in terms of years of full-time study. Each institution has its own credit system, and the credits earned in these various systems cannot be converted into study hours or credit hours.
Common degree programs:• Diploma: 1- to 2-year programs that prepare graduates
for paraprofessional work or further learning based on an applied academic course. Diploma graduates may continue to employment or further education in the higher education sector (usually up to 1 year of credit in a related bachelor’s degree program). The diploma is also offered as a VET qualification.
• Advanced diploma: 18-month to 2-year programs that prepare graduates for paraprofessional or advanced skilled work or further learning. Advanced diploma graduates may continue to employment or further education in the higher education sector (usually with 1 to 2 years of credit in a related bachelor’s degree program). The advanced diploma is also offered as a VET qualification.
• Associate’s degree: 2-year programs that prepare graduates for paraprofessional work or further learning. Associate’s degree graduates may continue to employment or further education in the higher education sector (usually with 1 ½ to 2 years of credit in a related bachelor’s degree program). The associate’s degree and the advanced diploma are at the same level on the AQF; the difference is in the focus of the programs. Associate’s degrees are more academically oriented, whereas advanced diplomas emphasize vocational or professional studies.
• Bachelor’s degree: Bachelor’s degrees include 3-year, 4-year, professional, and combined degrees. Bachelor’s degree programs in professional fields usually require 4 or more years of full-time study, with additional time required for professional preparation. Some institutions offer bachelor’s degree programs that cannot be entered directly from senior secondary school. Most of these programs are in professional specializations and are known as graduate-entry bachelor’s degrees.
• Bachelor honors degree: Requires an additional year of study after a bachelor’s degree or may be undertaken as a 4-year integrated program. A significant research thesis or project is required.
• Graduate certificate: Graduate certificate programs require one semester of full-time study. A graduate certificate extends the knowledge and skills gained in a preceding bachelor’s degree or other qualification
• Graduate diploma: Graduate diploma programs require 1 year of full-time study. A graduate diploma, which extends the knowledge and skills gained in a preceding bachelor’s degree or other qualification, may be awarded if a student completes postgraduate preparatory work (such as the first stages of a master’s degree) but does not continue to the degree course.
• Master’s degree: Requires 18 months to 2 years of full-time study after a 3-year bachelor’s degree or 1 year of full-time study after a 4-year (or longer) bachelor’s degree or bachelor honors degree. There are three types of programs: coursework, research, and extended.
• Doctoral degree: Doctoral degree programs usually require 3 to 4 years of full-time study and require the completion of a thesis, dissertation, or exegesis. There are two types of programs: research and professional.

100 APPENDIX A: THE EDUCATION SYSTEMS OF THE G-20 COUNTRIES
Sources:
Australian Government, Department of Education, Employment, and Workplace Relations. School Education. Retrieved March 27, 2013, from http://deewr.gov.au/school-education.
Organization for Economic Cooperation and Development. (2013a). Education at a Glance 2013: OECD Indicators. Paris: Author.
United Nations Educational, Scientific and Cultural Organization, International Bureau of Education. (2010). World Data on Education, 2010/11 (7th edition). Profile on Australia. Paris: Author. Retrieved March 30, 2015 from: http://www.ibe. unesco.org/fileadmin/user_upload/Publications/WDE/2010/pdf-versions/Australia.pdf.

APPENDIX A: THE EDUCATION SYSTEMS OF THE G-20 COUNTRIES 101
The Education System in Brazil
Figure A-3. Levels of education in Brazil, by age and year of schooling: 2013
PreprimaryEducação infantil, crèches, pré-escolas
Postsecondary and tertiaryEnsino superior
PrimaryEnsino fundamental I
Lower secondaryEnsino fundamental II
ISCED97 levels 4–6
ISCED97 level 0
ISCED97 level 1
ISCED97 level 2
ISCED97 level 3
Upper secondaryEnsino médio
Year of schoolingAge Levels of education
4
2
5
6789
10111213141516
17
18
1
2
3
4
5
6
7
8
9
10
11
12
3
6789
1011121314
NOTE: Education levels are defined according to the 1997 International Standard Classification of Education (ISCED97). Ages represent the typical age at the beginning of the school year. Numbers in bold print indicate ages of universal enrollment (i.e., an enrollment rate of over 90 percent). Numbers highlighted represent the age at which compulsory enrollment begins through the age at which compulsory enrollment ends. No meaning should be inferred from width of subdivisions. Duration of first university degree program is generally 4 years in Brazil.SOURCE: UNESCO International Bureau of Education, “World Data on Education: Brazil,” Retrieved April 1, 2013, from http://www.ibe.unesco.org/fileadmin/user_upload/Publications/WDE/2010/pdf-versions/Brazil.pdf; World Education Services, “World Education Profiles: Brazil,” Retrieved on April 1, 2013, from http://www.wes.org/ca/wedb/brazil/bredov.htm.
Preprimary:• Common name: Educação infantil (preschool education),
including crèches and pré-escolas • Ages of attendance:
Crèches—through age 3 Pré-escolas—4 to 5
• Number of years: Varies, but up to 4 • Start of universal enrollment: Does not begin in preprimary;
see below • Compulsory: No
Primary: • Common name: Ensino fundamental I• Ages of attendance: 6 to 10• Number of years: 5• Start of universal enrollment: Age 6• Universal enrollment: Yes• Compulsory: Yes, begins at 6
NOTE: In Brazil, it is mandatory for children to go to school from age 6 to 14. Children under the age of 6 may be enrolled as long as they turn 6 in the first semester. These compulsory 9 years of education are known as “fundamental education” (ensino fundamental) and are divided into levels I and II.
Lower secondary:• Common name: Ensino fundamental II• Ages of attendance: 11 through 14• Number of years: 4• Universal enrollment: Yes• Compulsory: Yes• Entrance/exit criteria: Under the state system, an exam is given
to all pupils at the end of each academic year to determine whether they will move on to the next year or be held back to repeat a year. Thus, the age mixture is often quite varied.
NOTE: The normal practice in Brazilian schools, both public and private, is to mix all academic levels together in the same class.

102 APPENDIX A: THE EDUCATION SYSTEMS OF THE G-20 COUNTRIES
Upper secondary:• Common name: Ensino médio (intermediate)• Ages of attendance: 15 through 17• Number of years: 3• Universal enrollment: Through age 15 • Compulsory: No4
• Entrance/exit criteria: A student who has completed the ensino fundamental can access secondary education without taking an entrance examination.
NOTE: Although not compulsory, upper secondary schooling is considered part of basic education. The Brazilian government separates technical education from secondary schools; thus, technical education is outside of the formal ensino médio. Students who complete basic vocational training at the secondary level receive a Certificado de Habilitaçáo Básico (Certificate of Basic Training), which enables them to take a university entrance examination, enter the job market, or undergo further technical training leading to a Diploma de Técnico de Nivel Medio (Diploma of Intermediate-Level Technician) or Diploma de Técnico de 2º Grau (Diploma of Technician of the Second Level).
Postsecondary and tertiary:• Common name: Ensino superior (higher education)• Ages of attendance: Varies• Number of years: Varies according to degree• Universal enrollment: No • Entrance criteria: Historically, to enter a public university,
students had to take an entrance exam, known as the Vestibular (the same exam was not required for private universities). Though the Vestibular is the most traditional means to assess students’ knowledge gained in secondary school, and some universities still use it, the middle school national exam (Enem) and the secondary school periodic evaluation are other ways for students to enter higher education programs. The Enem is a voluntary examination for those finishing secondary school and is now widely used for students applying to public or private universities. The secondary school periodic evaluation takes place in a progressive manner, with tests taken at the end of each secondary school grade.
NOTE: Higher education is provided at two levels of study: graduate and postgraduate. The latter includes both lato sensu (refresher courses, further education, or specialization courses) and stricto sensu (master’s and doctoral programs). Higher education is provided by higher education institutes and universities. High- level training of professionals for one or more professions or careers is provided mainly by nonuniversity institutions. Universities must promote basic and applied research, as well as provide services to the community in the form of courses and other extension activities.
Common degree programs:• Vocational/technical certificates and degrees: Certificado
de Conclusâo de 2º Grau (Certificate of Conclusion of Second Level); Certificado de Habilitaçáo Básico (Certificate of Basic Training); Diploma de Técnico de Nivel Medio (Diploma of Intermediate-Level Technician); Diploma de Técnico de 2º Grau (Diploma of Technician of the Second Level); Certificado de Auxiliar Técnico (Certificate of echnical Assistant).
• Bachelor’s degree (Graduação): 4-year postsecondary program that requires up to 2,400 study hours.
• Teaching licensure (Licenciatura): After completing a bachelor’s degree program, students can take an additional 1 year of lecture courses for a teaching specialization.
• Professional degree (Título Profissional): 5-year degree awarded for professional careers such as architecture, engineering, veterinary science, medicine, and law.
• Master’s degree (Mestrado): Graduate programs at a university requiring 2 years beyond the bachelor’s degree.
• Doctoral degree (Doutorado): Requires a minimum of 2 years following the master’s degree.
Sources:
Anglo Info. Brazil: The School System. Retrieved April 1, 2013, from http://brazil.angloinfo.com/family/schooling-educa-tion/school-system/.
Organization for Economic Cooperation and Development (2013a). Education at a Glance 2013: OECD Indicators. Paris: Author.
United Nations Educational, Scientific and Cultural Organization, International Bureau of Education. (2010). World Data on Education, 2010/11 (7th edition). Profile on Brazil. Paris: Author. Retrieved April 1, 2013, from http://www.ibe.unesco.org/fileadmin/user_upload/Publications/WDE/2 10/pdf-versions/Brazil.pdf.
World Education Services. Brazil: Educational Review. Retrieved April 1, 2013, from http://www.wes.org/ca/wedb/brazil/bredov.htm.
4 The duration of compulsory education is currently 9 years (ending at age 15, as shown here and in the accompanying figure A-3). However, a 2009 constitutional amendment mandated that, by 2016, compulsory education be extended to age 17. Indicator 2 reports the latter figure and so will differ from the information presented here.

APPENDIX A: THE EDUCATION SYSTEMS OF THE G-20 COUNTRIES 103
The Education System in Canada
Figure A-4. Levels of education in Canada, by age and year of schooling: 2013
Preprimary Preschool, pre-elementary, kindergarten
Postsecondary and tertiaryCollege, community college, regional college, university college, university
PrimaryElementary school
Lower secondaryMiddle school, intermediate school, junior high school, secondary school
ISCED97 levels 4–6
ISCED97 level 0
ISCED97 level 1
ISCED97 level 2
ISCED97 level 3
Upper secondaryHigh school, senior high school, secondary school
Year of schoolingAge Levels of education
4
6
7
8
9
10
11
12
13
14
15
16
17
18
1
2
3
4
5
6
7
8
9
10
11
12
5
6
7
8
9
10
11
12
13
14
15
16
17
NOTE: Education levels are defined according to the 1997 International Standard Classification of Education (ISCED97). Ages represent the typical age at the beginning of the school year. Numbers in bold print indicate ages of universal enrollment (i.e., an enrollment rate of over 90 percent). Numbers highlighted represent the age at which compulsory enrollment begins through the age at which compulsory enrollment ends. No meaning should be inferred from width of subdivisions. Duration of first university degree program is generally 4 years in Canada.SOURCE: Miller, D.C. and Warren L.K. (2011). Comparative Indicators of Education in the United States and Other G-8 Countries: 2011 (NCES 2012-007). U.S. Department of Education, National Center for Education Statistics. Washington, DC: U.S. Government Printing Office.
NOTE: There is no federal educational system across Canada; rather, education falls under the jurisdiction of Canada’s 10 provinces and three territories. While these 13 education systems share similarities, there are differences across the education systems in Canada because responsibilities and oversight for education take place at the regional or local level. However, the purpose of this document is to present a brief, general summary of education in Canada. The sources cited at the end of this section provide more specific details
Preprimary:• Common name: Preschool, pre-elementary, kindergarten • Ages of attendance: As early as age 4 to age 5 • Number of years: 1 to 2• Start of universal enrollment: Does not begin in preprimary;
see below • Compulsory: Generally no, but yes in some provinces
NOTE: All provinces and territories have some form of pre-elementary (kindergarten) education, operated by the local education authorities and offering one year of pre-grade 1, noncompulsory education for 5-year-olds. In Nova Scotia, New Brunswick, and Prince Edward Island, kindergarten is compulsory for 5-year-olds. In some jurisdictions, an additional 1 year of pre-elementary programs is offered.
Primary: • Common name: Elementary school• Ages of attendance: 6 to 11• Number of years: 6• Start of universal enrollment: Age 6• Universal enrollment: Yes• Compulsory: Yes, begins at age 6
NOTE: Elementary school can begin at age 6 or 7 in Canada, depending on the jurisdiction. Based on the ISCED97, the firs 6 years of formal schooling are considered primary school, although in some jurisdictions primary school can last for up to 8 years.
Lower secondary:• Common name: Middle school, intermediate school, junior high
school, secondary school• Ages of attendance: 12 to 14• Number of years: 2 to 3• Universal enrollment: Yes• Compulsory: Yes• Entrance/exit criteria: No

104 APPENDIX A: THE EDUCATION SYSTEMS OF THE G-20 COUNTRIES
NOTE: Based on the ISCED97, the 2 to 3 years of schooling following primary school are classified as lower secondary school in Canada. Students may attend 2- or 3-year junior high schools or middle schools, or they may go directly to a secondary school that includes both lower and upper secondary school.
Upper secondary:• Common name: High school, senior high school, secondary
school• Ages of attendance: 15 to 17 (graduation generally at age 18)• Number of years: 3 to 4• Universal enrollment: Through age 17• Compulsory: Until age 16 in most jurisdictions, although it
extends until age 18 or graduation from secondary school in others.
• Entrance/exit criteria: Some provinces have what could be considered an exit exam (e.g., Ontario administers a grade 10 literacy test and Quebec requires that students take core subject exams, which are a significant part of the graduation requirements).
NOTE: Based on the ISCED97, the last 3 years of schooling prior to receiving a high school diploma are classified as upper secondary school in Canada. Senior high schools may be up to 4 years in length, and many students attend secondary schools that include both lower and upper secondary school programs.
Postsecondary and tertiary:• Common name: College, community college, regional college,
university college, university• Ages of attendance: Varies• Number of years: Varies according to degree• Universal enrollment: No • Entrance criteria: Graduation from a secondary school
academic or university preparatory program—or, in the case of Quebec, completion of a 2-year pre-university program— is typically the minimum requirement to be eligible for admission to undergraduate degree programs. However, most institutions and/or departments set their own admissions standards, often with more rigorous requirements.
Common degree programs:• Pre-university programs: 2-year programs that students in
Quebec are generally required to complete before they are eligible to attend university.
• Certificate: 1-year programs offered at universities, colleges, regional colleges, community colleges, institutes, and colleges of applied arts and technology (the name depends on the jurisdiction). These programs are vocational and are oriented toward preparing students for the labor force in semi- professional and technical fields
• Diploma: 2- to 3-year programs offered at community colleges, regional colleges, etc. These programs are vocational and are oriented toward preparing students for the labor force in semiprofessional and technical fields
• Bachelor’s degree: 3- to 4-year academic programs at a university college or university. (University bachelor’s degree programs are usually 4 years, while university college programs can be 3 or 4 years.)
• Master’s degree: Graduate programs at a university requiring 1 to 2 years beyond the bachelor’s degree. This degree is designed to prepare students for professional careers.
• Doctorate: Academic graduate programs at a university requiring 3 to 5 years after the bachelor’s degree. Doctoral programs prepare students for careers in research.
Sources:
Canadian Education Statistics Council. (2007). Report of the Pan-Canadian Education Indicators Program, appendix 1. Ontario, Canada: Statistics Canada. Retrieved March 22, 2013, from http://www.statcan.gc.ca/pub/81-582-x/81-582-x2007001-eng.pdf.
Marlow-Ferguson, R. (Ed.) (2002). World Education Encyclopedia: A Survey of Educational Systems Worldwide, Vol. 1 (2nd ed.). Farmington Hills, MI: Gale Group.
Organization for Economic Cooperation and Development. (1996). Education at a Glance 1996: OECD Indicators. Paris: Author.
Robitaille, D.F. (1997). National Contexts for Mathematics and Science Education: An Encyclopedia of the Education Systems Participating in TIMSS. Vancouver, Canada: PacificEducational Press.

APPENDIX A: THE EDUCATION SYSTEMS OF THE G-20 COUNTRIES 105
The Education System in China
Figure A-5. Levels of education in China, by age and year of schooling: 2013
Preprimary Preschool, kindergarten, prep school
Postsecondary and tertiaryCollege, university
PrimaryPrimary school
ISCED97 levels 4–6
ISCED97 level 0
ISCED97 level 1
ISCED97 level 2
ISCED97 level 3
GeneralCommon senior middle school
Year of schoolingAge Levels of education
Upper secondary
VocationalSecondary vocational education
Lower secondary
GeneralCommon junior middle school
VocationalVocational junior middle school
3
67
89
1011
12
1314
1516
17
18
1
2
3
4
5
6
7
8
9
10
11
12
5
19
4
67
89
1011
12
1314
NOTE: Education levels are defined according to the 1997 International Standard Classification of Education (ISCED97). Ages represent the typical age at the beginning of the school year. Numbers in bold print indicate ages of universal enrollment (i.e., an enrollment rate of over 90 percent). Numbers highlighted represent the age at which compulsory enrollment begins through the age at which compulsory enrollment ends. No meaning should be inferred from width of subdivisions. Duration of first university degree program is generally 4 years in China.SOURCE: Netherlands Organization for International Cooperation in Higher Education (NUFFIC). (2012). Country Module: China. The Hague: Author. Retrieved April 17, 2013 from http://www.nuffic.nl/en/diploma-recognition/country-modules/country-modules; United Nations Educational, Scientific and Cultural Organization (UNESCO). (2011). World Data on Education: 7th edition, 2010/11. Paris: Author. Retrieved April 12, 2013, from http://www.ibe.unesco.org/fileadmin/user_upload/Publications/WDE/2010/pdf-versions/China.pdf.
Preprimary:• Common name: Preschool, kindergarten, prep school• Ages of attendance: As early as age 3 through age 5• Number of years: 3• Start of universal enrollment: Age 3• Compulsory: No
Primary: • Common name: Primary school• Ages of attendance: 6 through 11• Number of years: 6 • Universal enrollment: Yes• Compulsory: Yes, begins at 6
Lower secondary:• Common name: Common junior middle school (chuzhong),
vocational junior middle school• Ages of attendance: 12 through 14• Number of years: 3• Universal enrollment: Yes• Compulsory: Yes• Entrance/exit criteria: None
NOTE: In most provinces, education is organized into 6 years of primary and 3 years of junior secondary education. However, in some provinces, education is organized into 5 years of primary and 4 years of junior secondary education.
Upper secondary:• Common name: Common senior middle school (gaozhong);
secondary vocational education (zhongzhuan), which includes secondary polytechnic school, technical school, and vocational senior middle school
• Ages of attendance: 15 through 17 • Number of years: 3• Universal enrollment: Through age 15• Compulsory: No• Entrance/exit criteria: Students must pass an entrance
examination to enter senior secondary education. The senior secondary level uses a credit system in which students must complete 144 credits of compulsory subjects and electives. At the end of the program, students take the “general ability test,” which is administered by provincial authorities and covers nine subjects; a practical exam in physics, chemistry, and biology; and an assessment in moral, ideological, and political development. If successful, students receive the senior middle school graduation certificate gaozhong).

106 APPENDIX A: THE EDUCATION SYSTEMS OF THE G-20 COUNTRIES
NOTE: Junior vocational schools mainly provide basic professional knowledge and skills. Senior vocational education consists of specialized schools that train workers to have the comprehensive professional abilities and qualities needed for positions in the forefront of production, service, technology, and management.
Postsecondary and tertiary:• Common name: College (xueyuan), university (daxue)• Ages of attendance: Varies • Number of years: Varies according to degree program• Universal enrollment: No• Entrance criteria: Admission to a college or university depends
on the results of a national entrance examination (gaokao). To enter a master’s degree program, applicants must have a bachelor’s degree and be successful on an entrance examination. To be admitted to a doctoral degree program, applicants must have a master’s degree, pass an entrance examination, and have formal recommendations from at least two professors.
NOTE: Programs that combine a master’s degree and a doctoral degree do not require an entrance examination for admission to the doctoral program.
Common degree programs:• Zhuanke: 2- to 3-year practically oriented program.• Xueshi xuewei: 4-year bachelor’s degree program (5 years in
the case of medicine, traditional Chinese medicine, architecture, and engineering).
• Shuoshi xuewei: 2- to 3-year master’s degree after a bachelor’s degree.
• Boshi: 3- to 5-year doctoral degree after a master’s degree.
Sources:
Netherlands Organization for International Cooperation in Higher Education. (2012). Country Module: China. The Hague: Author. Retrieved April 17, 2013, from http://www.nuffic.nlen/diploma-recognition/country-modules/country-modules.
United Nations Educational, Scientific and Cultural Organization, International Bureau of Education. (2011). World Data on Education, 2010/11 (7th edition). Profile on the People’s Republic of China. Paris: Author. Retrieved April 12, 2013, from http://www.ibe.unesco.org/fileadmin/user_upload/Publications/WDE/2010/pdf-versions/China.pdf.

APPENDIX A: THE EDUCATION SYSTEMS OF THE G-20 COUNTRIES 107
The Education System in France
Figure A-6. Levels of education in France, by age and year of schooling: 2013
PreprimaryÉcole maternelle
Postsecondary and tertiaryIUT, STS, université, grande école
PrimaryÉcole élémentaire
ISCED97 levels 4–6
ISCED97 level 0
ISCED97 level 1
ISCED97 level 2
ISCED97 level 3
Year of schoolingAge Levels of education
Lower secondaryCollège
VocationalEnseignement professional
AcademicEnseignement général
TechnologicalEnseignement technologique
Upper secondary/Lycée
2
6789
10111213141516
1718
123456789
1011
12
543
6789
101112131415
NOTE: Education levels are defined according to the 1997 International Standard Classification of Education (ISCED97). Ages represent the typical age at the beginning of the school year. Numbers in bold print indicate ages of universal enrollment (i.e., an enrollment rate of over 90 percent). Numbers highlighted represent the age at which compulsory enrollment begins through the age at which compulsory enrollment ends. No meaning should be inferred from width of subdivisions. Duration of first university degree program is generally 4 years in France.SOURCE: Miller, D.C. and Warren L.K. (2011). Comparative Indicators of Education in the United States and Other G-8 Countries: 2011 (NCES 2012-007). U.S. Department of Education, National Center for Education Statistics. Washington, DC: U.S. Government Printing Office.
Preprimary:• Common name: École maternelle• Ages of attendance: As early as age 2 through age 5• Number of years: 1 to 4• Start of universal enrollment: Age 3• Compulsory: No
Primary:• Common name: École élémentaire• Ages of attendance: 6 through 10• Number of years: 5• Universal enrollment: Yes• Compulsory: Yes, begins at age 6
Lower secondary: • Common name: Collège• Ages of attendance: 11 through 14• Number of years: 4• Universal enrollment: Yes• Compulsory: Yes
• Entrance/exit criteria: Yes; the diplôme national du brevet is the exit exam for lower secondary, but it doesn’t determine whether or not a student will attend lycée and is not required in order to enter lycée.
Upper secondary:• Common name: Lycée
Enseignement professional—Vocational upper secondary schoolEnseignement technologique—Technological upper second-ary schoolEnseignement général—Academic upper secondary school
• Ages: 15 through 17 (graduation generally at age 18)• Number of years: 3• Universal enrollment: Through age 17 (most students turn 18
during the last year of upper secondary school) • Compulsory: Through age 15• Entrance/exit criteria: In order to enter upper secondary
education, the principal, on the advice of the class council and discussions with the family, decides whether a student can progress to lycée. Students take a national examination, the baccalauréat, during the last year of secondary school, which determines entrance to university.

108 APPENDIX A: THE EDUCATION SYSTEMS OF THE G-20 COUNTRIES
NOTE: All three types of upper secondary school (enseignement professional, technologique, and général) qualify a student to enter university, although certain tracks are more likely to lead to university: the academic branch (enseignement général) typically leads to university and other forms of higher education; the technological branch (enseignement technologique) may also lead to specialized technological or professional forms of higher education; and the vocational branch (enseignement professional) more often leads to the labor force and/or job training.
Postsecondary and tertiary:• Common name: IUT, STS, université, grande école • Ages of attendance: Varies• Number of years: Varies according to degree or program• Universal enrollment: No• Entrance criteria: In order to enter into higher education
programs in France, students are required to have passed the baccalauréat or an equivalent. Entrance to the university is nonselective, meaning that students who have passed the baccalauréat are entitled to enter. There are, however, competitive entrance exams for the grandes écoles.
Common programs (short fields):• DUT (University degree in technology): Taken at the University
Institute of Technology (IUT). Two-year program in mostly vocational subjects. Student may choose to continue on toward a license (see section below).
• BTS (Higher technical diploma): Two-year program taken in higher education departments of lycées (STS, Institute for Higher Technical Studies); more specialized than a degree from IUT, but also in mostly vocational subjects.
Common degree programs (long fields):• Licence: 3-year bachelor’s degree.• Master 1: Degree following the licence. Requires 1 additional
year at university.
• Master 2: Follows the Master 1. There are two kinds of Master 2: “Master professionnel,” which is vocational; and “Master research,” which is designed to prepare students for doctoral research.
• Medical doctor/dental/pharmacy: Degree programs taken at the university. Programs vary in length and can lead to degrees such as the Diplôme d’etat de docteur en médecine, diplôme d’etat de docteur en pharmacie, and diplôme d’études spécialisées.
• Doctorat: Research-based graduate degree program at a university, leading to a doctorate. Usually requires 5 years of study beyond the Master.
• Diplôme grande école: Competitive degree programs (students must pass a selective entrance exam) in academic subjects, science, commerce, management, engineering, business, and architecture. These are typically 5-year programs and are taken at the grandes écoles.
Sources:
Eurydice. (2013). Eurydice Highlights: The Structure of the European Education Systems 2012/13. Brussels: Eurydice. Retrieved March 22, 2013, from http://eacea.ec.europa.eu/education/eurydice/documents/facts_and_figures/educ -tion_structures_EN.pdf.
Marlow-Ferguson, R. (Ed.) (2002). World Education Encyclopedia: A Survey of Educational Systems Worldwide, Vol. 1 (2nd ed.). Farmington Hills, MI: Gale Group.
Organization for Economic Cooperation and Development. (1996). Education at a Glance 1996: OECD Indicators. Paris: Author.
Robitaille, D.F. (1997). National Contexts for Mathematics and Science Education: An Encyclopedia of the Education Systems Participating in TIMSS. Vancouver, Canada: PacificEducational Press.

APPENDIX A: THE EDUCATION SYSTEMS OF THE G-20 COUNTRIES 109
The Education System in Germany
Figure A-7. Levels of education in Germany, by age and year of schooling: 2013
PreprimaryKindergarten
PrimaryGrundschule
ISCED97 levels 4–6
ISCED97 level 0
ISCED97 level 1
ISCED97 level 2
ISCED97 level 3
Year of schoolingAge Levels of education
Lower secondary— general
Hauptschule
Lower secondary— enhanced general
Realschule
Lower secondary— several courses of
educationSchulart mit
mehreren Bildungsgängen
Lower secondary— academic
Gymnasium
Lower secondary— integrated
Gesamtschule
Postsecondary and tertiaryBerufsakademie, Fachhochschule, Universität
Upper secondary—full-time
vocational Berufsfachschule
Upper secondary—vocational(part-time)
Berufsschule
Upper secondary—Prevocational
Übergangssystem
Upper secondary— full-time
vocationalFachoberschule
Upper secondary— academic
Gymnasiale Oberstufe
3
789
10111213
141516
17
12345678
91011
12
654
1819
13
789
10111213
141516
17
6
NOTE: Education levels are defined according to the 1997 International Standard Classification of Education (ISCED97). Ages represent the typical age at the beginning of the school year. Numbers in bold print indicate ages of universal enrollment (i.e., an enrollment rate of over 90 percent). Numbers highlighted represent the age at which compulsory enrollment begins through the age at which compulsory enrollment ends. No meaning should be inferred from width of subdivisions. Duration of first university degree program is generally 4 years in Germany.SOURCE: Miller, D.C. and Warren L.K. (2011). Comparative Indicators of Education in the United States and Other G-8 Countries: 2011 (NCES 2012-007). U.S. Department of Education, National Center for Education Statistics. Washington, DC: U.S. Government Printing Office.
NOTE: There are differences within the education system of Germany because responsibilities and oversight for compulsory education take place at the state (Länder) level. However, the purpose of this document is to present a brief, general summary of education in Germany. The sources cited at the end of this section provide more specific details
Preprimary:• Common name: Kindergarten• Ages of attendance: As early as age 3 through age 5• Number of years: 1 to 3• Start of universal enrollment: Age 4• Compulsory: No
NOTE: Students may attend preprimary programs from age 1.
Primary:• Common name: Grundschule• Ages of attendance: 6 through 9• Number of years: 4 • Universal enrollment: Yes• Compulsory: Yes, begins at age 6
NOTE: In two Länder (the German equivalent of states), Grundschule covers 6 grades.
Lower secondary: • Common name:
Hauptschule—Secondary school for basic general educationRealschule—Secondary school for more extensive general educationSchularten mit mehreren Bildungsgängen—Secondary school with several educational tracks, usually Hauptschule and RealschuleGesamtschule/Gemeinschaftsschule—Integrated secondary school, meaning that students are not split into tracks of different academic requirementsGymnasium—Secondary school for intensified academic education
• Ages of attendance: 10 through 15• Number of years: 5 to 6• Universal enrollment: Yes• Compulsory: Yes• Entrance/exit criteria: Based on a transition referral of the
primary school. If parents disagree, in some Länder, admissions tests determine if a student can take the education tracks of Realschule or Gymnasium.
NOTE: There are different types of secondary schools, some combining Hauptschule and Realschule (for reporting purposes,

110 APPENDIX A: THE EDUCATION SYSTEMS OF THE G-20 COUNTRIES
this type is referred to as Schule mit mehreren Bildungsgängen). During the last few years, many Länder have decided to focus on combining Hauptschule and Realschule rather than to continue with the separate educational tracks, mainly due to the decrease in the number of pupils. The secondary school that a student in Germany attends is determined by a combination of factors, depending on the Länder: admissions tests, previous grade point average, teacher recommendations, and parents’ wishes. The degree of flexibility that parents have in choosing which educational track their child enters also varies among Länder.
However, the type of school that a student attends is sometimes less important than the chosen track: at the end of lower secondary, all students who meet the requirements receive a leaving certificate. At the Hauptschule, it is generally the Hauptschulabschluss. In some Länder, students who excel may receive a Qualifizierter Hauptschulabschluss at the end of grade 9. In some Länder, students may obtain a Realschulabschluss on completing grade 10. (At the Realschule, students typically receive the Realschulabschluss—also called the Mittlerer Schulabschluss—and at the Gesamtschule, both types of diplomas are offered.) Although regulations differ between Länder, most students attending Gymnasium who advance to the upper secondary level automatically receive the Realschulabschluss.
Some Länder also have an orientation phase during the firs 2 years of lower secondary school, which gives parents and teachers 2 more years to decide a child’s educational path. In Länder with a 6-year primary school, lower secondary school is 2 years shorter.
Upper secondary:• Common name:
General education: � Gymnasiale Oberstufe: Academic upper secondary
school. Students typically continue from lower second-ary Gymnasium or Gesamtschule. Comprises grades 11 to 13 or 10 to 12.
Vocational education: � Berufsschule: 3- to 4-year vocational school, which
regularly includes an apprenticeship; students attend school part time while also doing an apprenticeship.
� Berufsfachschule: 1- to 3-year full-time specialized vocational school.
� Fachoberschule: 2-year specialized vocational high school.
� Übergangssystem: 1-year prevocational training or basic vocational training year for young people who do not have a training contract, helping them to choose a career and providing them with vocational basic training. It does not lead to a full vocational school qualification
• Ages: Generally 16 to 18 or 19• Number of years: 1 to 4• Universal enrollment: Through age 18 • Compulsory: Through age 17
• Entrance/exit criteria: Students must pass the Abitur, the general higher education entrance qualification for university entrance. Through certain courses of vocational education at the upper secondary level, students may pass the Fachabitur and obtain a qualification entitling the holder to study at a Fachhochschule.
NOTE: Gymnasium and Gesamtschule are generally combined lower and upper secondary schools, although students concentrate their studies on fewer subjects during the Gymnasiale Oberstufe. In most Länder, there is currently a gradual conversion from a 9-year to an 8-year Gymnasium course of education. Additionally, a few Länder offer the Berufsoberschule, a vocational upper secondary school for those who have completed vocational training or have 5 years of work experience.
Postsecondary and tertiary:• Common name: Berufsakademie, Fachhochschule, Universität• Ages of attendance: Varies
• Number of years: Varies according to degree• Universal enrollment: No• Entrance criteria: Traditionally, students must pass the Abitur
(general higher education entrance qualification) in order to enter university and must have at a minimum the Fachabitur (vocational upper secondary diploma) in order to enter the Fachhochschule. Recently, ways to enter Fachhochschule or Universität without the Abitur or the Fachabitur on the basis of vocational training and experience have been developed.
Common degree programs:• Diplom Berufsakademie—BA: 3-year program of academic
training combined with work experience. Offered at a Berufsakademie.
• Diplom Fachhochschule—FH: 4-year degree program in applied fields such as engineering, administration, social services, and design. Admission to a Fachhochschule is competitive because of restricted numbers of available spaces. Within the framework of the Bologna process,5 study programs in tertiary education move from Diplom to Bachelor and Master programs.
• Diplom Universität: Master’s degree equivalent usually requiring a minimum of 4 to 5 years of study. Universität offers this degree in academic fields as well as scientific, technical, and engineering fields. Within the framework of the Bologna process, study programs in tertiary education move from Diplom to Bachelor and Master programs.
• Bachelor: First university degree obtained after 3 to 4 years of study.
• Master: Second degree obtained after 1 to 2 years of study. Entrants must have obtained a Bachelor degree. Moreover, in some universities students must pass oral or written entrance examinations.
• Doktor: Doctoral degree program, focused on research and taken at university. Normally requires at least 3 years beyond the Diplom or Master.
5 The Bologna Process is a voluntary initiative undertaken by 46 nations to improve the transparency between individual nations’ higher education systems, as well as to implement tools to facilitate recognition of degrees and academic qualifications, mobility, and exchanges between institutions.

APPENDIX A: THE EDUCATION SYSTEMS OF THE G-20 COUNTRIES 111
Sources:
Autorengruppe Bildungsberichterstattung. (2010). Bildung in Deutschland 2010. Ein indikatorengestützter Bericht mit einer Analyse zu Perspektiven des Bildungswesens im demografischen Wandel [Education in Germany 2010. An Indicator-Based Report Including an Analysis of Demographic Challenges for the Education System]. Bielefeld: WBV.
Avenarius, H., and Füssel, H.-P. (2010). Schulrecht. Ein Handbuch für Praxis, Rechtsprechung und Wissenschaft [School laws. A Handbook for Practice, Law and Research] (8th ed.). Kronach: Carl Link.
Eurydice. (2013). Eurydice Highlights: The Structure of the European Education Systems 2012/13. Brussels: Eurydice. Retrieved March 22, 2013, from http://eacea.ec.europa.eu/education/eurydice/documents/facts_and_figures/educ -tion_structures_EN.pdf.
German Education Server (Deutscher Bildungs Server). (2006). Glossary for the Education System in the Federal Republic of Germany. Compiled chiefly by the Standing Conference of the State Ministers of Education and the Arts in the Federal Republic of Germany. Retrieved March 25, 2013, from http://www.eduserver.de/glossare.html?sp=1.
Marlow-Ferguson, R. (Ed.). (2002). World Education Encyclopedia: A Survey of Educational Systems Worldwide, Vol. 1 (2nd ed.). Farmington Hills, MI: Gale Group.
Organization for Economic Cooperation and Development. (1996). Education at a Glance 1996: OECD Indicators. Paris: Author.
Organization for Economic Cooperation and Development. (1999). INES Network A Newsletter, Issue 10. Paris: Author.
Robitaille, D.F. (1997). National Contexts for Mathematics and Science Education: An Encyclopedia of the Education Systems Participating in TIMSS. Vancouver, Canada: PacificEducational Press.
Secretariat of the Standing Conference of the Ministers of Education and Cultural Affairs of the Länder in the Federal Republic of Germany. (2010). Glossary on Education. Institutions, Examinations, Qualifications, Titles and Other Specialist Terms. Bonn: KMK. Retrieved March 25, 2013, from http://www.kmk.org/fileadmin/doc/DokumentationGlossary_dt_engl.pdf.

112 APPENDIX A: THE EDUCATION SYSTEMS OF THE G-20 COUNTRIES
The Education System in India
Figure A-8. Levels of education in India, by age and year of schooling: 2013
PreprimaryEarly childhood education
ISCED97 levels 4–6
ISCED97 level 0
ISCED97 level 1
ISCED97 level 2
ISCED97 level 3
Year of schoolingAge Levels of education
Postsecondary and tertiaryUniversity, college
Academic higher secondary
Vocational
Lower secondarySecondary
PrimaryUpper primary
Primary education
Upper secondary
3
7
8
9
10
11
12
13
14
15
16
17
1
2
3
4
5
6
7
8
9
10
11
12
6
5
4
18
7
8
9
10
11
12
13
14
6
NOTE: Education levels are defined according to the 1997 International Standard Classification of Education (ISCED97). Ages represent the typical age at the beginning of the school year. Universal enrollment data are not available for India. Numbers highlighted represent the age at which compulsory enrollment begins through the age at which compulsory enrollment ends. No meaning should be inferred from width of subdivisions. A striped box indicates that at the corresponding age or grade level, a student may be in a school classified in either of the boundary ISCED levels. A dotted box indicates a further subdivision within an ISCED level.SOURCE: Nordic Recognition Information Centres. (2006). The System of Education in India. Retrieved June 26, 2013 from http://www.nokut.no/Documents/NOKUT/Artikkelbibliotek/Kunnskapsbasen/Rapporter/UA/2006/The%20System%20of%20Education%20in%20India.pdf; and United Nations Education, Scientific and Cultural Organization, International Bureau of Education. (2011). World Data on Education, 2010/11 (7th edition). Profile on India. Paris: Author. Retrieved June 25, 2013, from http://www.ibe.unesco.org/fileadmin/user_upload/Publications/WDE/2010/pdf-versions/India.pdf.
Preprimary:• Common name: Early childhood education• Ages of attendance: As early as age 3 through age 5 • Number of years: 2 to 3 years• Start of universal enrollment: Data not available • Compulsory: No
NOTE: The National Policy on Education defines the objective of early childhood care and education (ECCE) as being the total development of children ages 0–6. The objective of early childhood education (ECE) or preprimary education, which is part of the ECCE, is to prepare children for school.
Primary: • Common name: Primary education, Upper primary• Ages of attendance: 6 through 12 or 13• Number of years: 7 or 8• Universal enrollment: Data not available• Compulsory: Yes, begins at 6
NOTE: In the case of 8-year programs, the main pattern followed is 5 years of primary and 3 years of upper primary education. In the case of 7-year programs, the main pattern is 4 years of primary and 3 years of upper primary education.
Lower secondary:• Common name: Secondary• Ages of attendance: 13 or 14 through 15• Number of years: 2 or 3• Universal enrollment: Data not available• Compulsory: Through age 14• Entrance/exit criteria: Terminal examination conducted at the
end of grade 10.
Upper secondary:• Common name: Higher secondary
Academic higher secondary Vocational secondary
• Ages of attendance: 16 through 17

APPENDIX A: THE EDUCATION SYSTEMS OF THE G-20 COUNTRIES 113
• Number of years: 2• Universal enrollment: Data not available • Compulsory: No• Entrance/exit criteria: Terminal examination conducted at the
end of grade 12.
NOTE: In 23 States and Union Territories (S/UTs), secondary education lasts 4 years, divided into 2 years of secondary and 2 years of academic higher secondary education. In 12 S/UTs, secondary education lasts 5 years, divided into 3 years of secondary and 2 years of academic higher secondary education. Vocational secondary education lasts 2 to 3 years.
Postsecondary and tertiary:• Common name: University, college• Ages of attendance: Varies • Number of years: Varies according to degree program• Universal enrollment: Data not available• Entrance criteria: Admission to higher education is accorded
on the basis of the results on the Higher Secondary School Certificate (HSSC). Separate entrance exams, possibly followed by an interview, are required for many programs.
Common degree programs:• Polytechnic: 3-year certificate and diploma programs (often
technical or engineering) that are offered at the level of both secondary and higher vocational education. Admission requirement is having completed grade 10.
• Bachelor’s: 3-year degree programs in arts, commerce, and science; 4-year degree programs in professional fields (e.g., agriculture, dentistry, engineering, pharmacy, technology, and veterinary medicine); 5-year programs in law and architecture; and 5 ½-year programs in medicine.
• Master’s: Degree that requires 2 years to attain and can either be coursework-based without a thesis or research alone.
• Master’s of Philosophy (MPhil): Predoctoral research program that requires a master’s degree for admission. It can either be completely research-based or also include coursework.
• Doctorate: Degree that requires 3 years after the master’s degree (or 2 years after the MPhil degree). Students are expected to write a thesis based on original research.
Sources:
Nordic Recognition Information Centres. (2006). The System of Education in India. Retrieved June 26, 2013 from http://www.nokut.no/Documents/NOKUT/Artikkelbibliotek/Kunnskapsbasen/Rapporter/UA/2006/The%20System%20of%20Education%20in%20India.pdf.
United Nations Educational, Scientific and Cultural Organization, International Bureau of Education. (2011). World Data on Education, 2010/11 (7th edition). Profile on India. Paris: Author. Retrieved June 25, 2013, from http://www.ibe.unesco.org/fileadmin/user_upload/Publications/WDE/2 10/pdf-versions/India.pdf.

114 APPENDIX A: THE EDUCATION SYSTEMS OF THE G-20 COUNTRIES
The Education System in Indonesia
Figure A-9. Levels of education in Indonesia, by age and year of schooling: 2013
Preprimary (Pendidikan Anak Usia Dini)
ISCED97 levels 4–6
ISCED97 level 0
ISCED97 level 1
ISCED97 level 2
ISCED97 level 3
Year of schoolingAge Levels of education
Postsecondary and tertiaryPendidikan Tinggi
GeneralSekola menengah atas
VocationalSekolah menengah
kejuruan
Lower secondary(Pendidikan Dasar)
Primary(Pendidikan Dasar)
Upper secondary (Pendidikan menegah)
GeneralTaman kanak-kanak
IslamicBustanul athfal /raudatul athfal
IslamicMadrasah ibtidaiyah
GeneralSekolah Dasa
GeneralSekolah Menengah Pertama
IslamicMadrasah tsanawiyah
Islamic GeneralMadrasah aliyah
Islamic VocationalMadrasah aliyah
kejuruan
4
89
101112131415
16
17
18
1
2
3
4
5
6
7
8
9
10
11
12
76
5
19
89
1011121314
7
NOTE: Education levels are defined according to the 1997 International Standard Classification of Education (ISCED97). Ages represent the typical age at the beginning of the school year. Numbers in bold print indicate ages of universal enrollment (i.e., an enrollment rate of over 90 percent). Numbers highlighted represent the age at which compulsory enrollment begins through the age at which compulsory enrollment ends. No meaning should be inferred from width of subdivisions. Duration of first university degree program is generally 5 years in Indonesia.SOURCE: EP-NUFFIC. (2015). Education System Indonesia: The Indonesian Education System Described and Compared With the Dutch System (3rd version). Retrieved December 23, 2015, from https://www.epnuffic.nl/en/publications/education-system-indonesia.pdf; Ministry of Education and Culture. (2012). Indonesia. In I. Mullis, M. Martin, C. Minnich, K. Drucker and M. Ragan (Eds.), PIRLS 2011 Encyclopedia: Education Policy and Curriculum in Reading, V.1, pp. 315-323. Chestnut Hill, MA, Lynch School of Education, Boston College: TIMSS & PIRLS International Study Center; Organization for Economic Cooperation and Development. (2013). Education at a Glance: OECD Indicators. Paris: Author; United Nations Educational, Scientific and Cultural Organization. International Bureau of Education. (2011). World Data on Education VII Ed. 2010/11, Indonesia. Retrieved April 3, 2013, from http://www.ibe.unesco.org/fileadmin/user_upload/Publications/WDE/2010/pdf-versions/Indonesia.pdf.
Preprimary:• Common name: Pendidikan anak usia dini (preprimary
education), taman kanak-kanak (general kindergarten), bustanul athfal/raudatul athfal (Islamic kindergarten)
• Ages of attendance: As early as age 4 through age 6• Number of years: 1 to 3 • Start of universal enrollment: Does not begin in preprimary;
see below• Compulsory: No
Primary: • Common name: Pendidikan dasar (primary education), sekolah
dasa (general primary), madrasah ibtidaiyah (Islamic primary)• Ages of attendance: 7 through 12• Number of years: 6• Universal enrollment: Yes, begins at 7• Compulsory: Yes, begins at 7
Lower secondary:
• Common name: Pendidikan dasar (primary education), sekolah menengah pertama (general junior secondary), madrasah tsanawiyah (Islamic junior secondary)
• Ages of attendance: 13 through 15• Number of years: 3• Universal enrollment: Through age 14• Compulsory: Yes, through age 14• Entrance/exit criteria: At the end of grade 6 (primary),
students must pass a national examination and academic and psychological testing in order to enter lower secondary education.
Upper secondary:• Common name: Pendidikan menengah (secondary education)
Sekola menengah atas: 3-year general senior secondary school. The first year is general studies; the second and third years focus on natural sciences, social sciences, languages, or religious studies.

APPENDIX A: THE EDUCATION SYSTEMS OF THE G-20 COUNTRIES 115
Madrasah aliyah: 3-year Islamic senior secondary school, which gives priority to the mastery of religious knowledge.Sekolah menengah kejuruan: 3-year technical and voca-tional secondary education, with 40 different programs in various fields related to job training. Some vocational schools offer 4-year programs leading to a Diploma 1 certificate. (Vocational programs are also offered at religious schools: madrasah aliyah kejuruan.)
• Ages of attendance: 16 through 18 • Number of years: 3 • Universal enrollment: No• Compulsory: No• Entrance/exit criteria: At the end of grade 9 (lower secondary),
students must pass a national examination and academic and psychological testing in order to enter upper secondary education. The annual promotion to the next grade in senior secondary education is based on tests taken every semester to fulfill the minimum competency criterion, which is determined by the school itself. There is a senior secondary school exam taken at the end of grade 12.
Postsecondary and tertiary:• Common name: Pendidikan tinggi• Ages of attendance: Varies • Number of years: Varies according to degree program• Universal enrollment: No• Entrance criteria: Admission to different institutions is
dependent on the student’s secondary completion certificateand the results of an entrance examination specific to diff- erent state universities.
Common degree programs:• Sarjana 1 (Scholar 1): 4-year bachelor’s degree (4 ½ years
plus a 1-year internship in the case of medicine, dentistry, pharmacy, or veterinary science).
• Sarjana 2 or Program Magister (Scholar 2): 2-year master’s degree. Student must have first attained a Scholar 1 degree
• Sarjana 3 or Program Doktor (Scholar 3): 3-year doctoral degree. Student must have first attained a Scholar 2 degree
• Diploma 1–4: 1- to 4-year practically oriented programs.• Program Spesialis I or II (Specialist Program): Practically
oriented program, mainly in medical specializations. Number of years varies.
NOTE: There are religious programs that coincide with the Sarjana 1–3 degrees listed above. They are, respectively, the Program Sarjana Agama Islam, Program Magister Agama Islam, and Program Doktor Agama Islam.
Sources:
EP-NUFFIC. (2015). Education System Indonesia: The Indonesian Education System Described and Compared With the Dutch System (3rd version). Retrieved December 23, 2015, from https://www.epnuffic.nl/en/publications/education-systemindonesia.pdf.
Ministry of Education and Culture. (2012). Indonesia. In I. Mullis, M. Martin, C. Minnich, K. Drucker, and M. Ragan (Eds.), PIRLS 2011 Encyclopedia: Education Policy and Curriculum in Reading (vol. 1), pp. 315–323. Chestnut Hill, MA: Lynch School of Education, Boston College, TIMSS & PIRLS International Study Center.
United Nations Educational, Scientific and Cultural Organization, International Bureau of Education. (2011). World Data on Education, 2010/11 (7th edition). Profile on Indonesia. Paris: Author. Retrieved April 3, 2013, from http://www.ibe.unesco.org/fileadmin/user_upload/Publications/WDE/2 10/pdf-versions/Indonesia.pdf.

116 APPENDIX A: THE EDUCATION SYSTEMS OF THE G-20 COUNTRIES
The Education System in Italy
Figure A-10. Levels of education in Italy, by age and year of schooling: 2013
Preprimary Scuola dell'infanzia
ISCED97 levels 4–6
ISCED97 level 0
ISCED97 level 1
ISCED97 level 2
ISCED97 level 3
Year of schoolingAge Levels of education
Postsecondary and tertiaryAccademia, scuola diretta a fini speciali, università
Fine artsIstituti d'arte
VocationalIstituti professionali
Lower secondaryScuola secondaria di primo grado
PrimaryScuola primaria
Upper secondary Scuola secondaria di secondo grado
TechnicalIstituti tecnici
AcademicLiceo
3
89
1011121314151617
18
1
2
3
4
5
6
7
8
9
10
11
13
765
19
4
12
89
101112131415
76
NOTE: Education levels are defined according to the 1997 International Standard Classification of Education (ISCED97). Ages represent the typical age at the beginning of the school year. Numbers in bold print indicate ages of universal enrollment (i.e., an enrollment rate of over 90 percent). Numbers highlighted represent the age at which compulsory enrollment begins through the age at which compulsory enrollment ends. No meaning should be inferred from width of subdivisions. Duration of first university degree program is generally 5 years in Italy.SOURCE: Miller, D.C. and Warren L.K. (2011). Comparative Indicators of Education in the United States and Other G-8 Countries: 2011 (NCES 2012-007). U.S. Department of Education, National Center for Education Statistics. Washington, DC: U.S. Government Printing Office.
Preprimary:• Common name: Scuola dell’infanzia• Ages of attendance: As early as age 3 through age 5• Number of years: 1 to 3• Start of universal enrollment: Age 3• Compulsory: No
Primary: • Common name: Scuola primaria• Ages of attendance: 6 through 10• Number of years: 5• Universal enrollment: Yes• Compulsory: Yes, begins at 6
Lower secondary:• Common name: Scuola secondaria di primo grado• Ages of attendance: 11 through 13• Number of years: 3• Universal enrollment: Yes• Compulsory: Yes• Entrance/exit criteria: Students must pass a national exit
examination to obtain the diploma di esame di stato conclusivo del primo ciclo di istruzione and enter upper secondary school.
Upper secondary:• Common name: Scuola secondaria di secondo grado
Liceo, including � Liceo classico, scientifico, linguistico, delle scienze
umane—Academic upper secondary schools � Istituti d’arte, liceo artistic, liceo musicale e coreutico—
Fine arts schools and institutesIstituti professionali—Vocational schoolsIstituti tecnici—Technical schoolsIstruzione e formazione professionale (IFP)—3-year vocational education and training program
• Ages of attendance: 14 through 18 (graduation generally at age 19)
• Number of years: 5 (except for the 3-year IFP programs)• Universal enrollment: Through age 16• Compulsory: Through age 15 • Entrance/exit criteria: Students must possess the diploma
di esame di stato conclusivo del primo ciclo di istruzione from lower secondary school to enter upper secondary school. At the end of 5 years of instruction, students must pass a national examination in order to obtain a diploma di superamento dell’esame di stato.

APPENDIX A: THE EDUCATION SYSTEMS OF THE G-20 COUNTRIES 117
NOTE: Every student who has completed 5 years of upper secondary school and has obtained a diploma di superamento dell’esame di stato may attend university and other forms of higher education. Students are tracked in academic as well as technical and vocational schools in Italy. Students in Italy may attend specialized art schools, such as istituti d’arte and liceo artistico at the upper secondary level. Students attending vocational schools may attend 3- or 5-year training or apprenticeship programs in applied fields, after which they often enter the labor force. Liceo linguistico focuses on modern foreign languages and cultures. The liceo classico and scientifico prepare students for university studies. Liceo classico focuses on literature, philosophy, and Latin and Greek languages. Liceo scientifico focuses on mathematics and science. Liceo socio-psico-pedagogico has a sociological, psychological, and pedagogical orientation.
Postsecondary and tertiary:• Common name: Accademia, scuola diretta a fini speciali,
universitàAlta formazione artistica e musicale—Arts and music Scuole superiori per la mediazione linguistica—School for interpretersIstruzione e formazione tecnica superiore—Technical education and trainingLaurea, laurea specialistica, dottorato di ricerca, diploma di specializzione—Academic higher education, university
• Ages of attendance: Varies • Number of years: Varies according to degree program• Universal enrollment: No• Entrance criteria: In order to enter university, students must
possess a diploma di superamento dell’esame di stato, a second-ary school diploma obtained after passing a national exam.
NOTE: The higher education system in Italy underwent a reform process to make it more compatible with the higher education systems of other European countries. University degree programs are now based on two main cycles—the 3-year foundation degree, or laurea, followed by a 2 year specialist degree, or laurea specialistica/magistrale—with third-cycle degree options (dottorato di ricerca and diploma di specializzazione), which are similar to a doctorate in the United States. These changes were made to increase educational exchange between Italy and other European Union countries.
Common degree programs:• Accademia degrees: Fine arts, restoration, and music degrees.
Accademia degrees have been divided into two cycles according to the recent reforms, the first one taking 3 years to complete and the second one taking 2 years to complete. The diploma accademico di primo livello is awarded after the first cycle, and the diploma accademico di secondo livello is awarded after the second cycle.
• Laurea: A first-level university degree taking 3 years from university entry to complete. It is characterized by both theoretical and applied studies, similar to a bachelor’s degree in the United States.
• Laurea specialistica/magistrale: Graduate specialized degree requiring 2 years of university study after a first-level degree, similar to a master’s degree in the United States.
• Master universitario di primo livello: A professional graduate program requiring at least 1 year of study after obtaining a laurea.
• Master universitario di secondo livello: A professional graduate program requiring at least 1 year of study after obtaining a laurea specialistica/magistrale.
• Dottorato di ricerca: Doctoral degree program focusing on research and taken at a university. Typically requires 3 years of instruction after the laurea specialistica/magistrale.
• Diploma di specializzazione: Doctoral degree program for a specialized professional degree, such as medicine or law. Typically requires 2–6 years after the laurea specialistica/magistrale.
Sources:
Eurydice. (2013). Eurydice Highlights: The Structure of the European Education Systems 2012/13. Brussels: Eurydice. Retrieved March 22, 2013, from http://eacea.ec.europa.eu/education/eurydice/documents/facts_and_figures/educ -tion_structures_EN.pdf.
Marlow-Ferguson, R. (Ed.) (2002). World Education Encyclopedia: A Survey of Educational Systems Worldwide, Vol. 1 (2nd ed.). Farmington Hills, MI: Gale Group.
Organization for Economic Cooperation and Development. (1996). Education at a Glance 1996: OECD Indicators. Paris: Author.
ReferNet Italy. (2010). Italy. VET in Europe—Country Report. Thessaloniki: Cedefop. Retrieved April 22, 2013 from http://www.refernet.de/images_content/Italy.pdf.
Robitaille, D.F. (1997). National Contexts for Mathematics and Science Education: An Encyclopedia of the Education Systems Participating in TIMSS. Vancouver, Canada: PacificEducational Press.

118 APPENDIX A: THE EDUCATION SYSTEMS OF THE G-20 COUNTRIES
The Education System in Japan
Figure A-11. Levels of education in Japan, by age and year of schooling: 2013
Preprimary Yochien, Hoikusho, Ninteikodomoen
ISCED97 levels 4–6
ISCED97 level 0
ISCED97 level 1
ISCED97 level 2
ISCED97 level 3
Year of schoolingAge Levels of education
Postsecondary and tertiaryAccademia, scuola diretta a fini speciali, università
Upper secondaryKoutougakkou
PrimaryShogakkou
Lower secondaryChugakkou
Lower secondaryChugakkou
College of technologyKoutousen-mongakkou
Combined upper and lower secondary
Chutoukyoi-kugakkou
3
8
9
10
11
12
13
14
15
16
17
1
2
3
4
5
6
7
8
9
10
11
7
6
5
18
4
12
8
9
10
11
12
13
14
7
6
NOTE: Education levels are defined according to the 1997 International Standard Classification of Education (ISCED97). Ages represent the typical age at the beginning of the school year. Numbers in bold print indicate ages of universal enrollment (i.e., an enrollment rate of over 90 percent). Numbers highlighted represent the age at which compulsory enrollment begins through the age at which compulsory enrollment ends. No meaning should be inferred from width of subdivisions. Duration of first university degree program is generally 4 years in Japan.SOURCE: Miller, D.C. and Warren L.K. (2011). Comparative Indicators of Education in the United States and Other G-8 Countries: 2011 (NCES 2012-007). U.S. Department of Education, National Center for Education Statistics. Washington, DC: U.S. Government Printing Office.
Preprimary:• Common name: Yochien• Ages of attendance: As early as age 3 through age 5• Number of years: 1 to 3• Start of universal enrollment: Age 4• Compulsory: No
NOTE: Around 55 percent of 5-year-old students attend Yochien (kindergarten), while most others attend Hoikusho (nursery schools that infants and younger children can attend). Recently, Ninteikodomoen, a program that combines Yochien and Hoikusho, was introduced in Japan.
Primary: • Common name: Shogakkou• Ages of attendance: 6 through 11• Number of years: 6• Universal enrollment: Yes• Compulsory: Yes, begins at 6
Lower secondary:• Common name: Chugakkou• Ages of attendance: 12 through 14
• Number of years: 3• Universal enrollment: Yes• Compulsory: Yes• Entrance/exit criteria: There are no examinations or other
criteria to enter public schools for the majority of students. Private schools (enrollment in which accounts for 7 percent of all students) usually require a competitive examination for entry.
NOTE: Chutoukyoikugakkou, secondary schools that unify lower and upper secondary schools, were introduced in Japan in 1999.
Upper secondary:• Common name: Koutougakkou• Ages of attendance: 15 through 17 • Number of years: 3• Universal enrollment: Yes, through age 17• Compulsory: No• Entrance/exit criteria: Students in Japan are placed into
upper secondary schools based primarily on test scores and school report cards from lower secondary schools. Scoring well influences students’ chances of attending the most prestigious upper secondary schools in their area.

APPENDIX A: THE EDUCATION SYSTEMS OF THE G-20 COUNTRIES 119
NOTE: Juku refers to “cram school” or night school, which prepares students for upper secondary school entrance exams and/or gives students remedial lessons. Students may also choose to attend a college of technology (Koutousenmongakkou), which combines 3 years of upper secondary education with 2 years of higher education leading to the associate’s degree. See below for details on Koutousenmongakkou.
Postsecondary and tertiary:• Common name: Tankidaigaku, Koutousenmongakkou, Daigaku • Ages of attendance: Varies• Number of years: 2 (Tankidaigaku, junior college); 5 (Koutousen-
mongakkou, college of technology); 4 (Daigaku, university [excluding medical and dental degrees]); 6 (Daigaku, university [medical and dental degrees])
• Universal enrollment: No• Entrance criteria: To enter national universities, most students
take an entrance examination offered by the National Center for University Entrance Examinations and an examination conducted by the university itself. For many universities, entrance examinations are very competitive.
Common degree programs:• Jun-gakushi (at college of technology): 5-year programs
that combine upper secondary education with vocational higher education. The first 3 years are spent at the upper second-ary level and the last 2 years at the postsecondary education level earning a jun-gakushi (associate’s degree). These programs are given at Koutousenmongakkou, in subjects such as public works, mechanical engineering, and information technology.
• Jun-gakushi (at junior college): Programs normally requiring 2 years of study, taken at junior colleges (Tankidaigaku), that prepare students for careers in fields such as home economics, humanities, education, and social science. Junior colleges have traditionally enrolled mostly women.
• Gakushi: An academic degree normally requiring 4 years of study that is similar to a bachelor’s degree. Given at a Daigaku (college or university). Preprofessional programs in medicine, dentistry, and veterinary medicine take 6 years.
• Shushi: Graduate program taken at a Daigaku that normally requires 2 years of study beyond the bachelor’s degree. Equivalent to a master’s degree in the United States.
• Hakushi: Academic graduate program at a Daigaku requiring at least 5 years beyond the bachelor’s degree. This degree is equivalent to a doctorate in the United States.
Sources:
Marlow-Ferguson, R. (Ed.) (2002). World Education Encyclopedia: A Survey of Educational Systems Worldwide, Vol. 1 (2nd ed.). Farmington Hills, MI: Gale Group.
Ministry of Education, Culture, Sports, Science and Technology. (2010). Tokyo: Author. Retrieved March 26, 2013, from http://www.mext.go.jp/list_001/list_016/__icsFiles/afieldfile/ 10/09/08/mext_2010_e.pdf.
Organization for Economic Cooperation and Development. (1996). Education at a Glance: OECD Indicators. Paris: Author.
Robitaille, D.F. (1997). National Contexts for Mathematics and Science Education: An Encyclopedia of the Education Systems Participating in TIMSS. Vancouver, Canada: PacificEducational Press.
United Nations Educational, Scientific and Cultural Organization. (2000). The EFA 2000 Assessment: Country Reports, Japan. World Education Forum. Retrieved April 17, 2013, from http://www.unesco.org/education/wef/countryreports/japan/rapport_1.html.

120 APPENDIX A: THE EDUCATION SYSTEMS OF THE G-20 COUNTRIES
The Education System in Mexico
Figure A-12. Levels of education in Mexico, by age and year of schooling: 2013
Preprimary Educación preescolar
ISCED97 levels 4–6
ISCED97 level 0
ISCED97 level 1
ISCED97 level 2
ISCED97 level 3
Year of schoolingAge Levels of education
Postsecondary and tertiaryEducación superior
Lower secondarySecundaria
PrimaryEscuela primaria
Upper secondary Educación media superior, preparatoria, bachillerato
GeneralBachillerato general
ProfessionalProfesional técnico
VocationalBachillerato tecnológico
3
89
101112131415
161718
123456789
10
11
765
19
4
12
89
1011121314
7654
NOTE: Education levels are defined according to the 1997 International Standard Classification of Education (ISCED97). Ages represent the typical age at the beginning of the school year. Numbers in bold print indicate ages of universal enrollment (i.e., an enrollment rate of over 90 percent). Numbers highlighted represent the age at which compulsory enrollment begins through the age at which compulsory enrollment ends. No meaning should be inferred from width of subdivisions. Duration of first university degree program is generally 4 to 5 years in Mexico.SOURCE: Classbase (2012). Education Database: Education System in Mexico. Retrieved April 2, 2013, from http://www.classbase.com/Countries/Mexico/Education-System; Rolwing, K. (2006). Education in Mexico. New York: World Education Services. Retrieved April 4, 2013, from http://www.wes.org/ewenr/PF/06jun/pfpractical.htm; Santibanez, L., Vernez G., Razquin, P. (2005). Education in Mexico: Challenges and Opportunities. Santa Monica: RAND. Retrieved April 4, 2013, from http://www.worldfund.org/assets/files/RAND_Education%20in%20Mexico.pdf.
Preprimary:• Common name: Educación preescolar, educación básica• Ages of attendance: 3 through 5• Number of years: 3• Start of universal enrollment: Age 4• Compulsory: Yes, begins at age 4
Primary: • Common name: Escuela primaria, educación básica• Ages of attendance: 6 through 11• Number of years: 6• Universal enrollment: Yes• Compulsory: Yes
Lower secondary:• Common name: Secundaria, educación básica• Ages of attendance: 12 through 14• Number of years: 3• Universal enrollment: Yes• Compulsory: Yes
• Entrance/exit criteria: Lower secondary school is made up of three grades. An official certificate of completion is needed to enter upper secondary school.
Upper secondary:• Common name: Educación media superior, preparatoria,
bachillerato, colegioBachillerato general: Generally a 3-year high school pro-gram, although there are also 2- and 4-year programs. Bachillerato tecnológico: Generally a 3-year vocational training program in technical, technological, commercial, agricultural, and other fields, although in exceptional cases, some programs are 2, 4, or even 5 years. Profesional técnico: 3-year professional high school.
• Ages of attendance: 15 through 17 • Number of years: 3• Universal enrollment: No• Compulsory: No• Entrance/exit criteria: The corresponding certifi ate at the
end of high school is required to enter tertiary education.

APPENDIX A: THE EDUCATION SYSTEMS OF THE G-20 COUNTRIES 121
NOTE: Professional technical education is intended to train students for technical employment and therefore is a terminal degree. In bachillerato technológico, students have the option to take general subjects in addition to their vocational training.
Postsecondary and tertiary:• Common name: Educación superior• Ages of attendance: Varies • Number of years: Varies according to degree program• Universal enrollment: No• Entrance criteria: Completion of an academic or technical
upper secondary program is ordinarily required for admission to tertiary-level institutions. Certain departments require applicants to have completed an upper secondary program in a track relevant to their prospective major field of study. Selection processes at institutions differ greatly, though institutional entrance examinations and high school grade point averages have traditionally been used to select incoming students.
Common degree programs:• Técnico Superior (Higher Technician): 2 or 3-year degree
that trains technically skilled professionals to work in a specific discipline
• Licenciatura: 4- to 5-year bachelor’s degree from techno- logical institutes, universities, and teacher’s colleges.
• Posgrado (Especialidad, Maestria, Doctorado): Requires a bachelor’s degree and is subclassified into specialization studies, master’s degree studies, and doctoral degree studies. Generally, specialization studies require 1 year to complete, although in some cases they can be completed in 6 months. Master’s degree studies require at least 1 year, and the length of doctoral degree studies depends on the institution that hosts the program.
Sources:
Classbase. (2012). Education Database: Education System in Mexico. Retrieved April 2, 2013, from http://www.classbase.com/Countries/Mexico/Education-System.
Rolwing, K. (2006). Education in Mexico. New York: World Education Services. Retrieved April 4, 2013, from http:// www.wes.org/ewenr/PF/06jun/pfpractical.htm.
Santibanez, L., Vernez, G., and Razquin, P. (2005). Education in Mexico: Challenges and Opportunities. Santa Monica: RAND. Retrieved April 6, 2015, from http://www.rand.org/pubs/documented_briefings/DB480.htm .
Secretariat of Public Education. (2012). Educational System of the United States of Mexico, Main Figures, Schooling Year 2011–2012. Retrieved July 8, 2013, from http://www.sep.gob.mx/wb/sep1/sep1_Estadisticas.
Secretariat of Public Education. (2014). Principales Cifras del Sistema Educativo Nacional 2013–2014. Retrieved March 30, 2015 from http://fs.planeacion.sep.gob.mx/estadistica_e_indicadores/principales_cifras/ principales_cifras_2013_2014.pdf.

122 APPENDIX A: THE EDUCATION SYSTEMS OF THE G-20 COUNTRIES
The Education System in the Republic of Korea
Figure A-13. Levels of education in the Republic of Korea, by age and year of schooling: 2013
Preprimary Yuchiwon
ISCED97 levels 4–6
ISCED97 level 0
ISCED97 level 1
ISCED97 level 2
ISCED97 level 3
Year of schoolingAge Levels of education
Postsecondary and tertiaryDaehakgyo
GeneralIlban kodeung-hakgyo
Special-purposedTeuksu mokjuk
kodeung-hakgyo
Lower secondaryJung-hakgyo
PrimaryChodeung-hakgyo
Upper secondary
SpecializedTeuksungwha
kodeung-hakgyo
AutonomousJayul kodeung-hakgyo
3
89
10111213141516
17
123456789
1011
765
19
4
1218
89
1011121314
76
NOTE: Education levels are defined according to the 1997 International Standard Classification of Education (ISCED97). Ages represent the typical age at the beginning of the school year. Numbers in bold print indicate ages of universal enrollment (i.e., an enrollment rate of over 90 percent). Numbers highlighted represent the age at which compulsory enrollment begins through the age at which compulsory enrollment ends. No meaning should be inferred from width of subdivisions. Duration of first university degree program is generally 4 years in the Republic of Korea.SOURCE: Ministry of Education for Korea (2008), Education System, Retrieved April 15, 2013, from http://english.moe.go.kr/web/1693/site/contents/en/en_0203.jsp; Organization for Economic Cooperation and Development (OECD) (2004). OECD Handbook for Internationally Comparative Education Statistics: Concepts, Standards, Definitions and Classifications: Indicator Concepts and Methodologies. Paris: Author. Retrieved April 15, 2013, from http://www.keepeek.com/Digital-Asset-Management/oecd/education/oecd-handbook-for-internationally-comparative-education-statistics_9789264104112-en; Organization for Economic Cooperation and Development. (2013a). Education at a Glance 2013: OECD Indicators. Paris: Author; United Nations Educational, Scientific and Cultural Organization. (2010). World Data on Education: Republic of Korea. Paris: Author. Retrieved April 15, 2013, from http://www.ibe.unesco.org/fileadmin/user_upload/Publications/WDE/2010/pdf-versions/Republic_of_Korea.pdf.
Preprimary:• Common name: Yuchiwon (kindergarten)• Ages of attendance: 3 through 5• Number of years: 1 to 3• Start of universal enrollment: Does not begin in preprimary;
see below• Compulsory: No
NOTE: The government subsidizes financing for kindergarten and aims to expand free kindergarten education to 5-year-olds nationwide. Day care centers or play centers are facilities that offer educational services to ensure the health, safety, and well-rounded development of children up to age 5.
Primary: • Common name: Chodeung-hakgyo (elementary school)• Ages of attendance: 6 through 11• Number of years: 6• Universal enrollment: Yes, begins at 6
• Compulsory: Yes, begins at 6
NOTE: Elementary education is free for students. Once children enter elementary school, they automatically advance to the next grade each year.
Lower secondary:• Common name: Jung-hakgyo (middle school)• Ages of attendance: 12 through 14• Number of years: 3 • Universal enrollment: Yes• Compulsory: Yes6
• Entrance/exit criteria: Upon successful completion of the 3-year-program, students receive the junior high school diploma.
NOTE: There is a small fee for middle school education, which is waived for some students in rural areas and students specifiedunder the Special Education Promotion Act. The government also provides complimentary school meals for all students.
6 In Korea, lower secondary school is compulsory and thus the end of compulsory education is given as age 15 (i.e., through age 14), per the review of the country expert. This will differ from the 2011 data presented in Indicator 2, which indicates the end of compulsory education is age 14 (i.e., through age 13).

APPENDIX A: THE EDUCATION SYSTEMS OF THE G-20 COUNTRIES 123
Upper secondary:• Common name: Kodeung-hakgyo (high school)
Ilban kodeung-hakgyo (general high school)Teuksu Mokjuck kodeung-hakgyo (special-purpose high school)Teuksunghwa kodeung-hakgyo (specialized high school)Jayoul kodeung-hakgyo (autonomous high school)
• Ages of attendance: 15 through 17• Number of years: 3• Universal enrollment: Through age 17• Compulsory: No• Entrance/exit criteria: There are general academic as well as
specialized high schools. Applicants for general high schools are not given the opportunity to choose their school but are assigned to a school in their residential district. Applicants for special-purpose/specialized high schools are given the opportunity to choose their school and to be selected based on the results of school-administered examinations or on their achievement in middle school.
NOTE: General high schools provide regular high school edu- cation. Special-purpose high schools are divided into science, foreign language, international, arts, physics, and meister (industrial training) high schools. Specialized high schools are divided into vocational high schools and alternative schools. Autonomous high schools are divided into autonomous private high schools and autonomous public high schools.
Postsecondary and tertiary:• Common name: Daehak(gyo) (college, university)
Sanup daehak (industrial university)Gyoyuk daehak (university of education)Jeonmun daehak (junior college)Bangsong daehak, Tongshin daehak, Bangsong-Tongshin daehak, and Cyber daehak (broadcasting university, correspondence university, broadcasting and correspondence university, and cyber university)Kisul daehak (technical college)Kakjong-hakgyo (other miscellaneous schools)
• Ages of attendance: Varies • Number of years: Varies according to degree program• Universal enrollment: No• Entrance criteria: Students completing high school are awarded
the high school certificate. Admission to junior colleges is determined on the basis of academic achievement and the College Scholastic Aptitude Test. Under the Admissions OfficerSystem, universities may utilize student high school records, the Scholastic Aptitude Test scores, essay writing, certificates,and recommendation letters in their selection process.
Common degree programs:• Jeonmun haksa: 2- to 3-year associate’s degree offered by
junior colleges. • Haksa: 4-year bachelor’s degree awarded by colleges and
universities, including teacher’s colleges. Bachelor’s degrees require 6 years of coursework in the case of medicine, dentistry, and veterinary medicine.
• Seoksa: 2-year master’s degree awarded by graduate schools after the bachelor’s degree.
• Baksa: 3-year doctoral degree awarded by graduate schools. Combined master’s and doctoral degree programs are also offered and normally last 4 years.
Sources:
Higher Education Act. (2013.3.23). Retrieved April 6, 2015, from http://www.moleg.go.kr/english/korLawEng;jsessionid= N8rtIMXT6nkiiKgZ3DnKMKIeeWiaiixw7RUXnMmfzHs 3mnZTef15GdovVtliQ1AI.moleg_a2_servlet_engine2?pstSeq=52250&pageIndex=57.
Organization for Economic Cooperation and Development. (2004). OECD Handbook for Internationally Comparative Education Statistics: Concepts, Standards, Definitions and Classifications. Paris: Author. Retrieved April 6, 2015, from http://ukdataservice.ac.uk/media/218177/Educhandbook.pdf.
Elementary and Secondary Education Act. (2013.3.23). Retrieved April 6, 2015, from http://elaw.klri.re.kr/eng_mobile/viewer.do?hseq=24786&type=sogan&key=2.
Republic of Korea, Ministry of Education. (2008). Education System. Retrieved April 15, 2013, from http://english.moe.go.kr/web/1693/site/contents/en/en_0203.jsp.
United Nations Educational, Scientific and Cultural Organization, International Bureau of Education. (2011). World Data on Education, 2010/11 (7th edition). Profile on the Republic of Korea. Paris: Author. Retrieved April 15, 2013, from http://www.ibe.unesco.org/fileadmin/user_upload/PublicationsWDE/2010/pdf-versions/Republic_of_Korea.pdf.

124 APPENDIX A: THE EDUCATION SYSTEMS OF THE G-20 COUNTRIES
The Education System in the Russian Federation
Figure A-14. Levels of education in the Russian Federation, by age and year of schooling: 2013
Preprimary Doshkolnoe obrazovanie
ISCED97 levels 4–6
ISCED97 level 0
ISCED97 level 1
ISCED97 level 2
ISCED97 level 3
Year of schoolingAge Levels of education
Postsecondary and tertiaryKolledž, technikum, universitet
Lower secondaryOsnovnoe obshchee obrazovanie
PrimaryNachal'noje obshchee obrazovanie
Upper secondary
ProfessionalProfessional’no-techniches
koe uchilische
AcademicSrednee (polnoe) obshchee
obrazovanie
Combined professional/academicKolledž, professional’ny
litsei, technikum
3
89
1011121314151617
123456789
1011
765
18
4
89
1011121314151617
7
NOTE: Education levels are defined according to the 1997 International Standard Classification of Education (ISCED97). Ages represent the typical age at the beginning of the school year (rounded up as necessary). Numbers in bold print indicate ages of universal enrollment (i.e., an enrollment rate of over 90 percent). Numbers highlighted represent the age at which compulsory enrollment begins through the age at which compulsory enrollment ends. No meaning should be inferred from width of subdivisions. Duration of first university degree program is generally 4 years in the Russian Federation.SOURCE: Miller, D.C. and Warren L.K. (2011). Comparative Indicators of Education in the United States and Other G-8 Countries: 2011 (NCES 2012-007). U.S. Department of Education, National Center for Education Statistics. Washington, DC: U.S. Government Printing Office.
Preprimary:• Common name: Doshkolnoe obrazovanie• Ages of attendance: As early as age 3 to age 6 ½• Number of years: 1 to 4• Start of universal enrollment: Does not begin in preprimary;
see below• Compulsory: No
Primary: • Common name: Nachal’noje obshchee obrazovanie• Ages of attendance: 6 to 10• Number of years: 4• Start of universal enrollment: Age 6 ½7
• Compulsory: Yes, begins at age 6 ½8
NOTE: There are no formal divisions between primary, lower secondary, and upper secondary schools in the Russian Federation, and they are generally located in the same buildings, except in rural areas.
Lower secondary:• Common name: Osnovnoe obshchee obrazovanie (basic school)• Ages of attendance: 11 to 15 (most students turn 15 during the
last year of lower secondary school)• Number of years: 5• Universal enrollment: Yes • Compulsory: Yes• Entrance/exit criteria: In order to graduate from basic school,
students must pass four written examinations: one in Russian language, one in mathematics, and two in other subjects chosen by the student.
NOTE: Basic general education includes primary and lower secondary school. Graduates of lower secondary school may either continue their education at upper secondary school to receive a secondary complete general education, go to vocational schools to receive professional training, or go to secondary vocational schools to receive a combination of academic and vocational education.
7 This is rounded up to 7 in the accompanying figure A-14, which is in concert with the data presented in Indicator 2.8 This is rounded up to 7 in the accompanying figure A-14, which is in concert with the data presented in Indicator 2.

APPENDIX A: THE EDUCATION SYSTEMS OF THE G-20 COUNTRIES 125
Upper secondary:• Common name: Professional’no-technicheskoe uchilische;
kolledž, professional’ny litsei, or technikum; srednee (polnoe) obshchee obrasovanie
• Ages of attendance: 16 to 17 for secondary general school, and 16 to 19 for vocational schools
• Number of years: Varies according to the type of school: 2 (for secondary general school), 2 to 4 (for vocational schools)
• Universal enrollment: No• Compulsory: Yes, through age 179
• Entrance/exit criteria: Students in the Russian Federation must pass two written exams at the end of secondary school in order to obtain the Certificate of Secondary Complete General Education. These exams include Russian language and mathematics and are administered in the form of the Unified State Examination
NOTE: Students who have graduated from lower secondary school have the option to continue in three types of upper secondary schools: • Professional’no-technicheskoe uchilische: These schools
provide professional education in a program that usually lasts 2 years.
• Srednee (polnoe) obshchee obrasovanie: Students who wish to continue their academic education enter these upper secondary schools. The program lasts for 2 years, and students receive a Certificate of Secondary Complete General Education, which qualifies them to apply for entrance into higher education. Graduates may also continue their study in initial and secondary vocational schools.
• Kolledž, professional’ny litsei, or technikum: These schools provide combined professional and academic programs that lead to a diploma (Certificate of Secondary Complete General Education). The programs are usually 3 or 4 years.
Postsecondary and tertiary:• Common name: Kolledž, technikum, universitet • Ages of attendance: Varies• Number of years: Varies according to degree• Universal enrollment: No• Entrance criteria: Candidates are accepted into postsecondary
vocational institutions on the basis of the results of the Unified State Examinations or additional examinations called vstupitelnoe ispytanie. The number of exams and the subjects vary according to the department a student wishes to attend, although all students must take an exam in Russian language.
Common degree programs:• Nonuniversity-level diploma: Obtained from kolledž (colleges)
and technikum (technical colleges). These diplomas are in applied or vocational fields and require 2 years of study after secondary school. Students may be able to enter university-level institutions after completing this degree and transfer some or all credits toward a bakalavr.
• Diploma o nepolnom vysshem obrazovanii (diploma of incomplete higher education): If students leave university after at least 2 years of study, they may ask for this diploma, which allows them to work in jobs that require some university experience, but not a degree.
• Bakalavr (bachelor’s degree): Program requiring 4 years of university study.
• Magistr (master’s degree): Competitive 2-year programs for students who have completed their bakalavr degree. Most require a year of research and a thesis.
• Diplom: This specialized diploma can be obtained either by completing 1 year of study beyond the bakalavr or by completing 5 to 6 years of continuous study after upper secondary school.
• Kandidat nauk: Students who hold a diplom or magistr are eligible to apply for these programs, which typically last for 3 years and require students to carry out independent research and defend a dissertation in public. Equivalent of a doctorate in the United States.
• Doktor nauk: This is the highest possible academic degree in the Russian Federation, and there is no U.S. equivalent. This degree requires that a kandidat nauk become known in his or her field of study, publish independent research, and have experience supervising undergraduates. A 3-year sabbatical is often taken to prepare research for the degree, although there is no specified length of time required to obtain it. The doktor nauk requires a public dissertation defense (in addition to the defense completed to obtain a kandidat nauk).
Sources:
EuroEducation Net. (2006). Education Systems in Europe: Russia. London: EuroEducation. Retrieved March 26, 2013, from http://www.euroeducation.net/prof/russco.htm.
Marlow-Ferguson, R. (Ed.). (2002). World Education Encyclopedia: A Survey of Educational Systems Worldwide, Vol. 2 (2nd ed.). Farmington Hills, MI: Gale Group.
Mullis, I.V.S., Martin, M.O., Minnich, C.A., Stanco, G.M., Arora, A., Centurino, V.A.S., and Castle, C.E. (Eds.). (2012). TIMSS 2011 Encyclopedia. Education Policy and Curriculum in Mathematics and Science (Vols. 1–2). Chestnut Hill, MA: Boston College.
Organization for Economic Cooperation and Development. (1996). Education at a Glance 1996: OECD Indicators. Paris: Author.
Robitaille, D.F. (1997). National Contexts for Mathematics and Science Education: An Encyclopedia of the Education Systems Participating in TIMSS. Vancouver, Canada: PacificEducational Press.
9 In the Russian Federation, general secondary education (including lower and upper secondary) is compulsory through age 17, per the review of the country expert. This will differ from the 2011 data presented in Indicator 2, which indicates the end of compulsory education is age 17 (i.e., through age 16).

126 APPENDIX A: THE EDUCATION SYSTEMS OF THE G-20 COUNTRIES
The Education System in Saudi Arabia
Figure A-15. Levels of education in Saudi Arabia, by age and year of schooling: 2013
PreprimaryKindergarten
PrimaryPrimary school, general elementary
ISCED97 levels 4–6
ISCED97 level 0
ISCED97 level 1
ISCED97 level 2
ISCED97 level 3
Year of schoolingAge Levels of education
Lower secondaryIntermediate school
Postsecondary and tertiaryHigher education, university, girls’ colleges
Upper secondaryUpper secondary school
3
7
8
9
10
11
12
13
14
15
16
17
1
2
3
4
5
6
7
8
9
10
11
12
6
5
4
19
18
7
8
9
10
11
6
NOTE: Education levels are defined according to the 1997 International Standard Classification of Education (ISCED97). Ages represent the typical age at the beginning of the school year. Numbers in bold print indicate ages of universal enrollment (i.e., an enrollment rate of over 90 percent). Numbers highlighted represent the age at which compulsory enrollment begins through the age at which compulsory enrollment ends. No meaning should be inferred from width of subdivisions. Duration of first university degree program is generally 4 to 6 years in Saudi Arabia.SOURCE: Organization for Economic Cooperation and Development. (2012). Education at a Glance: OECD Indicators. Paris: Author; United Nations Education, Scientific and Cultural Organization. International Bureau of Education. (2011). World Data on Education VII Ed. 2010/11, Saudi Arabia. Retrieved April 3, 2013, from http://www.ibe.unesco.org/fileadmin/user_upload/Publications/WDE/2010/pdf-versions/Saudi_Arabia.pdf; World Education Services. (2004). World Education Profiles, Saudi Arabia. Retrieved April 3, 2013, from http://www.wes.org/ca/wedb/saudiarabia/saedov.htm.
Preprimary:• Common name: Kindergarten• Ages of attendance: As early as age 3 through 5• Number of years: 1 to 3• Start of universal enrollment: Data not available• Compulsory: No
Primary:• Common name: Primary school, general elementary• Ages of attendance: 6 through 11• Number of years: 6• Universal enrollment: Data not available• Compulsory: Yes, begins at age 610
NOTE: Admission exceptions can be made for children who are no more than 3 months under the age of 6, especially for those who have participated in preprimary education. Schools are not coeducational. Students must pass examinations at the end of each semester in order to move on to the next grade.
Lower secondary: • Common name: Intermediate school• Ages of attendance: 12 through 14• Number of years: 3• Universal enrollment: Data not available• Compulsory: No• Entrance/exit criteria: At the end of primary school, students
must pass an examination to receive the Elementary Education Certificate, which is required for admission to intermediate school.
NOTE: Students who cannot attend intermediate school during the day can enroll in evening classes. It is also possible to apply for the final examinations for this level without having attended school regularly.
10 Sources retrieved in 2013 indicate that the entirety of primary education is compulsory in Saudi Arabia, thus ending at age 12 (i.e., through age 11). This differs from the 2011 data presented in Indicator 2, which indicates the end of compulsory education is age 11 (i.e., through age 10).

APPENDIX A: THE EDUCATION SYSTEMS OF THE G-20 COUNTRIES 127
Upper secondary:• Common name: Upper secondary school, secondary education
(with different options available for females and males, and options for females more limited)
Female: Sciences and artsMale: Religious sciences and Arabic; administrative and social sciences; natural sciences; applied (technological) sciences
• Ages: 15 through 17 (graduation generally at age 18)• Number of years: 3• Universal enrollment: Data not available• Compulsory: No• Entrance/exit criteria: An Intermediate Education Certificate is
required for admission. At the end of upper secondary school, successful students receive the General Secondary Education Certificate. Students (males only) who have completed their education in religious programs receive the Religious Institute Secondary Education Certificate. Technical and vocational education is provided at technical secondary institutes. Training programs in the fields of industry, commerce, and agriculture normally last 3 years.
Postsecondary and tertiary:• Common name: Higher education, university, girls’ colleges• Ages of attendance: Varies• Number of years: Varies according to degree or program• Universal enrollment: No• Entrance criteria: Yes; admission to different institutions
is dependent on General Secondary Education Certificate examination scores. An average score of 60 percent is required for admission to science programs and 50 percent is needed to enter arts and humanities programs. Additional entrance exams may be required for certain programs.
NOTE: Two types of higher education programs are offered: western style and Islamic education. There are also multiple programs that do not fall under the responsibility of the Ministry of Higher Education (e.g., programs offered at higher technical institutes, technical colleges, and institutes for public administration).
Common programs: • Postsecondary diploma: 2-year program offered by colleges
of technology.• Bachelor’s of science: 3-year program offered by colleges of
technology.• Teaching degree: 4-year university-based program, except for
kindergarten teachers (who are trained in 3 year secondary training programs) and girls’ school elementary teachers (who complete 4-year postsecondary programs at intermediate education colleges).
• Bachelor’s degree: 4-year programs for humanities and social sciences; 5- to 6-year programs for medicine, engineering, and pharmacy.
• Higher diploma in education: 1-year program after the bachelor’s degree (required in order to teach at the intermediate or secondary level).
• Master’s degree: 2-year programs offered at universities and girls’ colleges that involve coursework and a minor thesis for completion.
• Doctoral degree: 3- to 5-year program after the master’s degree. Few doctoral degree programs are offered at Saudi Arabian universities; most students who pursue doctoral studies prefer to do so overseas.
NOTE: Males and females are offered higher education oppor-tunities with the same standards, but programs are segregated by gender.
Sources:
United Nations Educational, Scientific and Cultural Organization, International Bureau of Education. (2011). World Data on Education, 2010/11 (7th edition). Profile on Saudi Arabia. Retrieved April 3, 2013, from http://www.ibe.unesco.org/fileadmin/user_upload/Publications/WDE/2 10/pdf-versions/Saudi_Arabia.pdf.
World Education Services. (2004). Saudi Arabia: Education Overview. Retrieved April 3, 2013, from http://www.wes.org/ca/wedb/saudiarabia/saedov.htm.

128 APPENDIX A: THE EDUCATION SYSTEMS OF THE G-20 COUNTRIES
The Education System in South Africa
Figure A-16. Levels of education in South Africa, by age and year of schooling: 2013
PreprimaryPre-school, early childhood development (ECD)
Senior PrimaryIntermediate
ISCED97 levels 4–6
ISCED97 level 0
ISCED97 level 1
ISCED97 level 2
ISCED97 level 3
Year of schoolingAge Levels of education
Lower secondarySecondary
Postsecondary and tertiaryCollege, 'technikon,' university of technology, university, comprehensive university, traditional university
Upper secondaryFurther education and training (FET)
3
7
8
9
10
11
12
13
14
15
16
17
1
2
3
4
5
6
7
8
9
10
11
12
6
5
4
18
Junior primary Foundation
Senior primaryIntermediate
7
8
9
10
11
12
13
14
NOTE: Education levels are defined according to the 1997 International Standard Classification of Education (ISCED97). Ages represent the typical age at the beginning of the school year. Universal enrollment data are not available for South Africa. Numbers highlighted represent the age at which compulsory enrollment begins through the age at which compulsory enrollment ends. No meaning should be inferred from width of subdivisions.SOURCE: AngloInfo. South Africa: The School System. Retrieved June 26, 2013, from http://southafrica.angloinfo.com/family/schooling-education/school-system/; Organization for Economic Cooperation and Development. (2013a). Education at a Glance 2013: OECD Indicators. Paris: Author; United Nations Education, Scientific and Cultural Organization, International Bureau of Education. (2010). World Data on Education, 2010/11 (7th edition). Profile on South Africa. Paris: Author. Retrieved June 24, 2013, from http://www.ibe.unesco.org/fileadmin/user_upload/Publications/WDE/2010/pdf-versions/South_Africa.pdf; World Education News and Reviews. (2004). Institutions of Higher Education in South Africa after the Mergers. Retrieved June 24, 2013, from http://www.wes.org/ewenr/04may/Feature.htm.
Preprimary:• Common name: Preschool, Early childhood development (ECD)• Ages of attendance: As early as age 3 through age 5 • Number of years: 1 to 2• Start of universal enrollment: Data not available • Compulsory: No
NOTE: Most preschool education programs are managed by the private sector. The Department of (Basic) Education in South Africa focuses most of its work on developing policies and programs beginning in the reception year (grade R) through the senior phase of secondary school.
Primary: • Common name: Foundation (Junior primary), Intermediate
(Senior primary)• Ages of attendance: 6 through 12• Number of years: 7• Start of universal enrollment: Age 7• Universal enrollment: Data not available• Compulsory: Yes, begins at age 7
NOTE: General education and training (GET) is compulsory for all students from a reception year (grade R) and other foundation grades (1–3) through an intermediate phase (grades 4–6) and senior phase (grades 7–9). Grade R is designed for 5-year-olds. The Government of South Africa plans to enroll all 5-year-olds in grade R by 2014. As a general rule, children are required to start primary education in the year when they turn 7.
Lower secondary:• Common name: Senior phase, Lower secondary education• Ages of attendance: 13 through 15• Number of years: 3• Universal enrollment: Data not available• Compulsory: Yes, through age 14• Entrance/exit criteria: No
Upper secondary:• Common name: Further Education and Training (FET), Senior
secondary school• Ages of attendance: 16 through 18• Number of years: 3

APPENDIX A: THE EDUCATION SYSTEMS OF THE G-20 COUNTRIES 129
• Universal enrollment: Data not available.• Compulsory: No• Entrance/exit criteria: Certificates are awarded on completion
of grades 10 and 11. At the end of grade 12, students take a public examination leading to the National Senior Certificate(equivalent to a high school diploma). To earn the National Senior Certificate, students must take at least six subjects, but they have the option to include three others, which are not compulsory.
NOTE: Technical secondary education is offered by technical centers, high schools, and vocational schools. Vocational training programs generally last 3 years, leading to the National Certifi cate (Vocational) NCV3, which is considered equivalent to the National Senior Certificate if students have also passed English and Afrikaans. The NCV1 and NCV2 are also awarded on completion of 1 or 2 years of vocational training.
Postsecondary and tertiary:• Common name: College, technikon/university of technology,
comprehensive university, traditional university• Ages of attendance: Varies• Number of years: Varies according to degree• Universal enrollment: Data not available• Entrance criteria: The minimum entrance qualification for
a technikon/university of technology program is a National Senior Certificate (taken after year 12 of Further Education and Training). Depending on the degree program, there may be additional entrance requirements.
NOTE: Technikons and universities of technology offer post-secondary programs in applied disciplines such as business, design, engineering, health sciences, the performing arts, and technology. Comprehensive universities offer programs and degrees in the traditional arts and sciences fields as well as those offered by technikons. Traditional universities were the first universities in South Africa and offer a wide range of degree programs at both the undergraduate and graduate levels.
Common degree programs:• Certificate: 1-year programs offered at universities of
technology and technikons in the technical and professional field
• National higher certificate: 2-year programs offered at universities of technology and technikons in the technical and professional field
• National diploma: 3-year programs offered at universities of technology and technikons in the technical and professional field
• National higher diploma: 4-year programs offered at universities of technology and technikons in the technical and professional field
• Bachelor’s degree: 3-or 4-year academic programs at universities of technology and technikons, which usually require 1 year of placement in industry. Require 5 years in the case of architecture and law, 5½ years in the case of veteri- nary medicine, 6 years in the case of medicine and surgery.
• Postgraduate diploma: Requires 1 year of study in addition to a bachelor’s degree.
• Honors degree: Requires 1 year of study in addition to a bachelor’s degree. Admission usually requires an above average level of academic achievement in the bachelor’s degree program.
• Master’s degree: Graduate programs at a university requiring 1 year beyond the bachelor’s degree as well as a thesis.
• Doctorate: Academic graduate programs at a university requiring at least 2 years on a full-time basis after the master’s degree. Doctoral programs prepare students for careers in research.
Sources:
AngloInfo. South Africa: The School System. Retrieved June 26, 2013, from http://southafrica.angloinfo.com/family/schooling-education/school-system/.
Organization for Economic Cooperation and Development. (2013a). Education at a Glance 2013: OECD Indicators. Paris: Author.
United Nations Educational, Scientific and Cultural Organization, International Bureau of Education. (2010). World Data on Education, 2010/11 (7th edition). Profile on South Africa. Paris: Author. Retrieved June 24, 2013, from http://www. ibe.unesco.org/fileadmin/user_upload/Publications/WDE/2010/pdf-versions/South_Africa.pdf.
World Education News and Reviews. (2004). Institutions of Higher Education in South Africa After the Mergers. Retrieved April 3, 2015, from http://wenr.wes.org/2004/05/wenr-mayjune-2004-institutions-of-higher-education-in-south-africa-after-the-mergers/.

130 APPENDIX A: THE EDUCATION SYSTEMS OF THE G-20 COUNTRIES
The Education System in Turkey
Figure A-17. Levels of education in Turkey, by age and year of schooling: 2013
PreprimaryAna okullari/Uygulamali ana okullari/Ana Siniflari
ISCED97 levels 4–6
ISCED97 level 0
ISCED97 level 1
ISCED97 level 2
ISCED97 level 3
Year of schoolingAge Levels of education
Lower secondaryOrtaokul
Postsecondary and tertiaryUniversiteler, meslek yuksek okullari
Upper secondary
GeneralGenel lise
SelectiveAnadolu, fen,
oğretmen, etc.
TechnicalTeknik liseler
Social sciencesSosyal bilimler,
lisesi VocationalMeslek liseleri
3
789
1011121314
15
16
17
1
2
3
4
5
6
7
8
9
10
11
12
65
4
19
Primary Ilkokul
18 13
789
1011121314
15
16
17
6
NOTE: Education levels are defined according to the 1997 International Standard Classification of Education (ISCED97). Ages represent the typical age at the beginning of the school year (rounded up when necessary). Numbers in bold print indicate ages of universal enrollment (i.e., an enrollment rate of over 90 percent). Numbers highlighted represent the age at which compulsory enrollment begins through the age at which compulsory enrollment ends. No meaning should be inferred from width of subdivisions. Duration of first university degree program is generally 4 years in Turkey. A striped box indicates that at the corresponding age or grade level, a student may be in a school classified in either of the boundary ISCED levels.SOURCE: Classbase. (2012). Education Database: Education System in Turkey. Retrieved April 2, 2013, from http://www.classbase.com/countries/turkey/education-system; Eurydice. (2013). Eurydice Highlights: The Structure of the European Education Systems 2012/13. Brussels: Eurydice. Retrieved April 1, 2013, from http://eacea.ec.europa.eu/education/eurydice/documents/facts_and_figures/education_structures_EN.pdf; Organization for Economic Cooperation and Development. (2013a). Education at a Glance 2013: OECD Indicators. Paris: Author; Organization for Economic Cooperation and Development. (2007). Reviews of National Policies for Education: Basic Education in Turkey. Paris: Author. Retrieved April 2, 2013, from http://abdigm.meb.gov.tr/eski_site/uaorgutler/OECD/oecd_6.%20Basic%20Education%20in%20TURKEY.pdf.
Preprimary:• Common name: Ana okullari, uygulamali ana okullari, ana
siniflari • Ages of attendance: As early as age 3 through age 5• Number of years: 1 to 3• Start of universal enrollment: Does not begin in preprimary;
see below • Compulsory: No
Primary: • Common name: Ilkokul• Ages of attendance: 6 through 10• Number of years: 4• Universal enrollment: Yes, begins at age 5½11
• Compulsory: Yes, begins at age 5½12
Lower secondary:• Common name: Ortaokul• Ages of attendance: 11 through 14
• Number of years: 4• Universal enrollment: Through age 13• Compulsory: Yes• Entrance/exit criteria: Students who complete primary school
can enroll in the general lower secondary schools or the imam and preacher lower secondary schools. Compulsory education was extended to a total of 12 years in 2012; thus, students who complete only a lower secondary education do not attain the Basic Education diploma (Ilköğretim Diplomasi).
Upper secondary:• Common name:
Genel lise: 4-year general high school Anadolu lisesi, fen lisesi, Anadolu oğretmen lisesi, Anadolu güzel sanatlar lisesi, güzel sanatlar ve spor lisesi: 4-year selective high schools for students who want to specialize in a specific area (Anatolian high schools, science high schools, Anatolian teacher training high schools, Anatolian fine arts high schools, and sports high schools, respectively)
11 This is rounded up to 6 in the accompanying figure A-14, which is in concert with the data presented in indicator 2.12 This is rounded up to 6 in the accompanying figure A-14, which is in concert with the data presented in indicator 2.

APPENDIX A: THE EDUCATION SYSTEMS OF THE G-20 COUNTRIES 131
Sosyal bilimler lisesi: 5-year selective high schools for students interested in studying social sciences. Currently, there are 32 such schools in Turkey.Meslek liseleri, Anadolu meslek liseleri: 4-year vocational high schools Teknik liseler, Anadolu teknik liseleri: 4-year technical high schools
• Ages of attendance: 15 through 18 or 19 • Number of years: 4 or 5• Universal enrollment: No • Compulsory: Yes13
• Entrance/exit criteria: All students completing basic education (primary education and lower secondary education) are entitled to a secondary education, and only the following schools have entrance examinations. Science high schools (fen lisesi), high schools for social sciences (sosyal bilimler lisesi), and private high schools (Özel Liseler) are highly selective and accept students through a central entrance examination. Sports high schools (spor lisesi) and fine arts high schools (güzel sanatlar lisesesi) accept students through a talent examination. Upon graduating from high school, students obtain a diploma for 12 years of compulsory education (12 yıllık zorunlu eğitim diplomasi) if they have received a passing grade of 2 or above on a scale of 0 to 5.
NOTE: Apprenticeship training (2 to 4 years) is a dual training system that combines theoretical training (through vocational training centers) and practical training (through the workplace). It covers the education of those who have not been able to con-tinue their education after primary education or who have been left out of formal education for various reasons. Children who are at least primary education graduates and have reached the age of 14 can participate in apprenticeship training. Those who complete apprenticeships follow a process including examin- ationsand required work experience to get the qualifications of foremanship and mastership.
Postsecondary and tertiary:• Common name: Universiteler, meslek yuksek okullari• Ages of attendance: Varies • Number of years: Varies according to degree program• Universal enrollment: No• Entrance criteria: The Student Selection and Placement
Center (ÖSYM) places students into open higher education or 2- or 4-year university programs (or decides that students do not qualify for any placement). Students are selected using
their composite score, which is based on their high school grade point average and their performance on the National University Entrance Examination (ÖSS), which measures verbal and quantitative abilities. The Foreign Language Examination (YDS) is used for selection and placement in higher education programs specializing in foreign languages and literature.
NOTE: The university selection and placement process and the limited supply of university places reveal a highly competitive process in which only a small percentage of candidates are placed in universities, even after repeated attempts. The Higher Education Council (YOK) modifies students’ high school grade point average scores with either a positive or negative weight based on whether they are applying to a field directly related to their track in high school.
Common degree programs:• Önlisans Derecesi or Diplomasi: 2-year associate’s degree.• Lisans Diplomasi: 4-year bachelor’s degree.• Yuksek Lisans Diplomasi: 2-year master’s degree. • Doktora Diplomasi/Bilim Doktorlugu Diplomasi/Tipta
Uzmanlik Belgesi/Sanatta Yeterlik Diplomasi: Typically a 4-year doctoral program, but may be 5 to 6 years for a dentistry, veterinary medicine, or medicine program.
Sources:
Classbase. (2012). Education Database: Education System in Turkey. Retrieved April 2, 2013, from http://www.class base.com/countries/turkey/education-system.
Eurydice. (2013). The Structure of the European Education Systems 2012/13. Diagram of Turkey’s education system (p. 11). Brussels: Author. Retrieved April 1, 2013, from http://eacea.ec.europa.eu/education/eurydice/documents/facts_and_figures/education_structures_EN.pd .
Organization for Economic Cooperation and Development. (2005). Reviews of National Policies for Education: Basic Education in Turkey. Paris: Author. Retrieved April 3, 2015, from http://www.oecd.org/edu/school/39642601.pdf.
Tasar, M.F., Aztekin S., and Arifoglu A. (2012). Turkey. In I. Mullis, M. Martin, C. Minnich, K. Drucker, and M. Ragan (Eds.), PIRLS 2011 Encyclopedia: Education Policy and Curriculum in Reading (vol. 2), pp. 933–944. Chestnut Hill, MA: Lynch School of Education, Boston College, TIMSS & PIRLS International Study Center.
13 Per the country expert, education reforms in Turkey in 2012 extended compulsory education to a duration of 12 years, as shown here and in the accompanying figure A-17. This differs from the 2011 data presented in Indicator 2.

132 APPENDIX A: THE EDUCATION SYSTEMS OF THE G-20 COUNTRIES
The Education System in the United Kingdom: The Education System in England, Northern Ireland, and Wales
Figure A-18-1. Levels of education in England, Northern Ireland, and Wales, by age and year of schooling: 2013
PreprimaryFoundation stage, nursery school, reception class, day nursery
PrimaryKey stages 1 and 2, infant school, junior school
ISCED97 levels 4–6
ISCED97 level 0
ISCED97 level 1
ISCED97 level 2
ISCED97 level 3
Year of schooling2Age1 Levels of education
Lower secondaryKey stage 3, secondary school, post-primary (NI), grammar school
Postsecondary and tertiaryHigher education institution, college, university
Further education (FE) college
Upper secondaryKey stage 4, sixth form, post primary (NI), grammar school
School sixth form, sixth form college
3
78
9
10
1112
13
1415
16
17
1
2
3
4
5
6
7
8
9
10
11
12
6
5
4
18
13
78
9
10
1112
13
1415
6
5
1 In Northern Ireland, compulsory enrollment begins at age 4 and this year is considered as ISCED 1. 2 In Northern Ireland, there are 14 years of schooling, with year 1 beginning at the preprimary level (age 4).NOTE: Education levels are defined according to the 1997 International Standard Classification of Education (ISCED97). Ages represent the typical age at the beginning of the school year. Numbers in bold print indicate ages of universal enrollment (i.e. an enrollment rate of over 90 percent). Numbers highlighted represent the age at which compulsory enrollment begins through the age at which compulsory enrollment ends. No meaning should be inferred from width of subdivisions. Duration of first university degree program is generally 3 years in England, Northern Ireland, and Wales.SOURCE: Miller, D.C. and Warren L.K. (2011). Comparative Indicators of Education in the United States and Other G-8 Countries: 2011 (NCES 2012-007). U.S. Department of Education, National Center for Education Statistics. Washington, DC: U.S. Government Printing Office.
NOTE: There are differences among the education systems of the United Kingdom. Oversight of education in England is the responsibility of the U.K. government and of the devolved administrations in Scotland, Wales, and Northern Ireland. However, the purpose of this document is to present a brief, general summary of education in the United Kingdom. The sources cited at the end of this section provide more specific details about education in the different parts of the United Kingdom.
Preprimary:• Common name: Foundation stage/phase, nursery school/class,
reception class (England and Wales), day nursery• Ages of attendance: as early as age 2 through age 4 (England
and Wales), as early as age 2 through age 3 (Northern Ireland)• Number of years: 1 to 3• Start of universal enrollment: Age 4• Compulsory: No
NOTE: Within the foundation stage/phase, many students in England and Wales attend a “reception class” in primary school. This is comparable to kindergarten in the United States (with academic activities).
Primary: • Common name: Key stages 1 and 2, primary school, infant
school, junior school• Ages of attendance: 5 through 10 (England and Wales), 4
through 10 (Northern Ireland)• Number of years: 6 (England and Wales), 7 (Northern Ireland)• Universal enrollment: Yes• Compulsory: Yes, begins at age 5
NOTE: The primary school years are divided into stages. In England, these are key stage 1 and key stage 2. In Wales, these are the continuation of the foundation phase and key stage 2. In Northern Ireland, these are the foundation stage, key stage 1, and key stage 2.
Lower secondary:• Common name: Key stage 3, secondary school (England and
Wales), post-primary school (Northern Ireland), grammar school (England and Northern Ireland)
• Ages of attendance: 11 through 13• Number of years: 3

APPENDIX A: THE EDUCATION SYSTEMS OF THE G-20 COUNTRIES 133
• Universal enrollment: Yes• Compulsory: Yes• Entrance/exit criteria: No (for England and Wales, except for a
small number of grammar schools in England). Yes (for grammar schools in Northern Ireland).
NOTE: Most secondary schools combine lower and upper secon- dary education, catering to pupils ages 11 to either 15 (graduation at 16) or 17 (graduation at 18).
Upper secondary:• Common name: Key stage 4 (first 2 years), sixth form (fina
2 years), secondary school, post-primary school (Northern Ireland), grammar school (England and Northern Ireland), sixth form college (England, final 2 years only), further educ-ation college (final 2 years only)
• Ages of attendance: 14 through 17 (graduation at age 18)• Number of years: 4• Universal enrollment: Through age 16• Compulsory: Through age 15• Entrance/exit criteria: At the end of the first 2 years of upper
secondary education (key stage 4), students take General Certificates of Secondary Education (GCSEs), a series of single-subject externally certificated qualifications. GCSEs are at level 2 of the national qualifications framework and provide access to level 3 programs, such as the General Certificate of Education (GCE) Advanced levels (A levels) in the final 2 years of upper secondary education (sixth form).
NOTE: For the post-compulsory upper secondary phase, students apply for a specific program at a secondary school, sixth form college, or further education college. Programs that provide access to higher education are at level 3 of the national qualificationsframework and include both academic and vocationally oriented programs. There are also training and apprenticeship programs, which incorporate part-time study at a college or with a training provider. GCE A levels form the biggest group of academic programs. They are single-subject qualifications that may be studied in any combination within the limitations of a school’s or college’s resources. Students typically take three or four subjects in the first year of study to gain the intermediary AS qualification (separately certified) and then continue with three of these subjects to gain full A levels in them after the second year of study. Admission to higher education programs is made on the basis of subjects/grades in A levels (or equivalent qualifications) and subjects/grades at GCSE, together with a personal statement and a confidential reference. Additional admissions tests and interviews are used for a few highly competitive, creative, or care-related course programs, such as teaching and medicine.
Postsecondary and tertiary:• Common name: Higher education institution, college, university • Ages of attendance: Varies• Number of years: Varies according to degree• Universal enrollment: No• Entrance criteria: GCE Advanced levels (A levels) or its equivalent
Common degree programs:• Certificates of higher education, Higher National Certificate:
1-year program, often with a vocational orientation.• Foundation degree, Diploma of Higher Education, Higher
National Diploma: 2-year program, often with a vocational orientation.
• Bachelor’s degree: 3- or 4-year academic programs at colleges or universities: 3-year programs are more common; 4-year programs typically incorporate a placement year. Most programs lead to the award of a degree with honors, graded on a 4-point scale, although “ordinary” degrees (i.e., without honors) also exist. An honors degree is an entrance requirement for most graduate programs.
• Advanced short programs: Short programs up to a year in length, for students who have already acquired a bachelor’s degree. Some are at the same academic level as a bachelor’s degree (e.g., graduate certificates), and some are at the same level as a master’s degree (e.g., postgraduate certificates) Programs lead to a professional qualification (for example, the Postgraduate Certificate of Education/Qualified Teacher Status [PGCE/QTS] is for teachers).
• Master’s degree: 1 year or more beyond an honors bachelor’s degree or a teaching or research postgraduate degree. There are also some 4-year integrated master’s degrees in scientific,engineering, and mathematical subjects that span the bachelor’s and master’s levels.
• Doctorate: Research-oriented postgraduate degree. Minimum of 3 years in duration.
NOTE: Training for some professions consists of an undergraduate program leading to a specialist degree recognized by the relevant professional or statutory body. In the case of medicine, this is a 5-year program that spans bachelor’s and master’s level study, but for historical reasons is titled bachelor’s. This is followed by further professional training, but not necessarily by a further academic degree.
Sources:
Eurydice. (2013). Eurydice Highlights: The Structure of the European Education Systems 2012/13. Brussels: Eurydice. Retrieved March 22, 2013, from http://eacea.ec.europa.eu/education/ eurydice/documents/facts_and_figures/education_ structures_EN.pdf.
Marlow-Ferguson, R. (Ed.) (2002). World Education Encyclopedia: A Survey of Educational Systems Worldwide, Vol. 1 (2nd ed.). Farmington Hills, MI: Gale Group.
Organization for Economic Cooperation and Development. (1996). Education at a Glance 1996: OECD Indicators. Paris: Author.
Robitaille, D.F. (1997). National Contexts for Mathematics and Science Education: An Encyclopedia of the Education Systems Participating in TIMSS. Vancouver, Canada: PacificEducational Press.

134 APPENDIX A: THE EDUCATION SYSTEMS OF THE G-20 COUNTRIES
The Education System in the United Kingdom: The Education System in Scotland
Figure A-18-2. Levels of education in Scotland, by age and year of schooling: 2013
PreprimaryNursery school/class, day nurseries
PrimaryP1 to P7, primary school
ISCED97 levels 4–6
ISCED97 level 0
ISCED97 level 1
ISCED97 level 2
ISCED97 level 3
Year of schoolingAge Levels of education
Lower secondaryS1 to S2, secondary school
Postsecondary and tertiaryHigher education institution, college, university
Upper secondaryS3 to S6, secondary school, further education college
3
78
9
10
1112
13
1415
16
17
1
2
3
4
5
6
7
8
9
10
11
12
6
5
4
18
13
78
9
10
1112
13
1415
6
5
NOTE: Education levels are defined according to the 1997 International Standard Classification of Education (ISCED97). Ages represent the typical age at the beginning of the school year. Numbers in bold print indicate ages of universal enrollment (i.e., an enrollment rate of over 90 percent). Numbers highlighted represent the age at which compulsory enrollment begins through the age at which compulsory enrollment ends. No meaning should be inferred from width of subdivisions. Duration of first university degree program is generally 3 or 4 years in Scotland.SOURCE: Miller, D.C. and Warren L.K. (2011). Comparative Indicators of Education in the United States and Other G-8 Countries: 2011 (NCES 2012-007). U.S. Department of Education, National Center for Education Statistics. Washington, DC: U.S. Government Printing Office.
NOTE: The education system in Scotland is historically separate from the systems in the rest of the United Kingdom. Since devolution in 1999, the education system is the responsibility of the Scottish government.
Preprimary:• Common name: Nursery school/class, day nursery• Ages of attendance: As early as age 3 through age 4• Number of years: 1 to 2• Start of universal enrollment: Age 4• Compulsory: No
Primary: • Common name: P1 to P7, Primary school• Ages of attendance: 5 through 11• Number of years: 7• Universal enrollment: Yes• Compulsory: Yes, begins at age 5
Lower secondary:• Common name: S1 to S2, Secondary school• Ages of attendance: 12 to 13
• Number of years: 2 • Universal enrollment: Yes• Compulsory: Yes• Entrance/exit criteria: No
Upper secondary:• Common name: S3 to S6, Secondary school, Further education
college • Ages of attendance: 14 to 17 (graduation at age 18)• Number of years: 4 • Universal enrollment: Through age 16• Compulsory: Through age 15• Entrance/exit criteria: After 2 years, at the end of S4, students
take Standard Grades, a series of single-subject externally certificated qualifications. These are at level 5 of the Scottish credit and qualifications framework and provide access to level 6 programs, such as “Highers.”
NOTE: For the post-compulsory upper secondary phase, students apply for a specific program at a school or college. Programs that provide access to tertiary programs are at levels 6 and 7 of the Scottish credit and qualifications framework. There are also nationally supported training and apprenticeship programs,

APPENDIX A: THE EDUCATION SYSTEMS OF THE G-20 COUNTRIES 135
which incorporate part-time study at a college or with a training provider. Highers are usually taken in S5, the penultimate year of school or college. They are single-subject qualifications at level 6 of the Scottish credit and qualifications framework that can be studied in any combination within the limits of the school’s or college’s resources or combined with qualifications at a lower or higher level. It is possible for students to enter university directly from S5 if they have already achieved sufficient success in their Highers; however, most choose to continue at school or college for another year (i.e., in S6). Advanced Highers, which are taken at the end of S6, extend the skills and knowledge gained at the Higher level and are additional qualifications useful for entry into higher education or the workplace. Admission to tertiary programs is made on the basis of subjects/grades at Higher/Advanced Higher (or the equivalent) and subjects/grades at Standard Grade, together with a personal statement and a confidential reference. Additional admissions tests and interviews are used for a few highly competitive, creative, or care-related programs, such as teaching and medicine. A new curriculum for ages 3 to 17 began to be implemented in 2010/11. The Curriculum for Excellence extends the broad general education phase to the end of S3, before learners move on to take qualification programs in S4 to S6. New qualifications to support the Curriculum for Excellence started to replace existing qualifications in August 2 13.
Postsecondary and tertiary:• Common name: Higher education institution, college, university • Ages of attendance: Varies• Number of years: Varies according to course/degree• Universal enrollment: No• Entrance criteria: Awards in Higher or Advanced Higher level
examinations set by the Scottish Qualifications Authority or its equivalent.
Common degree programs:• Certificates of higher education, Higher National Certificate:
1-year program, often with a vocational orientation.• Foundation degree, Diploma of Higher Education, Higher
National Diploma: 2-year program, often with a vocational orientation.
• Bachelor’s degree: 3- or 4-year academic programs at colleges or universities: 3-year programs are more common; 4-year programs typically incorporate a placement year. Most programs lead to the award of a degree with honors, graded on a 4-point scale, although “ordinary” degrees (i.e., without honors) also exist. An honors degree is an entrance requirement for most graduate programs.
• Advanced short programs: Short programs up to a year in length, for students who have already acquired a bachelor’s degree. Some are at the same academic level as a bachelor’s degree (e.g., graduate certificates), and some are at the same level as a master’s degree (e.g., postgraduate certificates) Programs lead to a professional qualification (for example, the PGCE/QTS is for teachers).
• Master’s degree: 1 year or more beyond an honors bach-elor’s degree or a teaching or research postgraduate degree. There are also some 4-year integrated master’s degrees in scientific, engineering, and mathematical subjects that span the bachelor’s and master’s levels.
• Doctorate: Research-oriented postgraduate degree. Minimum of 3 years in duration.
NOTE: Training for some professions consists of an under- graduate program leading to a specialist degree recognized by the relevant professional or statutory body. In the case of medicine, this is a 6-year program that spans the bachelor’s and master’s level study, but for historical reasons retains the title of Bachelor of Medicine and Bachelor of Surgery. This is followed by further professional training, but not necessarily by a further academic degree.
Sources:
Eurydice. (2007). Focus on the Structure of Higher Education in Europe 2006/07: National Trends in the Bologna Process. Brussels: Eurydice. Retrieved March 25, 2013, from http://eacea.ec.europa.eu/education/eurydice/documents/thematic_reports/086en.pdf.
Eurydice. (2013). Eurydice Highlights: The Structure of the European Education Systems 2012/13. Brussels: Eurydice. Retrieved March 22, 2013, from http://eacea.ec.europa.eu/education/eurydice/documents/facts_and_figures/education_stru -tures_EN.pdf.
Marlow-Ferguson, R. (Ed.). (2002). World Education Encyclopedia: A Survey of Educational Systems Worldwide, Vol. 3 (2nd ed.). Farmington Hills, MI: Gale Group.
Organization for Economic Cooperation and Development. (1996). Education at a Glance 1996: OECD Indicators. Paris: Author.
Robitaille, D.F. (1997). National Contexts for Mathematics and Science Education: An Encyclopedia of the Education Systems Participating in TIMSS. Vancouver, Canada: PacificEducational Press.

136 APPENDIX A: THE EDUCATION SYSTEMS OF THE G-20 COUNTRIES
The Education System in the United States
Figure A-19. Levels of education in the United States, by age and year of schooling: 2013
PreprimaryNursery school, prekindergarten, kindergarten
PrimaryElementary school, grade school
ISCED97 levels 4–6
ISCED97 level 0
ISCED97 level 1
ISCED97 level 2
ISCED97 level 3
Year of schoolingAge Levels of education
Lower secondaryMiddle school, junior high school
Postsecondary and tertiaryCommunity college, college, university
Upper secondaryHigh school, senior high school
3
78
9
10
1112
13
1415
16
17
1
2
3
4
5
6
7
8
9
10
11
12
6
5
4
18
78
9
10
1112
13
1415
16
6
NOTE: Education levels are defined according to the 1997 International Standard Classification of Education (ISCED97). Ages represent the typical age at the beginning of the school year. Numbers in bold print indicate ages of universal enrollment (i.e., an enrollment rate of over 90 percent). Numbers highlighted represent the age at which compulsory enrollment begins through the age at which compulsory enrollment ends. No meaning should be inferred from width of subdivisions. Duration of first university degree program is generally 4 years in the United States.SOURCE: Miller, D.C. and Warren L.K. (2011). Comparative Indicators of Education in the United States and Other G-8 Countries: 2011 (NCES 2012-007). U.S. Department of Education, National Center for Education Statistics. Washington, DC: U.S. Government Printing Office.
NOTE: There are differences within the education system of the United States because responsibilities and oversight for education take place at the regional or local level. However, the purpose of this document is to present a brief, general summary of education in the United States. The sources cited at the end of this section provide more specific details
Preprimary:• Common name: Nursery school, prekindergarten, kindergarten • Ages of attendance: As early as age 3 through age 5• Number of years: 1 to 3• Start of universal enrollment: Does not begin in preprimary;
see below • Compulsory: Generally no, but yes in some states
Primary: • Common name: Elementary school, grade school• Ages of attendance: 6 through 11• Number of years: 6• Start of universal enrollment: Age 6• Compulsory: Yes, generally begins at 6
NOTE: Based on the ISCED97, the first 6 years of schooling are classified as primary in the United States. Students may
attend 5- or 6-year elementary schools. Some students also attend elementary schools that include eight grades.
Lower secondary:• Common name: Middle school, junior high school • Ages of attendance: 12 through 14• Number of years: 3• Universal enrollment: Yes • Compulsory: Yes• Entrance/exit criteria: No
NOTE: Based on the ISCED97, the 3 years of schooling following primary school are classified as lower secondary in the United States. Students may attend 2- or 3-year junior high schools or middle schools. Some students also attend combined junior- senior high schools or schools that also include the first 5 years of primary school (K–8 schools).
Upper secondary:• Common name: High school, senior high school• Ages of attendance: 15 through 17 (graduation generally in
the year of the student’s 18th birthday, though this can vary depending on a student’s birth date and the state’s kinder- garten cut-off date)

APPENDIX A: THE EDUCATION SYSTEMS OF THE G-20 COUNTRIES 137
• Number of years: 3• Universal enrollment: Through age 16 (most students turn 18
during the last year of upper secondary school) • Compulsory: The average ending age of compulsory education
in the United States is 17 (i.e., through age 16). This age varies across states, ranging from 16 to 18.
• Entrance/exit criteria: There are not generally entrance exams, although some states have begun instituting exit examinations that are required to receive a diploma. College-bound students usually take the Scholastic Aptitude Test (SAT) or ACT Assessment (ACT), privately administered standardized tests that partly determine college admittance. Admittance is also affected by previous grades, coursework, and other factors, such as teacher recommendations and extracurricular participation.
NOTE: Based on the ISCED97, the last 3 years of schooling prior to receiving a high school diploma are classified as upper secondary in the United States. Senior high schools may be 3 or 4 years in length. Some students attend combined junior-senior high schools.
Postsecondary and tertiary:• Common name: Community college, college, university• Ages of attendance: Varies• Number of years: Varies according to degree• Universal enrollment: No• Entrance criteria: Varies according to degree. Students in
the United States usually take the SAT or ACT (see above) as part of the entrance requirements for higher education. Most colleges and universities set their own admissions standards, so the requirements vary substantially from institution to institution.
Common degree programs:• Certificate programs: Vocational programs of 6 months to
1 year offered in public community colleges and private for-profit trade schools
• Associate’s degrees: 2-year programs offered in fields of study that prepare students for the labor force or entry into a 4-year college or university. Granted at vocational and technical institutes as well as community colleges.
• Bachelor’s degrees: 4-year academic programs at a college or university that prepare students for the labor force or graduate study.
• Master’s degrees: Graduate program at a university that requires 2 years of study beyond the bachelor’s degree and leads to a master’s degree.
• Professional degrees: Graduate programs such as medicine or law taken at a university medical or law school. Typically require 3 or more years beyond the bachelor’s degree and result in specialized degrees such as the Medical Doctorate (M.D.) or Juris Doctor (J.D.).
• Doctorate: Academic graduate program at a university typically requiring a minimum of 3 or 4 years of study and research beyond the bachelor’s degree.
Sources:
Marlow-Ferguson, R. (Ed.). (2002). World Education Encyclopedia: A Survey of Educational Systems Worldwide, Vol. 1 (2nd ed.). Farmington Hills, MI: Gale Group.
Miller, D.C., Sen, A., Malley, L.B., and Burns, S.D. (2009). Compara-tive Indicators of Education in the United States and Other G-8 Countries: 2009 (NCES 2009-039). U.S. Department of Education, National Center for Education Statistics. Washington, DC: U.S. Government Printing Office.
Organization for Economic Cooperation and Development. (1996). Education at a Glance 1996: OECD Indicators. Paris: Author.
Robitaille, D.F. (1997). National Contexts for Mathematics and Science Education: An Encyclopedia of the Education Systems Participating in TIMSS. Vancouver, Canada: PacificEducational Press.
Sherman, J.D., Honneger, S.D., and McGivern, J.L. (2003). Compara-tive Indicators of Education in the United States and Other G8 Countries: 2002 (NCES 2003-026). National Center for Education Statistics, Institute of Education Sciences, U.S. Department of Education. Washington, DC.
Snyder, T.D. (2011). Mini-Digest of Education Statistics, 2010 (NCES 2011-016). National Center for Education Statistics, Institute of Education Sciences, U.S. Department of Educa-tion. Washington, DC.
U.S. Department of Education. (2005). Education in the United States: A Brief Overview. Washington, DC: U.S. Department of Education. Retrieved March 26, 2013, from http://www2.ed.gov/about/offi es/list/ous/international/edus/index.html.